

Submitted:
27 October 2026
Posted:
28 October 2026
You are already at the latest version
Abstract
Objectives: Tuberculosis (TB) in children is preventable and curable yet weakly diagnosed, notified, and monitored only to age 14 years. We analyzed the 0–19-year TB burden in the Global Burden of Disease Study (GBD) 2023. Methods: We aggregated deaths and incident cases (95% uncertainty intervals [UIs]), 1990–2023, for four age bands across 204 countries, 21 regions and five Socio-demographic Index (SDI) quintiles; computed trends, pandemic-window changes with Monte Carlo–propagated uncertainty, and fixed-2021 SDI gradients, benchmarking against WHO estimates and End TB 2025 milestones. Results: In 2023, TB caused 87,764 deaths (95% UI 65,765–109,764) at ages 0–19 years—about 240 daily—and 1,665,272 incident cases; deaths fell 65.5% since 1990. Low- plus low-middle-SDI countries carried 90.3% of deaths across a 531-fold mortality gradient. GBD 0–14-year mortality was 39.9% of the like-for-like WHO estimate (66,146 vs 166,000); incidence agreed closely (80.8%). Deaths fell 23.9% over 2015–2023 against the 75% milestone. Adolescents aged 15–19 years improved slowest. Conclusions: Measurement systems disagree 2.5-fold on pediatric TB deaths, milestones are off track three-fold, and the burden concentrates where monitoring is weakest. Reconciling estimation, extending monitoring to ages 15–19 years, and concentrating resources on high-burden countries are prerequisites for ending TB in children.
Keywords:
tuberculosis
; child
; adolescent
; global burden of disease
; mortality
; End TB Strategy
1. Introduction
1.1. Background and Motivation
1.1.1. A Preventable and Curable Disease That Still Kills About 240 Children Every Day
Tuberculosis (TB) is again the world’s leading cause of death from a single infectious agent, killing an estimated 1.25 million people in 2023 [1]. Its youngest victims are also its least visible: children with TB typically have paucibacillary disease, cannot produce sputum for microbiological confirmation, and are diagnosed clinically if at all [2,3]. Our aggregation of Global Burden of Disease (GBD) Study 2023 estimates indicates that TB caused approximately 87,764 deaths at ages 0–19 years in 2023—about 240 deaths every day—alongside roughly 1.67 million incident cases [4,5]; an estimated 96% of children who die of TB never accessed treatment [6].
1.1.2. An Ambitious Policy Architecture with a Narrow Pediatric Window
The WHO End TB Strategy set 2025 milestones of a 75% reduction in TB deaths and a 50% reduction in the TB incidence rate relative to 2015 [7,8]; Sustainable Development Goal target 3.3 embeds the same endpoint [9]. United Nations High-Level Meetings, the WHO Roadmap towards ending TB in children and adolescents [10,11], and WHO’s 2022 guidelines (a four-month regimen for non-severe pediatric disease [12]) added child-specific commitments. Yet monitoring remains anchored to a single 0–14-year aggregate: adolescents aged 15–19 years, frequently presenting with adult-type disease [13,14], are rarely reported as a distinct segment [15].
1.1.3. Two Estimation Systems, a 2.5-Fold Disagreement on Child Deaths
How many children die of TB depends on which estimation system is asked. WHO’s pediatric estimates combine notification data with case-detection adjustments and dynamic modeling [1,16,17]; for 2023, WHO estimated 191,000 TB deaths at ages 0–14 years (166,000 HIV-negative; 25,000 HIV-positive) [1]. The GBD instead models TB mortality with its Cause of Death Ensemble model (CODEm) on vital-registration and verbal-autopsy data [4]; our aggregation of GBD 2023 yields 66,146 deaths at ages 0–14 years—about 40% of the like-for-like WHO figure. This roughly 2.5-fold divergence sets the denominator for End TB accountability in children.
1.2. Research Gap
1.2.1. What Existing Analyses Do Not Provide
The GBD 2021 tuberculosis capstone reports progress toward the 2020 milestones, but its pediatric reporting is embedded in broad age bands [18]; the official GBD 2023 capstone, published online on 1 July 2026, reports the round’s all-age burden stratified by HIV status and drug resistance [19]. A dedicated pediatric account of GBD 2023 remains absent: the two existing pediatric secondary analyses use the superseded GBD 2021 round and terminate in 2021 [20,21], and neither evaluated the pandemic window, reconciled GBD estimates with WHO’s, or tracked the End TB 2025 milestones.
1.3. Objectives and Contributions
This study provides comprehensive estimates of the TB burden at ages 0–19 years from 1990 to 2023, computed from raw GBD 2023 Results Tool downloads [5] within the GBD 2023 analytical framework [4]. Four contributions follow. First, to our knowledge this is the first dedicated 0–19-year pediatric secondary analysis of GBD 2023—complementing the round’s official all-age capstone [19]—disaggregated into four pediatric age bands across 204 countries and territories, 21 GBD regions, and five Socio-demographic Index (SDI) quintiles. Second, we quantify the extreme concentration of the residual burden—nine in ten deaths in low- and low-middle-SDI countries, a 531-fold mortality-rate gradient, and ten countries carrying 58.5% of global deaths—and decompose the gradient into its incidence and case-fatality components. Third, we provide a systematic GBD–WHO reconciliation for the pediatric segment and track the 2015–2023 trajectory against the End TB 2025 milestones. Fourth, we identify the populations progress has left behind and document a methodological contrast: the GBD pediatric series shows no pandemic-era rebound of the kind reported in WHO’s all-age estimates.
2. Methods
2.1. Study Design and Data Sources
2.1.1. GBD 2023 Analytical Framework
This study is a secondary analysis of the Global Burden of Disease (GBD) Study 2023 (Institute for Health Metrics and Evaluation) [4], covering 204 countries and territories, 21 GBD regions and five Socio-demographic Index (SDI) quintiles. Causes of death are modeled with the Cause of Death Ensemble model (CODEm), with garbage codes redistributed [4,22]; 95% uncertainty intervals (UIs) are the 2.5th and 97.5th posterior-draw percentiles [4].
2.1.2. Direct Download and Author Aggregation
All pediatric estimates were derived from raw GBD Results Tool downloads [5] (reproducible queries: deaths and incidence, numbers and rates with 95% UIs, official <5-year aggregate plus 5–9-, 10–14- and 15–19-year groups, both sexes, 1990–2023); complementary extractions covered the 20–24-year band, 204-country deaths and incidence, and sex-stratified deaths. No estimate was transcribed from any previously published article.
2.1.3. Age-Band Definition and Population Denominators
The 0–19-year total sums the official GBD aggregate “<5 years” plus the 5–9-, 10–14- and 15–19-year groups; the 0–14-year total is used only for the WHO comparison (published for ages 0–14 years). Age-band populations were back-calculated from the published number and rate rows; the 2023 global 0–19-year population thus derived (2,670,651,217) was internally cross-checked. Aggregate crude rates equal Σ(number) ÷ Σ(population); rate UIs omit denominator uncertainty.
2.1.4. Comparison with Previous GBD Rounds
2.2. Case Definition
Tuberculosis was defined per the GBD cause hierarchy (ICD-9/ICD-10-mapped; drug-susceptible and drug-resistant forms) [4,18], restricted to HIV-negative individuals: TB deaths among people living with HIV are assigned to HIV/AIDS causes (cause IDs 948–950) [4,23]. WHO estimates that about 25,000 (14%) of the 191,000 TB deaths at ages 0–14 years in 2023 occurred in HIV-positive children [1]; the present analysis therefore systematically underestimates total pediatric TB mortality—by approximately one seventh on the WHO definition.
2.3. Metrics, Stratification, and Rate Definitions
Two measures are reported—deaths and incident cases—each as a number and a crude rate per 100,000 with 95% UIs, stratified by the four pediatric age bands, sex (global deaths only), SDI quintile, the 21 GBD regions, and 204 countries and territories. A deaths-to-incidence ratio serves as a case-fatality proxy.
2.4. Temporal Trend Analysis
2.4.1. Estimated Annual Percentage Change, 1990–2023
Long-term trends were quantified using the estimated annual percentage change (EAPC) from a log-linear ordinary least-squares regression of the rate on calendar year [24]; primary 95% confidence intervals (CIs) come from the slope’s standard error (t distribution; regression precision only; a Monte Carlo variant is archived in Supplementary Table S2). An EAPC is significant only when its 95% CI excludes zero.
2.4.2. The 2019–2023 Pandemic Window
The pandemic-era window was analyzed descriptively as net changes over two intervals (2019→2021 and 2019→2023) with Monte Carlo–propagated UIs; because these generally include zero, patterns are interpreted as directional only.
2.4.3. Uncertainty Propagation and Aggregation
UIs for percentage changes were propagated by Monte Carlo simulation (20,000 draws), modeling each published value as truncated-normal with standard deviation (upper − lower)/3.92; ratio UIs are Monte Carlo medians with 2.5th/97.5th percentiles, and the independence assumption renders them conservative. Sums across age bands and countries were approximated by root-sum-of-squares pooling of UI half-widths and are somewhat narrower than an official joint-distribution aggregation. Monte Carlo UIs for compositional shares are wide (2023 under-5 share of deaths: median 55.5%, 95% UI 30.2–86.0); shares are therefore reported as point values with qualitative language. All reported change and ratio values are means of the propagated Monte Carlo distributions; because the mean of a ratio or percentage-change distribution differs from the ratio of point estimates, endpoint ratios recomputed from rounded point estimates can differ from the reported Monte Carlo means by a Jensen-effect bias of at most about 2–4 percentage points.
2.5. SDI Mapping and External Benchmarks
2.5.1. Fixed-2021 SDI Quintile Mapping
SDI aggregates were computed as country sums under a fixed SDI-quintile mapping based on the official GBD 2021 quintile table; for 22 large countries with subnational splits, quintiles were completed using the empirical thresholds on flagged national rows (Supplementary Table S7). These are not the official, dynamically regrouped GBD SDI aggregates; SDI-level incidence EAPCs (eleven key years) are approximate.
2.5.2. WHO Cross-Check
Author-aggregated GBD estimates at ages 0–14 years were compared with WHO Global Tuberculosis Report pediatric estimates for 2023 [1] and 2022 [17,25]; WHO all-age estimates for 2019–2023 [1] serve as the comparator for the pandemic-window contrast (Section 4.5). No WHO number is mixed into any GBD estimate.
2.5.3. End TB Strategy Milestone Tracking and Burden-in-Context Anchor
Progress against the End TB Strategy 2025 milestones (75% reduction in TB deaths; 50% reduction in the incidence rate versus 2015) [7,8] was assessed as the 2015→2023 percentage change at ages 0–19 years. Same-round GBD 2023 deaths from lower respiratory infections (LRI) at ages 0–19 years (711,713 in 2023) served as a relative-scale anchor.
2.6. Ecological Covariate Analyses
An author-compiled country covariate table (215 countries; gross domestic product [GDP] per capita, Gini index, World Bank income classification, climatic indicators; Supplementary Data S1) was extended with the universal health coverage (UHC) service coverage index (Sustainable Development Goal indicator 3.8.1; 2021 or 2019; 192 of 215 countries) [26,27]. The national case-fatality proxy was analyzed for the 93 countries with at least 500 incident cases (99.8% of country-level deaths): Spearman correlation against log GDP per capita, multivariable regression of the log proxy on log GDP per capita with the Gini and UHC indices in levels, and a best-quartile counterfactual bounding avertable deaths. An a priori subset of 66 island and compact coastal nations related the 2023 outcomes to 15 covariates by Spearman and partial correlations controlling log GDP per capita, with Benjamini–Hochberg adjustment. All Section 2.6 analyses are ecological and hypothesis-generating.
2.7. Statistical Analysis, Ethics, and Reporting
Aggregation and all derived quantities were computed in Python 3.11; no new GBD model runs were performed. This secondary analysis of publicly available, de-identified, aggregate data was exempt from institutional review board approval. Reporting follows the Guidelines for Accurate and Transparent Health Estimates Reporting (GATHER) [28]. Raw and author-aggregated CSV files are provided as Supplementary Data S1.
3. Results
3.1. Global Burden at Ages 0–19 Years in 2023 and Long-Term Change (Table 1; Figure 1)
In 2023, tuberculosis (TB) caused an estimated 87,764 deaths (95% uncertainty interval [UI] 65,765–109,764) among children and adolescents aged 0–19 years worldwide, at a crude rate of 3.29 per 100,000 (2.46–4.11)—equivalent to about 240 deaths every day (Table 1). Incident cases numbered 1,665,272 (1,334,817–1,995,728), at a crude incidence rate of 62.35 per 100,000 (49.98–74.73).
Figure 1.
Global burden of tuberculosis in children and adolescents aged 0–19 years, 1990–2023 (GBD 2023; HIV-negative tuberculosis). (a) Global deaths (number, left axis; crude rate per 100,000, right axis), 1990–2023; shaded band is the 95% uncertainty interval (UI). (b) Global incident cases (number, left axis; crude incidence rate per 100,000, right axis), 1990–2023, with 95% UI. (c) Deaths-to-incidence ratio (case-fatality proxy), 1990–2023 (9.0% in 1990; 5.3% in 2023). (d) Deaths indexed to 2019 (=100), 2015–2023; the shaded window marks 2020–2021 (between the 2020 and 2021 annual points). Data: GBD 2023 Results (IHME). Notes. Ages 0–19 are defined as the official GBD under-5 aggregate plus the 5–9-, 10–14- and 15–19-year groups. Aggregate 95% UIs combine subgroup uncertainty half-widths by root-sum-of-squares under an independence approximation and are therefore narrower than a joint-draw synthesis. The series declines monotonically through the 2019–2023 pandemic window; see Section 4.5 for the methodological interpretation of the absent rebound.
Figure 1.
Global burden of tuberculosis in children and adolescents aged 0–19 years, 1990–2023 (GBD 2023; HIV-negative tuberculosis). (a) Global deaths (number, left axis; crude rate per 100,000, right axis), 1990–2023; shaded band is the 95% uncertainty interval (UI). (b) Global incident cases (number, left axis; crude incidence rate per 100,000, right axis), 1990–2023, with 95% UI. (c) Deaths-to-incidence ratio (case-fatality proxy), 1990–2023 (9.0% in 1990; 5.3% in 2023). (d) Deaths indexed to 2019 (=100), 2015–2023; the shaded window marks 2020–2021 (between the 2020 and 2021 annual points). Data: GBD 2023 Results (IHME). Notes. Ages 0–19 are defined as the official GBD under-5 aggregate plus the 5–9-, 10–14- and 15–19-year groups. Aggregate 95% UIs combine subgroup uncertainty half-widths by root-sum-of-squares under an independence approximation and are therefore narrower than a joint-draw synthesis. The series declines monotonically through the 2019–2023 pandemic window; see Section 4.5 for the methodological interpretation of the absent rebound.
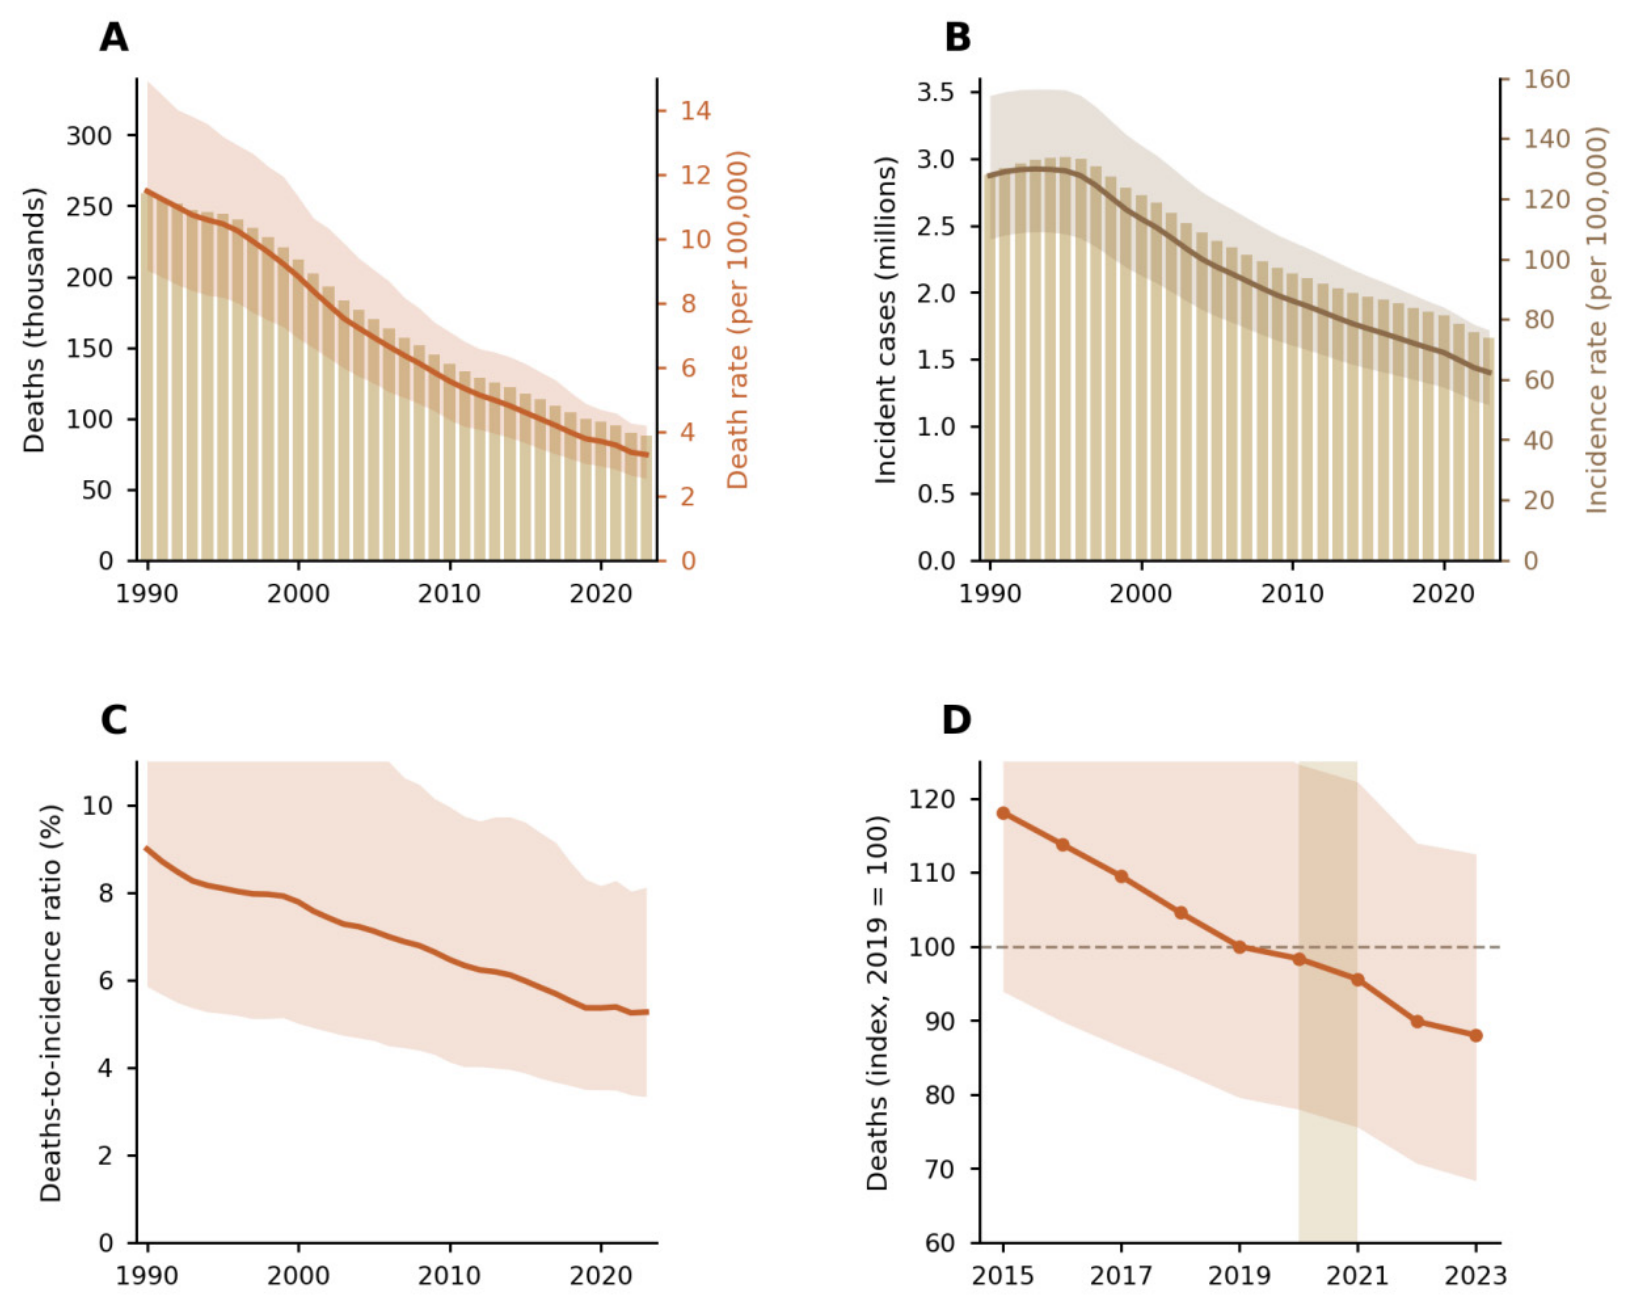

Table 1.
Global tuberculosis burden at ages 0–19 years in 1990, 2015, 2019 and 2023: deaths and incident cases, numbers and crude rates per 100,000 with 95% uncertainty intervals.
Table 1.
Global tuberculosis burden at ages 0–19 years in 1990, 2015, 2019 and 2023: deaths and incident cases, numbers and crude rates per 100,000 with 95% uncertainty intervals.
| Year | Deaths, n (95% UI) | Crude death rate per 100,000 (95% UI) | Incident cases, n (95% UI) | Crude incidence rate per 100,000 (95% UI) |
|---|---|---|---|---|
| 1990 | 259,063 (192,673–325,453) | 11.49 (8.55–14.43) | 2,879,768 (2,342,781–3,416,755) | 127.72 (103.90–151.53) |
| 2015 | 117,762 (86,218–149,306) | 4.60 (3.37–5.83) | 1,968,427 (1,576,324–2,360,530) | 76.89 (61.57–92.20) |
| 2019 | 99,704 (75,060–124,347) | 3.78 (2.85–4.72) | 1,857,695 (1,498,914–2,216,476) | 70.45 (56.85–84.06) |
| 2023 | 87,764 (65,765–109,764) | 3.29 (2.46–4.11) | 1,665,272 (1,334,817–1,995,728) | 62.35 (49.98–74.73) |
Note: values are author aggregations of unmodified GBD 2023 Results Tool extractions; aggregate 95% uncertainty intervals (UIs) pool age-band half-widths by root-sum-of-squares under an independence assumption and are slightly narrower than official joint-distribution intervals; crude rates use populations back-calculated from the published number and rate rows, and rate UIs omit denominator uncertainty. The GBD tuberculosis cause excludes HIV-associated TB. The full annual series (1990–2023, including all interim years) is given in Supplementary Table S1. Source: recomputed from raw/tb_reg_p1–p3 in Supplementary Data S1 with code/tb_compute.py; archived key-year values (derived/T1_global_0-19_keyyears.csv) match this table exactly.
Between 1990 and 2023, deaths fell by 65.5% (95% UI −76.4 to −50.8) and incident cases by 41.6% (−56.1 to −24.1) (Table 1); the case-fatality proxy fell from 9.0% in 1990 to 5.3% in 2023, with the crude mortality rate declining by 3.96% per year (EAPC −3.96, 95% CI −4.07 to −3.85) and the incidence rate by 2.37% per year (−2.47 to −2.28).
3.2. The Development Gradient: Extreme Concentration of the Residual Burden (Figure 2)
The 2023 burden was steeply patterned by socio-demographic development: low- plus low-middle-SDI countries carried 79,246 deaths—90.3% of the global total (low-SDI alone 51.0%)—across an approximately 531-fold mortality-rate ratio between the low- and high-SDI quintiles (10.42 versus 0.0196 per 100,000) (Supplementary Table S7).
Improvement since 1990 occurred in every quintile but was slowest where the burden is highest (mortality-rate EAPCs −4.04 in low-SDI versus −10.46 in high-middle-SDI countries; Figure 2C; Supplementary Table S2). The middle-SDI quintile showed the slowest incidence decline (−0.96), a large-country composition effect (Section 2.5.1).
3.3. Regional Patterns and EAPCs (Figure 2)
Mortality was geographically concentrated in 2023: Western Sub-Saharan Africa carried the largest share of deaths (27,100; 30.9%), followed by Eastern Sub-Saharan Africa (21,302; 24.3%) and South Asia (14,946; 17.0%)—together 72.2% of all 0–19-year TB deaths. The highest regional crude mortality rates occurred in Central (12.04 per 100,000) and Southern (10.79) Sub-Saharan Africa.
Mortality rates declined significantly in all 22 study locations between 1990 and 2023 (Figure 2a), fastest in High-income Asia Pacific (EAPC −10.87) and East Asia (−9.89) and slowest in Southern Sub-Saharan Africa (−1.22, −1.80 to −0.64). Southern Sub-Saharan Africa was also the only region with a significantly rising incidence rate (EAPC +0.45, 95% CI +0.04 to +0.86), a pattern driven by South Africa (Figure 2b).
3.4. Age Composition and Sex Differences (Figure 3a–c)
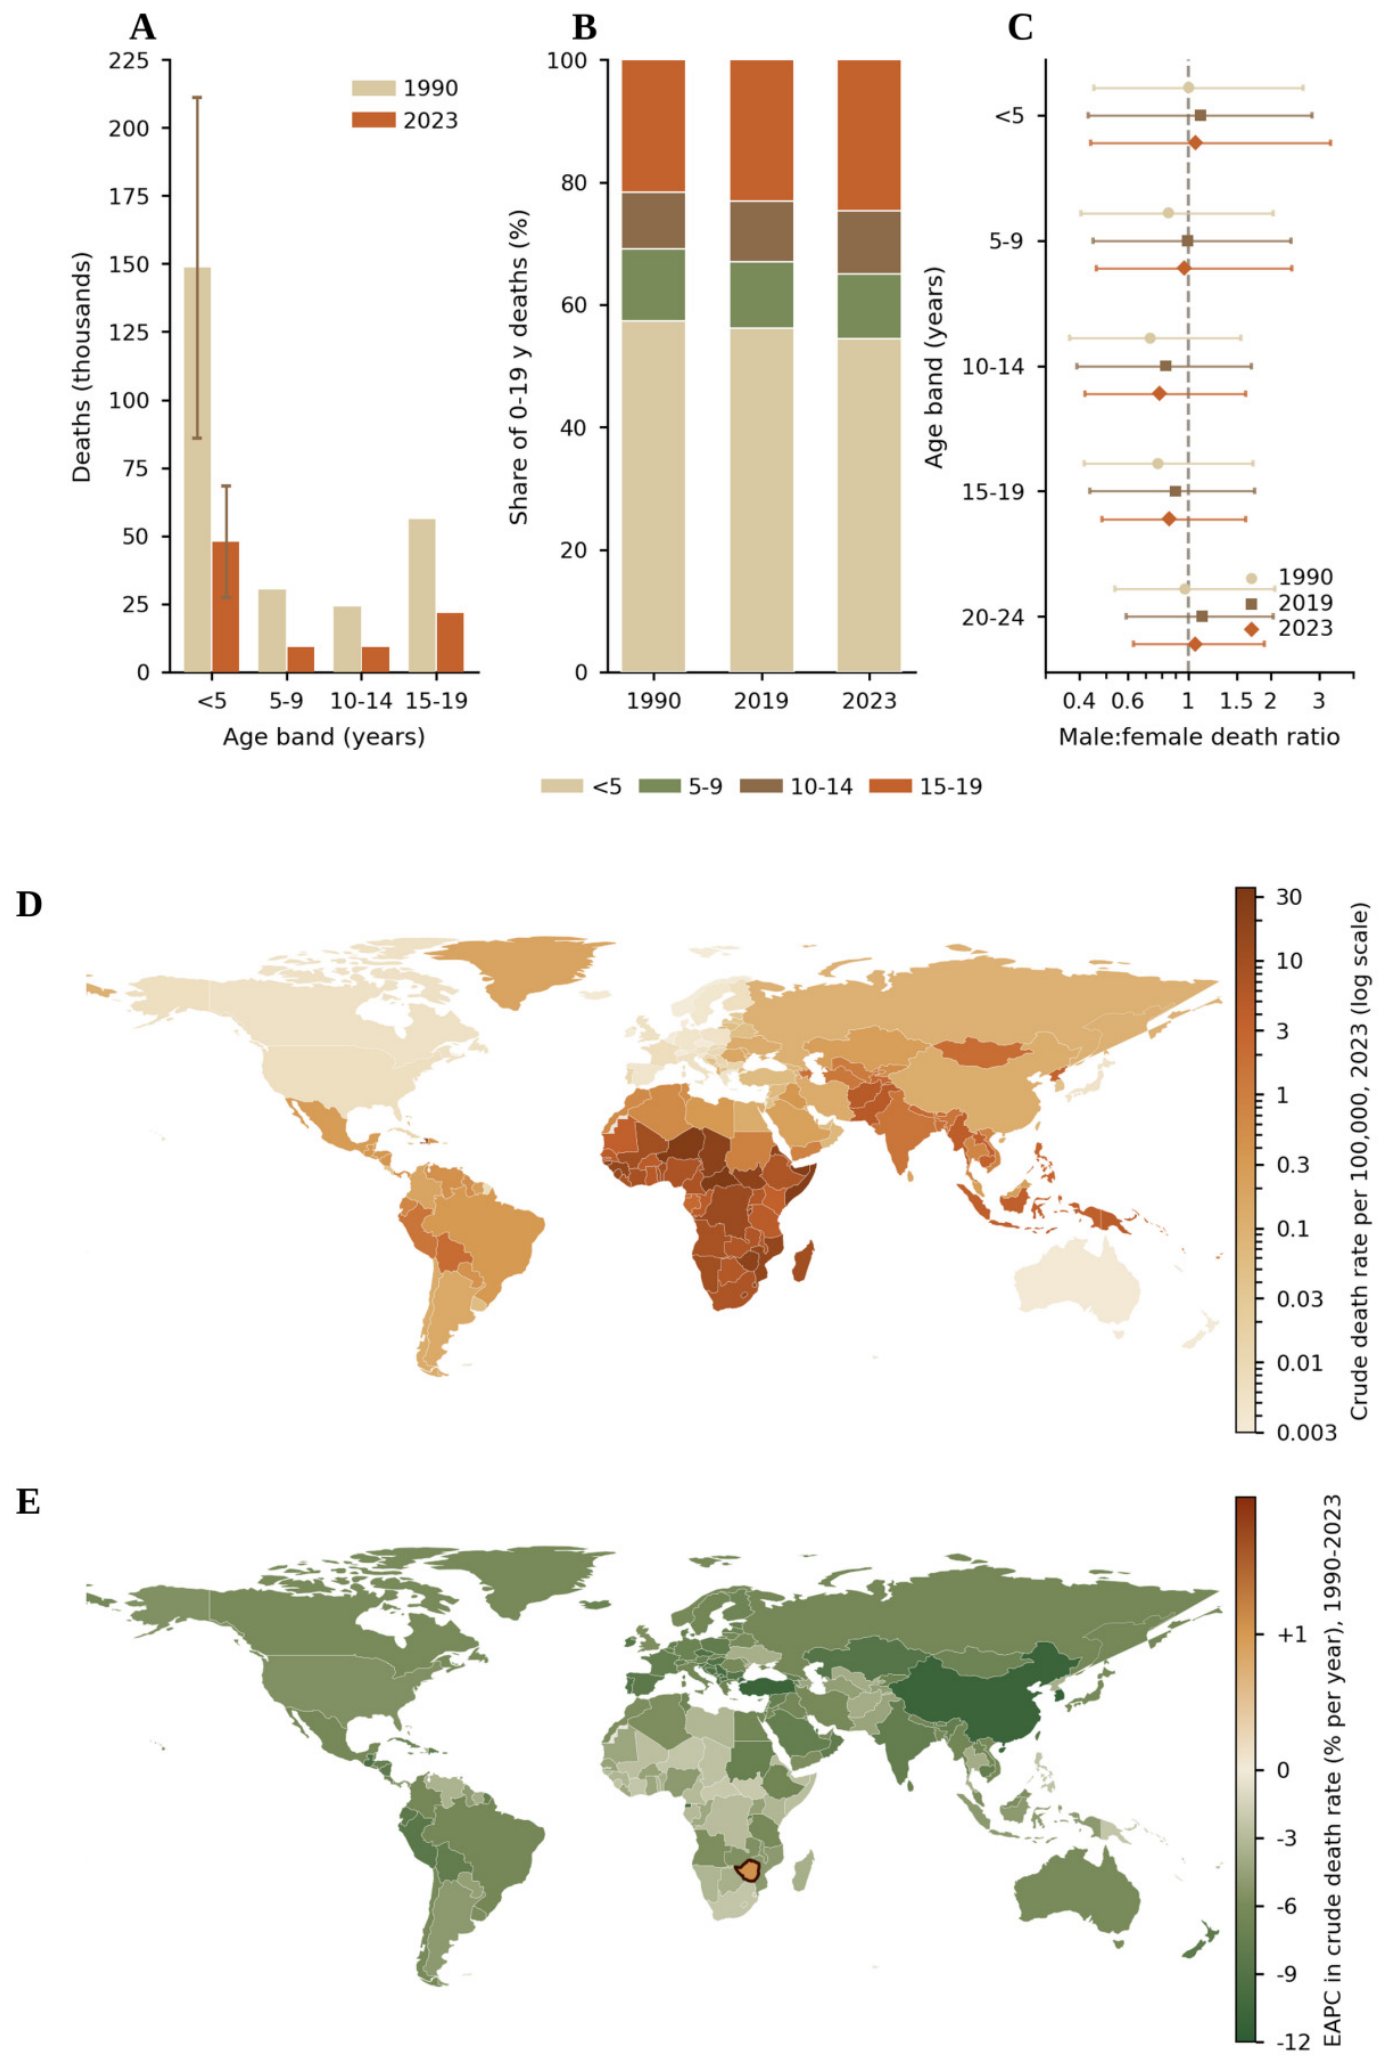
Children under 5 years accounted for 47,799 deaths (27,300–68,298) in 2023—54.5% of the 0–19-year total—with the 5–9-, 10–14- and 15–19-year bands contributing 9,248, 9,099 and 21,618 deaths (Supplementary Table S4). Improvement was slowest in the oldest band: between 1990 and 2023 deaths fell by 66.1% (95% UI −83.4 to −38.8) under 5 years versus 60.3% (−75.4 to −39.0) at ages 15–19 years, with the same ordering after 2019 (−10.6% under 5, −3.5% at 15–19 years).
Sex patterns were age-graded in point estimates (Figure 3c): the male-to-female ratio of deaths was below 1 at ages 10–14 and 15–19 years (0.78 and 0.85 in 2023), crossing above 1 at ages 20–24 years (0–19-year ratio 0.96); every 95% UI spans 1, so sex patterns are descriptive shapes only (UIs in Supplementary Table S5).
3.5. National Patterns (Figure 3d–E)
Ten countries accounted for 51,331 deaths—58.5% of the global total—in 2023: Nigeria (10,082), India (7,434), the Democratic Republic of the Congo (6,539), Pakistan (5,950), Niger (4,902), Ethiopia (3,843), Indonesia (3,465), Somalia (3,418), Mozambique (3,172) and Chad (2,527) (UIs in Supplementary Table S3); eight of the ten are African. The ten highest national crude mortality rates were all in sub-Saharan Africa (led by the Central African Republic, 31.7 per 100,000); the ten lowest were roughly 27,000-fold below the highest.
National trends were near-universally favorable: 203 of 204 countries showed a significant decline in the crude 0–19-year mortality rate between 1990 and 2023 (Supplementary Table S3). The single exception was Zimbabwe (EAPC +1.06, 95% CI +0.65 to +1.48), whose 2023 rate (20.4 per 100,000) simultaneously ranked fifth-highest globally (Section 4.4).
3.6. The Pandemic Window, 2019–2023: No Rebound in the GBD Pediatric Series
Global 0–19-year deaths declined monotonically through the pandemic window, from 99,704 in 2019 to 87,764 in 2023 (Supplementary Table S1): the 2019→2021 net change was −2.9% (Monte Carlo 95% UI −32.9 to +36.5), and no GBD region recorded a significant 2019→2021 increase (Supplementary Table S6). This contrasts with WHO’s all-age estimates, in which global TB deaths rose from approximately 1.4 million in 2019 to 1.6 million in 2021 before falling back (1.25 million in 2023) [1]—an estimation-methodology difference, not evidence that the pandemic spared children (Section 4.5).
3.7. GBD Versus WHO: A 2.5-Fold Pediatric Mortality Gap (Supplementary Table S8)
At ages 0–14 years in 2023, the author-aggregated GBD estimate of TB deaths (66,146 [45,116–87,177]) equaled 34.6% of WHO’s all-inclusive pediatric estimate (191,000) and 39.9% of the like-for-like HIV-negative comparator (Supplementary Table S8)—a roughly 2.5-fold gap. Incidence estimates were far closer: 1,010,204 (809,387–1,211,021) in GBD versus 1,250,000 (1.16–1.35 million) in WHO, a ratio of 80.8% with overlapping intervals. The age structure was highly consistent: children under 5 years accounted for 72.3% (point estimate) of GBD 0–14-year deaths versus 73% of HIV-negative deaths in WHO’s calibration.
3.8. End TB Strategy Milestone Tracking and Burden in Context
Against the End TB Strategy 2025 milestones, the pediatric trajectory is far off track. Between 2015 and 2023, deaths at ages 0–19 years fell from 117,762 (86,218–149,306) to 87,764—a decline of 23.9% (95% UI −48.5 to +9.6) against the targeted 75% reduction. Incident cases fell by 14.6% (−36.5 to +12.4) and the incidence rate by 18.0% (−38.8 to +7.8), against the targeted 50% reduction.
3.9. National Case-Fatality Gradient, Service Coverage, and Climatic Correlates (Ecological Analysis; Supplementary Table S9)
The national case-fatality proxy varied 119-fold across the 93 countries with at least 500 incident cases in 2023 (0.16 in the United Kingdom to 19.2 in Somalia) and tracked development (Spearman ρ versus log GDP per capita −0.727, P = 5.0×10⁻¹⁶); its low-versus-high-SDI ratio widened from 3.6-fold in 1990 to 10.5-fold in 2023. The 531-fold mortality gradient thus decomposes into a roughly 51-fold incidence-rate gradient and a ~10.5-fold case-fatality gradient. In multivariable regression (R² = 0.63), log GDP per capita (β = −0.315, P = 5.6×10⁻⁴) and the UHC index (β = −0.021 per point; 10 points higher ≈ 0.81-fold proxy) were independently associated with the proxy, whereas the Gini index was not (P = 0.52). Applying the best-quartile proxy (2.00) to all 93 countries would have averted an estimated 56,055 deaths (95% UI 47,520–65,508) in 2023—64.1% of the analysis-set total. In the 66-nation island and compact-coastal subset, the death rate and case-fatality proxy rose with mean annual temperature (income-adjusted partial r = +0.496 and +0.560); these gradients are hypothesis-generating only (Supplementary Table S9).
Segmented (joinpoint) trend and inequality analyses. BIC-selected joinpoint regression of the global 0–19-year crude TB death rate (0–3 joinpoints; Supplementary Table S-JP1) (selection by BIC grid search rather than the permutation test of Kim et al. (2000)) identified breakpoints at 1996, 1999 and 2003: mortality decline accelerated from −1.83% per year (95% CI −2.07 to −1.58) in 1990–1996 to −5.05% (−5.33 to −4.77) in 1999–2003, then settled at −4.11% (−4.15 to −4.06) through 2003–2023 (AAPC 1990–2023 −3.73%, −3.77 to −3.70). Incidence rose slightly until 1995 (+0.44% per year, 0.28 to 0.60), declined thereafter, and fell fastest in 2020–2023 (−3.34% per year, −3.62 to −3.07; AAPC −2.17%, −2.20 to −2.14). A single-year (2023) SDI-quintile inequality assessment gave a slope index of inequality of −10.84 deaths per 100,000 (−15.82 to −1.76) and a concentration index of −0.505 (−0.727 to −0.115), confirming the strong concentration of pediatric TB mortality in low-SDI settings; the 1990 quintile comparison was not reproducible from the packaged data (Supplementary Table S-SII1).
4. Discussion
4.1. Principal Findings
This study provides, to our knowledge, the first dedicated 0–19-year pediatric secondary analysis of GBD 2023, complementing the round’s official all-age capstone [19]. Three findings define a daily toll of 240 children and a widening estimation divide.
4.2. Extreme Concentration: An Equity Failure, Not a Knowledge Failure
TB is preventable and curable [12]. The 531-fold low- versus high-SDI mortality gradient means that where a child is born determines whether TB is treatable or fatal. Within WHO’s framework, 96% of children who die of TB never received treatment [6]; consistently, the gradient splits into a ~51-fold incidence gradient and a ~10.5-fold, still-widening case-fatality gradient tracking service coverage rather than income inequality. Pediatric TB mortality is thus a case-finding and treatment-access indicator, and the core WHO Roadmap actions (contact tracing, integrated screening, preventive treatment [11,15]) are the interventions that reach the 96%.
4.3. The Measurement Gap as a Finding, Not a Nuisance
The roughly 2.5-fold GBD–WHO divergence in pediatric mortality (66,146 versus 166,000 HIV-negative deaths at ages 0–14 years in 2023) is structurally informative. WHO’s pediatric estimates adjust notification data for under-detection [6,16,17]; the GBD fits CODEm models to vital-registration and verbal-autopsy data, in which pediatric TB deaths are prone to misclassification [4,22]. The two systems’ near-agreement on incidence (80.8%) and on the under-5 share of deaths (72.3% versus 73%) localizes the divergence to the mortality ascertainment step: how many dying children had TB at all. Until reconciled, every End TB accountability metric for children carries a 2.5-fold ambiguity; reconciliation requires child-specific verbal-autopsy validation, age-disaggregated mortality reporting, and joint calibration.
4.4. Off-Track Milestones and the Populations Left Behind
Pediatric deaths have fallen by 23.9% against the 75% End TB 2025 milestone and the incidence rate by 18.0% against the 50% target. Adolescents aged 15–19 years improved slowest in every window and sit outside both the under-15 monitoring frame and adult program design [13,14]. Zimbabwe is the only country with a significantly rising pediatric TB mortality rate (+1.06% per year) and the fifth-highest 2023 rate (20.4 per 100,000) [23]. Southern Sub-Saharan Africa is the only region with rising pediatric incidence (+0.45% per year, driven by South Africa) and the slowest mortality decline (−1.22% per year).
4.5. The Absent Pandemic Rebound: A Methodological Contrast
WHO’s all-age estimates show global TB deaths rising through 2020–2021 before receding (1.25 million in 2023) [1,29]; the GBD 2023 pediatric series declines monotonically through the same window. The most plausible reading is that GBD’s covariate-driven, year-smoothed, partly extrapolative CODEm machinery is structurally insensitive to short-run shocks, whereas WHO’s notification-anchored estimates respond to them directly. We explicitly do not claim that the pandemic spared children with TB; subsequent GBD rounds with observed pandemic-era data will make this contrast falsifiable.
4.6. Comparison with Previous Studies
The GBD 2023 TB HIV Collaborators capstone reports all-age 2015–2023 declines of 19.2% in the incidence rate and 22.6% in deaths [19]; our pediatric estimates (18.0% and 23.9%) sit close to that trajectory, cross-validating the author-aggregated series. The analyses are complementary: the capstone stratifies by HIV status and drug resistance, whereas we isolate the 0–19-year segment. Relative to the GBD 2021-round pediatric analyses [18,20,21], this study adds the pandemic-window evaluation; because each round re-estimates the entire series, we make no numeric comparisons with earlier rounds.
4.7. Limitations
Several limitations qualify these results. First, the GBD tuberculosis cause excludes HIV-associated TB (an estimated 25,000 pediatric deaths, 14%, in 2023 [1]); our analysis underestimates total pediatric TB mortality by approximately one seventh on the WHO definition. Second, all estimates are model-based, heaviest in the data-sparse settings where the burden concentrates, and the 2022–2023 values carry an extrapolative component. Third, aggregate UIs are narrower than official joint-distribution intervals and Monte Carlo change UIs are conservative; compositional shares are interpreted qualitatively. Fourth, SDI aggregates use the fixed-2021 mapping, SDI incidence EAPCs are approximate, sex-stratified estimates are global numbers only, and population denominators were back-calculated. Fifth, the Section 3.9 analyses are ecological, and the climatic gradients lack an established mechanism. Finally, no drug-resistance, risk-factor, or DALY decomposition was performed; multidrug-resistant pediatric TB—roughly 25,000–32,000 incident cases annually in WHO-calibrated modeling [30]—lies outside the present scope.
5. Conclusion
Even under the most conservative estimation framework—one excluding HIV-associated TB entirely—TB killed an estimated 87,764 children and adolescents in 2023, about 240 every day, alongside 1.67 million incident cases. The burden is concentrated (nine in ten deaths in low- and low-middle-SDI countries), under-measured (a 2.5-fold GBD–WHO mortality divide), and off track (23.9% progress against the 75% End TB 2025 milestone). Three actions follow: reconcile pediatric TB mortality estimation across the GBD and WHO systems; extend routine monitoring to ages 15–19 years; and concentrate case-finding, contact-tracing and preventive-treatment resources on the few countries where this epidemic now lives.
Supplementary Materials
The following supporting information can be downloaded at the website of this paper posted on Preprints.org, Two supplementary files accompany this manuscript: Additional file 1, Supplementary Tables S1–S9, S-JP1 and S-SII1 (Supplementary_Tables_S1-S9.docx, three-line style), which renders the eleven tables listed below and closes each with a source note naming its underlying file(s) in Supplementary Data S1; and Supplementary Data S1 (Supplementary_Data_S1.zip), the raw and author-aggregated data archive. Supplementary Data S1 (zip archive). Unmodified raw CSV extractions from the GBD 2023 Results Tool underpinning every estimate in this study: (i) global and 21-region series (deaths and incidence, 1990–2023) for the official <5-year aggregate and the 5–9-, 10–14-, 15–19- and 20–24-year bands, both sexes; (ii) 204-country deaths for the full 1990–2023 series; (iii) 204-country incidence for the eleven key years; and (iv) global sex-stratified deaths. Author-derived files (0–19-year aggregates, fixed-2021 SDI-quintile aggregates, EAPC tables, pandemic-window changes, age-composition and sex-ratio tables, End TB milestone table, GBD–WHO reconciliation table, back-calculated population denominators, the country covariate table, and the ecological-analysis tables) are at the archive root. Supplementary Table S1. Complete global 0–19-year series, 1990–2023 (deaths and incident cases, numbers and crude rates with pooled 95% uncertainty intervals), including all interim years omitted from Table 1. Supplementary Table S2. Full EAPC tables (1990–2023) for death and incidence rates: global, five SDI quintiles, and all 21 GBD regions, with primary t-distribution 95% confidence intervals and the parallel Monte Carlo refit intervals. Supplementary Table S3. Complete 204-country 2023 cross-section and 1990–2023 EAPC ranking (deaths, crude death rates, national EAPCs with 95% confidence intervals), including the full bottom-decile rates summarized in Section 3.5. Supplementary Table S4. Age-band composition of deaths, 1990–2023: band-level deaths with pooled 95% uncertainty intervals, compositional shares with Monte Carlo share intervals, and 1990–2023 and 2019–2023 band-specific changes. Supplementary Table S5. Global sex-stratified deaths and male-to-female ratios by age band (<5 through 20–24 years) for 1990, 2019 and 2023, with Monte Carlo ratio intervals; with the note that all intervals span 1 and support descriptive interpretation only. Supplementary Table S6. Pandemic-window detail, 2019–2023: year-on-year changes and net changes over two intervals for deaths and incidence, globally and for the 21 GBD regions, with Monte Carlo–propagated intervals, including all regions with positive point estimates. Supplementary Table S7. Fixed-2021 SDI-quintile mapping: country-to-quintile assignment, the empirical thresholds (0.463/0.619/0.710/0.812) used to complete the 22 countries with subnational splits, and the resulting quintile-level aggregates for all key years. Supplementary Table S8. GBD–WHO reconciliation and End TB milestone tables: 0–14-year GBD estimates versus WHO Global Tuberculosis Report 2024 estimates (2023) and 2015–2023 milestone progress (Section 3.7 and Section 3.8). Supplementary Table S9. Ecological covariate analyses (Section 3.9): the 93-country 2023 case-fatality-proxy table with GDP per capita, Gini, UHC service coverage index and World Bank income group; the SDI-quintile case-fatality gradient for 1990 and 2023; the best-quartile counterfactual; and the full island/compact-coastal correlation matrix (66 nations; 3 outcomes × 15 predictors; Spearman and income-adjusted partial correlations with Benjamini–Hochberg q-values). Supplementary Table S-JP1. Joinpoint regression of global 0–19-year crude TB death and incidence rates, 1990–2023 (grid search 0–3 joinpoints, BIC; Section 3.1). Supplementary Table S-SII1. Single-year (2023) slope index of inequality (SII) and concentration index (CII) of the 0–19-year TB death rate across SDI quintiles (Section 3.3).
GATHER checklist
Provided as Supplementary Material.
Analysis code note
Python 3.11 scripts reproducing every table and figure input from the raw extractions are available from the corresponding author on reasonable request.
Author Contributions
Conceptualization: SC; Data curation: HC, DL; Formal analysis: HC, DL; Funding acquisition: SC; Investigation: DL, SC; Methodology: SC; Project administration: SC; Software: DL; Supervision: SC; Validation: HC, DL, SC; Visualization: HC, DL; Writing—original draft: SC; Writing—review and editing: SC, DL. All authors read and approved the final manuscript.
Funding Source
This work was supported by the Beijing Science and Technology Nova Program Interdisciplinary Project (20230484439) and the Beijing High-Level Public Health Technical Talents Project (2023-02-33). The funder had no role in study design, data collection, analysis, interpretation, the decision to publish, or preparation of the manuscript.
Acknowledgments
We thank the Institute for Health Metrics and Evaluation (IHME), University of Washington, for making the GBD 2023 estimates publicly available through the GBD Results Tool, and the Global Burden of Disease Collaborator Network, whose primary data collection and modeling underpin all estimates analyzed here.
Conflicts of Interest
The authors declare no competing interests.
Ethical Approval
This study is a secondary analysis of de-identified, aggregate, publicly available estimates from the Global Burden of Disease (GBD) Study 2023, coordinated by the Institute for Health Metrics and Evaluation (IHME). No individual-level or identifiable data were accessed. In accordance with institutional policy for research on publicly available aggregate data, this study was exempt from institutional review board approval. No participant consent was required.
Ethics approval and consent to participate
Not applicable. The work re-analyses public, de-identified, country-level modelled estimates from the Global Burden of Disease Study 2023; no individual-level or identifiable data were used.
Consent for publication
Not applicable.
Data availability
All estimates analyzed in this study were downloaded by the authors from the GBD Results Tool (https://vizhub.healthdata.org/gbd-results/), GBD 2023 round, using fully specified, reproducible queries (cause: tuberculosis; measures: deaths and incidence; numbers and rates with 95% uncertainty intervals; ages <5 aggregate, 5–9, 10–14, 15–19 and 20–24 years; 1990–2023). The unmodified raw CSV extractions, together with the author-aggregated derived datasets (0–19-year totals, SDI and regional stratifications, EAPC tables, pandemic-window changes, sex ratios, the GBD–WHO reconciliation table, the country covariate table, and the ecological-analysis outputs), are provided as Supplementary Data S1. Python analysis code is available from the corresponding author on reasonable request.
Declaration of Generative AI and AI-assisted technologies in the writing process
AI tools were used for language polishing and code drafting.
GATHER statement
This study adheres to the Guidelines for Accurate and Transparent Health Estimates Reporting (GATHER); the completed checklist is provided as Supplementary Material.
Abbreviations
BCG, Bacille Calmette–Guérin; CFR, case-fatality ratio; CI, confidence interval; CODEm, Cause of Death Ensemble model; DALY, disability-adjusted life-year; EAPC, estimated annual percentage change; GATHER, Guidelines for Accurate and Transparent Health Estimates Reporting; GBD, Global Burden of Disease (Study); HIV, human immunodeficiency virus; ICD, International Classification of Diseases; IHME, Institute for Health Metrics and Evaluation; LRI, lower respiratory infection; MC, Monte Carlo; MDR/RR-TB, multidrug-/rifampicin-resistant tuberculosis; SDG, Sustainable Development Goal; SDI, Socio-demographic Index; SSA, Sub-Saharan Africa; TB, tuberculosis; UI, uncertainty interval; UN, United Nations; VA, verbal autopsy; VR, vital registration; WHO, World Health Organization.
References
- World Health Organization. Global tuberculosis report 2024; World Health Organization: Geneva, 2024; Available online: https://www.who.int/teams/global-tuberculosis-programme/tb-reports/global-tuberculosis-report-2024.
- Perez-Velez, C.M.; Marais, B.J. Tuberculosis in children. N Engl. J. Med. 2012, 367(4), 348–361. [Google Scholar] [CrossRef] [PubMed]
- Jenkins, H.E. Global burden of childhood tuberculosis. Pneumonia (Nathan) 2016, 8, 24. [Google Scholar] [CrossRef] [PubMed]
- GBD 2023 Causes of Death Collaborators. Global burden of 292 causes of death in 204 countries and territories and 660 subnational locations, 1990–2023: a systematic analysis for the Global Burden of Disease Study 2023. Lancet. 2025;406(10513):1811–1872. doi:10.1016/S0140-6736(25)01917-8. GBD 2023 Disease and Injury and Risk Factor Collaborators. Burden of 375 diseases and injuries, risk-attributable burden of 88 risk factors, and healthy life expectancy in 204 countries and territories, including 660 subnational locations, 1990–2023: a systematic analysis for the Global Burden of Disease Study 2023. Lancet. 2025;406(10513):1873–1922. doi:10.1016/S0140-6736(25)01637-X. GBD 2023 Demographics Collaborators. Global age-sex-specific all-cause mortality and life expectancy estimates for 204 countries and territories and 660 subnational locations, 1950–2023: a demographic analysis for the Global Burden of Disease Study 2023. Lancet 2025, 406(10513), 1731–1810. [Google Scholar] [CrossRef] [PubMed]
- Institute for Health Metrics and Evaluation (IHME). GBD Results Tool. Seattle, WA: IHME, University of Washington. Available online: https://vizhub.healthdata.org/gbd-results (accessed on 18 August 2026).
- Dodd, P.J.; Yuen, C.M.; Sismanidis, C.; Seddon, J.A.; Jenkins, H.E. The global burden of tuberculosis mortality in children: a mathematical modelling study. Lancet Glob. Health 2017, 5(9), e898–e906. [Google Scholar] [CrossRef] [PubMed]
- World Health Organization. The End TB Strategy; World Health Organization: Geneva, 2015; Available online: https://www.who.int/publications/i/item/WHO-HTM-TB-2015.19.
- Uplekar, M.; Weil, D.; Lönnroth, K.; Jaramillo, E.; Lienhardt, C.; Dias, H.M.; et al. WHO’s new End TB Strategy. Lancet 2015, 385(9979), 1799–1801. [Google Scholar] [CrossRef] [PubMed]
- United Nations. Transforming our world: the 2030 Agenda for Sustainable Development (A/RES/70/1); United Nations: New York, 2015; Available online: https://sdgs.un.org/2030agenda.
- United Nations. Political Declaration of the High-Level Meeting on the Fight Against Tuberculosis: advancing science, finance and innovation, and their benefits, to urgently end the global tuberculosis epidemic; United Nations: New York, 2023. [Google Scholar]
- World Health Organization. Roadmap towards ending TB in children and adolescents, 3rd ed.; World Health Organization: Geneva, 2023. [Google Scholar]
- World Health Organization. WHO consolidated guidelines on tuberculosis. Module 5: Management of tuberculosis in children and adolescents; World Health Organization: Geneva, 2022. [Google Scholar]
- Snow, K.J.; Sismanidis, C.; Denholm, J.; Sawyer, S.M.; Graham, S.M. The incidence of tuberculosis among adolescents and young adults: a global estimate. Eur. Respir. J. 2018, 51(2), 1702352. [Google Scholar] [CrossRef] [PubMed]
- Snow, K.J.; Cruz, A.T.; Seddon, J.A.; Ferrand, R.A.; Chiang, S.S.; Hughes, J.A.; et al. Adolescent tuberculosis. Lancet Child Adolesc. Health 2020, 4(1), 68–79. [Google Scholar] [CrossRef] [PubMed]
- Deborggraeve, S.; Casenghi, M.; Hewison, C.; Ditekemena, J.; Ditiu, L.; Amanullah, F.; et al. Reversing the neglect of children and adolescents affected by tuberculosis. Lancet Child Adolesc. Health 2023, 7(10), 675–677. [Google Scholar] [CrossRef] [PubMed]
- Yerramsetti, S.; Cohen, T.; Atun, R.; Menzies, N.A.; Salomon, J.A.; Bercault, N.; et al. Global estimates of paediatric tuberculosis incidence in 2013–19: a mathematical modelling analysis. Lancet Glob. Health 2022, 10(2), e207–e215. [Google Scholar] [CrossRef] [PubMed]
- Verkuijl, S.; Bastard, M.; Brands, A.; Viney, K.; Masini, T.; Mavhunga, F.; et al. Global reporting on TB in children and adolescents: how far have we come and what remains to be done? IJTLD Open 2024, 1(1), 3–6. [Google Scholar] [CrossRef] [PubMed]
- GBD 2021 Tuberculosis Collaborators. Global, regional, and national age-specific progress towards the 2020 milestones of the WHO End TB Strategy: a systematic analysis for the Global Burden of Disease Study 2021. Lancet Infect. Dis. 2024, 24(7), 698–725. [Google Scholar] [CrossRef] [PubMed]
- GBD 2023 TB HIV Collaborators. Global, regional, and national burden of tuberculosis and multidrug-resistant tuberculosis by HIV status, 1990–2023: a systematic analysis for the Global Burden of Disease Study 2023. Lancet Infect. Dis. Online ahead of print. 2026, S1473-3099(26)00295-1. [Google Scholar] [CrossRef] [PubMed]
- Li, X.; Li, Y.; Guo, L.; et al. Tuberculosis incidence, deaths and disability-adjusted life years in children and adolescence, 1990–2021: results from the Global Burden of Disease Study 2021. PLoS ONE 2025, 20(3), e0317880. [Google Scholar] [CrossRef] [PubMed]
- Liang, Y.; Wang, J.; Yang, J.; Liu, Y.; He, X. Global burden and trend of tuberculosis in children and adolescents (under 15 years old) from 1990 to 2021, with projections to 2040. Front Public Health 2025, 13, 1578658. [Google Scholar] [CrossRef]
- Naghavi, M.; Makela, S.; Foreman, K.; O’Brien, J.; Pourmalek, F.; Lozano, R. Algorithms for enhancing public health utility of national causes-of-death data. Popul Health Metr. 2010, 8, 9. [Google Scholar] [CrossRef] [PubMed]
- GBD 2021 HIV Collaborators. Global, regional, and national burden of HIV/AIDS, 1990–2021, and forecasts to 2050, for 204 countries and territories: the Global Burden of Disease Study 2021. Lancet HIV. 2024, 11(12), e807–e822. [Google Scholar] [CrossRef] [PubMed]
- Kim, H.J.; Fay, M.P.; Feuer, E.J.; Midthune, D.N. Permutation tests for joinpoint regression with applications to cancer rates. Stat. Med. 2000, 19(3), 335–351. [Google Scholar] [CrossRef]
- World Health Organization. Global tuberculosis report 2023; World Health Organization: Geneva, 2023. [Google Scholar]
- World Bank. World Development Indicators; World Bank: Washington, DC; Available online: https://databank.worldbank.org/source/world-development-indicators (accessed on 19 August 2026).
- World Health Organization and International Bank for Reconstruction and Development/The World Bank. Tracking universal health coverage: 2023 global monitoring report; World Health Organization: Geneva, 2023. [Google Scholar]
- Stevens, G.A.; Alkema, L.; Black, R.E.; Boerma, J.T.; Collins, G.S.; Ezzati, M.; et al. Guidelines for Accurate and Transparent Health Estimates Reporting: the GATHER statement. Lancet 2016, 388(10062), e19–e23. [Google Scholar] [CrossRef] [PubMed]
- McQuaid, C.F.; Vassall, A.; Cohen, T.; Fiekert, K.; White, R.G. The impact of COVID-19 on TB: a review of the data. Int. J. Tuberc. Lung Dis. 2021, 25(6), 436–446. [Google Scholar] [CrossRef] [PubMed]
- Dodd, P.J.; Sismanidis, C.; Seddon, J.A. Global burden of drug-resistant tuberculosis in children: a mathematical modelling study. Lancet Infect. Dis. 2016, 16(10), 1193–1201. [Google Scholar] [CrossRef] [PubMed]
Figure 2.
Estimated annual percentage change (EAPC) in crude tuberculosis rates at ages 0–19 years, 1990–2023 (GBD 2023; HIV-negative tuberculosis). (a) EAPC of the crude death rate across the 21 GBD regions, sorted; whiskers are 95% confidence intervals (CIs); the dashed line marks the global estimate (−3.96% per year). (b) EAPC of the crude incidence rate across the 21 GBD regions; Southern Sub-Saharan Africa (+0.45, +0.04 to +0.86) is the only significantly positive estimate. (c) EAPCs of crude death and incidence rates by Socio-demographic Index (SDI) quintile. Data: GBD 2023 Results (IHME). Notes. EAPCs derive from log-linear regression of the crude 0–19-year rate on calendar year; 95% CIs reflect regression precision only. SDI aggregates are country sums under a fixed-2021 quintile mapping (not official dynamic GBD SDI aggregates), and SDI incidence EAPCs are fitted on eleven key years and are approximate.
Figure 2.
Estimated annual percentage change (EAPC) in crude tuberculosis rates at ages 0–19 years, 1990–2023 (GBD 2023; HIV-negative tuberculosis). (a) EAPC of the crude death rate across the 21 GBD regions, sorted; whiskers are 95% confidence intervals (CIs); the dashed line marks the global estimate (−3.96% per year). (b) EAPC of the crude incidence rate across the 21 GBD regions; Southern Sub-Saharan Africa (+0.45, +0.04 to +0.86) is the only significantly positive estimate. (c) EAPCs of crude death and incidence rates by Socio-demographic Index (SDI) quintile. Data: GBD 2023 Results (IHME). Notes. EAPCs derive from log-linear regression of the crude 0–19-year rate on calendar year; 95% CIs reflect regression precision only. SDI aggregates are country sums under a fixed-2021 quintile mapping (not official dynamic GBD SDI aggregates), and SDI incidence EAPCs are fitted on eleven key years and are approximate.
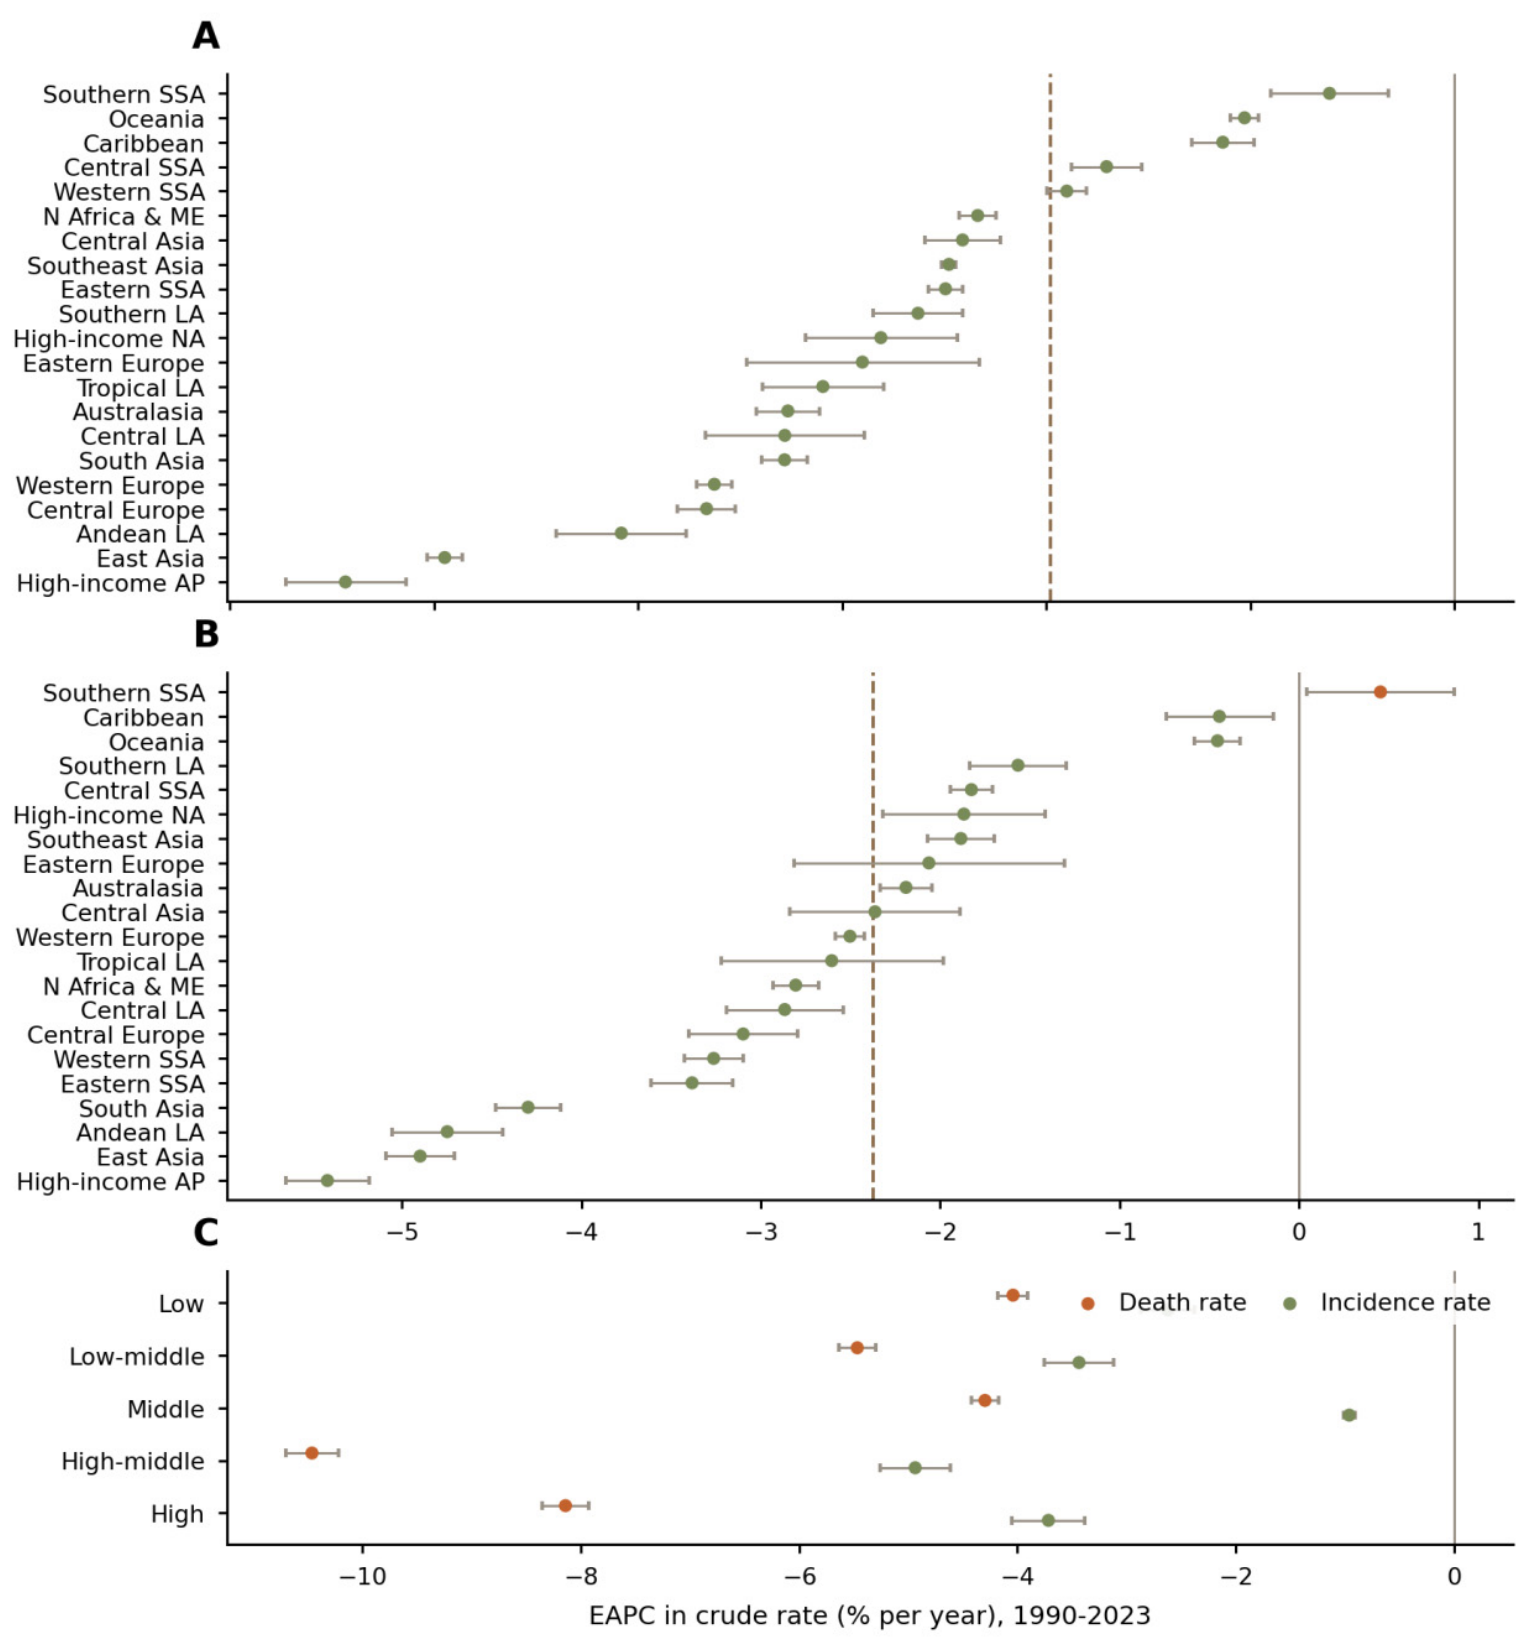
Figure 3.
Age composition and sex pattern of tuberculosis deaths at ages 0–19 years, 1990–2023 (GBD 2023; HIV-negative tuberculosis). (a) Deaths by age band (<5, 5–9, 10–14, 15–19 years) in 1990 and 2023; whiskers are 95% uncertainty intervals (UIs; shown for the under-5 aggregate). (b) Share of 0–19-year deaths by age band in 1990, 2019 and 2023 (under-5 share 57.4%, 56.1% and 54.5%). (c) Male-to-female ratio of deaths by age band in 1990, 2019 and 2023 (the 20–24-year band shown for transition context); whiskers are 95% UIs; the dashed line marks a ratio of 1. Data: GBD 2023 Results (IHME). Notes. Share estimates carry wide Monte Carlo UIs (2023 under-5 share: median 55.5%, 95% UI 30.2–86.0) and are interpreted as point-estimate patterns. All sex-ratio UIs span 1; panel C is descriptive and supports no significance claims. (d–e) Country-level tuberculosis mortality at ages 0–19 years, 204 countries and territories (GBD 2023; HIV-negative tuberculosis). (d) Crude death rate per 100,000 in 2023 (choropleth, log-scaled color breaks). (e) Estimated annual percentage change (EAPC) of the crude death rate, 1990–2023 (choropleth); Zimbabwe (+1.06, 95% CI +0.65 to +1.48) is the only significantly positive national estimate and is highlighted. Data: GBD 2023 Results (IHME). Notes. Rates are crude 0–19-year rates with back-calculated denominators. EAPC 95% CIs derive from log-linear regression and reflect regression precision only; 203 of 204 national EAPCs are significantly negative.
Figure 3.
Age composition and sex pattern of tuberculosis deaths at ages 0–19 years, 1990–2023 (GBD 2023; HIV-negative tuberculosis). (a) Deaths by age band (<5, 5–9, 10–14, 15–19 years) in 1990 and 2023; whiskers are 95% uncertainty intervals (UIs; shown for the under-5 aggregate). (b) Share of 0–19-year deaths by age band in 1990, 2019 and 2023 (under-5 share 57.4%, 56.1% and 54.5%). (c) Male-to-female ratio of deaths by age band in 1990, 2019 and 2023 (the 20–24-year band shown for transition context); whiskers are 95% UIs; the dashed line marks a ratio of 1. Data: GBD 2023 Results (IHME). Notes. Share estimates carry wide Monte Carlo UIs (2023 under-5 share: median 55.5%, 95% UI 30.2–86.0) and are interpreted as point-estimate patterns. All sex-ratio UIs span 1; panel C is descriptive and supports no significance claims. (d–e) Country-level tuberculosis mortality at ages 0–19 years, 204 countries and territories (GBD 2023; HIV-negative tuberculosis). (d) Crude death rate per 100,000 in 2023 (choropleth, log-scaled color breaks). (e) Estimated annual percentage change (EAPC) of the crude death rate, 1990–2023 (choropleth); Zimbabwe (+1.06, 95% CI +0.65 to +1.48) is the only significantly positive national estimate and is highlighted. Data: GBD 2023 Results (IHME). Notes. Rates are crude 0–19-year rates with back-calculated denominators. EAPC 95% CIs derive from log-linear regression and reflect regression precision only; 203 of 204 national EAPCs are significantly negative.
Disclaimer/Publisher’s Note: The statements, opinions and data contained in all publications are solely those of the individual author(s) and contributor(s) and not of MDPI and/or the editor(s). MDPI and/or the editor(s) disclaim responsibility for any injury to people or property resulting from any ideas, methods, instructions or products referred to in the content. |
© 2026 by the authors. Licensee MDPI, Basel, Switzerland. This article is an open access article distributed under the terms and conditions of the Creative Commons Attribution (CC BY) license (http://creativecommons.org/licenses/by/4.0/).
Copyright: This open access article is published under a Creative Commons CC BY 4.0 license, which permit the free download, distribution, and reuse, provided that the author and preprint are cited in any reuse.