

Submitted:
27 October 2026
Posted:
28 October 2026
You are already at the latest version
Preprints on COVID-19 and SARS-CoV-2
Abstract
Background: Childhood and adolescent cancer mortality has declined for three decades, yet whether the COVID-19 pandemic interrupted this decline has never been quantified at the population level; the official Global Burden of Disease (GBD) 2023 childhood cancer analysis does not examine the 2019–2021 window. We analyzed the 0–19-year neoplasm burden in GBD 2023 with explicit attention to the pandemic window.Methods: We extracted deaths and incident cases for the GBD Level-2 cause “Neoplasms”—an envelope of malignant, benign and in-situ tumors—at ages 0–19 years, both sexes, 1990–2023, globally, for 21 regions and five Socio-demographic Index (SDI) quintiles. We computed crude rates on back-calculated populations, long-term estimated annual percentage changes (EAPCs), and pandemic-window changes with Monte Carlo-propagated uncertainty intervals (UIs); a mortality-to-incidence (M/I) ratio served as a comparative detection-and-survival proxy. Same-pipeline pediatric tuberculosis and lower respiratory infection series provided internal controls. Because approximately 96% of incident cases are benign or in-situ tumors, incidence-side and M/I absolute values are interpreted comparatively only; all primary inference is mortality-based.Results: In 2023, neoplasms caused 148,436 deaths (95% UI 139,201–157,671) at ages 0–19 years, 26.6% fewer than in 1990—versus 144,000 (131,000–162,000) in the official malignant-only analysis, whose intervals fully overlap ours. Reversing three decades of decline, deaths rose 4.7% (−3.3 to +13.5) between 2019 and 2021 to 152,553, the highest since 2008; the rise was broadly graded by development (high-SDI −2.1% to low-SDI +7.9%) and had not fully receded by 2023. Mortality declined slowest among comparator diseases (EAPC −1.61 versus tuberculosis −3.96 and lower respiratory infections −3.89); the neoplasm-to-tuberculosis death ratio crossed over from 0.78 to 1.69. The low-to-high-SDI M/I gap widened from 14.5-fold to 21.7-fold. Adolescents aged 15–19 years became the largest mortality band among ages 5–19 years—nearly level with the under-5 band (41,182 versus 42,222 deaths)—and rose most of any band over 2019–2023 (+8.0%), while under-5 deaths fell 6.3%. Interrupted time series analysis formally confirmed the mortality reversal: at the BIC-optimal intervention year of 2019, the global mortality series showed an immediate level increase of 7.5% (95% CI 2.4 to 12.9), with 2023 mortality 15.8% (10.7 to 21.2) above the counterfactual pre-pandemic trend.Interpretation: The pandemic window marks a fault line in pediatric cancer control: a development-graded mortality reversal superimposed on a widening survival divide. Because GBD 2023 mortality models incorporate pandemic-period covariates, we present this as a data-and-model signal requiring triangulation, not a pure causal claim. Reaching the WHO childhood cancer survival targets requires closing the diagnostic-treatment gap the pandemic exposed.
Keywords:
childhood cancer
; adolescent cancer
; neoplasms
; Global Burden of Disease
; GBD 2023
; mortality
; COVID-19 pandemic
; health inequality
; mortality-to-incidence ratio
; WHO Global Initiative for Childhood Cancer
1. Introduction
1.1. Background and Motivation
1.1.1. Childhood and Adolescent Cancer: A Treatable Disease with a Survival Divide
Cancers in children and adolescents are biologically distinct from adult cancers: they are dominated by embryonal tumors, leukemias, lymphomas and brain tumors, are rarely attributable to modifiable exposures, and are among the most treatable of all cancers when diagnosed early and treated with established protocols [1,2]. Five-year net survival exceeds 80% in high-income countries but falls below 20–30% in parts of low- and middle-income countries (LMICs), with a simulated global average of 37.4%—11.6% in Africa versus 83.0% in North America [3,4,5]. Because roughly 90% of the world’s children live in LMICs, this survival gradient, not incidence, is the dominant determinant of where childhood cancer deaths occur [3,4,6].
1.1.2. A Young Global Policy Architecture
Global governance for childhood cancer is strikingly young. The WHO Global Initiative for Childhood Cancer (GICC), launched in 2018 with St Jude Children’s Research Hospital, set the target of at least 60% survival worldwide by 2030, potentially averting one million additional deaths [7,8]; childhood cancer was included in the United Nations political declaration on noncommunicable diseases (NCDs) in 2025 [9], and WHO released its first country-level lymphoblastic leukemia survival estimates, covering 194 countries for 2017–2021, in 2026 [10]. By contrast, tuberculosis has been governed by the End TB Strategy since 2014 and childhood pneumonia by the Global Action Plan for Pneumonia and Diarrhoea since 2013 [11,12]. Whether the global architecture arrived in time—and whether it survived its first stress test, the COVID-19 pandemic—remains unquantified at the population level.
1.1.3. The Pandemic Question: Clinical Signals Without Population Quantification
Facility-level evidence suggests the pandemic disrupted pediatric oncology: a cross-sectional survey of 213 institutions in 79 countries documented treatment modifications, reduced surgical capacity and staff redeployment during 2020 [13]; the Global Registry of COVID-19 in Childhood Cancer recorded substantial treatment modification among infected children [14]; and single-center and national series reported diagnostic delays in some settings [15,16]. Yet all such evidence derives from the facility side—children who reached care. Children who never reached a diagnosis during the pandemic are invisible to it. No population-level analysis has quantified whether childhood cancer mortality deviated from its long-run decline during 2020–2021. Notably, the official GBD 2023 childhood cancer capstone analysis [1] reports trends to 2023 but does not examine the 2019–2021 window: its headline regional finding is a 55.6% increase in deaths in the African region between 1990 and 2023.
1.1.4. The Silent Restructuring of Child Death
As infectious causes recede, the composition of child mortality is changing. Pediatric tuberculosis deaths fell from 259,063 in 1990 to 87,764 in 2023 in our same-pipeline aggregation of GBD 2023 [17,18,20], and lower respiratory infection (LRI) deaths from about 2.04 million to 711,713 [17,19]. If neoplasm mortality declined more slowly, childhood cancer would mechanically overtake infectious diseases as a cause of child death—an epidemiological crossover that, to our knowledge, has never been documented in a unified 0–19-year framework.
1.2. Research Gap
Three gaps follow. First, no population-level quantification exists of the pandemic-era trajectory of childhood and adolescent cancer mortality—its global direction, its social stratification, and its persistence beyond 2021. Second, no study has tracked pediatric neoplasm mortality against same-caliber pediatric tuberculosis and LRI series to locate the crossover of cause-of-death structure. Third, the diagnostic-treatment fault line underlying the survival divide—long inferred from simulations and registries [3,4,21]—lacks a tractable, annually updateable descriptive indicator within a single estimation framework.
1.3. Objectives and Contributions
This study provides a comprehensive, mortality-centered analysis of the neoplasm burden at ages 0–19 years from 1990 to 2023 using GBD 2023 estimates [17,18,22]. All values were computed by the authors from raw GBD Results Tool downloads; the 0–19-year series combines four non-overlapping age bands (<5, 5–9, 10–14, 15–19 years) under the same caliber as our parallel pediatric tuberculosis and LRI analyses [18,19,20,23]. Five contributions follow.
First, we quantify the pandemic window: global 0–19-year neoplasm deaths rose 4.7% between 2019 and 2021—the first reversal in the GBD 2023 series—reaching the highest level since 2008, and we show that the reversal was broadly graded by the Socio-demographic Index (SDI), from −2.1% in high-SDI to +7.9% in low-SDI settings. Second, we document the cross-disease repositioning: neoplasms overtook tuberculosis as a cause of death at ages 0–19 years (death ratio 0.78 in 1990 to 1.69 in 2023) while declining more slowly than both infectious comparators. Third, we track the mortality-to-incidence (M/I) ratio as a comparative detection-and-survival proxy and show that the low-to-high-SDI gap widened from 14.5-fold to 21.7-fold. Fourth, we characterize an adolescent fault line: the 15–19-year band became the largest single contributor to deaths among ages 5–19 years by 2023 and the band whose deaths rose most across 2019–2023. Fifth, throughout, we delimit precisely what the Level-2 “Neoplasms” envelope can and cannot support—approximately 96% of its incident cases are benign or in-situ tumors, so all primary inference is mortality-based—and we cross-validate our mortality estimates against the official GBD 2023 childhood cancer capstone [1] (148,436 versus 144,000 deaths in 2023; uncertainty intervals fully overlapping), positioning this analysis as complementary to, not duplicative of, that work.
Together, these contributions reframe the pandemic not as the cause of a new crisis but as a stress test that exposed—and measurably widened—a pre-existing fault line in childhood cancer control.
2. Methods
2.1. Study Design and Data Sources
2.1.1. GBD 2023 Analytical Framework
This study is a secondary analysis of the Global Burden of Disease (GBD) Study 2023, coordinated by the Institute for Health Metrics and Evaluation (IHME) [17,18,22]. GBD 2023 estimates disease and injury burden for 204 countries and territories, aggregated into 21 GBD regions and five Socio-demographic Index (SDI) quintiles, for 1990–2023 [17,22]. Causes of death are modeled with the Cause of Death Ensemble model (CODEm) on vital registration, verbal autopsy and cancer-registry data, with garbage codes systematically redistributed [17,26]; the GBD 2023 round additionally models pandemic-period mortality shocks, a point central to the interpretation of our headline finding (Section 2.5 and Section 4.2). Estimates derive from posterior draws; 95% uncertainty intervals (UIs) are the 2.5th and 97.5th draw percentiles [17].
2.1.2. Direct Download and Author Aggregation of Estimates for Ages 0–19 Years
All pediatric estimates were derived from raw data downloaded by the authors from the GBD Results Tool [18] on 18 August 2026, using reproducible queries covering deaths and incidence (numbers, with 95% UIs) for the Level-2 cause “Neoplasms” at the global level, the five SDI quintiles and the 21 GBD regions—27 locations—for five age groups (<5, 5–9, 10–14, 15–19 and 20–24 years), both sexes, 1990–2023 (9,180 rows, no missing blocks). The 20–24-year band was retained for compositional reference only and never enters the 0–19-year aggregate; the 0–19-year total sums the four younger non-overlapping bands, the same caliber as our companion pediatric tuberculosis and LRI analyses [18,19,20,23]. Sex-stratified rows were not part of this extraction; all estimates are both-sexes (Section 4.8). No estimate was transcribed from any previously published article. The pediatric tuberculosis and LRI comparator series were produced with the identical pipeline, denominators and uncertainty conventions, and serve as internal methodological controls (Section 2.7).
2.1.3. Comparison with Previous GBD Rounds
Because each GBD round re-estimates the entire time series with updated data and methods, cross-round numerical differences cannot be attributed to true temporal change. Accordingly, no estimate from any previous GBD round enters any table, figure, or trend reported here; prior-round analyses [8] are discussed only for scope and pattern.
2.2. Cause Definition and Scope Honesty Framework
The analyzed cause is the GBD Level-2 aggregate “Neoplasms”, an envelope of all malignant, benign and in-situ tumors [1,17]. Two structural properties of this envelope define what this study can claim, and we state them at the outset and return to them in the Limitations.
First, on the mortality side, deaths within the envelope are contributed almost entirely by malignant tumors—benign tumors register essentially zero deaths—so the mortality series is, to close approximation, a malignant-neoplasm mortality series. This is confirmed empirically by cross-validation against the official GBD 2023 childhood cancer capstone, which restricts to malignant causes: our 2023 estimate of 148,436 deaths (95% UI 139,201–157,671) differs from the official 144,000 (131,000–162,000) by 3–4% at the point value with fully overlapping intervals, and likewise for 1990 (202,285 [187,663–216,907] versus 197,000 [173,000–218,000]) [1,18]. All primary inference in this paper is therefore mortality-based and unaffected by the envelope’s breadth.
Second, on the incidence side, the envelope is dominated by benign and in-situ tumors: of approximately 10.07 million incident 0–19-year cases in 2023, an estimated 96% are benign or in-situ, against 377,000 (288,000–489,000) malignant cases in the official analysis [1,18]. Consequently, incidence levels, incidence trends and the mortality-to-incidence ratio in this study reflect “detection intensity × survival” as a composite, are systematically diluted relative to malignant-only mortality-to-incidence ratios (MIRs) in the literature, and are used exclusively for relative comparisons across locations and over time—never as absolute survival estimates (Section 2.6).
2.3. Denominators and Rate Definitions
The GBD Results Tool extraction for this cause contained numbers only. Crude rates per 100,000 were computed by the authors as Σ(numbers) ÷ Σ(populations), where band populations were back-calculated from the shared population denominators of the companion GBD 2023 pediatric series (both-sexes rows only), which are themselves derived from official GBD 2023 demographic estimates [22]. The back-calculated global 0–19-year population in 2023 was 2,670,651,217, identical to that used in the companion tuberculosis and LRI analyses, ensuring internal consistency of all cross-disease ratios. Rate UIs are converted from count UIs and omit denominator uncertainty.
2.4. Stratification
2.5. Temporal Trend Analysis and the Pandemic-Window Convention
2.5.1. Estimated Annual Percentage Change, 1990–2023
Long-term trends were quantified using the estimated annual percentage change (EAPC) from a log-linear regression of the crude rate on calendar year; EAPC = 100 × (e^β − 1) [25], with 95% confidence intervals (CIs) from the slope’s standard error (t distribution, n−2 degrees of freedom), reflecting regression precision only.
2.5.2. The 2019–2023 Pandemic Window
The pandemic-era window was analyzed differently by design: a five-point EAPC would average directionally opposite movements into one slope, so we do not report five-point EAPCs in the main text. Pandemic-window patterns are described using year-on-year percentage changes and two-segment net changes (2019→2021 and 2021→2023), each with Monte Carlo-propagated UIs (Section 2.5.3). These analyses are explicitly descriptive: where propagated UIs include zero—as they generally do at this temporal resolution—they are interpreted as directional patterns only, and we do not claim statistical significance for any pandemic-window change.
2.5.3. Monte Carlo Propagation of Uncertainty for Changes and Ratios
UIs for percentage changes between two years, and for ratios between causes or strata, were propagated by Monte Carlo simulation (20,000 draws per estimate), modeling each published value as a truncated normal distribution (rejection-sampled at zero) with standard deviation (upper − lower)/3.92; ratio estimates are reported as the median with 2.5th and 97.5th percentiles. Because draws sharing location and models are positively correlated, the independence assumption widens the propagated intervals relative to a draw-level computation; reported change UIs are conservative in width.
2.5.4. Aggregation of Uncertainty Intervals Across Age Bands
For author-computed sums across age bands, UIs were approximated by converting each row’s UI to a half-width, (upper − lower)/2, and combining half-widths by root-sum-of-squares assuming independence; pooled UIs are somewhat narrower than an official joint-distribution aggregation.
2.5.5. Joinpoint Segmentation of Long-Term Trends
As a complement to the single-slope EAPC, continuous segmented log-linear (joinpoint) models were fitted to ln(rate) on calendar year for the global and SDI-quintile crude mortality and incidence series, 1990–2023. Candidate models with 0–3 joinpoints were exhaustively grid-searched (minimum four observations per segment) and selected by the Bayesian information criterion (BIC). We report segment annual percent changes (APCs) and the span-weighted average APC (AAPC) with t-distribution 95% confidence intervals that, like the EAPC intervals, reflect regression precision only (Supplementary Table S12).
2.5.6. Interrupted Time Series Analysis
As a formal test of the pandemic-window reversal, single-intervention interrupted time series (ITS) segmented regression models were fitted to ln(crude mortality rate) on calendar year, 1990–2023, for the global series and each SDI quintile: ln(rate) = β0 + β1·time + β2·post + β3·time_after, where post indicates years at or after the intervention year τ and time_after counts years since τ. τ was data-driven, selected by BIC among {2019, 2020, 2021}. Standard errors used the Newey–West heteroskedasticity- and autocorrelation-consistent (HAC) estimator (lag = ⌊n^1/3⌋). We report the immediate level change (100·(e^β2−1), %), the slope change (100·(e^β3−1), %/yr), and the 2023 deviation of the fitted series from the counterfactual pre-intervention trend extrapolated to 2023 (%; 95% CI). Full parameter estimates are given in Supplementary Table S14 and its_results_pandemicfaultline.csv.
2.5.7. SDI-Quintile Inequality Indices: SII and CII
Absolute and relative inequality across the five SDI quintiles was summarized for 1990 and 2023 by the slope index of inequality (SII; the population-weighted regression slope of the crude rate on ridit scores derived from quintile population shares) and the concentration index (CII; the fractional-rank concentration index). Because the extraction frame of this study comprises 27 aggregate locations (21 GBD regions, five SDI quintiles and Global) rather than national series, country-level SII/CII was not computable; the indices reported here are quintile-level analogues of the WHO Health Equity Monitor definitions. Rate uncertainty was propagated by bootstrap (1,000 draws; truncated-normal rates with SD = (upper − lower)/3.92) (Supplementary Table S13).
2.6. The Mortality-to-Incidence Ratio as a Comparative Proxy
We define the M/I ratio as deaths divided by incident cases ×100 at ages 0–19 years, by location and year. Three caveats govern its use, by design. First, the denominator is benign-dominated (Section 2.2), diluting absolute values roughly 25-fold relative to malignant-only MIRs; absolute M/I values in this study must not be compared with malignant-only MIRs in the literature [27,28,29]. Second, GBD cancer incidence is itself partly back-derived from mortality estimates using modelled MIRs [1], so the M/I ratio within GBD is not an independent observation of survival; we treat it strictly as a comparative “detection × survival” gradient across locations and years, echoing the caution of Ellis and colleagues [27]. Third, all M/I findings are corroborating evidence; the paper’s primary results (the pandemic reversal, the SDI gradient, the cross-disease repositioning) rest on mortality alone.
2.7. Cross-Disease Comparison Frame
Pediatric (0–19-year) tuberculosis and LRI estimates were computed by the authors from GBD 2023 with the identical pipeline, age caliber, denominators and uncertainty conventions [17,18,19,20,23]. Cause-of-death ratios (neoplasms/tuberculosis; neoplasms/LRI) were computed for 1990 and 2023 with Monte Carlo-propagated UIs (Section 2.5.3). Because all three series descend from the same round, models and denominators, differences between their pandemic-window shapes are informative beyond what any single series could support: identical estimation machinery producing opposite window patterns (a reversal for neoplasms versus continued decline for both infections) argues against a generic modeling artifact, though it cannot exclude cause-specific modeling contributions (Section 4.2).
2.8. Cross-Validation Protocol, Statistics, Ethics and Reporting
Author-aggregated mortality estimates were cross-validated against the official GBD 2023 childhood cancer capstone [1] at the global level for 1990 and 2023. Aggregation and all derived quantities were computed in Python 3.11 from the downloaded CSV files; no new GBD model runs were performed. Age-band shares were computed from point estimates and interpreted compositionally. This secondary analysis of publicly available, de-identified, aggregate data was exempt from institutional review board approval. Reporting follows the Guidelines for Accurate and Transparent Health Estimates Reporting (GATHER) [24]; the completed checklist is provided as Supplementary Material. All underlying estimates are publicly accessible through the GBD Results Tool [18]; raw and author-aggregated CSV files are provided as Supplementary Data, and analysis code is available on reasonable request.
3. Results
3.1. Global Burden at Ages 0–19 Years in 2023 and Long-Term Change (Table 1; Figure 1a–c)
In 2023, neoplasms caused an estimated 148,436 deaths (95% uncertainty interval [UI] 139,201–157,671) at ages 0–19 years worldwide, at a crude rate of 5.56 (5.21–5.90) per 100,000—approximately 407 deaths per day. Incident cases within the Level-2 envelope numbered 10,073,360 (7,943,843–12,202,880; crude rate 377.2 [297.4–456.9] per 100,000); as specified in Section 2.2, approximately 96% of these are benign or in-situ tumors, and all incidence-side quantities in this study are interpreted comparatively.
Figure 1.
Global neoplasm mortality at ages 0–19 years, 1990–2023, and the pandemic-window reversal in comparative context. (a) Global deaths (bars, left axis) and crude mortality rate per 100,000 (line, right axis), 1990–2023; shaded bands are 95% uncertainty intervals (UIs); vertical dashed lines mark 2020 and 2021. (b) Magnified 2013–2023 segment of the mortality series with year-on-year percentage changes: the 2013–2019 plateau, consecutive increases in 2020 (+2.7%) and 2021 (+1.9%) to 152,553 deaths—the highest value since 2008—and the partial 2022–2023 decline, with 2023 deaths (148,436) remaining 1.9% above 2019. (c) Normalized mortality index (1990 = 100) for neoplasms, tuberculosis and lower respiratory infections at ages 0–19 years, same caliber and denominators, 1990–2023; only the neoplasm series turns upward in 2020–2021. Data: GBD 2023 Results (IHME), authors’ aggregation. Notes. Ages 0–19 are the <5, 5–9, 10–14 and 15–19-year bands, both sexes. Pandemic-window changes whose Monte Carlo UIs span zero are directional patterns, not statistically confirmed increases (Section 2.5.2 and Section 2.5.3). (d–e) The pandemic-window change in neoplasm deaths at ages 0–19 years, 2019→2021, by development level. (d) Percentage change in deaths, 2019→2021, across the five Socio-demographic Index (SDI) quintiles and globally: −2.1% (high), +0.9% (high-middle), +6.2% (middle), +5.9% (low-middle), +7.9% (low) and +4.7% (global). (e) Percentage change in deaths, 2019→2021, across the 21 GBD regions, sorted. Error bars are Monte Carlo-propagated 95% uncertainty intervals (20,000 draws; truncated normal; conservative in width); intervals spanning zero indicate directional patterns. Data: GBD 2023 Results (IHME), authors’ aggregation; ages 0–19 years, both sexes.
Figure 1.
Global neoplasm mortality at ages 0–19 years, 1990–2023, and the pandemic-window reversal in comparative context. (a) Global deaths (bars, left axis) and crude mortality rate per 100,000 (line, right axis), 1990–2023; shaded bands are 95% uncertainty intervals (UIs); vertical dashed lines mark 2020 and 2021. (b) Magnified 2013–2023 segment of the mortality series with year-on-year percentage changes: the 2013–2019 plateau, consecutive increases in 2020 (+2.7%) and 2021 (+1.9%) to 152,553 deaths—the highest value since 2008—and the partial 2022–2023 decline, with 2023 deaths (148,436) remaining 1.9% above 2019. (c) Normalized mortality index (1990 = 100) for neoplasms, tuberculosis and lower respiratory infections at ages 0–19 years, same caliber and denominators, 1990–2023; only the neoplasm series turns upward in 2020–2021. Data: GBD 2023 Results (IHME), authors’ aggregation. Notes. Ages 0–19 are the <5, 5–9, 10–14 and 15–19-year bands, both sexes. Pandemic-window changes whose Monte Carlo UIs span zero are directional patterns, not statistically confirmed increases (Section 2.5.2 and Section 2.5.3). (d–e) The pandemic-window change in neoplasm deaths at ages 0–19 years, 2019→2021, by development level. (d) Percentage change in deaths, 2019→2021, across the five Socio-demographic Index (SDI) quintiles and globally: −2.1% (high), +0.9% (high-middle), +6.2% (middle), +5.9% (low-middle), +7.9% (low) and +4.7% (global). (e) Percentage change in deaths, 2019→2021, across the 21 GBD regions, sorted. Error bars are Monte Carlo-propagated 95% uncertainty intervals (20,000 draws; truncated normal; conservative in width); intervals spanning zero indicate directional patterns. Data: GBD 2023 Results (IHME), authors’ aggregation; ages 0–19 years, both sexes.
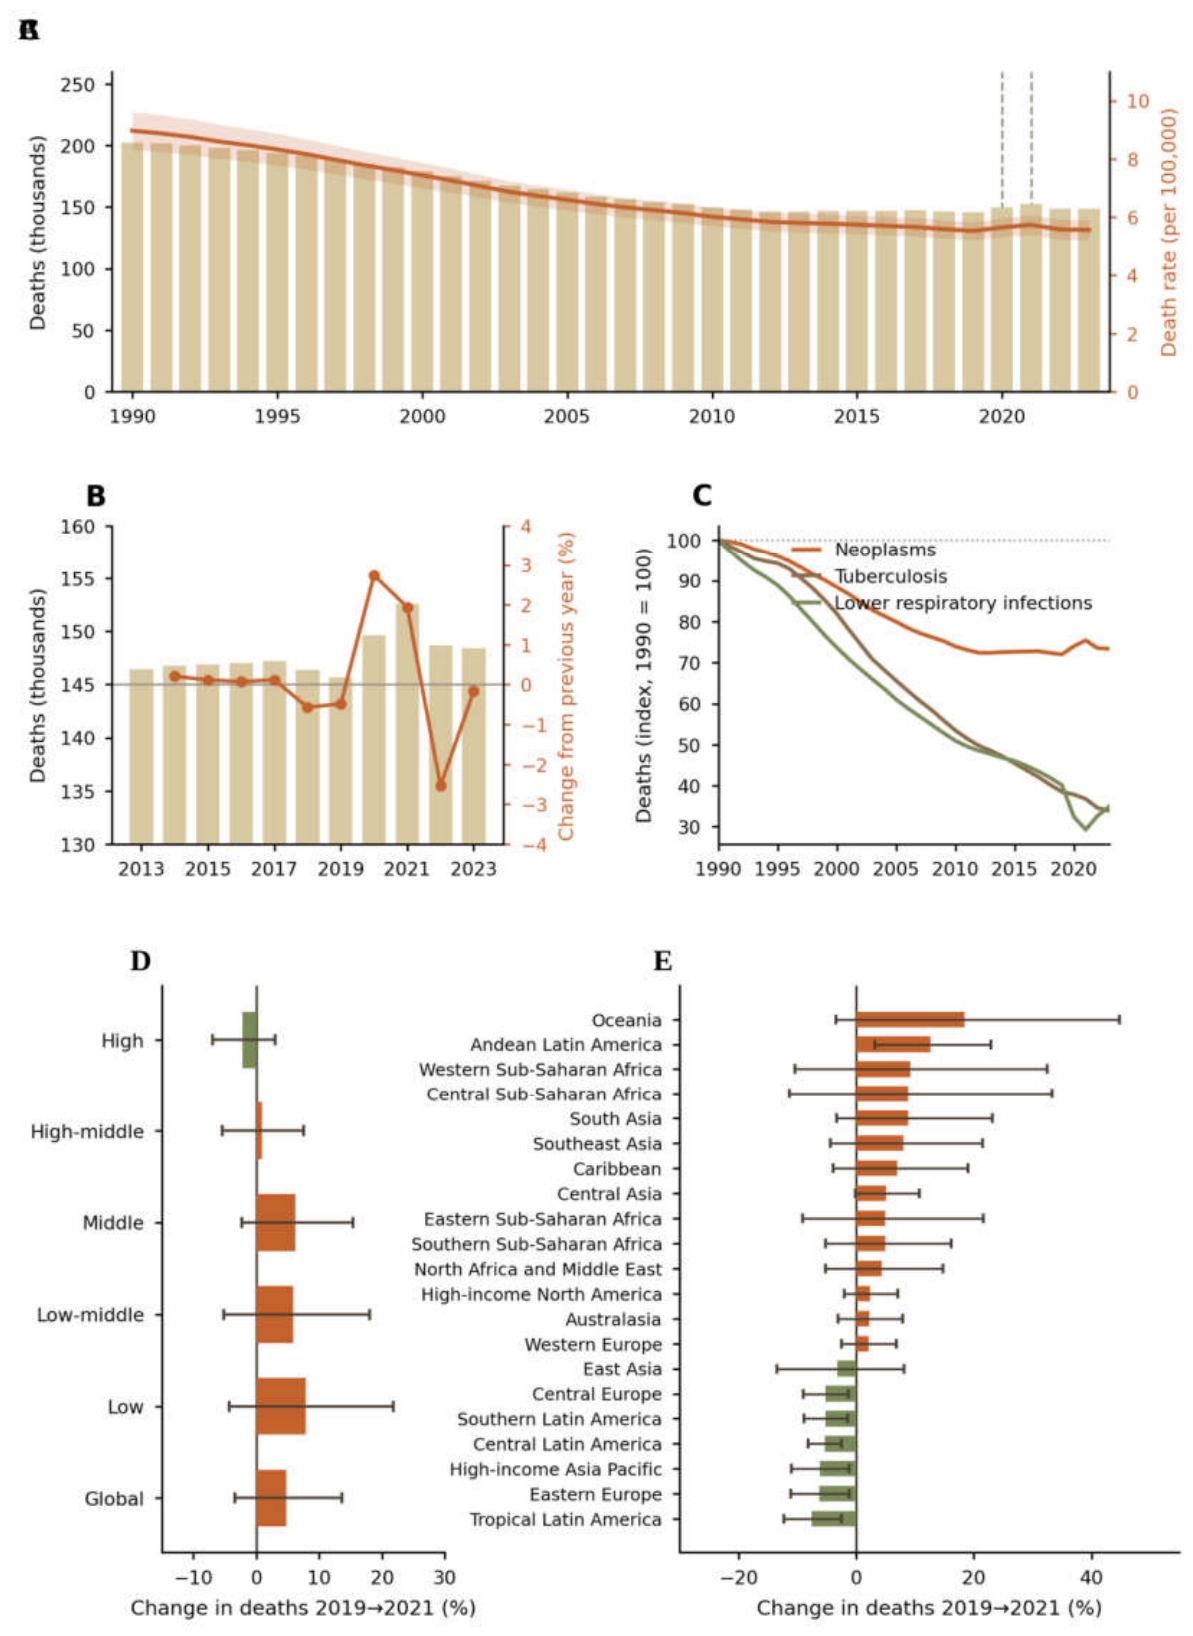
Between 1990 and 2023, deaths fell by 26.6% (95% UI −33.3 to −19.1), from 202,285 (187,663–216,907), and the crude mortality rate fell by 38.0% (−43.6 to −31.7), from 8.97 (8.32–9.62) per 100,000 (Table 1). Incident cases fell by 15.4% (−37.8 to +15.7) and the crude incidence rate by 28.6% (−47.3 to −3.4) over the same period. The annual mortality trajectory (Figure 1a) declines monotonically from 1990 to 2013, enters a plateau between 2013 and 2019 (146,443 to 145,655 deaths), and is interrupted in 2020–2021 (Section 3.3). Global incidence showed no pandemic-era dip: the series was essentially flat across 2015–2022 at about 10.1–10.2 million cases per year, with a single-year decline of 1.4% in 2023.
3.2. Long-Term Rate Trends: The Slowest Decline, Ordered by Development
Over 1990–2023, the global 0–19-year crude mortality rate declined at an EAPC of −1.61 (95% CI −1.74 to −1.47) per year and the incidence rate at −1.08 (−1.12 to −1.03). The mortality decline was the slowest among the three same-pipeline pediatric causes: tuberculosis declined at −3.96 and lower respiratory infections at −3.89 per year (Section 3.7).
Decline speed was broadly graded by development. Across SDI quintiles, mortality-rate EAPCs were −2.82 (high SDI), −2.36 (high-middle), −1.22 (middle), −1.13 (low) and −1.09 (low-middle)—a broadly graded pattern in which lower-SDI quintiles improved more slowly. Regionally, 26 of the 27 locations declined; the fastest declines occurred in East Asia (−3.45 [−3.58 to −3.32]), Eastern Europe (−3.01), Central Europe (−2.89), High-income Asia Pacific (−2.86) and high-SDI countries as a group (−2.82), and the slowest in Andean Latin America (−0.28 [−0.48 to −0.07]), Oceania (−0.23 [−0.38 to −0.07]), Central Asia (−0.63) and Central Sub-Saharan Africa (−0.65). Southern Sub-Saharan Africa was the only location whose point estimate rose (+0.14 [−0.02 to +0.29]; interval crossing zero). All four Sub-Saharan African regions improved more slowly than the global average (Eastern Sub-Saharan Africa −1.56, Western Sub-Saharan Africa −1.18). Incidence-rate EAPCs were near zero in most regions—reflecting the sensitivity of the benign-dominated envelope to diagnostic practice—with significant increases in Southeast Asia (+0.31 [+0.19 to +0.43]) and Andean Latin America (+0.29 [+0.26 to +0.33]) and the fastest decline in Tropical Latin America (−1.71).
A formal interrupted time series analysis (§2.5.6; Supplementary Table S14) confirmed and quantified this reversal. For the global mortality series the BIC-optimal intervention year was 2019, with an immediate level increase of 7.5% (95% CI 2.4 to 12.9) and a relative change of +1.88% per year in the post-intervention slope (95% CI 1.21 to 2.55); by 2023 the fitted series exceeded the counterfactual pre-pandemic trend by 15.8% (10.7 to 21.2), a statistically significant deviation that replaces the descriptive 2019→2021 contrast above. The development gradient persisted under formal testing: level changes rose from 1.9% (0.2 to 3.7) in high-SDI countries (τ=2020) to 12.2% (4.4 to 20.4) in low-SDI countries (τ=2019), whose 2023 rate was 17.2% (9.4 to 25.5) above counterfactual. The middle-SDI BIC-optimal intervention year (2020) coincided with the joinpoint inflection identified in Supplementary Table S12.
3.3. The Pandemic Window, 2019–2023 (Figure 1B; Figure 1d–E; Descriptive)
Between 2019 and 2021, global 0–19-year neoplasm deaths rose by 4.7% (95% UI −3.3 to +13.5), from 145,655 (137,640–153,669) to 152,553 (143,552–161,554)—two consecutive annual increases (+2.7% in 2020, +1.9% in 2021) lifting 2021 mortality to its highest level since 2008 (Figure 1b). The crude mortality rate rose by 3.8% over the same span. Between 2021 and 2023 deaths fell by 2.7%, yet 2023 mortality remained 1.9% above the 2019 level: the pre-pandemic trajectory had not been regained by the end of the study period.
The reversal was broadly graded by development (Figure 1d). Across SDI quintiles, 2019→2021 changes in deaths were −2.1% (high), +0.9% (high-middle), +6.2% (middle), +5.9% (low-middle) and +7.9% (low SDI)—a broadly graded gradient from continued decline in the richest settings to the largest increases in the poorest. Regionally (Figure 1E), declines concentrated in high-income and parts of Latin American and European regions (Tropical Latin America −7.6%, Eastern Europe −6.3%, High-income Asia Pacific −6.2%, Central Latin America −5.3%), whereas increases concentrated in lower-resource settings: Oceania +18.5%, Andean Latin America +12.6% (+3.1 to +23.0), Western Sub-Saharan Africa +9.2%, Central Sub-Saharan Africa +8.9% and South Asia +8.8%.
The post-2021 segment was heterogeneous. Globally, deaths declined (−2.7%, 2021→2023), and most rising regions partially receded, but Andean Latin America rose a further 22.9% (+10.4 to +36.1)—the only region with a significant increase in both segments—and Western Europe rebounded by 10.0% (+5.0 to +15.2), a rare high-income exception.
The M/I proxy moved in the direction of worsening outcomes during the window: globally from 1.434% (2019) to 1.493% (2021), a 4.3% point-estimate increase, before partially receding to 1.474% in 2023. By SDI, 2019→2021 M/I changes were −2.3% in high-SDI versus +3.3% in low-SDI and +6.8% in low-middle-SDI countries (point estimates; wide intervals). Global incidence showed no 2020–2021 dip (point change +0.5%); the “diagnostic interruption → incidence trough” hypothesis is not supported in the global envelope series, for reasons that are partly methodological (GBD incidence is back-derived from mortality using modelled MIRs and is structurally insensitive to short-term diagnostic shocks; Section 4.2).
3.4. SDI Gradient and Regional Concentration in 2023 (Table 2)
The 2023 mortality burden was concentrated at the bottom of the development ladder (Table 2). Low-SDI countries recorded 60,508 deaths (55,040–65,976; 40.8% of the global total) at a crude rate of 7.14 per 100,000; low- and low-middle-SDI countries together recorded 84,220 deaths, 56.8% of the global total—versus 90.2% for same-caliber pediatric tuberculosis, reflecting that cancer deaths persist in high-income settings where infectious deaths have receded. The crude mortality gradient across quintiles was about two-fold (7.14 low versus 3.59 high per 100,000).
In stark contrast, the crude incidence gradient ran the opposite direction and was an order of magnitude wider: 847.1 per 100,000 in high-SDI versus 77.7 in low-SDI countries—a 10.9-fold gap. The divergence between a 10.9-fold incidence gradient and a 2.0-fold mortality gradient is the signature, within this composite framework, of cases in low-SDI settings never entering the diagnostic system (the undiagnosed gap; Section 2.2 and Section 4.4).
Regionally, the five largest contributors to 2023 deaths were South Asia (29,978 [26,876–33,080]), Eastern Sub-Saharan Africa (25,196), Western Sub-Saharan Africa (20,103), East Asia (16,919) and North Africa and the Middle East (14,260). The highest crude mortality rates occurred in Andean Latin America (10.59 per 100,000), Eastern Sub-Saharan Africa (10.56) and Western Sub-Saharan Africa (7.13); the lowest in Australasia (2.34) and High-income Asia Pacific (2.60).

Table 2.
Neoplasm burden at ages 0–19 years by Socio-demographic Index (SDI) quintile, 2023, with pandemic-window change and mortality-to-incidence (M/I) proxy.
Table 2.
Neoplasm burden at ages 0–19 years by Socio-demographic Index (SDI) quintile, 2023, with pandemic-window change and mortality-to-incidence (M/I) proxy.
| SDI quintile | Deaths 2023 (95% UI) | Death rate per 100,000 | Incidence rate per 100,000 | Share of global deaths | Deaths %Δ 2019→2021 | M/I 1990 (%) (95% UI) | M/I 2023 (%) (95% UI) | M/I EAPC 1990–2023 |
| Low | 60,508 (55,040–65,976) | 7.14 | 77.7 | 40.8% | +7.9% | 12.60 (10.07–16.01) | 9.20 (7.53–11.59) | −1.05 |
| Low-middle | 23,711 | 5.20 | 149.1 | 16.0% | +5.9% | 4.36 | 3.49 (2.81–4.49) | −0.71 |
| Middle | 19,181 | 5.72 | 438.7 | 12.9% | +6.2% | 1.70 | 1.30 (1.06–1.68) | −0.98 |
| High-middle | 24,643 | 5.30 | 530.7 | 16.6% | +0.9% | 1.67 | 1.00 (0.81–1.29) | −1.73 |
| High | 20,280 | 3.59 | 847.1 | 13.7% | −2.1% | 0.87 (0.71–1.11) | 0.42 (0.35–0.54) | −2.45 |
| Global | 148,436 (139,201–157,671) | 5.56 | 377.2 | 100% | +4.7% | 1.70 (1.38–2.19) | 1.47 (1.20–1.88) | −0.54 |
Data source: GBD 2023 Results Tool, authors’ aggregation. Counts are 0–19-year sums (both sexes; UIs pooled by root-sum-of-squares); rates are crude. SDI quintiles are as defined by the GBD 2023 round. Pandemic-window changes are Monte Carlo point estimates whose propagated UIs generally span zero (directional only; Section 2.5.2). The M/I denominator includes benign and in-situ tumors: absolute M/I values are diluted roughly 25-fold relative to malignant-only mortality-to-incidence ratios and support relative comparisons only; GBD incidence is partly back-derived from mortality, so M/I is a comparative “detection × survival” proxy, not an independent survival estimate (Section 2.2 and Section 2.6).
3.5. The M/I Divide and Its Widening (Figure 2)
The global M/I ratio fell from 1.70% (1.38–2.19) in 1990 to 1.47% (1.20–1.88) in 2023 (EAPC −0.54 [−0.65 to −0.42])—a modest aggregate improvement that conceals a widening divide (Table 2; Figure 2a). High-SDI countries halved their M/I (0.87 to 0.42; EAPC −2.45), reaching 0.42% in 2023, whereas low-SDI countries improved from 12.60% (10.07–16.01) only to 9.20% (7.53–11.59). The low-to-high-SDI M/I gap thereby widened from 14.5-fold in 1990 to 21.7-fold in 2023—relative inequality grew by roughly half over the study period (Figure 2b). At the regional extremes in 2023, the M/I ratio ranged from 0.19% (0.15–0.24) in Eastern Europe to 21.18% (17.64–25.78) in Eastern Sub-Saharan Africa, a 113-fold span. Improvement was fastest in East Asia (EAPC −3.40; a 62.5% reduction over 1990–2023), Eastern Europe (−2.99) and High-income Asia Pacific (−2.83). Two regions moved in the wrong direction: the M/I ratio rose in Tropical Latin America (EAPC +0.84 [+0.64 to +1.04]) and Southern Sub-Saharan Africa (+0.12 [+0.005 to +0.24]).
3.6. The Adolescent Shift and the Pandemic Age Fault Line (Figure 3a,B)
Unlike the infectious comparators—whose burden concentrates under age 5—the 0–19-year neoplasm burden is dominated by older children and adolescents, and is progressively “adolescentizing”. The under-5 share of deaths fell from 34.5% in 1990 (69,718 deaths) to 28.4% in 2023 (42,222), while the 15–19-year band became the largest single contributor in 2023 (41,182 deaths; 27.7% of the total), and ages 5–19 together accounted for 71.6% of deaths. Long-term improvement was broadly worse at older ages: between 1990 and 2023, deaths fell by 39.5% (−51.0 to −24.9) under age 5 and by 31.2% at ages 5–9, but by only 15.3% (−27.7 to −0.9) at ages 15–19 and 10.9% (−24.6 to +5.1) at ages 10–14.
Figure 3.
The age fault line and the cross-disease repositioning of childhood neoplasm mortality. (a) Deaths at ages 0–19 years by age band (<5, 5–9, 10–14, 15–19 years) in 1990, 2010, 2019 and 2023 (stacked bars), with the under-5 share declining from 34.5% to 28.4% and the 15–19-year band becoming the largest single contributor in 2023 (41,182 deaths; 27.7%). (b) Percentage change in deaths, 2019→2023, by age band: −6.3% (<5 years) versus +6.4% (10–14 years) and +8.0% (15–19 years); error bars are Monte Carlo-propagated 95% uncertainty intervals; intervals spanning zero are directional only. (c) Cause-of-death ratios at ages 0–19 years, 1990 versus 2023: neoplasm-to-tuberculosis deaths 0.78 (0.61–1.06) to 1.69 (1.34–2.26)—the crossover—and neoplasm-to-LRI deaths 9.9% (8.4–12.0) to 20.9% (17.4–25.9); comparator series computed with the identical pipeline, age caliber and denominators. Data: GBD 2023 Results (IHME), authors’ aggregation; both sexes. LRI, lower respiratory infection. GATHER checklist. Provided as Supplementary Material.
Figure 3.
The age fault line and the cross-disease repositioning of childhood neoplasm mortality. (a) Deaths at ages 0–19 years by age band (<5, 5–9, 10–14, 15–19 years) in 1990, 2010, 2019 and 2023 (stacked bars), with the under-5 share declining from 34.5% to 28.4% and the 15–19-year band becoming the largest single contributor in 2023 (41,182 deaths; 27.7%). (b) Percentage change in deaths, 2019→2023, by age band: −6.3% (<5 years) versus +6.4% (10–14 years) and +8.0% (15–19 years); error bars are Monte Carlo-propagated 95% uncertainty intervals; intervals spanning zero are directional only. (c) Cause-of-death ratios at ages 0–19 years, 1990 versus 2023: neoplasm-to-tuberculosis deaths 0.78 (0.61–1.06) to 1.69 (1.34–2.26)—the crossover—and neoplasm-to-LRI deaths 9.9% (8.4–12.0) to 20.9% (17.4–25.9); comparator series computed with the identical pipeline, age caliber and denominators. Data: GBD 2023 Results (IHME), authors’ aggregation; both sexes. LRI, lower respiratory infection. GATHER checklist. Provided as Supplementary Material.
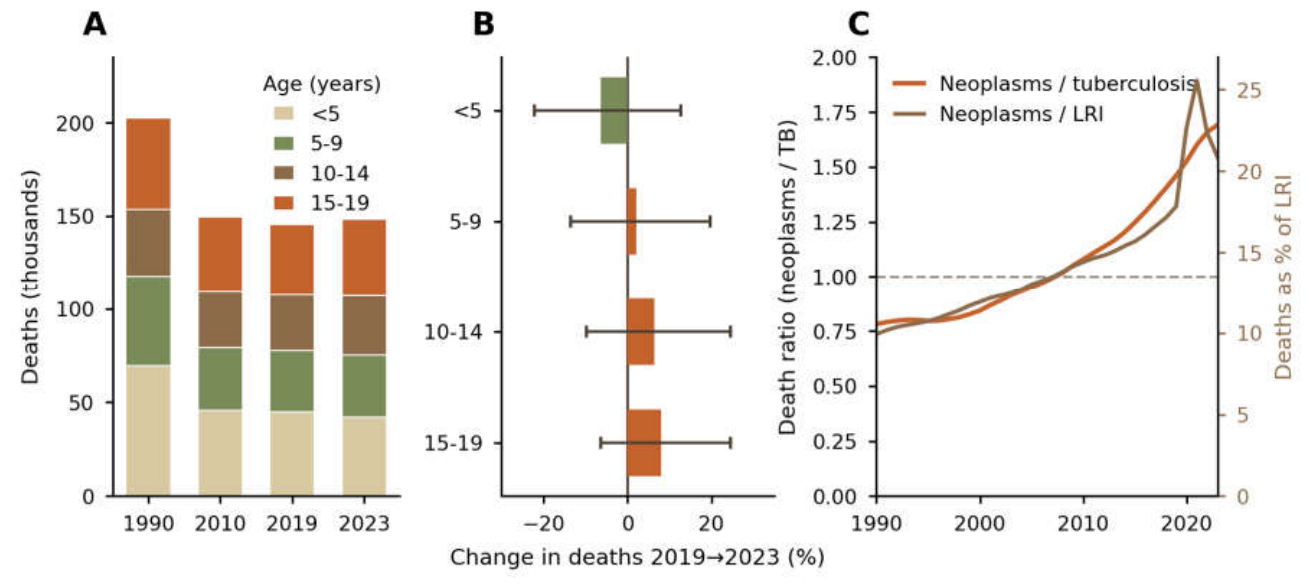
The pandemic era sharpened this gradient into a fault line (Figure 3b). Between 2019 and 2023, deaths fell by 6.3% under age 5 but rose by 6.4% at ages 10–14 and by 8.0% (−6.3 to +24.5) at ages 15–19—the band whose deaths increased most across the pandemic window on point estimates.
3.7. Cross-Disease Repositioning: The Overtaking of Tuberculosis (Figure 3c)
In 1990, neoplasms at ages 0–19 years caused 0.78 (0.61–1.06) deaths for every tuberculosis death (202,285 versus 259,063) and 9.9% (8.4–12.0) as many deaths as lower respiratory infections (about 2.04 million). By 2023, the neoplasm-to-tuberculosis death ratio had more than doubled to 1.69 (1.34–2.26)—148,436 versus 87,764 (65,765–109,764)—completing the crossover, and the neoplasm-to-LRI ratio had doubled to 20.9% (17.4–25.9; LRI deaths 711,713 [579,607–843,819]). The repositioning is driven by differential decline speed (mortality EAPCs: neoplasms −1.61, tuberculosis −3.96, LRI −3.89) and by the pandemic window, in which neoplasms reversed while both infections continued to decline (Figure 1c). Childhood neoplasms now kill about 407 children and adolescents per day—1.7 times the pediatric tuberculosis toll—while commanding a far younger and smaller global governance apparatus (Section 1.1.2 and Section 4.6). For official-capstone context, childhood cancer was the eighth leading cause of death in children in 2023 and ninth in all-cancer DALY rankings [1].
3.8. Cross-Validation Against the Official GBD 2023 Childhood Cancer Capstone
Our aggregated mortality estimates aligned with the official malignant-only analysis [1]: for 2023, 148,436 (139,201–157,671) versus 144,000 (131,000–162,000) deaths; for 1990, 202,285 (187,663–216,907) versus 197,000 (173,000–218,000)—point-value differences of 3–4% with fully overlapping uncertainty intervals at both anchors, consistent with the near-zero lethality of the benign component of the envelope (Section 2.2). The official estimate of malignant incident cases (377,000 [288,000–489,000] in 2023) corroborates that ~96% of our envelope’s incident cases are benign or in-situ, justifying the comparative-only use of incidence-side quantities throughout.
3.9. Data-Driven Joinpoint Segmentation (Supplementary Table S12)
BIC-selected joinpoint models refined the single-slope trend picture (Supplementary Table S12). Global mortality was best described by three joinpoints (1995, 2006 and 2013): the decline was steepest in 1995–2006 (APC −2.35% per year, 95% CI −2.45 to −2.26), decelerated in 2006–2013 (−1.57% [−1.72 to −1.43]) and flattened further in 2013–2023 (−0.34% [−0.46 to −0.22]); the 1990–2023 AAPC was −1.44% (−1.48 to −1.41). Global incidence showed three joinpoints (1998, 2007, 2014) with a terminal 2014–2023 APC of −0.37% (−0.42 to −0.32). Critically for the pandemic question, the grid search placed the final mortality joinpoint at 2019 in the middle- and high-middle-SDI quintiles and at 2020 in the high-SDI quintile, with non-negative terminal-segment APCs (high-middle +0.25% [0.10 to 0.40]; high +0.52% [0.01 to 1.03]; middle −0.23% [−0.73 to +0.26]), while the low-SDI series had already turned upward from 2011 (+0.27% [0.14 to 0.40]). The 2019–2021 mortality reversal therefore sits at the end of a decade-long, development-graded deceleration, and the joinpoint analysis independently locates the 2019–2020 inflection that Section 3.3 describes descriptively.
3.10. SDI-Quintile Inequality Indices, 1990 Versus 2023 (Supplementary Table S13)
Quintile-level inequality indices quantified the widening divide (Supplementary Table S13). The mortality SII moved from −0.69 per 100,000 (95% CI −2.06 to +0.89) in 1990—statistically indistinguishable from zero—to −4.28 per 100,000 (−5.14 to −3.34) in 2023, and the mortality concentration index from −0.012 (−0.036 to +0.016) to −0.121 (−0.142 to −0.098): concentration of child cancer deaths at the bottom of the development ladder emerged and deepened over the study period. Incidence inequality ran in the opposite direction and persisted (SII +1191.9 [+928.8 to +1453.6] per 100,000 in 1990 and +1030.1 [+832.1 to +1225.7] in 2023; CII +0.358 [0.310 to 0.396] and +0.431 [0.388 to 0.467]), the ascertainment-dominated pattern discussed in Section 3.4.
4. Discussion
4.1. Principal Findings
Four findings emerge from this mortality-centered analysis of GBD 2023. First, the three-decade decline in childhood and adolescent cancer mortality reversed in the pandemic window: global deaths at ages 0–19 years rose 4.7% between 2019 and 2021, reaching the highest level since 2008, and had not returned to the 2019 level by 2023. Second, the reversal was broadly graded by development—from a 2.1% decline in high-SDI to a 7.9% increase in low-SDI settings—superimposing the pandemic onto a pre-existing fault line along which both the speed of long-term decline (EAPC −2.82 to −1.09) and the detection-and-survival proxy (M/I) are already ordered. Third, childhood neoplasms have overtaken childhood tuberculosis as a cause of death (ratio 0.78 to 1.69) while declining more slowly than both infectious comparators, making them one of the most resistant major causes of child death to further reduction. Fourth, the burden is adolescentizing: the 15–19-year band is now the largest single contributor to deaths among ages 5–19 years and the band whose mortality rose most across 2019–2023, while the low-to-high-SDI gap in the M/I proxy widened from 14.5-fold to 21.7-fold.
4.2. The Pandemic Reversal: A Data-and-Model Signal, Interpreted with Care
We deliberately present the 2020–2021 reversal as a signal, not a demonstrated excess of deaths causally attributable to the pandemic. GBD 2023 cause-of-death estimates are model-based (CODEm on vital registration, verbal autopsy and registry data), and the GBD 2023 round incorporated pandemic-period mortality-shock covariates [17]; the observed uptick is therefore a hybrid of data and estimation method, and the propagated uncertainty intervals around the window changes include zero at the global level. Three features nonetheless argue that the signal carries substantive information rather than being a generic artifact. First, its social anatomy: a broadly graded SDI ordering (high −2.1% to low +7.9%) is precisely the pattern expected if fragile health systems absorbed larger diagnostic and treatment disruptions, and is not a pattern a generic modeling shock would obviously produce. Second, its cause specificity: the identical estimation machinery, run by the same pipeline on the same denominators, produced continued monotone decline for pediatric tuberculosis and LRI over the same window [17,18,19,20,23]; whatever the models did, they did not do it uniformly. Third, convergent facility-level evidence of disruption—treatment modifications and reduced capacity across 213 institutions in 79 countries [13], treatment changes among infected children with cancer [14], and diagnostic delays reported in single-center and national series [15,16]—supplies a plausible mechanism on the care-delivery side.
Equally instructive is what did not happen: global incidence showed no pandemic dip. This null should not be read as evidence that diagnosis was uninterrupted, because GBD cancer incidence is partly back-derived from mortality using modelled MIRs and is structurally insensitive to short-term diagnostic shocks [1]; the correct interpretation is that the mortality series, not the incidence series, is where a diagnostic-treatment disruption would surface in this framework. The post-2021 segment adds texture rather than closure: deaths receded globally (−2.7%) but remained above 2019, Andean Latin America deteriorated further (+22.9% [+10.4 to +36.1]), and Western Europe rebounded (+10.0% [+5.0 to +15.2]), hinting that deferred diagnoses and strained services were not confined to low-income settings. Triangulation against cancer-registry incidence for 2020–2022, national mortality statistics, and the next GBD round will be needed to apportion the signal between real excess mortality and estimation method.
4.3. The Widening Survival Divide and the GICC 2030 Horizon
The pandemic window did not create the survival divide; it widened it. Even before 2020, the speed of mortality decline was broadly slower at lower SDI (EAPC −2.82 in high-SDI to −1.09 in low-middle-SDI countries)—in contrast to pediatric tuberculosis, for which even low-SDI settings sustained a −4.04 annual decline in our companion series [18,20]. The “technology dividend” of pediatric oncology—protocol therapy, supportive care, risk stratification—has accrued disproportionately to wealthy settings, as registry-based survival studies document [5,6,8,21]. Our M/I proxy quantifies the consequence: a low-to-high-SDI gap that grew from 14.5-fold to 21.7-fold between 1990 and 2023, with two regions (Tropical Latin America, Southern Sub-Saharan Africa) moving in the wrong direction outright.
For the WHO Global Initiative for Childhood Cancer—targeting at least 60% global survival by 2030 [7]—our estimates provide an independent mid-course datum from a mortality-centered frame: the pandemic window pushed the survival proxy backward by 4.3% on point estimates globally, with the deterioration concentrated exactly where the initiative’s targets are most binding (low-SDI +3.3%, low-middle-SDI +6.8%). The first WHO country-level childhood cancer survival estimates cover 2017–2021 [10] and therefore predate most of the window’s aftermath; GBD-based mortality tracking, updated annually, can serve as a complementary monitoring stream, provided the M/I proxy is interpreted comparatively (Section 2.6 and Section 4.8). The cost-effectiveness case for acting is established: treating childhood cancers such as acute lymphoblastic leukemia and Burkitt lymphoma ranks among the most cost-effective interventions in global health even in low-income settings [30].
4.4. The Diagnostic Fault Line
The most structural evidence of inequity in our results is the divergence between gradients: a 10.9-fold incidence-rate gap between high- and low-SDI settings (847.1 versus 77.7 per 100,000) against only a 2.0-fold mortality-rate gap (3.59 versus 7.14). Simulation studies have long argued that a large share of childhood cancers in low-income settings are never diagnosed—the Lancet Oncology Commission estimated roughly 413,000 incident cases globally in 2020, of whom about 181,000 (nearly half) were undiagnosed [3,21]. Our composite indicator points the same direction, but with an explicit caveat: because ~96% of the envelope’s incident cases are benign or in-situ tumors, the incidence gradient partly reflects benign-tumor detection intensity—health-system contact and imaging capacity—rather than malignant-case ascertainment alone. Even so, the direction is consistent with the simulation literature, and the implication is sobering: where few tumors are registered, children are not spared cancer; they die of it outside the diagnostic system, surfacing only in mortality statistics. Investments in registry coverage, pathology capacity and referral pathways are thus surveillance investments as much as clinical ones [2,3,6].
4.5. The Adolescent Fault Line
The burden’s shift toward adolescents is a second, quieter fault line. Ages 5–19 years now account for 71.6% of deaths; the 15–19-year band is the largest single contributor (41,182 deaths in 2023); long-term improvement was worst at ages 10–14 (−10.9% since 1990, interval crossing zero); and across 2019–2023, deaths rose at ages 10–14 (+6.4%) and 15–19 (+8.0%) while falling under age 5 (−6.3%). Adolescents and young adults occupy a recognized no-man’s-land between pediatric and adult oncology services, with distinct tumor spectra, poorer trial enrolment and—in many LMICs—no dedicated pathway at all [2,6,8]. That this band alone worsened through the pandemic window suggests adolescent services were disproportionately fragile to disruption, a hypothesis that cancer-type-disaggregated and registry data should test.
4.6. Cross-Disease Governance: The Slowest-Declining Cause with the Youngest Architecture
The crossover documented here—childhood cancer deaths now 1.7 times childhood tuberculosis deaths, and one fifth of the childhood pneumonia toll—has a governance asymmetry attached. Tuberculosis has been governed by the End TB Strategy since 2014 with quantified milestones [11,20]; pneumonia by GAPPD since 2013 [12]; childhood cancer acquired its first global initiative only in 2018 [7]. The inclusion of childhood cancer in the 2025 UN political declaration on NCDs [9] is an opening, but declarations do not deliver chemotherapy, radiotherapy, pathology or pediatric surgical capacity. Our results suggest the marginal returns—in deaths averted per unit of sustained effort—now favor closing the pediatric oncology gap in exactly the low-SDI settings where the pandemic reversal was largest and where progress toward GICC targets will be decided.
4.7. Comparison with Previous Studies
This analysis is complementary to, and bounded by, the official GBD 2023 childhood cancer capstone [1]. That analysis provides the authoritative malignant-only account—including nine newly modelled cancer types, cancer-type detail showing GICC-target cancers accounting for 47.3% of deaths, and the 55.6% increase in African-region deaths since 1990—but does not examine the 2019–2021 window; we provide the window analysis, the SDI ordering of the reversal, the cross-disease repositioning and the M/I gradient dynamics, within an explicit scope framework that keeps all primary inference on the mortality side. The agreement of our mortality estimates with the capstone (3–4% point difference, fully overlapping intervals at the 1990 and 2023 anchors) is mutual corroboration across independent aggregations of the same round. Relative to the GBD 2017-round analysis of Force and colleagues [8], which ended in 2017, our series adds the six most recent years—including the entire pandemic window—on the current round’s estimates.
The M/I literature tempers and contextualizes our proxy results. A GBD 2021-based analysis of pediatric cancer MIRs across 204 countries reported a median MIR of 0.41 with the widest low-versus-high-SDI gaps in highly treatable cancers [28], and a MENA regional analysis found MIR strongly correlated with SDI [29]; Ellis and colleagues caution that MIRs are not valid survival proxies at the individual-country level [27]. Our use is narrower than all of these: a within-framework, across-location relative gradient with benign-diluted absolute values, corroborating—not replacing—registry-based survival evidence [5,10,21].
4.8. Limitations
Five limitations qualify these findings. First, the incidence envelope is benign-dominated (~96% of 2023 incident cases), so incidence levels, incidence trends, the incidence-mortality gradient and M/I absolute values are composite measures used comparatively only; they cannot be benchmarked against malignant-only MIRs [27,28,29]. This does not affect the mortality-based main line (Section 2.2 and Section 3.8). Second, the M/I proxy is partially circular within GBD, because incidence is back-derived from mortality using modelled MIRs [1]; we therefore use it as corroborating evidence only. Third, the pandemic-window reversal is a data-and-model hybrid: GBD 2023 CODEm models incorporate pandemic-period shock covariates [17], the propagated window UIs include zero globally, and we make no pure causal claim—only that the signal’s broadly graded SDI anatomy, cause specificity and facility-level convergent evidence justify urgent triangulation. Fourth, the Level-2 envelope masks cancer-type heterogeneity—leukemias contribute roughly a third of childhood cancer deaths, with brain tumors and lymphomas differing in treatability [1,2]; cancer-type-disaggregated analysis, which the official capstone provides, is the necessary next step for our framework as well. Fifth, technical conventions: the extraction contained numbers only, so crude rates rest on back-calculated denominators without denominator uncertainty; pooled UIs (root-sum-of-squares) are slightly narrow while Monte Carlo change UIs are conservative; and sex-stratified analysis was not part of this release. Registry triangulation of the 2020–2022 window remains the decisive external test.
The interrupted time series analyses carry four additional caveats. First, residual autocorrelation was substantial (for the global mortality series, Durbin–Watson = 0.46; Ljung–Box(3) P ≈ 5 × 10⁻¹⁰); Newey–West HAC standard errors were used throughout, but a sensitivity refit under an explicit AR(1) error model attenuated the level-shift estimate to non-significance while the slope-change estimate remained positive and significant, so ITS level-shift significance is interpreted cautiously. Second, the intervention year τ was selected post hoc by BIC among {2019, 2020, 2021}, and the nominal confidence intervals do not incorporate this selection uncertainty. Third, because the BIC-optimal τ of 2019 for the global series predates the pandemic, the estimated level jump cannot be attributed purely to COVID-19. Fourth, ITS confidence intervals reflect regression precision on the point-estimate series only and do not incorporate the GBD 95% uncertainty intervals; they therefore answer a different question from the UI-based descriptive comparisons above. In addition, the parallel testing of six series was not adjusted for multiplicity, so single-series ITS results are best read as supportive rather than definitive evidence.
5. Conclusions
Childhood and adolescent cancer mortality—declining for three decades—reversed in the pandemic window, rising 4.7% between 2019 and 2021 to its highest level since 2008, along a fault line broadly graded by development: continued decline in high-SDI settings, increases approaching 8% in low-SDI settings, and no full recovery by 2023. The pandemic did not create this fault line; it stress-tested and widened it, on top of a detection-and-survival gap that had already grown from 14.5-fold to 21.7-fold since 1990 and a burden that has quietly overtaken pediatric tuberculosis while declining more slowly than any infectious comparator. We present the reversal as a data-and-model signal requiring triangulation, not a settled causal fact. But the policy implication does not depend on that apportionment: unless the diagnostic-treatment gap between rich and poor settings is closed, the next system shock—pandemic, conflict or fiscal—will again be absorbed by the children least able to survive it, and the 2030 childhood cancer survival targets will be decided there.
Supplementary Materials
The following supporting information can be downloaded at the website of this paper posted on Preprints.org.
Funding
Beijing Science and Technology Nova Program Interdisciplinary Project (20230484439) and Beijing High-Level Public Health Technical Talents Project (2023-02-33).
Ethics approval and consent to participate
This study is a secondary analysis of de-identified, aggregate, publicly available estimates from the Global Burden of Disease (GBD) Study 2023, coordinated by the Institute for Health Metrics and Evaluation (IHME). No individual-level or identifiable data were accessed. In accordance with institutional policy for research on publicly available aggregate data, this study was exempt from institutional review board approval. No participant consent was required.
Consent for publication
Not applicable.
Availability of data and materials
All estimates analyzed in this study were downloaded by the authors from the GBD Results Tool (https://vizhub.healthdata.org/gbd-results/), GBD 2023 round, using fully specified, reproducible queries (cause: neoplasms [Level 2]; measures: deaths, incidence; numbers with 95% uncertainty intervals). The unmodified raw CSV extractions, together with the author-aggregated derived datasets (0–19-year totals, yearly series, SDI and regional stratifications, EAPC tables, pandemic-window changes, M/I tables, and cross-validation against the official childhood cancer capstone), are provided as Supplementary Data S1. Python analysis code is available from the corresponding author on reasonable request.
Competing interests
The authors declare no competing interests.
Authors’ contributions
Conceptualization: SC; Data curation: DL; Formal analysis: SC; Investigation: SC; Methodology: SC; Software: SC; Validation: HC; Visualization: SC; Writing—original draft: SC; Writing—review and editing: all authors; Supervision: SC; Funding acquisition: SC. SC is the principal investigator who conceived the study and leads its overall conduct. All authors read and approved the final manuscript.
Use of artificial intelligence
Declaration of generative AI use: AI tools were used for language polishing and code drafting.
Acknowledgments
We thank the Institute for Health Metrics and Evaluation (IHME), University of Washington, for making the GBD 2023 estimates publicly available through the GBD Results Tool, and the Global Burden of Disease Collaborator Network, whose primary data collection and modeling underpin all estimates analyzed here.
GATHER statement
This study adheres to the Guidelines for Accurate and Transparent Health Estimates Reporting (GATHER); the completed checklist is provided as Supplementary Material.
Author information
Chen Shen†,*, Xiaotong Wang†. Beijing Pediatric Research Institute, Beijing Children’s Hospital, Capital Medical University, Beijing, China.
Data availability
All estimates are publicly accessible through the GBD Results Tool (https://vizhub.healthdata.org/gbd-results); author-aggregated datasets and analysis code are available in the Supplementary Materials / from the corresponding author on reasonable request.
Ethics statement
This secondary analysis of publicly available, de-identified, aggregate estimates was exempt from institutional review board approval.
Abbreviations
AYA, adolescent and young adult; CI, confidence interval; CODEm, Cause of Death Ensemble model; DALY, disability-adjusted life-year; EAPC, estimated annual percentage change; GAPPD, Global Action Plan for Pneumonia and Diarrhoea; GBD, Global Burden of Disease; GICC, (WHO) Global Initiative for Childhood Cancer; GATHER, Guidelines for Accurate and Transparent Health Estimates Reporting; GRCCC, Global Registry of COVID-19 in Childhood Cancer; IHME, Institute for Health Metrics and Evaluation; LMIC, low- and middle-income country; LRI, lower respiratory infection; M/I, mortality-to-incidence ratio; MIR, mortality-to-incidence ratio (malignant-only literature); NCD, noncommunicable disease; SDI, Socio-demographic Index; SSA, Sub-Saharan Africa; UI, uncertainty interval; WHO, World Health Organization.
References
- GBD 2023 Childhood Cancer Collaborators. Global burden of cancer in children and adolescents aged 0–19 years, 1990–2023: a systematic analysis for the Global Burden of Disease Study 2023. Lancet 2026, 407(10536), 1360–1373. [Google Scholar] [CrossRef] [PubMed]
- Steliarova-Foucher, E.; Colombet, M.; Ries, L.A.G.; Moreno, F.; Dolya, A.; Bray, F.; et al. International incidence of childhood cancer, 2001–10: a population-based registry study. Lancet Oncol. 2017, 18(6), 719–731. [Google Scholar] [CrossRef] [PubMed]
- Atun, R.; Bhakta, N.; Denburg, A.; Frazier, A.L.; Friedrich, P.; Gupta, S.; et al. Sustainable care for children with cancer: a Lancet Oncology Commission. Lancet Oncol. 2020, 21(4), e185–e224. [Google Scholar] [CrossRef] [PubMed]
- Ward, Z.J.; Yeh, J.M.; Bhakta, N.; Frazier, A.L.; Girardi, F.; Atun, R. Global childhood cancer survival estimates and priority-setting: a simulation-based analysis. Lancet Oncol. 2019, 20(7), 972–983. [Google Scholar] [CrossRef] [PubMed]
- Allemani, C.; Matsuda, T.; Di Carlo, V.; Harewood, R.; Matz, M.; Nikšić, M.; et al. Global surveillance of trends in cancer survival 2000–14 (CONCORD-3): analysis of individual records for 37,513,025 patients diagnosed with one of 18 cancers from 322 population-based registries in 71 countries. Lancet 2018, 391(10125), 1023–1075. [Google Scholar] [CrossRef] [PubMed]
- Lam, C.G.; Howard, S.C.; Bouffet, E.; Pritchard-Jones, K. Science and health for all children with cancer. Science 2019, 363(6432), 1182–1186. [Google Scholar] [CrossRef] [PubMed]
- World Health Organization. CureAll framework: WHO global initiative for childhood cancer—increasing access, advancing quality, saving lives; World Health Organization: Geneva, 2021; Available online: https://www.who.int/publications/i/item/9789240025271.
- GBD 2017 Childhood Cancer Collaborators. The global burden of childhood and adolescent cancer in 2017: an analysis of the Global Burden of Disease Study 2017. Lancet Oncol. 2019, 20(9), 1211–1225. [Google Scholar] [CrossRef] [PubMed]
- United Nations. Political declaration of the fourth high-level meeting of the General Assembly on the prevention and control of noncommunicable diseases and the promotion of mental health and well-being; United Nations: New York, 2025. [Google Scholar]
- World Health Organization. Measuring survival, driving change: advancing equity through the WHO Global Initiative for Childhood Cancer; World Health Organization: Geneva, 2026; Available online: https://www.who.int/publications/i/item/9789240122772.
- World Health Organization. The End TB Strategy; World Health Organization: Geneva, 2015; Available online: https://www.who.int/publications/i/item/WHO-HTM-TB-2015.19.
- World Health Organization; United Nations Children’s Fund. Ending preventable child deaths from pneumonia and diarrhoea by 2025: the integrated Global Action Plan for Pneumonia and Diarrhoea (GAPPD); WHO/UNICEF: Geneva, 2013; Available online: https://www.who.int/publications/i/item/9789241505239.
- Graetz, D.; Agulnik, A.; Ranadive, R.; Vedaraju, Y.; Chen, Y.; Chantada, G.; et al. Global effect of the COVID-19 pandemic on paediatric cancer care: a cross-sectional study. Lancet Child Adolesc. Health 2021, 5(5), 332–340. [Google Scholar] [CrossRef] [PubMed]
- Mukkada, S.; Bhakta, N.; Chantada, G.L.; Chen, Y.; Vedaraju, Y.; Faughnan, L.; et al. Global characteristics and outcomes of SARS-CoV-2 infection in children and adolescents with cancer (GRCCC): a cohort study. Lancet Oncol. 2021, 22(10), 1416–1426. [Google Scholar] [CrossRef] [PubMed]
- Vasquez, L.; Sampor, C.; Villanueva, G.; Maradiegue, E.; García-Lombardi, M.; Gomez-García, W.; et al. Early impact of the COVID-19 pandemic on paediatric cancer care in Latin America. Lancet Oncol. 2020, 21(6), 753–755. [Google Scholar] [CrossRef] [PubMed]
- Sullivan, M.; Bouffet, E.; Rodriguez-Galindo, C.; Luna-Fineman, S.; Khan, M.S.; Kearns, P.; et al. The COVID-19 pandemic: a rapid global response for children with cancer from SIOP, COG, SIOP-E, SIOP-PODC, IPSO, PROS, CCI, and St Jude Global. Pediatr. Blood Cancer 2020, 67(7), e28409. [Google Scholar] [CrossRef] [PubMed]
- GBD 2023 Causes of Death Collaborators. Global burden of 292 causes of death in 204 countries and territories and 660 subnational locations, 1990–2023: a systematic analysis for the Global Burden of Disease Study 2023. Lancet 2025, 406(10513), 1811–1872. [CrossRef] [PubMed]
- Institute for Health Metrics and Evaluation (IHME). GBD Results Tool. Seattle, WA: IHME, University of Washington. Available online: https://vizhub.healthdata.org/gbd-results (accessed on 18 August 2026).
- GBD 2023 Lower Respiratory Infections and Antimicrobial Resistance Collaborators. Global burden of lower respiratory infections and aetiologies, 1990–2023: a systematic analysis for the Global Burden of Disease Study 2023. Lancet Infect. Dis. 2026, 26(4), 343–361. [CrossRef] [PubMed]
- GBD 2021 Tuberculosis Collaborators. Global, regional, and national age-specific progress towards the 2020 milestones of the WHO End TB Strategy: a systematic analysis for the Global Burden of Disease Study 2021. Lancet Infect. Dis. 2024, 24(7), 698–725. [Google Scholar] [CrossRef] [PubMed]
- Ward, Z.J.; Yeh, J.M.; Bhakta, N.; Frazier, A.L.; Atun, R. Estimating the total incidence of global childhood cancer: a simulation-based analysis. Lancet Oncol. 2019, 20(4), 483–493. [Google Scholar] [CrossRef] [PubMed]
- GBD 2023 Demographics Collaborators. Global age-sex-specific all-cause mortality and life expectancy estimates for 204 countries and territories and 660 subnational locations, 1950–2023: a demographic analysis for the Global Burden of Disease Study 2023. Lancet 2025, 406(10513), 1731–1810. [Google Scholar] [CrossRef] [PubMed]
- GBD 2021 Lower Respiratory Infections and Antimicrobial Resistance Collaborators. Global, regional, and national incidence and mortality burden of non-COVID-19 lower respiratory infections and aetiologies, 1990–2021: a systematic analysis from the Global Burden of Disease Study 2021. Lancet Infect. Dis. 2024, 24(9), 974–1002. [CrossRef] [PubMed]
- Stevens, G.A.; Alkema, L.; Black, R.E.; Boerma, J.T.; Collins, G.S.; Ezzati, M.; et al. Guidelines for Accurate and Transparent Health Estimates Reporting: the GATHER statement. Lancet 2016, 388(10062), e19–e23. [Google Scholar] [CrossRef] [PubMed]
- Kim, H.J.; Fay, M.P.; Feuer, E.J.; Midthune, D.N. Permutation tests for joinpoint regression with applications to cancer rates. Stat. Med. 2000, 19(3), 335–351. [Google Scholar] [CrossRef]
- Naghavi, M.; Makela, S.; Foreman, K.; O’Brien, J.; Pourmalek, F.; Lozano, R. Algorithms for enhancing public health utility of national causes-of-death data. Popul Health Metr. 2010, 8, 9. [Google Scholar] [CrossRef] [PubMed]
- Ellis, L.; Belot, A.; Rachet, B.; Coleman, M.P. The mortality-to-incidence ratio is not a valid proxy for cancer survival. J. Glob. Oncol. 2019, 5, 1–9. [Google Scholar] [CrossRef] [PubMed]
- Mao, X.; Wang, X.; Fang, T.; Zhang, X.; Yang, J.; Gao, X.; et al. The disparity and trend of childhood cancer burden in survival perspective: a systematic analysis for the Global Burden of Disease Study 2021. Int. J. Surg. 2026, 112(4), 9189–9202. [Google Scholar] [CrossRef] [PubMed]
- Shukla, A.; Zeidan, R.K.; Saddik, B. Pediatric and adolescent cancer disparities in the Middle East and North Africa (MENA) region: incidence, mortality, and survival across socioeconomic strata. BMC Public Health 2024, 24, 3602. [Google Scholar] [CrossRef] [PubMed]
- Bhakta, N.; Martiniuk, A.L.C.; Gupta, S.; Howard, S.C. The cost effectiveness of treating paediatric cancer in low-income and middle-income countries: a case-study approach using acute lymphocytic leukaemia in Brazil and Burkitt lymphoma in Malawi. Arch. Dis. Child 2013, 98(2), 155–160. [Google Scholar] [CrossRef] [PubMed]
Figure 2.
The mortality-to-incidence (M/I) divide at ages 0–19 years, 1990–2023. (a) Slopegraph of the M/I ratio (deaths per 100 incident cases; logarithmic axis) in 1990 versus 2023 for the five Socio-demographic Index (SDI) quintiles and 21 GBD regions. (b) The low-to-high-SDI M/I gradient, 1990–2023, widening from 14.5-fold to 21.7-fold. (c) Crude incidence rate versus crude mortality rate per 100,000 by SDI quintile, 2023 (dumbbell): a 10.9-fold incidence gradient (847.1 high-SDI versus 77.7 low-SDI) against a 2.0-fold mortality gradient (7.14 versus 3.59)—the composite signature of the undiagnosed gap. Data: GBD 2023 Results (IHME), authors’ aggregation; ages 0–19 years, both sexes. Notes. The M/I denominator includes benign and in-situ tumors (~96% of incident cases in 2023): absolute values are diluted roughly 25-fold relative to malignant-only mortality-to-incidence ratios and support relative comparisons only. GBD incidence is partly back-derived from mortality estimates using modelled MIRs; M/I here is a comparative “detection × survival” proxy, not an independent survival estimate (Section 2.2 and Section 2.6).
Figure 2.
The mortality-to-incidence (M/I) divide at ages 0–19 years, 1990–2023. (a) Slopegraph of the M/I ratio (deaths per 100 incident cases; logarithmic axis) in 1990 versus 2023 for the five Socio-demographic Index (SDI) quintiles and 21 GBD regions. (b) The low-to-high-SDI M/I gradient, 1990–2023, widening from 14.5-fold to 21.7-fold. (c) Crude incidence rate versus crude mortality rate per 100,000 by SDI quintile, 2023 (dumbbell): a 10.9-fold incidence gradient (847.1 high-SDI versus 77.7 low-SDI) against a 2.0-fold mortality gradient (7.14 versus 3.59)—the composite signature of the undiagnosed gap. Data: GBD 2023 Results (IHME), authors’ aggregation; ages 0–19 years, both sexes. Notes. The M/I denominator includes benign and in-situ tumors (~96% of incident cases in 2023): absolute values are diluted roughly 25-fold relative to malignant-only mortality-to-incidence ratios and support relative comparisons only. GBD incidence is partly back-derived from mortality estimates using modelled MIRs; M/I here is a comparative “detection × survival” proxy, not an independent survival estimate (Section 2.2 and Section 2.6).
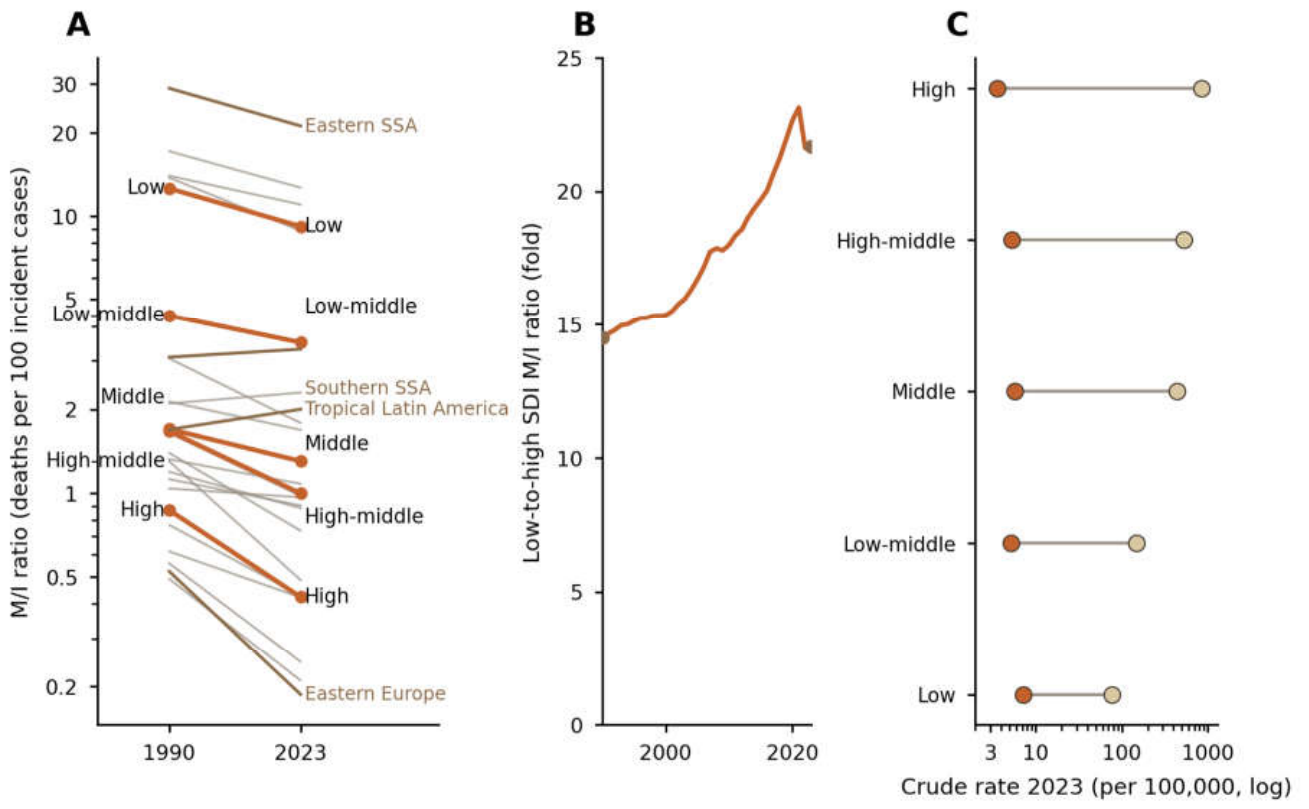
Table 1.
Global neoplasm burden at ages 0–19 years in key years, 1990–2023: numbers and crude rates per 100,000 with 95% uncertainty intervals (UIs), and percentage changes.
Table 1.
Global neoplasm burden at ages 0–19 years in key years, 1990–2023: numbers and crude rates per 100,000 with 95% uncertainty intervals (UIs), and percentage changes.
| Measure | 1990 (95% UI) | 2010 | 2019 (95% UI) | 2021 (95% UI) | 2023 (95% UI) | %Δ 1990→2023 (95% UI) | %Δ 2019→2021 (95% UI) | %Δ 2021→2023 |
| Deaths | 202,285 (187,663–216,907) | 149,541 (141,727–157,355) | 145,655 (137,640–153,669) | 152,553 (143,552–161,554) | 148,436 (139,201–157,671) | −26.6% (−33.3 to −19.1) | +4.7% (−3.3 to +13.5) | −2.7% |
| Death rate | 8.97 (8.32–9.62) | 6.01 (5.70–6.33) | 5.52 (5.22–5.83) | 5.73 (5.40–6.07) | 5.56 (5.21–5.90) | −38.0% (−43.6 to −31.7) | +3.8% | −3.1% |
| Incident cases (envelope incl. benign) | 11,899,240 (9,349,665–14,448,810) | 10,439,640 | 10,159,360 (8,194,902–12,123,820) | 10,215,000 | 10,073,360 (7,943,843–12,202,880) | −15.4% (−37.8 to +15.7) | +0.5% | −1.5% |
| Incidence rate | 527.7 (414.7–640.8) | 419.7 | 385.3 (310.8–459.8) | 384.0 | 377.2 (297.4–456.9) | −28.6% (−47.3 to −3.4) | −0.3% | −1.8% |
Data source: authors’ aggregation of GBD 2023 Results Tool extractions; ages 0–19 years are the sum of the <5, 5–9, 10–14 and 15–19-year bands (both sexes). Aggregated UIs are approximated by root-sum-of-squares pooling of band half-widths under an independence assumption and are expected to be slightly narrower than official joint-distribution intervals. Crude rates use back-calculated population denominators (2023 global 0–19-year population 2,670,651,217); rate UIs omit denominator uncertainty. Percentage-change UIs were propagated by Monte Carlo simulation (20,000 draws; truncated normal, conservative in width); changes whose UIs include zero are directional only. Cells without UIs are interim aggregated rows for which pooled intervals were not computed. Incident cases include benign and in-situ tumors (~96% of the envelope in 2023) and are reported for completeness; primary inference is mortality-based (Section 2.2).
Disclaimer/Publisher’s Note: The statements, opinions and data contained in all publications are solely those of the individual author(s) and contributor(s) and not of MDPI and/or the editor(s). MDPI and/or the editor(s) disclaim responsibility for any injury to people or property resulting from any ideas, methods, instructions or products referred to in the content. |
© 2026 by the authors. Licensee MDPI, Basel, Switzerland. This article is an open access article distributed under the terms and conditions of the Creative Commons Attribution (CC BY) license (http://creativecommons.org/licenses/by/4.0/).
Copyright: This open access article is published under a Creative Commons CC BY 4.0 license, which permit the free download, distribution, and reuse, provided that the author and preprint are cited in any reuse.