

Submitted:
27 October 2026
Posted:
28 October 2026
You are already at the latest version
Abstract
Background and aims: Lifestyle factors could influence the development of metabolic dysfunction–associated steatotic liver disease (MASLD). However, there is a lack of data including the consumption of ultra-processed foods (UPF) within the broad field of steatotic liver disease. Methods: Dietary intake and physical activity were assessed using standardized questionnaires in patients with MASLD, ALD and healthy controls. Liver disease severity was quantified by transient elastography and liver histology. Results: One hundred and fifty-two patients with MASLD were recruited and compared with 95 patients with ALD and 31 controls. Patients with MASLD consume significantly less total calories than patients with ALD (1620 vs. 2290 kcal/day, p < 0.0001), primarily due to lower alcohol intake, despite a higher body mass index. ALD patients consume lower proportions of proteins, lipids, carbohydrates, and dietary fibres than MASLD and control groups. Fibre intake is higher in the control group compared with the MASLD and ALD groups. In the biopsied MASLD subgroup, significant fibrosis is associated with a lower fibre intake (15 vs. 19 g/day, p = 0.03). No differences in NOVA category distribution are observed between MASLD and control groups, and UPF intake is not associated with liver histological severity. Controls devote a greater proportion of leisure-time physical activity (54% vs. 11% in MASLD and 17% in ALD, p < 0.0001). Conclusions: Patients with MASLD and ALD exhibit lower dietary fibre intake and reduced leisure-time physical activity compared with controls. Fibre intake, but not UPF consumption, is associated with fibrosis severity in MASLD.
Keywords:
steatotic liver disease
; ultra-processed food
; dietary fibre
; physical activity
; metabolic dysfunction-associated steatotic liver disease
; alcohol-related liver disease
1. Introduction
Steatotic liver disease (SLD), including metabolic dysfunction-associated steatotic liver disease (MASLD) and alcohol-related liver disease (ALD), is the predominant cause of cirrhosis worldwide [1]. This condition is a spectrum chiefly characterized by an excessive liver lipid content or steatosis. Affecting more than 30% of the global population [2], SLD is largely attributed to lifestyle-related factors, including unhealthy dietary habits, physical inactivity, cardio-metabolic condition such as insulin resistance and overweight (for MASLD), and an excessive consumption of alcohol (for ALD) [4,5,6,7,8,9]. A subset of these patients will progress from isolated steatosis to steatohepatitis, the severe form of SLD characterized by hepatocytes ballooning degeneration and lobular inflammation. Steatohepatitis currently remains a histological diagnosis requiring liver tissue sampling, even if innovative non-invasive diagnostic techniques are currently investigated [9].
Dietary factors are central determinants of MASLD. Diets rich in saturated fats and refined carbohydrates and low in dietary fibres promote metabolic syndrome, and liver steatosis [10,11]. Conversely, adherence to a Mediterranean-style dietary pattern is associated with liver steatosis remission measured by MRI and improvements in metabolic biomarkers [12]. In contrast, dietary habits remain poorly investigated in ALD. Recent data from the UK Biobank suggest that a poorer dietary pattern is associated with greater susceptibility to severe ALD [13]. Both in our preliminary cohort without liver histology [14] and in another cohort of patients with an alcohol use disorder [15], lower protein and fibre intake was also observed as compared to controls. Collectively, these data underscore the strong link between diet and MASLD but also highlight the paucity of comparative data in ALD, thus reinforcing the need to better characterize dietary intake across the entire SLD spectrum.
In parallel, the growing consumption of ultra-processed foods (UPF) is a major dietary concern associated with adverse health outcomes including obesity [16], type 2 diabetes [17], and cancer [18]. The NOVA classification, introduced by Monteiro et al, categorizes foods according to the extent and purpose of processing, distinguishing four groups ranging from unprocessed or minimally processed foods to UPF [19]. UPF are typically industrial formulations composed mainly of food-derived substances and additives designed to enhance palatability and shelf life. More recently, several studies linked UPF intake to hepatic steatosis in non-invasively assessed patients with MASLD [20,21,22]. Prospective analyses reported that higher UPF-consumption significantly increased the risk of MASLD development compared to a lower consumption [20]. A recent meta-analysis corroborated these findings, showing that both moderate and high UPF intake were associated with an increased risk of MASLD development [21]. Most supporting data come from observational studies providing limited evidence of causality [23,24]. While the association between UPF consumption and isolated metabolic steatosis was reported, this topic was not explored in ALD, as well as the association with SLD severity histologically assessed. UPF consumption was also not previously compared between patients with SLD and healthy controls.
On the other hand, physical inactivity is a key modifiable factor in the development and progression of SLD. Although the benefits of physical activity have been extensively investigated in MASLD, they remain poorly characterized in other SLD subtypes, including ALD. Data from our group have also shown a reduction in muscle strength and leisure time exercise in patients with SLD, irrespectively of SLD subtypes (MASLD or ALD) [14]. Higher levels of physical activity, particularly moderate-to-vigorous activity (mainly for aerobic and exercise programs combining aerobic and resistance training), are associated with a reduced risk of MASLD onset, higher remission rates of liver steatosis and a lower risk of MASLD progression [25,26]. Physical activity also improves metabolic biomarkers, independently of weight loss [27]. Similarly, a meta-analysis reported that engaging in ≥750 metabolic equivalent of task (MET) minutes of physical activity per week was associated with a > 30% reduction in liver fat, also independently of weight change [28]. Overall, both observational and interventional evidence consistently link sedentary behavior with increased risk of MASLD development. Current public health recommendations emphasize achieving at least 150 minutes per week of moderate-to-vigorous physical activity [29], but specific guidelines for improving hepatic outcomes in SLD remain undefined. Moreover, very few studies have examined the potential benefits of physical activity among patients with ALD.
Therefore, the present cross-sectional study aims to comprehensively assess dietary intake, including the quantification of UPF consumption, and physical activity levels in patients within the all SLD spectrum, and to compare these findings with those of healthy controls. A secondary objective was to investigate the association between UPF intake and specific histological features of SLD in liver-biopsied patients. By jointly examining dietary habits and physical activity across the full spectrum of SLD, this study seeks to fill gaps in the current literature and to provide new insights into modifiable lifestyle determinants of liver disease progression.
2. Patients and Methods
2.1. Patients’ Recruitment
Patients with SLD were prospectively recruited between January 2021 and June 2025. The diagnosis of MASLD, MetALD and ALD was based on the new SLD nomenclature [30]. Inclusion criteria for SLD groups included an age ≥ 18 years and hepatic steatosis confirmed by imaging or a controlled attenuation parameter (CAP) ≥215 dB/m (vibration-controlled transient elastography (VCTE)). Exclusion criteria included liver diseases of other etiologies (e.g., viral hepatitis, genetic or auto-immune disease), active intravenous drug use, pregnancy, medications inducing steatosis (e.g. corticosteroids), active malignancies, renal failure, or participation in metabolic dysfunction-associated steatohepatitis -targeted pharmaceutical trials.
Control subjects were prospectively recruited based on the following inclusion criteria: no history of chronic liver disease, low alcohol consumption (<14U per week for women and <21U per week for men), absence of hepatic steatosis confirmed by VCTE (CAP < 215 dB/m), or, in cases of detected steatosis, the absence of at least one associated cardiometabolic risk factors. All participants provided written informed consent, and the study was approved by the Cliniques universitaires Saint-Luc ethics committee (2014/15OCT/514 - 2024/14AOU/438) in accordance with the declarations of Helsinki and Istanbul. The results of this study are reported according to the STROBE checklist. This trial is registered in ClinicalTrials.gov (NCT06514300).
2.2. Assessment of Diet: 24h Dietary Recall and NOVA Classification
Dietary intake was evaluated using a 24-hour dietary recall, with data analyzed via the Nubelpro® software. Energy requirements were estimated by first calculating the basal metabolic rate with the Harris-Benedict equation [31], then multiplying basal metabolic rate by a physical activity level derived from weekly metabolic equivalent task-minute (MET-min) [32]. This approach enabled the determination of each patient’s daily energy balance and the identification of any caloric surplus or deficit. UPF consumption was quantified using the NOVA classification system [19]. For each NOVA group (NOVA 1 to 4), total energy intake (TEI, kcal), weight (grams), and the percentage contribution to overall energy intake were determined. Fermented alcoholic beverages are classified as processed foods, while both fermented and distilled alcoholic beverages are categorized as ultra-processed foods [19].
2.3. Evaluation of Physical Activity
Physical activity level was assessed using the international physical activity questionnaire (IPAQ) [33], which assesses various subcategories of physical activity over a 7-day period. The results were expressed in MET-minutes, where one MET-minute is defined as the amount of oxygen consumed while sitting at rest and is equal to 3.5 ml O₂ per kg body weight x min [34]. We categorized participants in three groups: low (< 600 MET-min/week), moderate (600 to <3000 MET-min/week), and high (≥3000 MET-min/week) physical activity levels based on the standard scoring criteria [32]. For energy balance calculations, these activity levels were converted to a physical activity level index using standard values from the Belgian Health Council [35]: 1.4 for sedentary, 1.6 for moderate, and 1.8 for high activity levels.
2.4. Evaluation of the Severity of the Steatotic Liver Disease
VCTE was used to assess steatosis (CAP) and fibrosis (liver stiffness measurement [36,37]). In participants with an increased liver stiffness (≥ 7.8 kPa) on VCTE [37,38], a liver biopsy was performed to confirm the diagnosis and assess disease severity. Liver biopsy was obtained by percutaneous or transjugular approach. All liver biopsies were primarily scored individually by 2 experienced local pathologists (PB, PH) using the Beaujon score (Steatosis–Activity–Fibrosis) [39]. Steatosis and activity were evaluated on hematoxylin and eosin-stained sections, while fibrosis was assessed using Sirius Red staining. The activity score was calculated as the sum of lobular inflammation and hepatocellular ballooning. All cases were then evaluated by two independent blinded international experts (CS, AG) for final scoring. Cases that contained discrepancies were subsequently assessed in on-line joint meetings (CS, AG) to reach consensus.
2.5. Statistical Analysis
All univariate statistical analyses were performed using GraphPad Prism 11.0. The distribution of continuous variables was assessed for normality using the Shapiro–Wilk test. Baseline characteristics of patients with SLD (MASLD and ALD) and healthy controls are presented as mean and range (min–max) for normally distributed variables, or as median and interquartile range (IQR, Q1–Q3) for non-normally distributed variables. Categorical variables are expressed as number and percentage (n, %). For normally distributed data, comparisons between two groups were performed using the Student’s t-test, and comparisons among multiple groups were conducted using one-way analysis of variance (ANOVA). For non-parametric data, the Mann–Whitney U test was used for two-group comparisons, and the Kruskal–Wallis test for multiple-group comparisons. Correlation analyses were performed using Pearson’s correlation for normally distributed variables and Spearman’s rank correlation for variables that were not normally distributed.
3. Results
3.1. Study Cohort
The participant selection process for the study is illustrated in Figure 1. A total of 384 individuals were initially screened, including 352 participants with SLD and 32 healthy controls. Among the SLD group, 234 were diagnosed with MASLD, 15 with MetALD and 103 with ALD (Figure 1). 91 participants were excluded due to the absence of a complete 24-hour dietary recall: 82 MASLD patients, 8 ALD patients, and 1 control subject. All MetALD patients were additionally excluded because of the small sample size. The final study cohort consisted in 278 participants with complete dietary data suitable for the quantification of UPF intake using the NOVA classification system [19], including 152 MASLD patients, 95 ALD patients, and 31 non-SLD controls. Ninety-four participants underwent liver biopsy (54 with MASLD and 40 with ALD) (Figure 1).
3.2. Divergent Metabolic Profiles in MASLD and ALD
Table 1 summarizes the main clinical, biochemical, and VCTE characteristics of control, MASLD and ALD groups. As expected, the MASLD group displayed a markedly higher body mass index (BMI) (Figure 2A), waist circumference, and homeostasis model assessment-estimated insulin resistance (HOMA-IR) (Figure 2B), along with lower high-density lipoprotein cholesterol (HDL-C) levels compared to both ALD and control groups (Table 1).
Glycemic parameters in individuals without type 2 diabetes, including fasting insulinemia, were also significantly higher in the MASLD group, reflecting insulin resistance. Type 2 diabetes was more prevalent in the MASLD group (41%) compared to ALD (5%) and control (0%) groups. In contrast, the ALD group was characterized by higher aspartate aminotransferase (AST), alanine aminotransferase (ALT) and gamma-glutamyl transferase (GGT) serum levels. Liver stiffness measurement and CAP were elevated in both MASLD and ALD groups compared to the control group. The MASLD group exhibited a higher CAP compared to the ALD group although no significant differences in liver stiffness were observed between them (Figure 2C-D).
3.3. Contrasting Dietary Intake and Food Processing Patterns Across SLD Etiologies
Dietary intake assessed by 24-hour recall revealed that ALD patients consumed more total calories than MASLD patients, despite a lower mean BMI. This elevated caloric intake in the ALD group was primarily due to higher consumption of alcohol beverages. When expressed as a percentage of TEI (%), the ALD group consumed lower proportions of proteins, lipids, carbohydrates, and dietary fibres compared to both MASLD and control groups (Table 2). Notably, the macronutrient distribution in the MASLD group did not significantly differ from the control group, except for fibres, which were less consumed in the MASLD group (Figure 3A).
According to the NOVA classification, the proportion of minimally processed food (NOVA 1) and processed culinary ingredients (NOVA 2) intake expressed in grams per day was lower in the ALD group compared to the two other groups. Conversely, the daily intake of processed food (NOVA 3) was higher in the ALD group compared to MASLD and control groups (Table 2). This pattern was also attributable to alcohol beverages consumption. In contrast, no significant differences in food intake patterns across NOVA categories 1 to 4 were observed between MASLD patients and controls. Unexpectedly, UPF (NOVA 4) consumption did not differ significantly between MASLD, ALD and control groups (Figure 3B).
3.4. Decreased Leisure-Time Physical Activity in Patients with SLD
Physical activity assessed by the IPAQ revealed a higher prevalence of unemployment in the ALD (63%) and MASLD (46%) groups compared to the control group (29%). Total physical activity, expressed in MET-min/week, was the highest in the control group and the lowest in the ALD group (Table 2). The control group allocated a greater proportion of their activity to leisure-time physical activity (LTPA) (54% vs. 17% in ALD and 11% in MASLD) (Figure 3C), whereas the contribution of domestic-related activity was higher in the MASLD group.
3.5. Histopathological Profiles in Patients with MASLD and ALD and Relation to SLD Severity
The histological assessment enabled the disease to be graded on the severity of steatosis (Figure 4A), activity (Figure 4B) and fibrosis (Figure 4C). Histological assessment revealed broadly similar profiles between patients with MASLD and those with ALD (Table 3). The distribution of steatosis grades (S1–S3) did not differ significantly between the two groups, except for severe steatosis (S3), which was proportionally more frequent among ALD patients (Table 3). Hepatocellular ballooning grades (B0–B2) were comparable in MASLD and ALD, as were lobular inflammation (LI) grades (LI0–LI2), with no significant differences observed. Likewise, the distribution of fibrosis stages (F0–F4) was similar between groups (Table 3). Overall, the only significant histological distinction between MASLD and ALD concerned severe steatosis, whereas inflammatory and fibrotic parameters showed comparable patterns.
We first investigated the relationship between dietary intake and histological severity in MASLD and ALD, considering steatosis, activity, and fibrosis. No other macronutrient demonstrated a significant association with disease severity (data not shown).
We then assessed whether the consumption of processed foods (NOVA 3) and UPF (NOVA 4) was associated with histological features of liver disease. In patients with MASLD, UPF intake was not associated with steatosis (Figure 4D), inflammatory activity (Figure 4E), or fibrosis (Figure 4F). In patients with ALD, median proportion of energy derived from UPF was significantly lower than in patients with MASLD (Table 2). This reflects a dilution effect, as alcoholic beverages, predominantly classified within the NOVA 3 category, contribute substantially to TEI, thereby reducing the relative proportion of energy derived from UPF (NOVA 4). However, as for patients with MASLD, UPF consumption in patients with ALD was not associated with steatosis (Figure 4G), inflammatory activity (Figure 4H), or fibrosis (Figure 4I).
4. Discussion
This cross-sectional study is the first to examine and directly compare combined dietary intake including UPF consumption and physical activity levels in patients with SLD compared to healthy controls. It also represents the first analysis exploring the association between the consumption of UPF and liver disease severity, assessed histologically. Our findings indicate that patients with SLD consume less dietary fibre and engage in lower levels of leisure time physical activity (LTPA) than healthy controls. Interestingly, in the subgroup of patients with liver biopsy, UPF consumption showed no relationship with histological severity, whereas lower fibre intake was significantly associated with more advanced fibrosis in MASLD. The advantage of this study is that it involves a clinical cohort with typical characteristics, particularly in terms of BMI, VCTE and available markers of insulin resistance. In particular, the insulin-resistance profile observed in our study is consistent with the concept that SLD represents a heterogeneous entity sharing common features, such as hepatic steatosis, reduced muscle strength, and insulin resistance, while also displaying disease-specific differences, with more pronounced BMI and insulin resistance in MASLD than in ALD [14,40]. The TEI may seem low for a population of patients with SLD. However, it is comparable to that of other populations that have already been studied, such as overweight individuals with moderate steatosis as measured by VCTE [41] or patients with MASLD diagnosed by histology at various stages of fibrosis [42]. Alcohol consumption, meanwhile, is responsible for an increase in energy intake, as has also been demonstrated in other patient cohorts [43].
The relationship between MASLD and dietary fibre intake was previously examined. A recent study of 190,276 individuals from the UK Biobank evaluated the association between fibre intake (g/day) and the risk of incident MASLD. Among the 1,423 participants who developed MASLD over 10 years of follow-up, higher fibre intake was associated with a reduced risk of MASLD and with lower liver fat content measured by magnetic resonance imaging [11]. The association between fibre intake and ALD was poorly investigated. In a recent study in patients with ALD, insufficient fibre intake was part of a broader pattern of alcohol-related malnutrition compared with healthy controls [43]. This was also highlighted in our initial findings [14]. One preclinical study reported beneficial effects of a diet enriched in soluble dietary fibre, which increased Bacteroides acidifaciens abundance, and markedly alleviated alcohol-induced liver injury in a mouse model [44]. Although we did not observe an association between fibre intake and disease severity among ALD patients in our cohort, these preclinical findings nonetheless support a plausible mechanistic link between dietary fibre and alcohol-related liver injury.
Another key finding of our study is the association between lower fibre intake and the severity of liver fibrosis (≥ F2) histologically assessed. An observational study in 1,351 patients with MASLD previously showed that consuming ≥15 g/day of fibre was associated with a lower risk of hepatic fibrosis assessed using VCTE [45]. Our results extend these observations by demonstrating a similar association using the reference method for fibrosis assessment (biopsy). Furthermore, a randomized interventional trial demonstrated that dietary fibre supplementation (12 g or 24 g/day) in patients with type 2 diabetes and MASLD improved glycemic control and reduced circulating markers of hepatic fibrosis [46]. The effects were more pronounced in the 24 g/day group, with significant reductions in glycated hemoglobin, fasting glucose, and the fibrosis-4 score, whereas BMI did not change significantly suggesting that improvements in metabolic profile and fibrosis-4 score were independent of weight loss [46]. In another study by our group, the administration of inulin, a dietary fibre, to subjects with obesity led to weight loss compared with control patients treated with placebo [36]. The response varied from one individual to another, depending not only on the baseline gut microbiota [47,48] but also on the level of physical activity during the study [49].
Several mechanistic pathways may explain the relationship between low fibre intake and hepatic fibrosis. The central role of the gut microbiota appears particularly relevant. Low dietary fibre intake reduces microbial fermentation, thereby decreasing the production of short-chain fatty acids [50], including butyrate, propionate, and acetate, which contribute to numerous physiological processes related to metabolism, immunity, and inflammation [47,51,52]. Reduced short-chain fatty acid production may increase intestinal permeability, promote lipopolysaccharide translocation, and induce endotoxemia, subsequently activating inflammatory pathways (e.g., TLR signaling, cytokine production) within the liver, eventually leading to hepatic stellate cells activation and fibrogenesis [51]. Additionally, low fibre intake can induce dysbiosis and alter bile acid metabolism. Such alterations may disrupt signaling through the farnesoid X receptor and Takeda G-protein–coupled receptor 5, which regulate lipid and glucose metabolism, inflammation, and insulin sensitivity [53]. Dysregulation of these pathways may further promote chronic inflammation and hepatic fibrosis [53]. Finally, low fibre intake often co-occurs with higher consumption of deleterious nutrients, such as saturated fatty acids and refined carbohydrates [54], which may exacerbate insulin resistance and inflammation, key drivers of fibrogenesis. Taken together, this suggests that reduced dietary fibre intake, through decreased short-chain fatty acids production, dysbiosis, impaired gut barrier integrity, bile acid signaling disruption, and an overall unfavorable dietary milieu, may contribute to the progression of hepatic fibrosis in MASLD [51].
It is important to note that, in existing literature, fibre intake is typically expressed in absolute grams rather than as a percentage of TEI. When fibre intake is energy-adjusted, the resulting percentages become very small, which limits their interpretability and analytical relevance. In contrast, expressing other macronutrients or UPF consumption as a percentage of TEI is more appropriate, as these components constitute a larger proportion of daily caloric intake.
Regarding UPF consumption, our study is the first prospective investigation to examine the associations between UPF consumption and SLD severity histologically assessed. In our cohort of participants with biopsy-proven SLD, UPF consumption was not associated with SLD severity, nor did it differ between participants with SLD and healthy controls. While these findings may appear to contrast with previous reports linking higher UPF intake to an increased risk of developing MASLD [23,55], they are not necessarily contradictory. Most prior studies are observational and primarily focus on disease occurrence rather than histologically assessed severity, thereby limiting causal inference [23]. In addition, differences in the assessment and reporting of UPF intake may further contribute to these discrepancies. While the available literature does report UPF consumption levels in patients with MASLD, both the metrics and the underlying data are highly heterogeneous. Some studies express intake in g/day, others in g/1000 kcal, as a percentage of total food weight, or as a percentage of TEI, thereby limiting direct comparisons across countries, publications and cohorts. Methodological considerations may also play a role. Dietary intake assessed using 24-hour recalls may underestimate total energy and UPF consumption, particularly in patients with SLD. Furthermore, our relatively modest sample size may have limited the statistical power to detect small-to-moderate associations, especially in comparison with large-scale studies that reported positive findings [23,56].
Another finding of interest in our study shows that LTPA was lower in participants with SLD compared with healthy controls. Consistently, additional recent data from our research group support that patients with non-cirrhotic SLD already have impaired muscle strength compared with controls, independently of age, sex, and energetic balance [14]. Prior evidence showed that patients with MASLD spend approximately half an hour more per day sitting and walk 19% fewer steps than healthy individuals, resulting in substantially reduced daily energy expenditure [8]. Another study assessing physical activity among patients with ALD also reported reduced physical activity levels, expressed in MET-min/week and measured using the IPAQ, compared with healthy controls [57]. However, neither study reported specific data on LTPA. More recently, a large study of patients with SLD (n = 4,342) demonstrated that LTPA was associated with a lower risk of advanced fibrosis in MASLD as well as in combined MetALD and ALD phenotypes, whereas physical activity related to work was not associated with improvements in advanced fibrosis [58]. These findings reinforce the importance of considering activity domains separately.
Several limitations must be acknowledged. The relatively small number of SLD patients may have limited the power of our statistical analyses. Due to the observational design of our study, causality cannot be inferred regarding the relationship between fibre intake and fibrosis severity, which warrants confirmation in larger, longitudinal or interventional studies. Additionally, dietary intake and physical activity were assessed using questionnaires, which are subject to reporting bias. However, the small number of trained operators administering the questionnaires likely mitigated some of this variability.
5. Conclusion
In conclusion, we demonstrate that patients with SLD exhibit lower dietary fibre intake and reduced LTPA compared with healthy controls. Importantly, low fibre intake, but not UPF consumption, was associated with more severe fibrosis among patients with MASLD, suggesting that specific nutritional components are more relevant to disease progression than overall UPF exposure that may represent only one of several dietary determinants of SLD and is unlikely to fully account for disease severity in this multifactorial condition. These findings are crucial at a time when interventional studies are being carried out in this field and highlight the need to promote physical activity and underscore the potential role of dietary fibre as a modifiable factor in the management of SLD.
Author Contributions
Salomé Declerck: conceptualization, data curation, formal analysis, investigation, methodology, validation, visualization, writing – original draft preparation, writing-review and editing. Guillaume Henin: conceptualization, data curation, formal analysis, investigation, methodology, validation, visualization, review and editing. Stéphanie André- Dumont: data curation, investigation, writing – review and editing. Alexis Goffaux: data curation, investigation, writing – review and editing. Paméla Baldin: writing – review and editing. Paulina Henry: writing – review and editing. Annette Gouw: data acquisition, writing – review and editing. Christine Sempoux: data acquisition, writing – review and editing. Audrey Loumaye: writing – review and editing. Bénédicte Delire: writing – review and editing. Géraldine Dahlqvist: writing – review and editing. Isabelle Leclercq: funding acquisition, writing–review and editing. Peter Stärkel: writing – review and editing. Nicolas Lanthier: conceptualization, funding acquisition, investigation, methodology, project administration, resources, supervision, validation, writing – original draft, writing – review and editing.
Grant support
This work was supported by a concerted research action grant “MYO-MAFLD” 22/27-122 and research grants from Gilead Sciences, the Fonds de la Recherche Scientifique (FNRS), Belgium to NL (J.0124.24) and PS (T.0217.18, J.0171.21).
Ethics approval and consent to participate
The study protocol was approved by the institutional Ethics Committee (Comité d’Ethique Hospitalo-Facultaire UCLouvain/Cliniques Universitaires Saint-Luc, registration code 2014/15OCT/514 - 2024/14AOU/438). It is published at « clinicaltrials. gov» (NCT06514300).
Consent for publication
Not applicable.
Availability of data
The datasets used and/or analysed during the current study are available from the corresponding author on reasonable request.
Acknowledgments
NL has a mandate of clinical researcher from the FNRS (Fonds national de la recherche, Belgium).
Conflicts of Interest
GH received travel grants from Gilead Sciences. NL received speaker fees from Gilead Sciences, Mirum, Orphalan and Fresenius Kabi; is an advisory board member for Alexion, AstraZeneca, Boehringer-Ingelheim, Ipsen, Madrigal, Truvion; received travel grants from Abbvie, Gilead Sciences Ipsen, Novo Nordisk and Norgine and received research grants from Gilead Sciences and Echosens, European Union within the Horizon Europe program, FNRS and UCLouvain. AL received travel grants from NovoNordisk and Boehringer-Ingelheim and speaker fees from Boehringer-Ingelheim. SD, SAD, AG, CS, PH, GD, PB, PS and IL have nothing to declare.
References
- Krag, A.; Israelsen, M.; Francque, S.; Tsochatzis, E.A. Steatotic Liver Disease; 2024; Vol. 404. [Google Scholar]
- Israelsen, M.; Francque, S.; Tsochatzis, E.A.; Krag, A. Steatotic Liver Disease. The Lancet 2024, 404, 1761–1778. [Google Scholar] [CrossRef] [PubMed]
- Younossi, Z.M.; Zelber-Sagi, S.; Henry, L.; Gerber, L.H. Lifestyle Interventions in Nonalcoholic Fatty Liver Disease. Nat. Rev. Gastroenterol. Hepatol. 2023, 20, 708–722. [Google Scholar] [CrossRef] [PubMed]
- Tian, T.; Zhang, J.; Xie, W.; Ni, Y.; Fang, X.; Liu, M.; Peng, X.; Wang, J.; Dai, Y.; Zhou, Y. Dietary Quality and Relationships with Metabolic Dysfunction-Associated Fatty Liver Disease (MAFLD) among United States Adults, Results from NHANES 2017–2018. Nutrients 2022, 14. [Google Scholar] [CrossRef] [PubMed]
- Quek, J.; Chan, K.E.; Wong, Z.Y.; Tan, C.; Tan, B.; Lim, W.H.; Tan, D.J.H.; Tang, A.S.P.; Tay, P.; Xiao, J.; et al. Global Prevalence of Non-Alcoholic Fatty Liver Disease and Non-Alcoholic Steatohepatitis in the Overweight and Obese Population: A Systematic Review and Meta-Analysis. Lancet Gastroenterol. Hepatol. 2023, 8, 20–30. [Google Scholar] [CrossRef] [PubMed]
- Tanase, D.M.; Gosav, E.M.; Costea, C.F.; Ciocoiu, M.; Lacatusu, C.M.; Maranduca, M.A.; Ouatu, A.; Floria, M. The Intricate Relationship between Type 2 Diabetes Mellitus (T2DM), Insulin Resistance (IR), and Nonalcoholic Fatty Liver Disease (NAFLD). J. Diabetes Res. 2020, 2020. [Google Scholar] [CrossRef] [PubMed]
- Long, M.T.; Massaro, J.M.; Hoffmann, U.; Benjamin, E.J.; Naimi, T.S. Alcohol Use Is Associated With Hepatic Steatosis Among Persons With Presumed Nonalcoholic Fatty Liver Disease. Clin. Gastroenterol. Hepatol. 2020, 18, 1831–1841.e5. [Google Scholar] [CrossRef] [PubMed]
- Hallsworth, K.; Thoma, C.; Moore, S.; Ploetz, T.; Anstee, Q.M.; Taylor, R.; Day, C.P.; Trenell, M.I. Non-Alcoholic Fatty Liver Disease Is Associated with Higher Levels of Objectively Measured Sedentary Behaviour and Lower Levels of Physical Activity than Matched Healthy Controls. Frontline Gastroenterol. 2015, 6, 44–51. [Google Scholar] [CrossRef] [PubMed]
- Calès, P.; Canivet, C.M.; Costentin, C.; Lannes, A.; Oberti, F.; Fouchard, I.; Hunault, G.; de Lédinghen, V.; Boursier, J. A New Generation of Non-Invasive Tests of Liver Fibrosis with Improved Accuracy in MASLD. J. Hepatol. 2024. [Google Scholar] [CrossRef] [PubMed]
- Hydes, T.; Alam, U.; Cuthbertson, D.J. The Impact of Macronutrient Intake on Non-Alcoholic Fatty Liver Disease (NAFLD): Too Much Fat, Too Much Carbohydrate, or Just Too Many Calories? Front. Nutr. 2021, 8. [Google Scholar] [CrossRef] [PubMed]
- Jiang, J.; Liu, Y.; Yang, H.; Ma, Z.; Liu, W.; Zhao, M.; Peng, X.; Qin, X.; Xia, Y. Dietary Fiber Intake, Genetic Predisposition of Gut Microbiota, and the Risk of Metabolic Dysfunction-Associated Steatotic Liver Disease. Food Res. Int. 2025, 211, 116497. [Google Scholar] [CrossRef] [PubMed]
- Gepner, Y.; Shelef, I.; Komy, O.; Cohen, N.; Schwarzfuchs, D.; Bril, N.; Rein, M.; Serfaty, D.; Kenigsbuch, S.; Zelicha, H.; et al. The Beneficial Effects of Mediterranean Diet over Low-Fat Diet May Be Mediated by Decreasing Hepatic Fat Content. J. Hepatol. 2019, 71, 379–388. [Google Scholar] [CrossRef] [PubMed]
- Petermann-Rocha, F.; Zhou, Z.; Mathers, J.C.; Celis-Morales, C.; Raubenheimer, D.; Sattar, N.; Pell, J.P.; Forrest, E.; Ho, F.K. Diet Modifies the Association between Alcohol Consumption and Severe Alcohol-Related Liver Disease Incidence. Nat. Commun. 2024, 15, 6880. [Google Scholar] [CrossRef] [PubMed]
- Henin, G.; Goffaux, A.; Declerck, S.; André-Dumont, S.; Pendeville, E.; Valet, M.; Lejeune, T.; Dahlqvist, G.; Loumaye, A.; Schnabl, B.; et al. Non-Cirrhotic Steatotic Liver Disease Is Associated With Impaired Muscle Function: A Cross-Sectional Study. JCSM Commun. 2025, 8. [Google Scholar] [CrossRef] [PubMed]
- Amadieu, C.; Leclercq, S.; Coste, V.; Thijssen, V.; Neyrinck, A.M.; Bindels, L.B.; Cani, P.D.; Piessevaux, H.; Stärkel, P.; de Timary, P.; et al. Dietary Fiber Deficiency as a Component of Malnutrition Associated with Psychological Alterations in Alcohol Use Disorder. Clin. Nutr. 2021. [Google Scholar] [CrossRef] [PubMed]
- Askari, M.; Heshmati, J.; Shahinfar, H.; Tripathi, N.; Daneshzad, E. Ultra-Processed Food and the Risk of Overweight and Obesity: A Systematic Review and Meta-Analysis of Observational Studies. Int. J. Obes. 2020, 44, 2080–2091. [Google Scholar] [CrossRef] [PubMed]
- Delpino, F.M.; Figueiredo, L.M.; Bielemann, R.M.; Da Silva, B.G.C.; Dos Santos, F.S.; Mintem, G.C.; Flores, T.R.; Arcêncio, R.A.; Nunes, B.P. Ultra-Processed Food and Risk of Type 2 Diabetes: A Systematic Review and Meta-Analysis of Longitudinal Studies. Int. J. Epidemiol. 2022, 51, 1120–1141. [Google Scholar] [CrossRef] [PubMed]
- Isaksen, I.M.; Dankel, S.N. Ultra-Processed Food Consumption and Cancer Risk: A Systematic Review and Meta-Analysis. Clin. Nutr. 2023, 42, 919–928. [Google Scholar] [CrossRef] [PubMed]
- Monteiro, Carlos Augusto; Cannon, Geoffrey; Lawrence, Mark; da Costa Louzada, Maria Laura; Machado, Priscila Pereira. Ultra-Processed Foods, Diet quality, And health using the NOVA classification system. Public Health Nutr. 2019, 22, 936–941. [Google Scholar] [PubMed]
- Zhao, L.; Zhang, X.; Steele, E.M.; Lo, C.H.; Zhang, F.F.; Zhang, X. Higher Ultra-Processed Food Intake Was Positively Associated with Odds of NAFLD in Both US Adolescents and Adults: A National Survey. Hepatol. Commun. 2023, 7. [Google Scholar] [CrossRef] [PubMed]
- Zhang, Y.F.; Qiao, W.; Zhuang, J.; Feng, H.; Zhang, Z.; Zhang, Y. Association of Ultra-Processed Food Intake with Severe Non-Alcoholic Fatty Liver Disease: A Prospective Study of 143073 UK Biobank Participants. J. Nutr. Health Aging 2024, 28. [Google Scholar] [CrossRef] [PubMed]
- Ivancovsky-Wajcman, D.; Fliss-Isakov, N.; Webb, M.; Bentov, I.; Shibolet, O.; Kariv, R.; Zelber-Sagi, S. Ultra-processed Food Is Associated with Features of Metabolic Syndrome and Non-alcoholic Fatty Liver Disease. Liver Int. 2021, 41, 2635–2645. [Google Scholar] [CrossRef] [PubMed]
- Zhang, J.; Shu, L.; Chen, X. Ultra-Processed Foods and Non-Alcoholic Fatty Liver Disease: An Updated Systematic Review and Dose–Response Meta-Analysis. Front. Nutr. 2025, 12. [Google Scholar] [CrossRef] [PubMed]
- Ludwig, D.S. Ultraprocessed Food on an Ultrafast Track. N. Engl. J. Med. 2025, 393, 1046–1049. [Google Scholar] [CrossRef] [PubMed]
- van Kleef, L.A.; Hofman, A.; Voortman, T.; de Knegt, R.J. Objectively Measured Physical Activity Is Inversely Associated With Nonalcoholic Fatty Liver Disease: The Rotterdam Study. Am. J. Gastroenterol. 2022, 117, 311–318. [Google Scholar] [CrossRef] [PubMed]
- Liu, M.; Ye, Z.; Zhang, Y.; He, P.; Zhou, C.; Yang, S.; Zhang, Y.; Gan, X.; Qin, X. Accelerometer-Derived Moderate-to-Vigorous Physical Activity and Incident Nonalcoholic Fatty Liver Disease. BMC Med. 2024, 22, 398. [Google Scholar] [CrossRef] [PubMed]
- Stine, J.G.; Schreibman, I.R.; Faust, A.J.; Dahmus, J.; Stern, B.; Soriano, C.; Rivas, G.; Hummer, B.; Kimball, S.R.; Geyer, N.R.; et al. NASHFit: A Randomized Controlled Trial of an Exercise Training Program to Reduce Clotting Risk in Patients with NASH. Hepatology 2022, 76, 172–185. [Google Scholar] [CrossRef] [PubMed]
- Stine, J.G.; DiJoseph, K.; Pattison, Z.; Harrington, A.; Chinchilli, V.M.; Schmitz, K.H.; Loomba, R. Exercise Training Is Associated With Treatment Response in Liver Fat Content by Magnetic Resonance Imaging Independent of Clinically Significant Body Weight Loss in Patients With Nonalcoholic Fatty Liver Disease: A Systematic Review and Meta-Analysis. Am. J. Gastroenterol. 2023, 118, 1204–1213. [Google Scholar] [CrossRef] [PubMed]
- Bull, F.C.; Al-Ansari, S.S.; Biddle, S.; Borodulin, K.; Buman, M.P.; Cardon, G.; Carty, C.; Chaput, J.-P.; Chastin, S.; Chou, R.; et al. World Health Organization 2020 Guidelines on Physical Activity and Sedentary Behaviour. Br. J. Sports Med. 2020, 54, 1451–1462. [Google Scholar] [CrossRef] [PubMed]
- Rinella, M.E.; Lazarus, J. V.; Ratziu, V.; Francque, S.M.; Sanyal, A.J.; Kanwal, F.; Romero, D.; Abdelmalek, M.F.; Anstee, Q.M.; Arab, J.P.; et al. A Multisociety Delphi Consensus Statement on New Fatty Liver Disease Nomenclature. Hepatology 2023, 78, 1966–1986. [Google Scholar] [CrossRef] [PubMed]
- Jésus, P.; Coëffier, M. Comment Évaluer Les Besoins Énergétiques et Protéiques Du Sujet Obèse ? Nutr. Clin. Et. Metab. 2017, 31, 260–267. [Google Scholar] [CrossRef]
- Guidelines for Data Processing and Analysis of the International Physical Activity Questionnaire (IPAQ)-Short and Long Forms. 2005.
- Craig, C.L.; Marshall, A.L.; Sjöström, M.; Bauman, A.E.; Booth, M.L.; Ainsworth, B.E.; Pratt, M.; Ekelund, U.; Yngve, A.; Sallis, J.F.; et al. International Physical Activity Questionnaire: 12-Country Reliability and Validity. Med. Sci. Sports Exerc. 2003, 35, 1381–1395. [Google Scholar] [CrossRef] [PubMed]
- Jetté, M.; Sidney, K.; Blümchen, G. Metabolic Equivalents (METS) in Exercise Testing, Exercise Prescription, and Evaluation of Functional Capacity. Clin. Cardiol. 1990, 13, 555–565. [Google Scholar] [CrossRef] [PubMed]
- Conseil Supérieur de La Santé.
- Hiel, S.; Gianfrancesco, M.A.; Rodriguez, J.; Portheault, D.; Leyrolle, Q.; Bindels, L.B.; Gomes da Silveira Cauduro, C.; Mulders, M.D.G.H.; Zamariola, G.; Azzi, A.-S.; et al. Link between Gut Microbiota and Health Outcomes in Inulin -Treated Obese Patients: Lessons from the Food4Gut Multicenter Randomized Placebo-Controlled Trial. Clin. Nutr. 2020, 39, 3618–3628. [Google Scholar] [CrossRef] [PubMed]
- Lanthier, N.; Rodriguez, J.; Nachit, M.; Hiel, S.; Trefois, P.; Neyrinck, A.M.; Cani, P.D.; Bindels, L.B.; Thissen, J.-P.; Delzenne, N.M. Microbiota Analysis and Transient Elastography Reveal New Extra-Hepatic Components of Liver Steatosis and Fibrosis in Obese Patients. Sci. Rep. 2021, 11, 659. [Google Scholar] [CrossRef] [PubMed]
- Berzigotti, A.; Tsochatzis, E.; Boursier, J.; Castera, L.; Cazzagon, N.; Friedrich-Rust, M.; Petta, S.; Thiele, M. EASL Clinical Practice Guidelines on Non-Invasive Tests for Evaluation of Liver Disease Severity and Prognosis – 2021 Update. J. Hepatol. 2021, 75, 659–689. [Google Scholar] [CrossRef] [PubMed]
- Bedossa, P.; Poitou, C.; Veyrie, N.; Bouillot, J.L.; Basdevant, A.; Paradis, V.; Tordjman, J.; Clement, K. Histopathological Algorithm and Scoring System for Evaluation of Liver Lesions in Morbidly Obese Patients. Hepatology 2012, 56, 1751–1759. [Google Scholar] [CrossRef] [PubMed]
- Bale, G.; Clarembeau, F.; Stärkel, P.; Dahlqvist, G.; Horsmans, Y.; Lanthier, N. Patients with Chronic Liver Diseases Are at Risk for Diabetes Even before Development of Cirrhosis. Clin. Res. Hepatol. Gastroenterol. 2024, 48, 102428. [Google Scholar] [CrossRef] [PubMed]
- Dénos, C.; Nain, C.W.; Pachikian, B.; Hdidou, S.; Rasse, C.; Dierge, E.; Debier, C.; Trefois, P.; Larondelle, Y.; Lanthier, N. Effects of Crackers Enriched with Polyunsaturated Fatty Acids with Benefits for Improving Metabolic Parameters: A Double-Blind Randomized Controlled Trial in Subjects with Overweight. Clin. Nutr. ESPEN 2026, 74, 103370. [Google Scholar] [CrossRef] [PubMed]
- Miyake, T.; Furukawa, S.; Yoshida, O.; Kanamoto, A.; Murakami, Y.; Miyazaki, M.; Morita, M.; Ishikawa, S.; Numata, Y.; Nakaguchi, H.; et al. Early Alterations in Nutritional Indices in Metabolic Dysfunction-Associated Steatotic Liver Disease-Related Cirrhosis. Clin. Nutr. ESPEN 2025, 69, 286–291. [Google Scholar] [CrossRef] [PubMed]
- Amadieu, C.; Leclercq, S.; Coste, V.; Thijssen, V.; Neyrinck, A.M.; Bindels, L.B.; Cani, P.D.; Piessevaux, H.; Stärkel, P.; de Timary, P.; et al. Dietary Fiber Deficiency as a Component of Malnutrition Associated with Psychological Alterations in Alcohol Use Disorder. Clin. Nutr. 2021, 40, 2673–2682. [Google Scholar] [CrossRef] [PubMed]
- Shen, H.; Zhou, L.; Zhang, H.; Yang, Y.; Jiang, L.; Wu, D.; Shu, H.; Zhang, H.; Xie, L.; Zhou, K.; et al. Dietary Fiber Alleviates Alcoholic Liver Injury via Bacteroides Acidifaciens and Subsequent Ammonia Detoxification. Cell Host Microbe 2024, 32, 1331–1346.e6. [Google Scholar] [CrossRef] [PubMed]
- Jia, G.; Jia, M.; Li, C. The Moderating Effect of Dietary Fiber Intake on the Association between Sleep Pattern and Liver Fibrosis in Metabolic Dysfunction-Associated Steatotic Liver Disease: A Study from NHANES. BMC Gastroenterol. 2024, 24, 457. [Google Scholar] [CrossRef] [PubMed]
- Chen, X.-S.; Liu, H.-Z.; Huang, F.; Meng, J.; Fang, J.-X.; Han, Y.; Zou, H.-M.; Gu, Q.; Hu, X.; Ma, Q.-W.; et al. Impact of a High Dietary Fiber Cereal Meal Intervention on the Progression of Liver Fibrosis in T2DM with MASLD. Front. Endocrinol. . 2025, 16. [Google Scholar] [CrossRef] [PubMed]
- Lanthier, N.; Delzenne, N. Targeting the Gut Microbiome to Treat Metabolic Dysfunction-Associated Fatty Liver Disease: Ready for Prime Time? Cells 2022, 11, 2718. [Google Scholar] [CrossRef] [PubMed]
- Rodriguez, J.; Hiel, S.; Neyrinck, A.M.; Le Roy, T.; Pötgens, S.A.; Leyrolle, Q.; Pachikian, B.D.; Gianfrancesco, M.A.; Cani, P.D.; Paquot, N.; et al. Discovery of the Gut Microbial Signature Driving the Efficacy of Prebiotic Intervention in Obese Patients. Gut 2020, 69, 1975–1987. [Google Scholar] [CrossRef] [PubMed]
- Rodriguez, J.; Neyrinck, A.M.; Van Kerckhoven, M.; Gianfrancesco, M.A.; Renguet, E.; Bertrand, L.; Cani, P.D.; Lanthier, N.; Cnop, M.; Paquot, N.; et al. Physical Activity Enhances the Improvement of Body Mass Index and Metabolism by Inulin: A Multicenter Randomized Placebo-Controlled Trial Performed in Obese Individuals. BMC Med. 2022, 20, 110. [Google Scholar] [CrossRef] [PubMed]
- den Besten, G.; van Eunen, K.; Groen, A.K.; Venema, K.; Reijngoud, D.-J.; Bakker, B.M. The Role of Short-Chain Fatty Acids in the Interplay between Diet, Gut Microbiota, and Host Energy Metabolism. J. Lipid Res. 2013, 54, 2325–2340. [Google Scholar] [CrossRef] [PubMed]
- Ji, Y.; Yin, Y.; Sun, L.; Zhang, W. The Molecular and Mechanistic Insights Based on Gut–Liver Axis: Nutritional Target for Non-Alcoholic Fatty Liver Disease (NAFLD) Improvement. Int. J. Mol. Sci. 2020, 21, 3066. [Google Scholar] [CrossRef] [PubMed]
- Tedelind, S.; Westberg, F.; Kjerrulf, M.; Vidal, A. Anti-Inflammatory Properties of the Short-Chain Fatty Acids Acetate and Propionate: A Study with Relevance to Inflammatory Bowel Disease. World J. Gastroenterol. 2007, 13, 2826. [Google Scholar] [CrossRef] [PubMed]
- Gillard, J.; Clerbaux, L.-A.; Nachit, M.; Sempoux, C.; Staels, B.; Bindels, L.B.; Tailleux, A.; Leclercq, I.A. Bile Acids Contribute to the Development of Non-Alcoholic Steatohepatitis in Mice. JHEP Rep. 2022, 4, 100387. [Google Scholar] [CrossRef] [PubMed]
- Liu, Z.; Fang, T. Association between Dietary Carbohydrate to Fiber Ratio and Metabolic Dysfunction Associated Fatty Liver Disease in Adults: Evidence from the NHANES 2017–2020. J. Health Popul. Nutr. 2024, 43, 43. [Google Scholar] [CrossRef] [PubMed]
- Grinshpan, L.S.; Eilat-Adar, S.; Ivancovsky-Wajcman, D.; Kariv, R.; Gillon-Keren, M.; Zelber-Sagi, S. Ultra-Processed Food Consumption and Non-Alcoholic Fatty Liver Disease, Metabolic Syndrome and Insulin Resistance: A Systematic Review. JHEP Rep. 2024, 6. [Google Scholar] [CrossRef] [PubMed]
- Henney, A.E.; Gillespie, C.S.; Alam, U.; Hydes, T.J.; Cuthbertson, D.J. Ultra-Processed Food Intake Is Associated with Non-Alcoholic Fatty Liver Disease in Adults: A Systematic Review and Meta-Analysis. Nutrients 2023, 15. [Google Scholar] [CrossRef] [PubMed]
- Vancampfort, D.; Vandael, H.; Hallgren, M.; Probst, M.; Hagemann, N.; Bouckaert, F.; Van Damme, T. Physical Fitness and Physical Activity Levels in People with Alcohol Use Disorder versus Matched Healthy Controls: A Pilot Study. Alcohol 2019, 76, 73–79. [Google Scholar] [CrossRef] [PubMed]
- Dunn, N.; Zhang, W.; Blaney, H.L.; Diaz, L.A.; Patel, A.; Wong, R.J.; Arab, J.P.; Younossi, Z.; McClain, C.; Kong, M.; et al. Physical Activity and Advanced Fibrosis in MASLD, MetALD, and ALD in a Nationally Representative Cohort: NHANES 2017–2020. Hepatol. Commun. 2025, 9. [Google Scholar] [CrossRef] [PubMed]
Figure 1.
Study flowchart. MASLD, metabolic dysfunction–associated steatotic liver disease; ALD, alcohol-related liver disease; SLD, steatotic liver disease.
Figure 1.
Study flowchart. MASLD, metabolic dysfunction–associated steatotic liver disease; ALD, alcohol-related liver disease; SLD, steatotic liver disease.
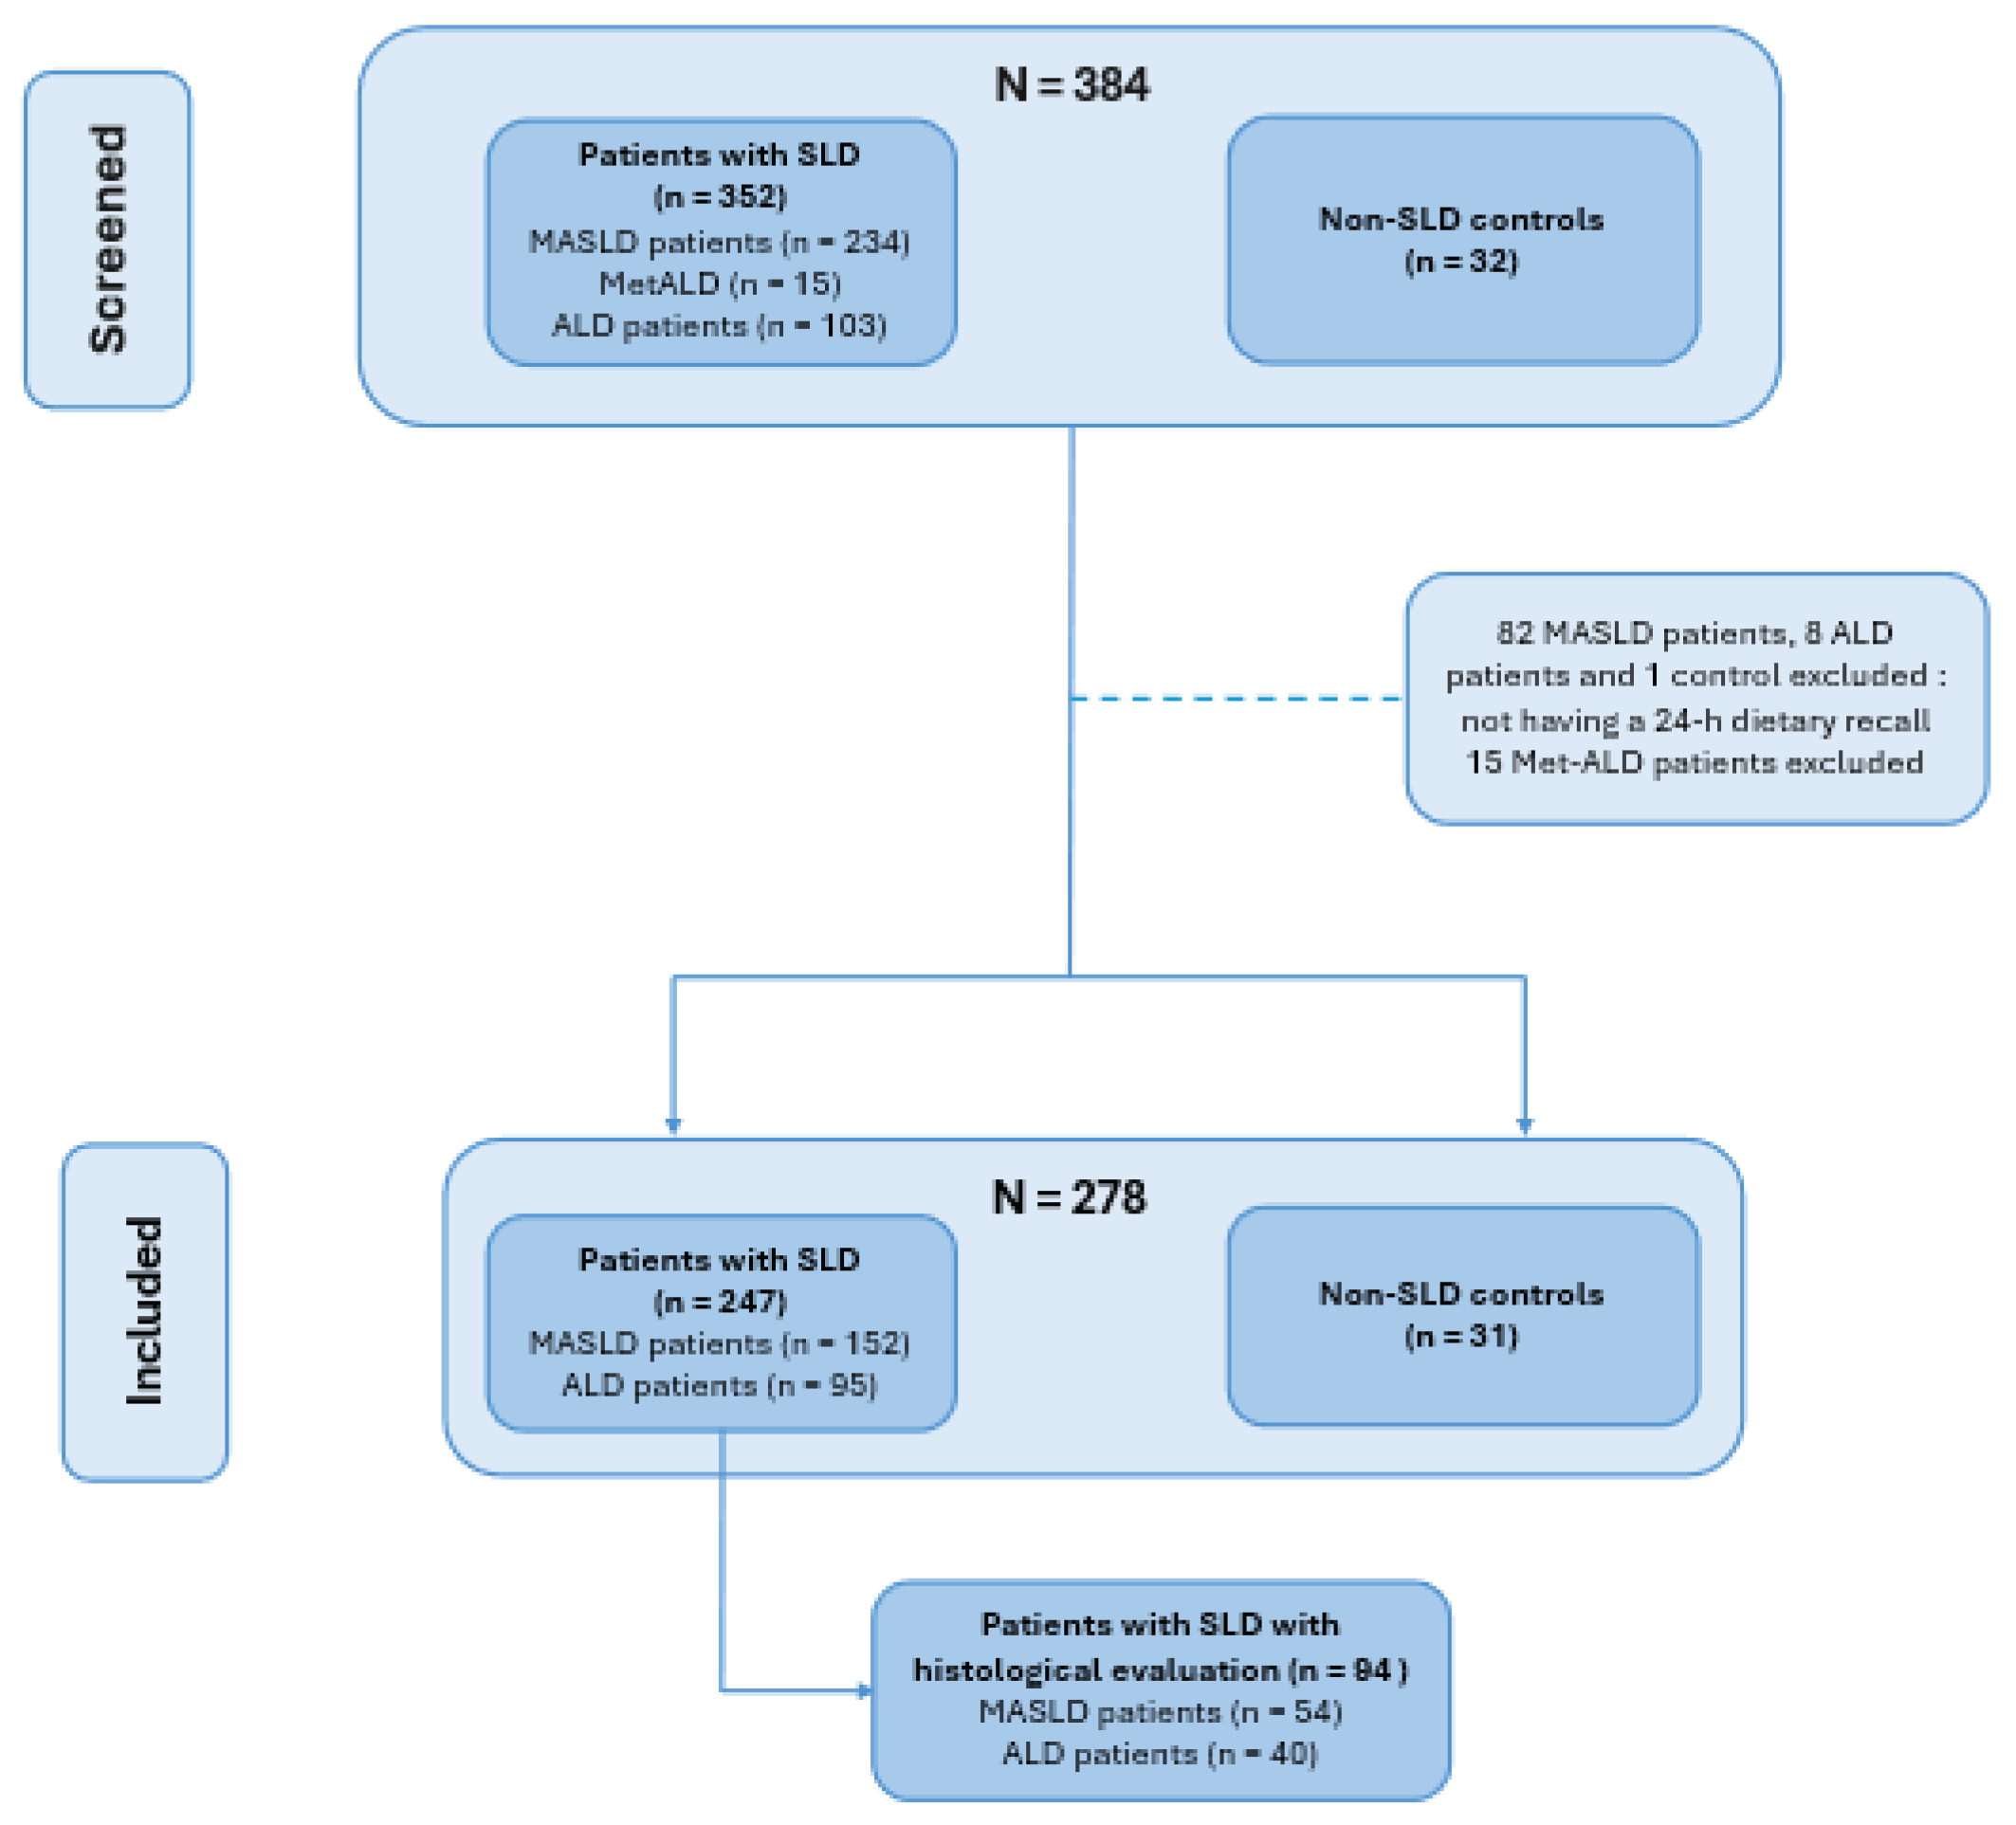
Figure 2.
Clinical and vibration-controlled transient elastography (VCTE) characteristics of controls and patients with MASLD and ALD. (A) Body mass index (BMI), (B) Homeostatic model assessment for insulin resistance (HOMA-IR), (C) Controlled attenuation parameter (CAP) and (D) Liver stiffness measurement in controls and patients with metabolic dysfunction–associated steatotic liver disease (MASLD) and alcohol-related liver disease (ALD). Data are shown as individual values with median and interquartile range. Group comparisons were performed using the Kruskal–Wallis test. *= P < 0.05, **= P < 0.01, *** = P < 0.001, and **** = P < 0.0001; ns, not significant.
Figure 2.
Clinical and vibration-controlled transient elastography (VCTE) characteristics of controls and patients with MASLD and ALD. (A) Body mass index (BMI), (B) Homeostatic model assessment for insulin resistance (HOMA-IR), (C) Controlled attenuation parameter (CAP) and (D) Liver stiffness measurement in controls and patients with metabolic dysfunction–associated steatotic liver disease (MASLD) and alcohol-related liver disease (ALD). Data are shown as individual values with median and interquartile range. Group comparisons were performed using the Kruskal–Wallis test. *= P < 0.05, **= P < 0.01, *** = P < 0.001, and **** = P < 0.0001; ns, not significant.
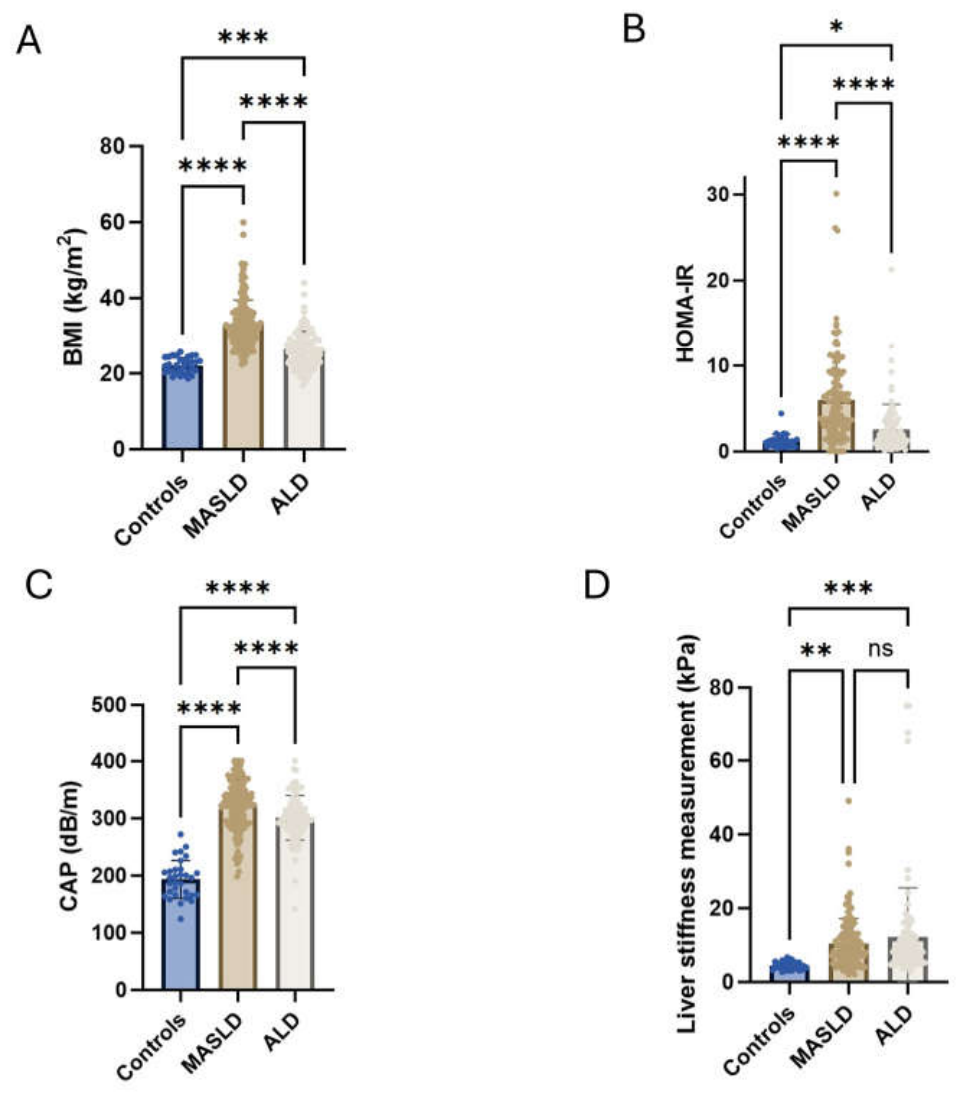
Figure 3.
Dietary fibre intake, ultra-processed food consumption, and leisure-time physical activity across study groups. (A) Daily fibre intake (g/day) in controls and patients with metabolic dysfunction–associated steatotic liver disease (MASLD) and alcohol-related liver disease (ALD). (B) Daily intake of ultra-processed foods (g/day) in controls and patients with MASLD and ALD. (C) Leisure-time physical activity expressed as MET-min/week in controls and patients with MASLD and ALD. Data are shown as individual values with median and interquartile range. Group comparisons were performed using the Kruskal–Wallis test. *= P < 0.05, **= P < 0.01, *** = P < 0.001, and **** = P < 0.0001; ns, not significant.
Figure 3.
Dietary fibre intake, ultra-processed food consumption, and leisure-time physical activity across study groups. (A) Daily fibre intake (g/day) in controls and patients with metabolic dysfunction–associated steatotic liver disease (MASLD) and alcohol-related liver disease (ALD). (B) Daily intake of ultra-processed foods (g/day) in controls and patients with MASLD and ALD. (C) Leisure-time physical activity expressed as MET-min/week in controls and patients with MASLD and ALD. Data are shown as individual values with median and interquartile range. Group comparisons were performed using the Kruskal–Wallis test. *= P < 0.05, **= P < 0.01, *** = P < 0.001, and **** = P < 0.0001; ns, not significant.
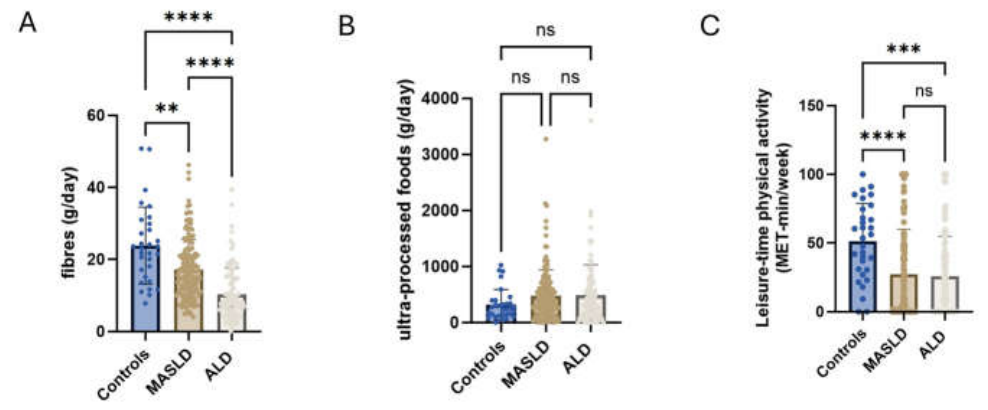
Figure 4.
Relationship between histological assessment and dietary data. (A) Representative hematoxylin and eosin–stained sections illustrating steatosis: mild steatosis (S1) on the left and severe steatosis (S3) on the right. (B) Representative hematoxylin and eosin–stained sections illustrating inflammatory activity: no activity (A0) on the left and severe activity (A4) on the right. The arrow in right figure B indicates a ballooned hepatocyte, and the arrowhead indicates lobular inflammation. (C) Representative picrosirius red–stained sections illustrating fibrosis: absence of fibrosis (F0) on the left and advanced fibrosis (F3) on the right. (D–F) Association between ultra-processed food (UPF) intake (% total energy intake (TEI)) and histological steatosis, activity, and fibrosis stages in patients with MASLD. (G–I) Association between UPF intake (%TEI) and histological steatosis, activity, and fibrosis stages in patients with ALD. (J-K) Association between fibre intake (g/day) and histologically assessed fibrosis stage in patients with MASLD and ALD respectively. Data are shown as individual values with median and interquartile range. Group comparisons were performed using the Kruskal–Wallis test for panels D–I and the Student’s t-test for panel J and K.
Figure 4.
Relationship between histological assessment and dietary data. (A) Representative hematoxylin and eosin–stained sections illustrating steatosis: mild steatosis (S1) on the left and severe steatosis (S3) on the right. (B) Representative hematoxylin and eosin–stained sections illustrating inflammatory activity: no activity (A0) on the left and severe activity (A4) on the right. The arrow in right figure B indicates a ballooned hepatocyte, and the arrowhead indicates lobular inflammation. (C) Representative picrosirius red–stained sections illustrating fibrosis: absence of fibrosis (F0) on the left and advanced fibrosis (F3) on the right. (D–F) Association between ultra-processed food (UPF) intake (% total energy intake (TEI)) and histological steatosis, activity, and fibrosis stages in patients with MASLD. (G–I) Association between UPF intake (%TEI) and histological steatosis, activity, and fibrosis stages in patients with ALD. (J-K) Association between fibre intake (g/day) and histologically assessed fibrosis stage in patients with MASLD and ALD respectively. Data are shown as individual values with median and interquartile range. Group comparisons were performed using the Kruskal–Wallis test for panels D–I and the Student’s t-test for panel J and K.
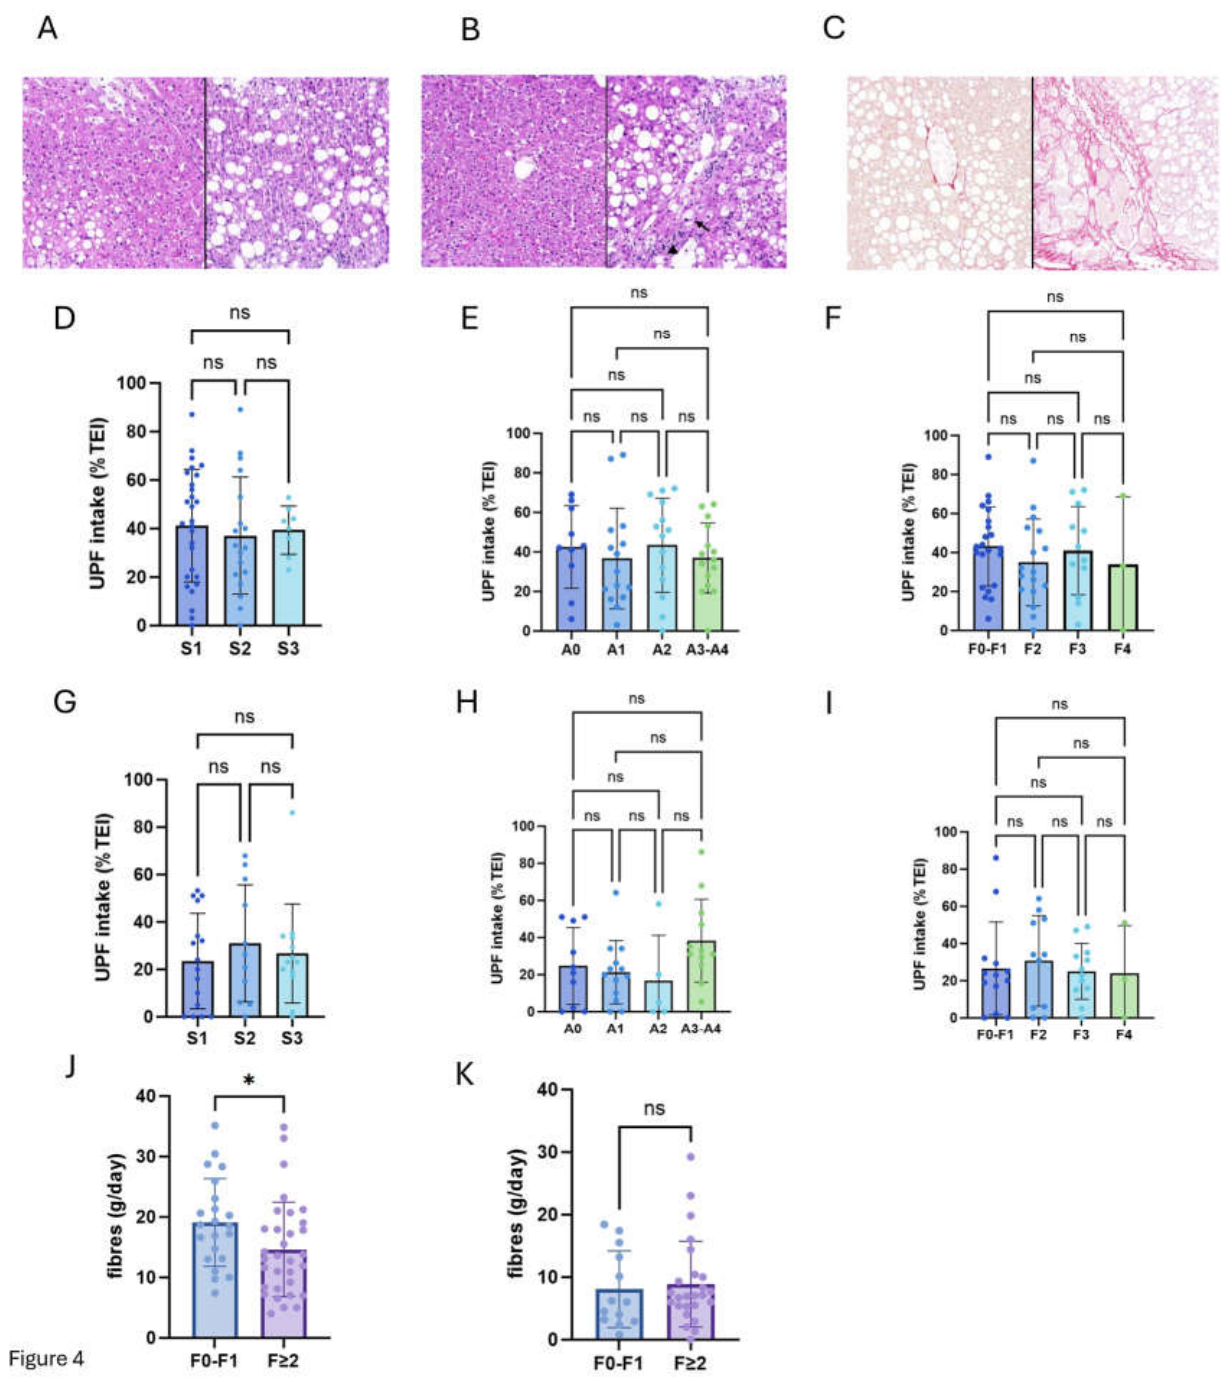

Table 1.
Baseline clinical characteristics in controls and patients with MASLD and ALD. Significant comparisons between controls and MASLD (α), controls and ALD (β), MASLD and ALD (γ); ALD: alcohol-related liver disease; ALT: alanine aminotransferase; AST: aspartate aminotransferase; GGT: gamma-glutamyl transferase; HDL-C: high-density lipoprotein cholesterol; HOMA-IR: homeostatic model assessment of insulin resistance; IQR: interquartile range; MASLD: metabolic dysfunction; associated steatotic liver disease. Continuous variables with a normal distribution were analyzed using one-way ANOVA and are presented as mean (min–max). Continuous variables that did not follow a normal distribution were analyzed using the Kruskal–Wallis test and are presented as median and interquartile range (IQR, Q1–Q3). Categorical variables were analyzed using the chi-square (χ²) test. A p-value < 0.05 was considered statistically significant.
Table 1.
Baseline clinical characteristics in controls and patients with MASLD and ALD. Significant comparisons between controls and MASLD (α), controls and ALD (β), MASLD and ALD (γ); ALD: alcohol-related liver disease; ALT: alanine aminotransferase; AST: aspartate aminotransferase; GGT: gamma-glutamyl transferase; HDL-C: high-density lipoprotein cholesterol; HOMA-IR: homeostatic model assessment of insulin resistance; IQR: interquartile range; MASLD: metabolic dysfunction; associated steatotic liver disease. Continuous variables with a normal distribution were analyzed using one-way ANOVA and are presented as mean (min–max). Continuous variables that did not follow a normal distribution were analyzed using the Kruskal–Wallis test and are presented as median and interquartile range (IQR, Q1–Q3). Categorical variables were analyzed using the chi-square (χ²) test. A p-value < 0.05 was considered statistically significant.
| Controls (n = 31) |
MALSD (n = 152) |
ALD (n = 95) |
P-value | |
|---|---|---|---|---|
| Clinical data | ||||
| age (years) – median (IQR) | 53 [40; 60] | 58 [47; 66) | 51[45; 60] | 0.0003 α,γ |
| male gender – n (%) | 12 (61) | 77 (51) | 68 (72) | 0.0012 β,γ |
| weight (kg) – mean (min-max) | 65 (48; 86) | 94 (59; 182) | 80 (40; 137) | <0.0001 α,β,γ |
| type 2 diabetes – n (%) | 0 (0) | 62 (41) | 5 (5) | <0.0001 α,γ |
| waist circumference (cm) – mean (min-max) | 79 (63; 95) | 112 (83; 160) | 100 (66; 135) | <0.0001 α,β,γ |
| AST (U/L) – median (IQR) | 24 [18; 27] | 30 [23; 38] | 38 [61; 120] | <0.0001 α,β,γ |
| ALT (U/L) – mean (min-max) | 18 (8; 56) | 47 (8; 173) | 69 (10; 210) | <0.0001 α,β,γ |
| GGT (U/l) – median (IQR) | 14 [10; 19] | 44 [29; 86] | 156 [70; 357] | <0.0001 α,β,γ |
| HDL- C (mg/dl) – mean (min-max) | 77 (48; 150) | 48 (20; 78) | 81 (28; 171) | <0.0001 α, γ |
| triglyceride (mg/dl) – mean (min-max) | 63 (38; 94) | 161 (55; 613) | 179 (45; 1596) | <0.0003 α, β |
| glycemia (non-diabetic) (mg/dl) – mean (min-max) | 90 (72; 111) | 100 (76; 128) | 100 (61; 186) | <0.0001 α,β,γ |
| insulinemia (non diabetic) (pmol/l) – mean (min-max) | 37 (9; 125) | 150 (24; 628) | 62 (4; 322) | <0.0001 α, γ |
Table 2.
Dietary intake, ultra-processed food consumption, and physical activity in controls and patients with MASLD and ALD. Significant comparisons between controls and MASLD (α), controls and ALD (β), MASLD and ALD (γ); ALD: alcohol-related liver disease; MASLD: metabolic dysfunction-associated steatotic liver disease; MET: metabolic equivalent of task; TEI: total energy intake. IPAQ: international physical activity questionnaire. Continuous variables with a normal distribution were analyzed using one-way ANOVA and are presented as mean (min–max). Continuous variables that did not follow a normal distribution were analyzed using the Kruskal–Wallis test and are presented as median and interquartile range (IQR, Q1–Q3). Categorical variables were analyzed using the chi-square (χ²) test. A p-value < 0.05 was considered statistically significant.
Table 2.
Dietary intake, ultra-processed food consumption, and physical activity in controls and patients with MASLD and ALD. Significant comparisons between controls and MASLD (α), controls and ALD (β), MASLD and ALD (γ); ALD: alcohol-related liver disease; MASLD: metabolic dysfunction-associated steatotic liver disease; MET: metabolic equivalent of task; TEI: total energy intake. IPAQ: international physical activity questionnaire. Continuous variables with a normal distribution were analyzed using one-way ANOVA and are presented as mean (min–max). Continuous variables that did not follow a normal distribution were analyzed using the Kruskal–Wallis test and are presented as median and interquartile range (IQR, Q1–Q3). Categorical variables were analyzed using the chi-square (χ²) test. A p-value < 0.05 was considered statistically significant.
| Controls (n = 31) |
MASLD patients (n = 152) |
ALD patients (n = 95) |
P-value | |
|---|---|---|---|---|
| 24h recall | ||||
| total calorie intake (kcal) – median (IQR) | 1990 [1320; 2280] | 1620 [1333; 2118] | 2290 [1858; 3120] | <0.0001 β,γ |
| proteins (% TEI) – median (IQR) | 16 [14; 18] | 17 [14; 19] | 11 [8; 15] | <0.0001 β,γ |
| proteins (g/day) – mean (min-max) * | 87 (37; 190) | 73 (18; 199) | 72 (16; 226) | ns |
| carbohydrates (% TEI) – median (IQR) | 37 [30; 44] | 42 [35; 49] | 27 [23; 36] | <0.0001 β,γ |
| carbohydrates (g/day) – median (IQR) | 188 [128; 218] | 175 [129; 220] | 166 [118; 242] | ns |
| added sugars (% TEI) – median (IQR) | 11 [4; 16] | 6 [2; 13] | 6 [1; 12] | 0.0341 β |
| added sugars (g/day) – median (IQR) | 45 [19; 84] | 24 [8; 55] | 31 [6; 77] | <0.0001 α,β |
| lipids (% TEI) – median (IQR) | 42 [35; 47] | 37 [32; 45] | 23 [16; 32] | <0.0001 β,γ |
| lipids (g/day) – median (IQR) | 89 [56; 117] | 65 [50; 96] | 8 [5; 15] | 0.0014 β,γ |
| saturated fatty acids (% TEI) – median (IQR) | 15 [9; 19] | 16 [12; 19] | 8 [5; 13] | <0.0001 β,γ |
| saturated fatty acids (g/day) – median (IQR) | 29 [19; 45] | 29 [20; 4] | 21 [13; 35] | 0.0017 γ |
| fibres (% TEI) – median (IQR) | 2.4 [1.9 ; 2.8] | 1.9 [1.4; 2.5] | 0.8 [0.5; 1.1] | <0.0001 β,γ |
| fibres (g/day) – median (IQR) | 23 [15; 30] | 16 [11; 21] | 8 [5; 15] | <0.0001 α,β,γ |
| alcohol (% TEI) – median (IQR) | 0 [0; 4] | 0 [0; 0] | 36 [22; 48] | <0.0001 β,γ |
| alcohol (g/day) – median (IQR) | 0 [0; 12] | 0 [0; 0] | 113 [68; 178] | <0.0001 β,γ |
| NOVA classification | ||||
| non processed foods (%TEI) – median (IQR) | 22 [9; 40] | 23 [12; 36] | 11 [1; 21] | <0.0001 β,γ |
| non processed foods (g/day) – median (IQR) | 450 [280; 912] | 476 [280; 678] | 282 [40; 471] | <0.0001 β,γ |
| processed culinary ingredients (%TEI) – median (IQR) | 5 [1; 10] | 3 [0; 11] | 0 [0; 7] | 0.036 β,γ |
| processed culinary ingredients (g/day) – median (IQR) | 10 [3; 25] | 10 [0; 30] | 0 [0; 20] | <0.0001 γ |
| processed foods (%TEI) – median (IQR) | 30 [14; 50] | 27 [13; 38] | 54 [40; 70] | <0.0001 β,γ |
| processed foods (g/day) – median (IQR) | 343 [125; 545] | 198 [106; 365] | 1500 [767; 2678] | <0.0001 β,γ |
| ultra-processed foods (%TEI) – median (IQR) | 36 [16; 44] | 39 [21; 57] | 26 [11; 46] | 0.023 γ |
| ultra-processed foods (g/day) – median (IQR) | 250 [132; 394] | 287 [192; 616] | 340 [120; 666] | Ns |
| IPAQ questionnaire | ||||
| unemployment rate – n (%) | 9 (29) | 70 (46) | 60 (63) | 0.0088 β,γ |
| total MET (MET-min/wk) – median (IQR) | 3013 [1386; 4034] | 1775 [737; 3216] | 1533 [529; 3474] | 0.0386 β |
| work (% total MET) – median (IQR) | 0 [0; 4] | 0 [0; 34] | 0 [0; 18] | <0.0001 α, γ |
| transport (% total MET) – median (IQR) | 1 [11; 34] | 3 [0; 20] | 8 [0; 30] | ns |
| domestic (% total MET) – median (IQR) | 19 [0; 37] | 44 [7; 75] | 23 [0; 69] | 0.0052 γ |
| leisure (% total MET) – median (IQR) | 54 [31; 74] | 11 [0; 47] | 17 [0; 41] | <0.0001 α,β |
| Metabolism data | ||||
| basal metabolism (kcal) – median (IQR) | 1430 [1360; 1740] | 1710 [1520; 1970] | 1740 [1560; 1850] | 0.0003 α,β |
| caloric need (kcal) – median (IQR) | 2480 [2210; 3100] | 2780 [2370; 3190] | 2740 [2428; 3030] | ns |
| energetic balance (Δ TEI%) – median (IQR) | - 21 [ -39; -7] | -40 [-52; -25] | -10 [-31; 11] | <0.0001 α, γ |
Table 3.
Histological evaluation of patients with MASLD and ALD. ALD, alcohol-related liver disease; MASLD, metabolic dysfunction–associated steatotic liver disease; S, steatosis; B, ballooning; LI, lobular inflammation; F, Fibrosis. Categorical variables were compared using the chi-square (χ²) test. A P-value <0.05 was considered statistically significant. Fibrosis assessment was not possible in one ALD patient, as determined by two anatomopathologists.
Table 3.
Histological evaluation of patients with MASLD and ALD. ALD, alcohol-related liver disease; MASLD, metabolic dysfunction–associated steatotic liver disease; S, steatosis; B, ballooning; LI, lobular inflammation; F, Fibrosis. Categorical variables were compared using the chi-square (χ²) test. A P-value <0.05 was considered statistically significant. Fibrosis assessment was not possible in one ALD patient, as determined by two anatomopathologists.
| MASLD patients (n = 54) |
ALD patients (n = 40) |
P-value | |
|---|---|---|---|
| Steatosis | |||
| S1 / S2 / S3 – no. (%) | 28 (51) / 18 (33) / 8 (15) | 16 (40) / 11 (28) / 13 (33) | ns / ns / 0.0490 |
| Ballooning and lobular inflammation | |||
| B0 / B1 / B2– no. (%) | 25 (46) / 15 (28) / 14 (26) | 24 (60) / 5 (13) / 11 (28) | ns / ns / ns |
| LI0 / LI1 / LI2– no. (%) | 10 (19) / 36 (37) / 8 (15) | 11 (28) / 18 (45) / 11 (28) | ns / ns /ns |
| Fibrosis | |||
| F0 / F1 / F2 / F3 / F4 – no. (%) | 4 (8) / 18 (33) / 17 (32) / 12 (22) / 3 (6) | 3 (8) / 10 (26) / 11 (28) / 12 (31) / 3 (8) | ns / ns / ns / ns / ns |
Disclaimer/Publisher’s Note: The statements, opinions and data contained in all publications are solely those of the individual author(s) and contributor(s) and not of MDPI and/or the editor(s). MDPI and/or the editor(s) disclaim responsibility for any injury to people or property resulting from any ideas, methods, instructions or products referred to in the content. |
© 2026 by the authors. Licensee MDPI, Basel, Switzerland. This article is an open access article distributed under the terms and conditions of the Creative Commons Attribution (CC BY) license.
Copyright: This open access article is published under a Creative Commons CC BY 4.0 license, which permit the free download, distribution, and reuse, provided that the author and preprint are cited in any reuse.