

Submitted:
26 October 2026
Posted:
27 October 2026
You are already at the latest version
Preprints on COVID-19 and SARS-CoV-2
Abstract
Background / Objectives: Circadian light exposure and rest–activity timing may influence hematologic physiology through pathways involving autonomic regulation, inflammation, and vascular function. However, the relationships between objectively measured circadian exposures and platelet indices remain insufficiently characterized, particularly in young adults with previous SARS-CoV-2 infection. We investigated associations between actigraphy-derived light and activity metrics and platelet indices, and examined whether these associations differed according to previous infection status. Methods: One hundred twelve young adults (mean age 24.4±9.7 years; 74 COVID+, 38 COVID−) from Tyumen, Russia, wore wrist actigraphs with light sensors for 7 consecutive days (October–November 2023). Fasting morning complete blood counts provided platelet count (PLT), mean platelet volume (MPV), platelet distribution width (PDW), and plateletcrit (PCT). Multivariable linear regression tested associations between circadian predictors and platelet indices, adjusted for age and sex. Results: No significant associations were found between circadian metrics and PLT, PDW, PCT, or MPV/PLT ratio after FDR correction. Higher MPV was independently associated with greater normalized amplitude of blue-light exposure, earlier BLE L5 onset, earlier wake time, and earlier 24-h activity acrophase. These associations were stronger in COVID+ participants and non-significant in COVID− participants. Earlier BLE L5 and fair light hygiene were associated with higher MPV in COVID+ only. Conclusions: In this cross-sectional study, MPV, but not the other platelet indices examined, was associated with selected measures of circadian light exposure and rest–activity timing. Associations were more pronounced among participants reporting previous SARS-CoV-2 infection. These findings identify a potential link between environmental circadian patterns and hematologic phenotype that warrants further investigation in relation to vascular physiology. Longitudinal studies incorporating direct measures of platelet function and cardiovascular regulation are needed to determine the underlying mechanisms and clinical significance.
Keywords:
circadian rhythms
; light exposure
; actigraphy
; mean platelet volume
; platelet indices
; SARS-CoV-2
; cardiovascular physiology
; post-infectious physiology
1. Introduction
Circadian light exposure and activity timing are increasingly recognized as critical environmental determinants of systemic physiology, with regulatory effects that extend beyond sleep to metabolic, immune, and hematologic systems [1,2,3,4,5]. Within this framework, optimal circadian light exposure is defined by the balance of daytime light intake, nighttime avoidance, and the regularity of the 24-hour photoperiod. Inadequate light dynamic range and mistimed exposure may compromise circadian entrainment, reduce circadian robustness [4,6,7], and perturb sleep quality and circadian regularity [8,9]. Furthermore, exposure to light at night has been independently linked to increased cardiovascular mortality [10,11]. Given that earlier phase timing and increased photic contrast, defined by high daytime vs. low nighttime illumination have been associated with variations in hematological parameters such as hemoglobin and mean corpuscular hemoglobin [5], it is plausible that platelet indices, as sensitive markers of systemic inflammation and activation, may also be modulated by circadian light-activity patterns.
Mechanistic evidence establishes the circadian clock as a direct regulator of platelet function; specifically, the nuclear receptor REV-ERBα (NR1D1), expressed in human platelets, promotes activation and thrombus formation via the RhoA/ERM pathway [12]. Crucially, REV-ERBα is not only rhythmic but also responsive to environmental cues: its expression in mononuclear cells is significantly predicted by the timing of physical activity and light exposure, showing pronounced seasonality at high latitudes [13]. These data underscore a potential link between circadian disruption, driven by altered light-activity patterns and platelet-mediated thrombotic risk, positioning platelet indices as potential readouts of circadian-driven physiological variation [12,13].
Platelet indices represent biologically plausible candidates for circadian modulation, given that platelet production, release kinetics, and reactivity are demonstrably influenced by inflammatory signaling, autonomic tone, and endothelial function, all of which exhibit significant circadian patterning [14,15]. Megakaryocyte proliferation is under circadian control, notably via N-methyl-D-aspartate receptor signaling [16]. Among routine hematological markers, Mean Platelet Volume (MPV) serves as a key surrogate for platelet turnover and activation [17,18,19]. However, the association between objective circadian light-activity patterns and MPV remains uncharacterized, particularly in young adults and the context of post-acute sequelae of COVID-19. Given that SARS-CoV-2 infection is associated with persistent platelet hyperactivity [20,21,22,23], we hypothesize that circadian misalignment may exacerbate platelet dysregulation in previously infected individuals, who may display heightened sensitivity to disrupted light-exposure patterns [24]. To address this, we evaluated whether objective circadian metrics are associated with MPV and whether these relationships are modulated by prior SARS-CoV-2 status.
Platelet biology represents a potential point of convergence between circadian regulation and cardiovascular physiology. Platelets contribute to hemostasis and vascular responses, while their production and functional state are influenced by inflammatory, autonomic, and endothelial pathways. These regulatory systems may be altered following viral infection, although the extent to which previous SARS-CoV-2 infection modifies relationships between environmental circadian exposures and routine platelet indices remains uncertain. Examining objectively measured light exposure and rest–activity timing alongside mean platelet volume may therefore provide an initial human observational perspective on interactions between environmental timing and hematologic physiology relevant to cardiovascular research.
2. Materials and Methods
2.1. Study Participants
This cross-sectional study included one hundred twelve young adults, all living in Tyumen, Russia (mean age ± SD: 24.40 ± 9.67 years; 28 males; 84 females), who completed seven-day actigraphy monitoring during late October and November 2023. Participants were screened upon admission, and individuals with major acute or chronic illnesses were not enrolled. Exclusion criteria also included shift work, night work, and transmeridian travel across more than two time zones during the preceding month. Participants were recruited by convenience from the available student population, with actigraphs deployed concurrently to limit seasonal differences in daylight and ambient temperature. Vaccination status was evenly distributed between the two COVID-19 groups. Participants in the COVID+ group reported a history of diagnosed infection, with all individuals being at least several months post-diagnosis and free from acute symptoms or sick leave at the time of actigraphy. The mean (± SD) duration since COVID-19 diagnosis in the COVID+ group was 448 ± 256 days, with a range of 31 to 945 days.
2.2. Actigraphy
Participants wore ActTrust 2 wrist actigraphs (Condor Instruments, São Paulo, Brazil) on the non-dominant wrist for seven consecutive days between 24 October and 20 November 2023. The devices recorded movement in Proportional Integrating Mode (PIM), ambient light exposure (LE), and blue-light exposure (BLE) at one-minute epochs. Validation studies confirm PIM’s high correlation (r > 0.85) with polysomnography for sleep–wake estimation [25]. BLE is irradiance (µW × cm⁻²) in the short-wavelength range as measured by the Blue channel of the Condor AcTrust2. Its RGB sensor for blue light aligns [26] with CIE S 026:2018 standards for melanopic irradiance [27].
Circadian activity and light-exposure variables were derived in ActStudio v1.0.26. For physical activity (PA) and BLE, we calculated the rhythm-adjusted 24-h mean (MESOR), 24-h amplitude, and acrophase. The normalized amplitude of blue light exposure (NA BLE) is a further informative index, calculated as the ratio of the 24-h amplitude of the fitted cosine curve for BLE data to its MESOR. This normalization allows for standardized comparison of BLE patterns across individuals and was proven to be an informative index of circadian light hygiene in previous studies [4,6]. This metric standardizes the dynamic range of BLE relative to its average value, accounting for individual differences and thereby minimizing inter-individual variability. Non-parametric indices for PA and BLE included the most active/exposed 10-h period (M10) and the least active/exposed 5-h period (L5) and the time of their onset, as well as the inter-daily stability (consistency across days), intra-daily variability (within-day fragmentation), and relative amplitude (RA), which was calculated as (M10 − L5)/(M10 + L5) for both PA and BLE. Sleep parameters, such as bedtime, wake time, total sleep time, sleep efficiency, and wake after sleep onset (WASO), were also derived using the ActStudio software Version 1.0.26 based on established algorithms.
2.3. Platelet Analysis in Blood
Fasting blood samples were collected just before actigraphy recordings. A complete blood count (CBC) was performed, which included Platelet Count: number of platelets per microliter (×10⁹/L); MPV, Mean Platelet Volume: average platelet size (fL); PDW, Platelet Distribution Width: coefficient of variation in platelet size (%); PCT, Plateletcrit: percentage volume of blood occupied by platelets (%); and MPV to PLT ratio (MPV/PLT). Blood collection was performed in the morning between 08:00 and 09:00 in the Tyumen Medical University laboratory. Prior to sampling, the venipuncture site (antecubital fossa) was disinfected with two alcohol swabs. Blood was drawn by venipuncture into vacuum tubes and allowed to clot at room temperature for one minute. Samples were centrifuged at 3000 rpm for 10 min, 15 min after collection. The serum was then removed from the clot using a pipette with a disposable tip, transferred to clean tubes, and stored at 4 °C until analysis. Leukocyte populations were differentiated using a Sysmex XN–1000 hematology analyzer, Sysmex Corporation, Kobe (Japan) with adapted reagents, employing fluorescent flow cytometry technology.
2.4. Data Analysis
Statistical analyses were performed using STATISTICA 6, Office Libre Calc, and SPSS 23.0. We analyzed associations between actigraphy-derived circadian metrics (BLE and PA variables) and complete blood count endpoints using multivariable linear regression. All models were adjusted a priori for age and sex. The significance threshold for all statistical tests was set at α = 0.05. To account for multiple comparisons, the Benjamini–Hochberg False Discovery Rate (FDR) correction was applied across primary predictors, with a critical FDR of 0.10. Potential multicollinearity among predictor variables was assessed using Variance Inflation Factors (VIFs; VIF < 5 indicated acceptable collinearity). To formally compare correlation strengths between COVID+ and COVID− groups, we used the cocor free online software [28], which implements Fisher's z-transformation for comparing independent correlations. Power analysis and sample justification. A priori sample-size estimation for multivariable linear regression (two covariates: age and sex; one primary circadian predictor) indicated that n ≈ 102 would provide >80% power to detect a small-to-moderate effect (partial η² ≈ 0.06; Cohen's f² ≈ 0.064) at α = 0.05. Our enrolled sample (n = 112) therefore exceeded this requirement. Post hoc sensitivity analyses for subgroup comparisons showed that the COVID+ subgroup (n = 74) had >80% power to detect partial η² ≥ 0.11 (f² ≈ 0.124), while the COVID− subgroup (n = 38) had >80% power only for larger effects (partial η² ≥ 0.18).
2.5. Declaration of AI and AI-Assisted Technologies in the Writing Process
AI-assisted technologies (Perplexity AI) were applied exclusively to improve the readability and language of the manuscript.
3. Results
3.1. Associations with Platelet Indices
MPV approximated a normal distribution (Shapiro-Wilk: W = 0.992, p = 0.701), whereas platelet count, PDW, and PCT were not normally distributed (all p < 0.03). No significant associations were observed between actigraphic metrics of sleep, PA, or BLE and PCT, PDW, or the MPV/PLT ratio (all p > 0.05 after FDR correction). Higher PLT was nominally associated with lower sleep efficiency (r = −0.195, p = 0.033), but this correlation did not remain significant after Benjamini–Hochberg FDR correction and was not evident in models adjusted for age and sex. In contrast, MPV showed numerous significant associations with circadian light and rest–activity metrics, and these associations were markedly dependent on prior COVID-19 status.
3.2. Circadian Light Hygiene and MPV in the Full Sample
In the full cohort (n = 112), MPV was positively associated with several circadian endpoints of BLE and PA (Table 1). With respect to BLE, higher MPV was associated with greater NA BLE (r = 0.298, p = 0.001) and earlier BLE L5 onset (r = −0.223, p = 0.015). For PA, higher MPV was associated with earlier wake time (r = −0.257, p = 0.005), earlier PA acrophase (r = −0.266, p = 0.004), and earlier PA L5 onset (r = −0.196, p = 0.033). Borderline associations were observed regarding higher MPV with earlier BLE acrophase (r = −0.168, p = 0.076), smaller non-parametric RA PA (r = 0.159, p = 0.084), and smaller parametric PA amplitude (r = 0.155, p = 0.093).
3.3. Results by COVID Group
The analysis included 112 young adults, of whom 74 reported prior COVID-19 infection (COVID+) and 38 had no history of COVID-19 (COVID−). The two groups were comparable with respect to sex distribution (χ² = 0.479, p = 0.489), body mass index (p = 0.304), sleep duration (p = 0.945), sleep efficiency (p = 0.259), and all platelet indices, including platelet count (p = 0.783), MPV (p = 0.852), PDW (p = 0.568), and PCT (p = 0.245) (Table 2). The only baseline variable that differed significantly between the two groups was age, with the COVID+ group older than the COVID− group (25.49 ± 2.35 vs 21.89 ± 5.27 years, p = 0.015). Circadian light and activity measures were broadly comparable between the two groups. BLE acrophase, BLE L5, NA BLE, wake time, bedtime, total sleep time, and sleep efficiency did not differ significantly by COVID-19 history (all p > 0.124). Only BLE M10 showed a trend toward lower values in the COVID+ group (p = 0.076). Thus, subgroup differences observed in subsequent analyses were not attributable to baseline imbalances in circadian endpoints.
3.4. COVID-19 Status Modifies Circadian–MPV Associations
All associations were substantially strong in the COVID+ group (Figure 1) but not detected in the COVID− group. In COVID+ participants (n = 74), MPV was strongly associated with BLE L5 onset (r = −0.446, p < 0.0001), NA BLE (r = 0.435, p < 0.0001), wake time (r = −0.400, p = 0.0003), PA acrophase (r = −0.344, p = 0.002), RA PA (r = 0.245, p = 0.030), PA L5 onset (r = −0.413, p = 0.0002), and PA amplitude (r = 0.266, p = 0.019). In contrast, none of these correlations reached statistical significance in the COVID− group (n = 38): BLE L5 onset (r = 0.171, p = 0.285), NA BLE (r = 0.034, p = 0.837), wake time (r = 0.024, p = 0.882), PA acrophase (r = −0.081, p = 0.613), PA L5 onset (r = 0.164, p = 0.304), RA PA (r = −0.016, p = 0.923), and PA amplitude (r = −0.061, p = 0.703).
Formal comparison of correlation strengths using cocor (Fisher's z transformation) confirmed that correlations were significantly stronger in COVID+ versus COVID− participants for BLE L5 onset (z = −3.159, p = 0.0016), PA L5 onset (z = −2.928, p = 0.003), NA BLE (z = 2.092, p = 0.037), and wake time (z = −2.168, p = 0.030), with a difference of borderline significance for PA acrophase (z = −1.858, p = 0.063).
3.5. Multivariable Regression Models
Because the COVID+ group was older than the COVID− group (p = 0.015), all multivariable models were adjusted for age and sex. In the full cohort, lower MPV was independently associated with later BLE L5 onset (β = −0.286; 95% CI: −0.463 to −0.110; p = 0.002; partial η² = 0.083), later wake time (β = −0.278; 95% CI: −0.455 to −0.101; p = 0.002; partial η² = 0.077), later PA acrophase (β = −0.274; 95% CI: −0.449 to −0.098; p = 0.003; partial η² = 0.076), later PA L5 onset (β = −0.220; 95% CI: −0.400 to −0.040; p = 0.017; partial η² = 0.049), and greater NA BLE (β = 0.280; 95% CI: 0.094 to 0.466; p = 0.003; partial η² = 0.075), Table 3. Borderline associations were observed for PA RA (β = 0.166, p = 0.072) and PA amplitude (β = 0.163, p = 0.078).
Stratified analyses revealed that these associations were concentrated in the COVID+ subgroup (Figure 1). In COVID+ participants, lower MPV was strongly associated with later BLE L5 onset (β = −0.479; 95% CI: −0.686 to −0.272; p < 0.001; partial η² = 0.226), later wake time (β = −0.426; 95% CI −0.638 to −0.214; p < 0.001; partial η² = 0.178), later PA acrophase (β = −0.355; 95% CI: −0.572 to −0.137; p = 0.002; partial η² = 0.125), later PA L5 onset (β = −0.443; 95% CI: −0.653 to −0.232; p < 0.001; partial η² = 0.191), and greater NA BLE (β = 0.415; 95% CI: 0.193 to 0.637; p < 0.001; partial η² = 0.166). PA RA (β = 0.254, p = 0.028) and PA amplitude (β = 0.265, p = 0.020) were modestly associated with MPV in this group. In contrast, none of the circadian predictors reached statistical significance in the COVID− subgroup (all p ≥ 0.200), with small effect sizes and uniformly low partial η² values (≤0.043). Age and sex were not significant predictors in any model (all p > 0.112). Of note, in COVID+ participants with NA BLE <1, lower MPV was associated with borderline statistical significance with the number of days passed since diagnosis (r = –0.527, p = 0.064), while such an association was clearly absent in COVID+ participants with NA BLE >1 (r =–0.034; p = 0.817).
3.6. Binary Subgroup Analyses
Consistent with the continuous analyses, young adults whose BLE L5 onset occurred before vs. after 02:00 had significantly higher MPV values, overall (p = 0.009) and more markedly in the COVID+ subgroup (p = 0.001), but not in the COVID– subgroup (p = 0.884) (Figure 2). Similarly, participants with a fairer circadian light hygiene (NA BLE > 1) had higher MPV values compared to those with a poorer light hygiene (NA BLE < 1), overall (p = 0.0002) and in the COVID+ cohort (p < 0.0001), but not in the COVID– group (p = 0.485).
4. Discussion
In this actigraphy-based study of young adults, objective circadian indices of BLE and rest–activity timing were independently associated with MPV. Specifically, greater NA BLE, earlier BLE L5 onset, earlier wake time, and earlier PA acrophase were associated with higher MPV in multivariable models adjusted for age and sex. Importantly, these associations were concentrated in participants with prior SARS-CoV-2 infection: effect sizes and explained variance were substantially larger in the COVID+ subgroup (partial η² up to 0.226), whereas associations were absent in the COVID– subgroup. Formal comparison of correlation strengths confirmed that these differences between COVID+ and COVID– groups were statistically significant.
MPV reflects platelet size, maturation state, and, indirectly, platelet reactivity. Larger platelets are metabolically and enzymatically more active, exhibit greater thrombotic potential, and are released earlier from megakaryocytes during accelerated thrombopoiesis [17,18,19]. The observed positive association between NA BLE and MPV indicates that a larger dynamic range of BLE across the 24-hour cycle is linked to increased MPV. Likewise, earlier BLE L5 onset and earlier activity timing correlated with higher MPV. One mechanistic interpretation is that stronger circadian entrainment, characterized by greater daytime–nighttime contrast in light irradiance, and earlier alignment of behavioral rhythms support more robust, possibly accelerated, megakaryocyte maturation or regulated platelet release, leading to larger platelets, measured as higher MPV. Alternatively, circadian inputs may modulate inflammatory signaling or sympathetic activity that influences thrombopoiesis and platelet size or shifts the circadian phase position of MPV.
Direct mechanistic evidence now supports circadian regulation of platelet function: the nuclear receptor REV-ERBα (NR1D1) is functionally expressed in human platelets, exhibits a circadian rhythm that positively correlates with platelet aggregation, and acts as a positive regulator of platelet activation and thrombus formation via the oligophrenin-1–mediated RhoA/ERM pathway [12]. Pharmacological inhibition of REV-ERBα decreases platelet activation markers in human platelets [12]. Critically, human REV-ERBα expression is dynamically regulated by environmental light and physical activity: in Arctic residents, morning REV-ERBα expression in mononuclear cells shows pronounced seasonality (peak at summer solstice, nadir at winter solstice) and is significantly predicted by the amount and timing of light exposure and physical activity [13]. These findings suggest that endogenous circadian clock proteins may directly potentiate platelet activation and demonstrate that REV-ERBα is responsive to external light and behavioral cues, supporting the notion that circadian disruption or altered light hygiene may alter platelet biology and thrombotic risk [12,13,29].
That these associations were selectively evident in individuals with prior COVID-19 suggests that SARS-CoV-2 infection may sensitize platelet production or its circadian regulation [30,31,32]. Influenza A virus infection similarly triggers emergency megakaryopoiesis with hyper-reactive, immature platelets via IL-1/IL-6 signaling [33]. COVID-19 is associated with persistent alterations in immune activation, endothelial function, and autonomic regulation in some individuals [20,21,22,23]; such alterations could amplify responsiveness to circadian inputs or unmask relationships that are weaker in non-infected peers. For example, post-infectious endothelial or inflammatory remodeling might render megakaryopoiesis more dependent on circadian cues, producing the larger effect sizes observed in COVID+ participants. Additionally, previous research found that COVID-negative individuals had lower exposure to daylight compared to COVID-positive individuals in similar cohorts [34,35,36], which may contribute to differential circadian entrainment and platelet biology.
Stronger circadian entrainment (greater daylight exposure, clearer day–night contrast, earlier timing) may thus support more robust thrombopoiesis and platelet release, particularly in individuals whose platelet regulation has been altered by prior viral infection. This interpretation aligns with the observation that adverse cardiovascular events exhibit diurnal patterns with morning peaks, potentially related to endogenous circadian clock control of platelet activation [12].
Future directions. Our cross-sectional findings suggest that circadian light exposure and behavioral timing may be relevant to platelet phenotype following viral illness, highlighting potentially modifiable environmental and behavioral factors for further investigation. Specifically, daytime blue-enriched illumination, reduced nocturnal BLE, and consistent wake and activity timing warrant investigation as potential targets for circadian interventions in populations with previous SARS-CoV-2 infection. Future research should determine whether the observed associations extend to direct measures of platelet activation, endothelial function, inflammatory signaling, and autonomic regulation. Longitudinal studies are needed to establish temporal relationships between circadian exposures and hematologic outcomes, while intervention studies should evaluate whether modifying light exposure or activity timing produces reproducible changes in platelet phenotype or function. Ultimately, this research may clarify the physiological and clinical significance of these associations beyond MPV alone and establish their relevance to cardiovascular physiology.
Study Strengths: This study provided objective, season-standardized actigraphy integrated with precise blue-light quantification. Our focus on young adults mitigates confounding by age-related comorbidities. Importantly, subgroup analyses by COVID-19 history revealed clinically informative heterogeneity, underscoring the context-dependent nature of these associations. The formal comparison of correlation strengths between groups using cocor further enhanced statistical rigor.
Study Limitations: The primary limitation is the cross-sectional design, which inherently precludes causal inference. The convenience sampling of students restricts the generalizability of our findings to broader populations. While the subgroup analyses were informative, the modest COVID-19 sample size reduced our power to definitively detect all potential subgroup effects. Although actigraphic blue-light sensors provide a reasonable approximation of melanopic irradiance [26,27], inherent device limitations and variability in indoor lighting conditions may introduce measurement error. Crucially, while we collected data on time since infection, we lacked information on COVID-19 severity, which limited our ability to fully explore mediating roles. However, striking differences in the association between the elapsed time since diagnosis and MPV between COVID-19 positive individuals with poor (NA BLE <1; r = –0.527, p = 0.064) versus fair (NA BLE >1; r = –0.034; p = 0.817) light hygiene highlights a potential, yet unconfirmed, interaction. This observation underscores the need for longitudinal studies to clarify these complex relationships and the influence of other potential mediators, including infection severity. Future studies can also address timing and amplitude of light depending on particular spectral domains (e.g. blue light vs red light exposure) as their effects on platelet activation may be distinct [37].
5. Conclusions
Objective circadian metrics of BLE and behavioral timing are associated with MPV in young adults, an effect markedly amplified among those with prior SARS-CoV-2 infection. These results highlight circadian light hygiene as a potentially modifiable determinant of platelet biology in the post-COVID context and support further mechanistic and interventional research.
Author Contributions
Conceptualization, D.G., J.B. and G.C.; methodology, D.G., J.B., L.G., N.S., O.S., D.T., L.A., D.W. and G.C.; software, D.G., L.A., D.W. and G.C.; formal analysis, D.G., J.B., O.S., S.K., L.D., D.T. and L.A.; investigation, D.G., J.B., L.G., N.S., S.K. and L.D.; data curation, D.G., J.B., S.K., S.S. and L.D.; writing—original draft preparation, D.G. and G.C.; writing—review and editing, D.G., J.B., L.G., N.S., O.S., S.K., S.S., L.D., D.T., L.A. and D.W.; visualization, D.G., L.A., D.W. and G.C.; project administration, J.B., L.G., N.S., D.G. and S.S. All authors have read and agreed to the published version of the manuscript.
Funding
The study was supported by the West–Siberian Science and Education Center, Government of Tyumen District, Decree of 20 November 2020, No. 928–rp. The funding organization had no role in the design or conduct of this research. The author(s) have no proprietary or commercial interest in any materials discussed in this article.
Institutional Review Board Statement
The study was conducted in accordance with the ethical principles of the Declaration of Helsinki and was approved by the Ethics Committee of Tyumen State Medical University (Protocol No. 115, June 30, 2023).
Informed Consent Statement
Written informed consent has been obtained from all the participants publish this paper.
Data Availability Statement
The data presented in this study are available on a reasonable request from the corresponding author.
Conflicts of Interest
The authors declare no conflict of interest. The funders had no role in the design of the study; in the collection, analyses, or interpretation of data; in the writing of the manuscript; or in the decision to publish the results.
References
- Haspel, J.A.; Anafi, R.; Brown, M.K.; Cermakian, N.; Depner, C.; Desplats, P.; Gelman, A.E.; Haack, M.; Jelic, S.; Kim, B.S.; et al. Perfect timing: Circadian rhythms, sleep, and immunity—an NIH workshop summary. JCI Insight 2020, 5, e131487. [CrossRef]
- Brown, T.M.; Brainard, G.C.; Cajochen, C.; Czeisler, C.A.; Hanifin, J.P.; Lockley, S.W.; Lucas, R.J.; Münch, M.; O'Hagan, J.B.; Peirson, S.N.; et al. Recommendations for daytime, evening, and nighttime indoor light exposure to best support physiology, sleep, and wakefulness in healthy adults. PLoS Biol. 2022, 20, e3001571. [CrossRef]
- Mayer, C.; Walch, O.; Forger, D.B.; Hannay, K. Impact of light schedules and model parameters on the circadian outcomes of individuals. J. Biol. Rhythms 2023, 38, 379–391. [CrossRef]
- Gubin, D.; Stefani, O.; Cornelissen, G. Light hygiene for circadian health: A molecular perspective. Front. Biosci. (Landmark Ed.) 2025, 30, 39097. [CrossRef]
- Gubin, D.; Boldyreva, J.; Kolomeichuk, S.; Stefani, O.; Shigabaeva, A.; Alkhimova, L.; Tchaikovkaya, M.; Weinert, D.; Cornelissen, G. Circadian light hygiene is associated with anemia markers in young adults. Biology 2025, 14, 1649. [CrossRef]
- Gubin, D.G.; Borisenkov, M.F.; Kolomeichuk, S.N.; Markov, A.A.; Weinert, D.; Cornelissen, G.; Stefani, O. Evaluating circadian light hygiene: Methodology and health implications. Russ. Open Med. J. 2024, 13, e0415. [CrossRef]
- Lewis, P.; Christoforou, R.; Ha, P.P.; Wild, U.; Schweiker, M.; Erren, T.C. Architecture, light, and circadian biology: A scoping review. Sci. Total Environ. 2024, 955, 177212. [CrossRef]
- Hand, A.J.; Stone, J.E.; Shen, L.; Vetter, C.; Cain, S.W.; Bei, B.; Phillips, A.J.K. Measuring light regularity: Sleep regularity is associated with regularity of light exposure in adolescents. Sleep 2023, 46, zsad001. [CrossRef]
- Full, K.M.; Huang, T.; Shah, N.A.; Allison, M.A.; Michos, E.D.; Duprez, D.A.; Redline, S.; Lutsey, P.L. Sleep irregularity and subclinical markers of cardiovascular disease: The Multi-Ethnic Study of Atherosclerosis. J. Am. Heart Assoc. 2023, 12, e027361. [CrossRef]
- Windred, D.P.; Burns, A.C.; Lane, J.M.; Olivier, P.; Rutter, M.K.; Saxena, R.; Phillips, A.J.K.; Cain, S.W. Brighter nights and darker days predict higher mortality risk: A prospective analysis of personal light exposure in >88,000 individuals. Proc. Natl. Acad. Sci. USA 2024, 121, e2405924121. [CrossRef]
- Windred, D.P.; Burns, A.C.; Rutter, M.K.; Lane, J.M.; Saxena, R.; Scheer, F.A.J.L.; Cain, S.W.; Phillips, A.J.K. Light exposure at night and cardiovascular disease incidence. JAMA Netw. Open 2025, 8, e2539031. [CrossRef]
- Shi, J.; Tong, R.; Zhou, M.; Gao, Y.; Zhao, Y.; Chen, Y.; Liu, W.; Li, G.; Lu, D.; Meng, G.; et al. Circadian nuclear receptor Rev-erbα is expressed by platelets and potentiates platelet activation and thrombus formation. Eur. Heart J. 2022, 43, 2317–2334. [CrossRef]
- Gubin, D.; Kolomeichuk, S.; Danilenko, K.; Stefani, O.; Markov, A.; Petrov, I.; Voronin, K.; Mezhakova, M.; Borisenkov, M.; Shigabaeva, A.; et al. Light exposure, physical activity, and indigeneity modulate seasonal variation in NR1D1 (REV-ERBα) expression. Biology 2025, 14, 231. [CrossRef]
- Scheer, F.A.; Michelson, A.D.; Frelinger, A.L., III; Evoniuk, H.; Kelly, E.E.; McCarthy, M.; Doamekpor, L.A.; Barnard, M.R.; Shea, S.A. The human endogenous circadian system causes greatest platelet activation during the biological morning independent of behaviors. PLoS ONE 2011, 6, e24549. [CrossRef]
- Morris, C.J.; Yang, J.N.; Scheer, F.A.J.L. The impact of the circadian timing system on cardiovascular and metabolic function. Prog. Brain Res. 2012, 199, 337–358. [CrossRef]
- Hearn, J.I.; Alhilali, M.; Kim, M.; Kalev-Zylinska, M.L.; Poulsen, R.C. N-methyl-D-aspartate receptor regulates the circadian clock in megakaryocytic cells and impacts cell proliferation through BMAL1. Platelets 2023, 34, 2206918. [CrossRef]
- Korniluk, A.; Koper-Lenkiewicz, O.M.; Kamińska, J.; Kemona, H.; Dymicka-Piekarska, V. Mean platelet volume (MPV): New perspectives for an old marker in the course and prognosis of inflammatory conditions. Mediators Inflamm. 2019, 2019, 9213074. [CrossRef]
- Anandani, G.; Goswami, P.; Bhankhodia, V.; Dave, R. Mean platelet volume: A versatile biomarker in clinical diagnostics and prognostics. Bioinformation 2025, 21, 783–788. [CrossRef]
- Kelem, A.; Engidaye, G.; Mandefro, B.; Alemu, M.W.; Addisu, B.; Mulatie, Z.; Teketelew, B.B.; Arkew, M.; Adane, T. Mean platelet volume as a biomarker of anemia and platelet disorders among metabolic syndrome patients in Northwest Ethiopia. Sci. Rep. 2025, 15, 37304. [CrossRef]
- Nara, N.; Shimizu, M.; Yamamoto, M.; Nakamizo, T.; Hayakawa, A.; Johkura, K. Prolonged platelet hyperactivity after COVID-19 infection. Br. J. Haematol. 2024, 204, 492–496. [CrossRef]
- Suski, M.; Olszanecka, A.; Stachowicz, A.; Kiepura, A.; Terlecki, M.; Madej, J.; Rajzer, M.; Olszanecki, R. Alterations in plasma proteome during acute COVID-19 and recovery. Mol. Med. 2024, 30, 131. [CrossRef]
- Maugeri, N.; De Lorenzo, R.; Mazza, M.G.; Palladini, M.; Ciceri, F.; Rovere-Querini, P.; Manfredi, A.A.; Benedetti, F. Preferential and sustained platelet activation in COVID-19 survivors with mental disorders. Sci. Rep. 2024, 14, 16119. [CrossRef]
- Livieratos, A.; Lockley, S.W.; Tsiodras, S. Post-infectious fatigue and circadian rhythm disruption in long-COVID and other infections: A need for further research. eClinicalMedicine 2025, 80, 103073. [CrossRef]
- Gubin, D.; Boldyreva, J.; Stefani, O.; Kolomeichuk, S.; Danilova, L.; Shigabaeva, A.; Cornelissen, G.; Weinert, D. Higher vulnerability to poor circadian light hygiene in individuals with a history of COVID-19. Chronobiol. Int. 2025, 42, 133–146. [CrossRef]
- Blackwell, T.; Redline, S.; Ancoli-Israel, S.; Schneider, J.L.; Surovec, S.; Johnson, N.L.; Cauley, J.A.; Stone, K.L.; Study of Osteoporotic Fractures Research Group. Comparison of sleep parameters from actigraphy and polysomnography in older women: The SOF Study. Sleep 2008, 31, 283–291. [CrossRef]
- Price, L.L.; Lyachev, A.; Khazova, M. Optical performance characterization of light-logging actigraphy dosimeters. J. Opt. Soc. Am. A 2017, 34, 545–557. [CrossRef]
- Commission Internationale de l'Éclairage (CIE). CIE System for Metrology of Optical Radiation for ipRGC-Influenced Responses to Light; CIE Central Bureau: Vienna, Austria, 2018.
- Diedenhofen, B.; Musch, J. cocor: A comprehensive solution for the statistical comparison of correlations. PLoS ONE 2015, 10, e0121945. Erratum in: PLoS ONE 2015, 10, e0131499. https://doi.org/10.1371/journal.pone.0131499. [CrossRef]
- Kelters, I.R.; Koop, Y.; Young, M.E.; Daiber, A.; van Laake, L.W. Circadian rhythms in cardiovascular disease. Eur. Heart J. 2025, 46, 3532–3545. [CrossRef]
- Haspel, J.; Kim, M.; Zee, P.; Schwarzmeier, T.; Montagnese, S.; Panda, S.; Albani, A.; Merrow, M. A timely call to arms: COVID-19, the circadian clock, and critical care. J. Biol. Rhythms 2021, 36, 55–70. [CrossRef]
- Zaid, Y.; Puhm, F.; Allaeys, I.; Naya, A.; Oudghiri, M.; Khalki, L.; Limami, Y.; Zaid, N.; Sadki, K.; Ben El Haj, R.; et al. Platelets can associate with SARS-CoV-2 RNA and are hyperactivated in COVID-19. Circ. Res. 2020, 127, 1404–1418. [CrossRef]
- Zhao, J.; Xu, X.; Gao, Y.; Yu, Y.; Li, C. Crosstalk between platelets and SARS-CoV-2: Implications in thrombo-inflammatory complications in COVID-19. Int. J. Mol. Sci. 2023, 24, 14133. [CrossRef]
- Rommel, M.G.E.; Walz, L.; Fotopoulou, F.; Kohlscheen, S.; Schenk, F.; Miskey, C.; Botezatu, L.; Krebs, Y.; Voelker, I.M.; Wittwer, K.; et al. Influenza A virus infection instructs hematopoiesis to megakaryocyte-lineage output. Cell Rep. 2022, 41, 111447. [CrossRef]
- Gubin, D.; Boldyreva, J.; Stefani, O.; Kolomeichuk, S.; Danilova, L.; Markov, A.; et al. Light exposure predicts COVID-19 negative status in young adults. Biol. Rhythm Res. 2024, 55, 535–546. [CrossRef]
- Gubin, D.G.; Boldyreva, J.V.; Danilova, L.A.; Kolomeichuk, S.A.; Solovieva, S.; Alkhimova, L.E.; Kuznetsova, N.V.; Stefani, O.; Weinert, D.; Cornelissen, G. History of COVID-19 and circadian light hygiene in young adults. Russ. Open Med. J. 2025, 14, e0404. [CrossRef]
- Gubin, D.; Kolomeichuk, S.; Borisenkov, M.; Boldyreva, J.; Solovieva, S.; Danilova, L.; et al. COVID-19 status: Association with outdoor light exposure and meal timing, independent of chronotype. Biol. Rhythm Res. 2026, 57, 563–572. [CrossRef]
- Andraska, E.A.; Denorme, F.; Kaltenmeier, C.; Arivudainabi, A.; Mihalko, E.P.; Dyer, M.; Annarapu, G.K.; Zarisfi, M.; Loughran, P.; Ozel, M.; et al. Alterations in visible light exposure modulate platelet function and regulate thrombus formation. J. Thromb. Haemost. 2025, 23, 123–138. [CrossRef]
Figure 1.
Associations between main circadian predictors of mean platelet volume (MPV) in COVID+ and COVID– groups. a): BLE L5 Onset; b) Wake time; c) physical activity (PA) acrophase; d) NA BLE; e) relative non-parametric rest-activity amplitude (RA).
Figure 1.
Associations between main circadian predictors of mean platelet volume (MPV) in COVID+ and COVID– groups. a): BLE L5 Onset; b) Wake time; c) physical activity (PA) acrophase; d) NA BLE; e) relative non-parametric rest-activity amplitude (RA).
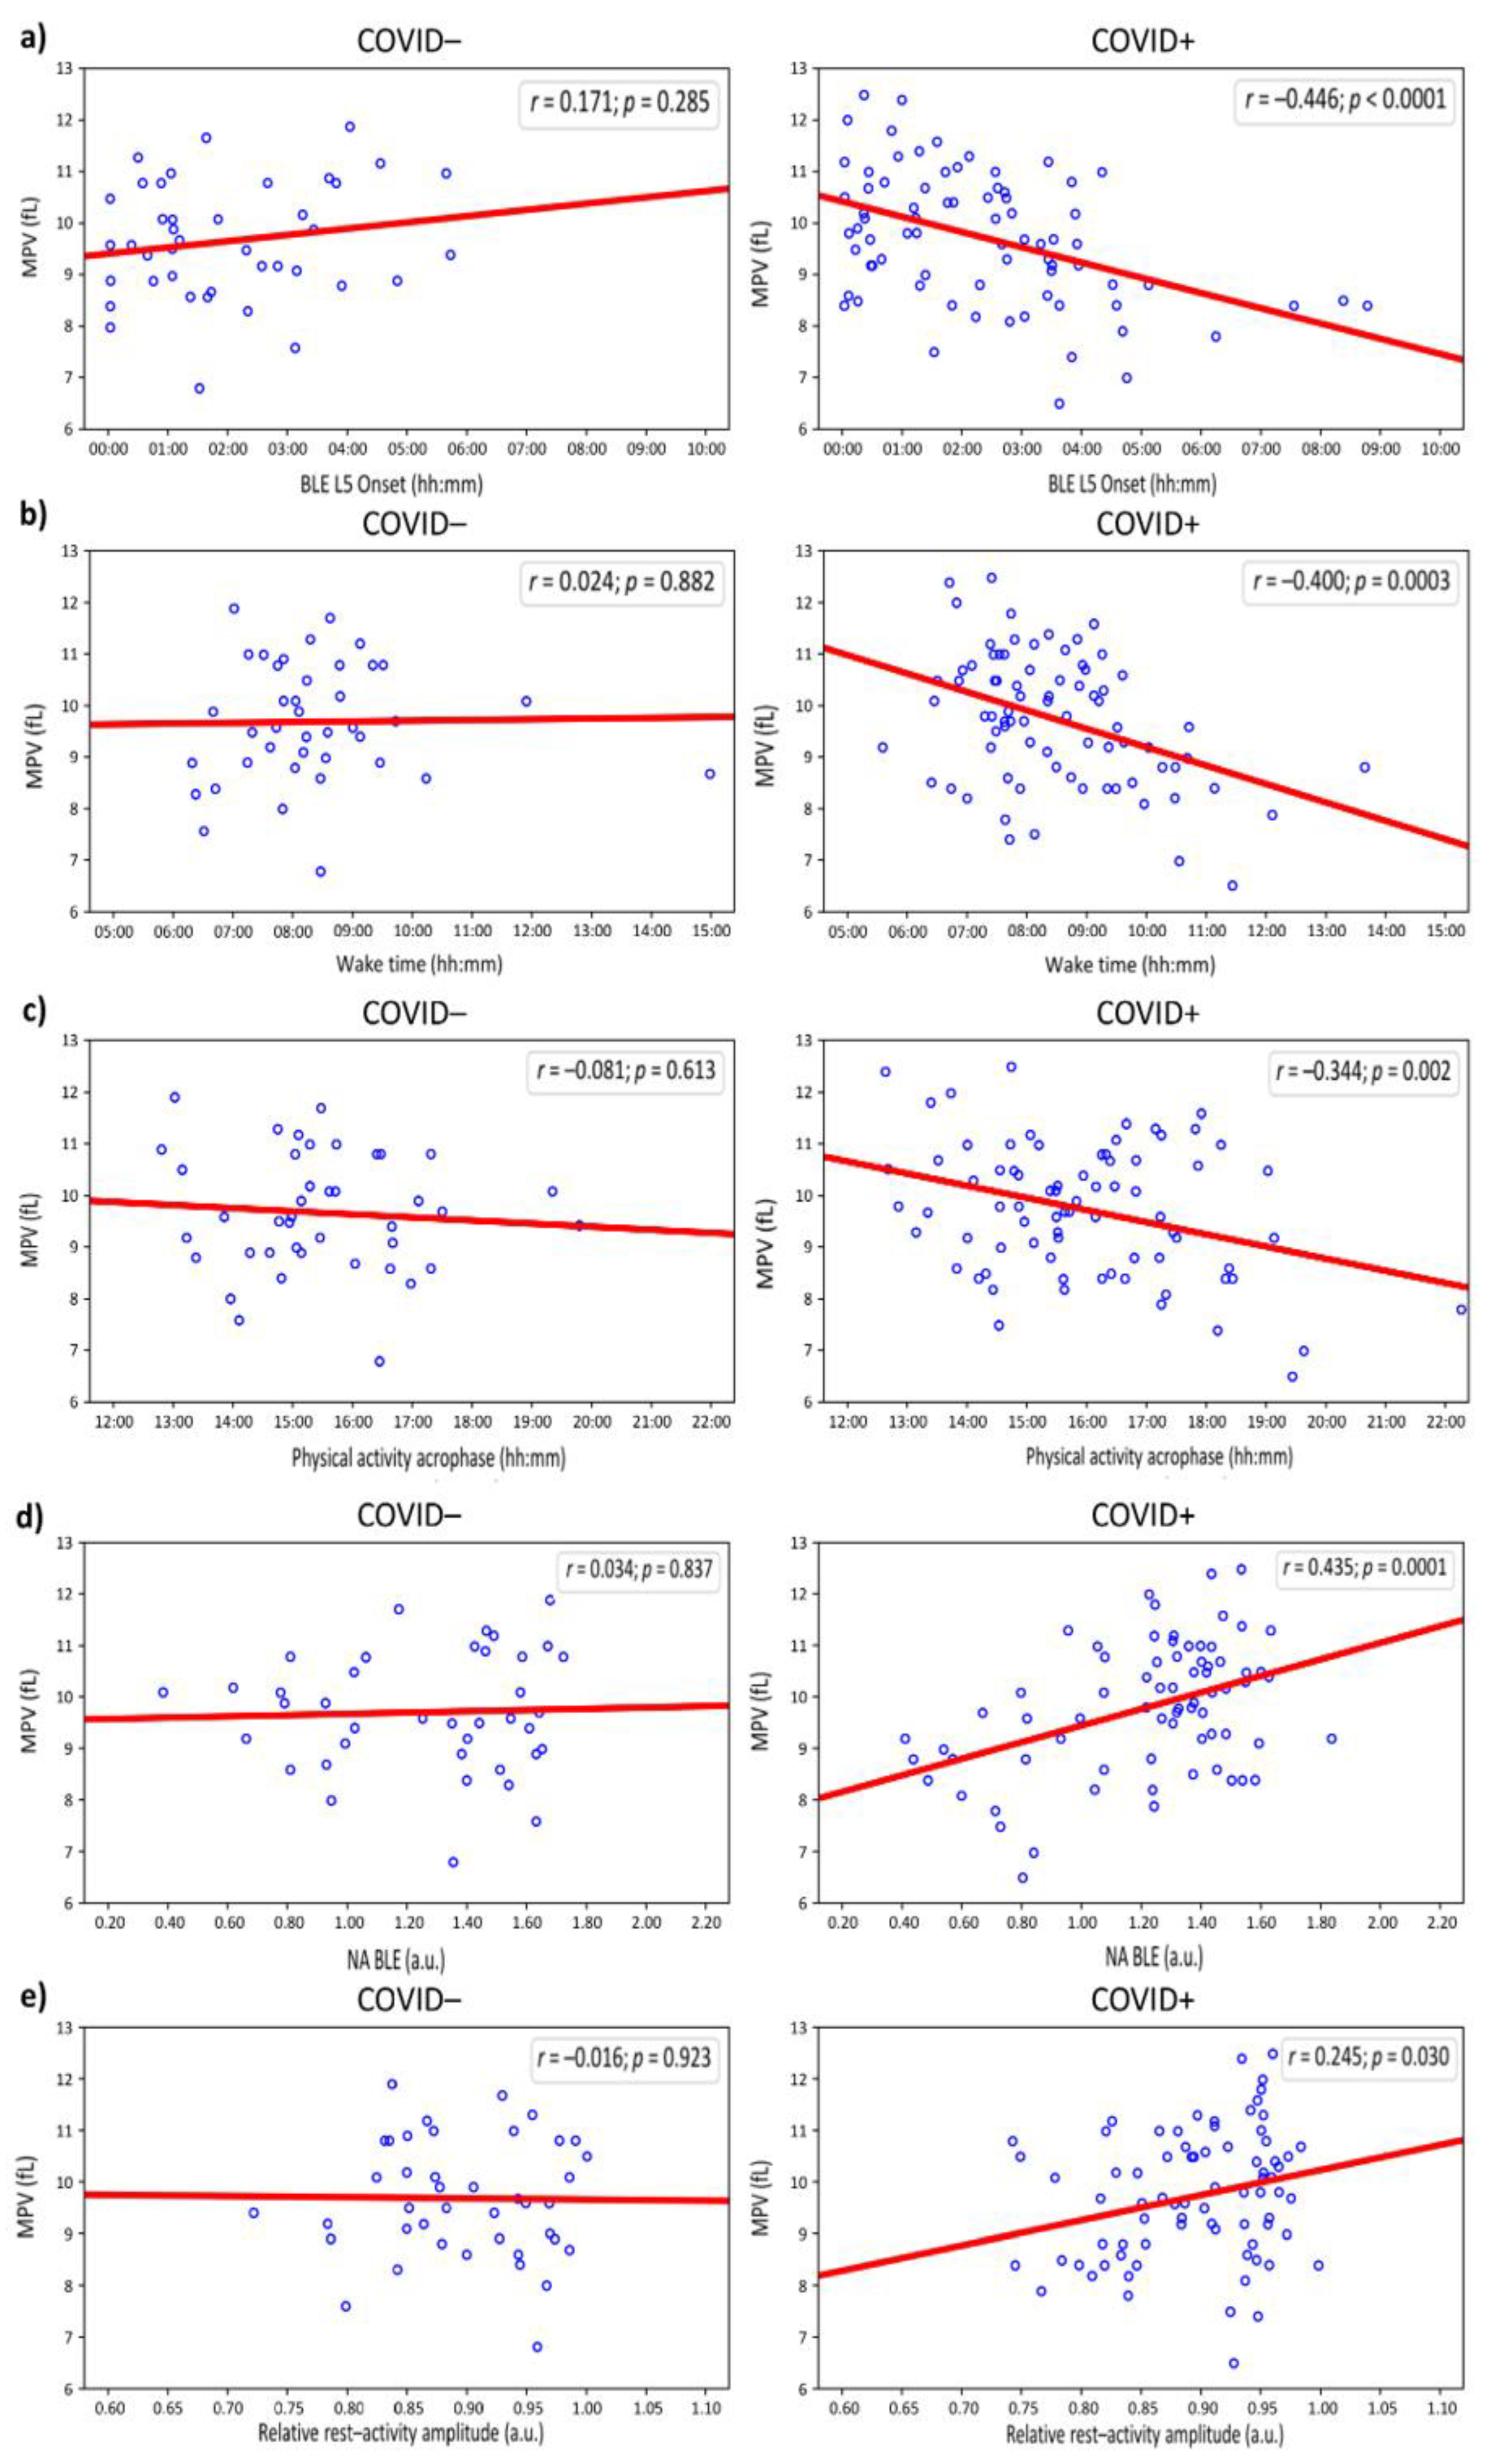
Figure 2.
Circadian Blue Light Exposure (BLE) Endpoints Associated with Differential Mean Platelet Volume (MPV) in Young Adults, with Heightened Effect in COVID-19 Positive Cohort. a): Higher MPV in young adults with onset of least illuminated 5 hours (BLE L5 Onset) occurring before vs. after 02:00 overall (p = 0.009) and in the COVID+ (p = 0.001), but not in the COVID– (p = 0.884) cohort. b): Higher MPV in young adults with fair circadian light hygiene (normalized amplitude of BLE, NA BLE > 1) compared to counterparts with poor light hygiene (NA BLE < 1) overall (p = 0.0002) and in the COVID+ (p = 0.00004), but not in the COVID– (p = 0.485) cohort.
Figure 2.
Circadian Blue Light Exposure (BLE) Endpoints Associated with Differential Mean Platelet Volume (MPV) in Young Adults, with Heightened Effect in COVID-19 Positive Cohort. a): Higher MPV in young adults with onset of least illuminated 5 hours (BLE L5 Onset) occurring before vs. after 02:00 overall (p = 0.009) and in the COVID+ (p = 0.001), but not in the COVID– (p = 0.884) cohort. b): Higher MPV in young adults with fair circadian light hygiene (normalized amplitude of BLE, NA BLE > 1) compared to counterparts with poor light hygiene (NA BLE < 1) overall (p = 0.0002) and in the COVID+ (p = 0.00004), but not in the COVID– (p = 0.485) cohort.
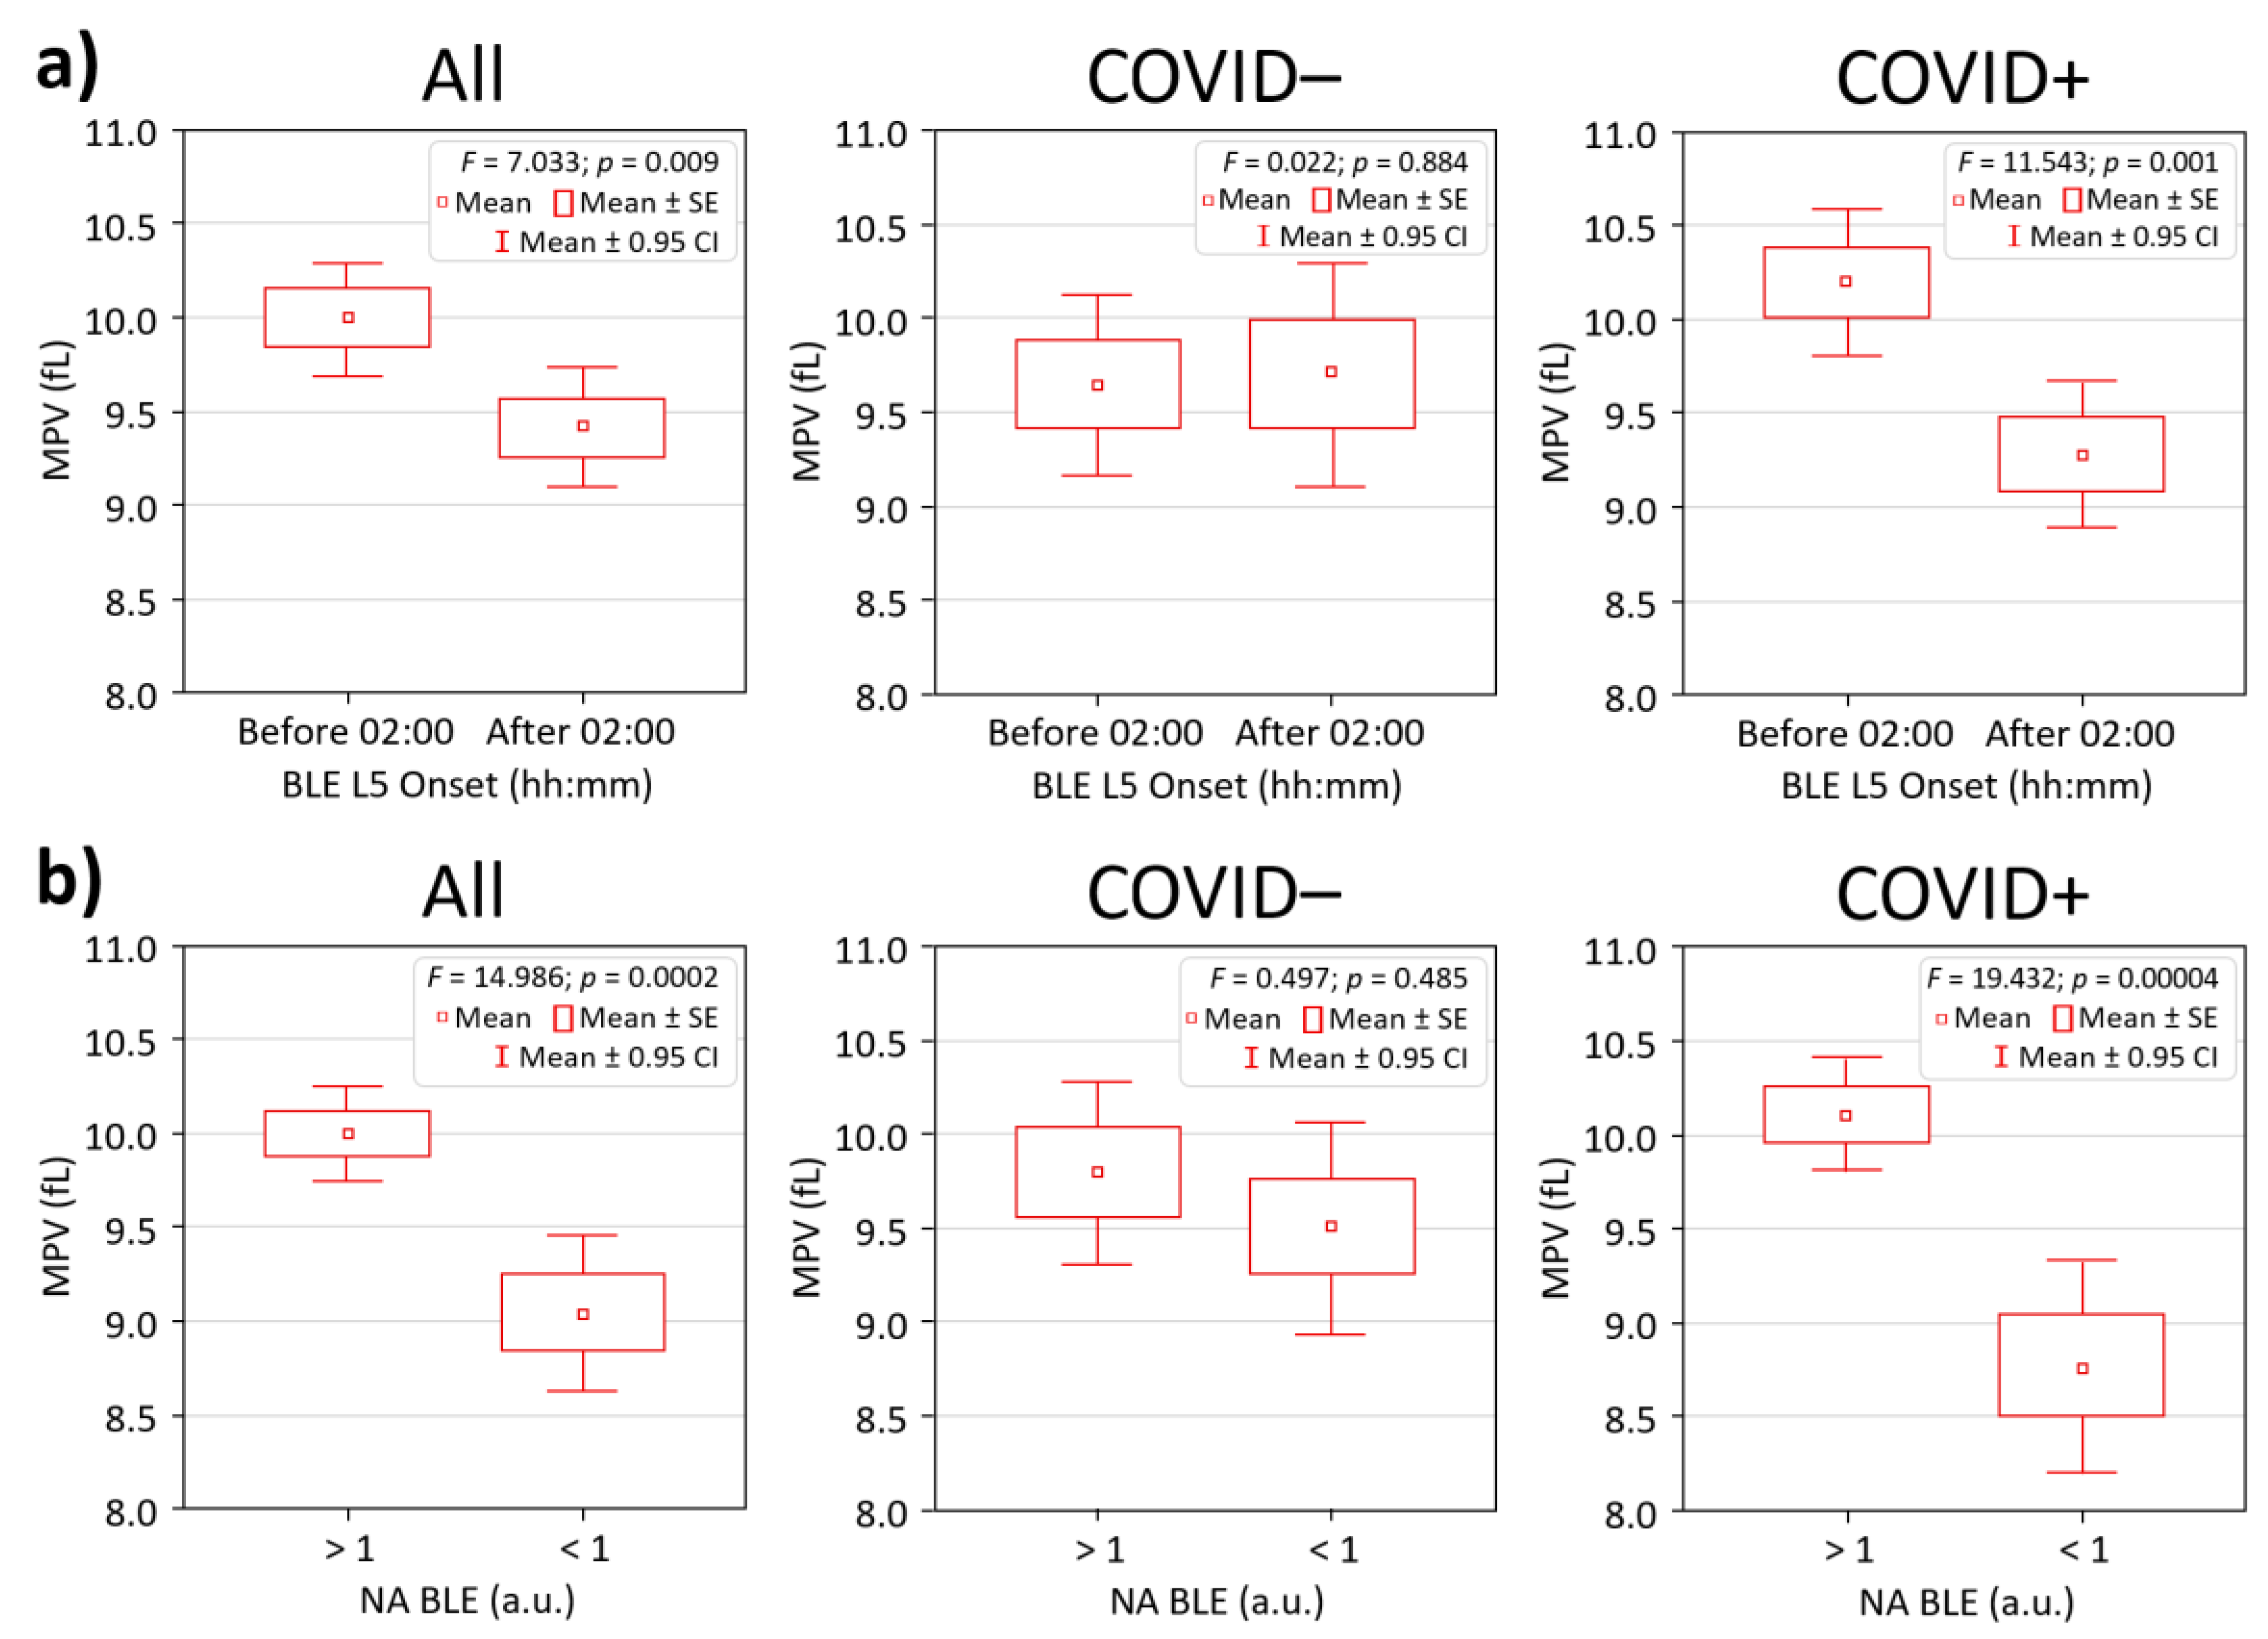

Table 1.
Correlations between demographic and circadian metrics of light exposure, physical activity, and sleep with mean platelet volume.
Table 1.
Correlations between demographic and circadian metrics of light exposure, physical activity, and sleep with mean platelet volume.
| Parameter | Linear regression r | P-value |
|---|---|---|
| Age | –0.131 | 0.154 |
| BMI | –0.049 | 0.601 |
| BLE MESOR | 0.017 | 0.859 |
| BLE Circadian Amplitude | 0.064 | 0.504 |
| BLE Circadian Acrophase | –0.168 | 0.076 |
| BLE M10 | 0.041 | 0.665 |
| BLE L5 | –0.097 | 0.307 |
| BLE M10 Onset | –0.114 | 0.231 |
| BLE L5 Onset | –0.223 | 0.015* |
| NA BLE | 0.298 | 0.001** |
| RA BLE | 0.152 | 0.109 |
| Wake time | –0.257 | 0.005** |
| Bed time | –0.110 | 0.231 |
| Total Sleep | –0.086 | 0.350 |
| Sleep Efficacy | 0.041 | 0.655 |
| PA MESOR | 0.061 | 0.513 |
| PA Circadian Amplitude | 0.155 | 0.093 |
| PA Circadian Acrophase | –0.266 | 0.004** |
| PA M10 | 0.091 | 0.323 |
| PA L5 | –0.139 | 0.131 |
| PA M10 Onset | –0.068 | 0.462 |
| PA L5 Onset | –0.196 | 0.033 |
| NA PA | 0.120 | 0.193 |
| RA PA | 0.159 | 0.084 |
Note. BLE – Blue Light Exposure; PA – Physical Activity. M10 is the mean value in the most active (PA) or most illuminated (BLE) ten consecutive hours, L5 is the mean value in the least active (PA) or less illuminated (BLE) five consecutive hours, relative amplitude (RA) is (M10 – L5)/(M10 + L5) and ranges from zero to one, M10 onset is the start time of the M10 window, L5 onset is the start time of the L5 window; NA – normalized amplitude, or circadian quotient (A/M). Statistically significant differences (p < 0.05) indicated in bold. Values marked with an asterisk * / ** were significant after Benjamini-Hochberg correction for multiple testing at FDR = 0.1 / 0.05, respectively.
Table 2.
Demographic, Platelet and Circadian Endpoints in individuals with COVID-free vs. COVID-positive young adults.
Table 2.
Demographic, Platelet and Circadian Endpoints in individuals with COVID-free vs. COVID-positive young adults.
| Variable | Total (n = 112) | COVID– (n = 38) | COVID+ (n = 74) | P-value |
|---|---|---|---|---|
| Sex (f/m) | 84/28 | 27/11 | 57/17 | 0.489 |
| Age | 24.27 (22.48 – 26.06) | 21.89 (19.27 – 24.52) | 25.49 (23.14 – 27.83) | 0.015 |
| BMI | 22.85 (22.01 – 23.70) | 22.88 (21.60 – 24.15) | 22.84 (21.72 – 23.96) | 0.304 |
| PLT | 270.29 (259.01 – 281.58) | 268.05 (253.60 – 282.50) | 271.45 (255.83 – 287.06) | 0.783 |
| MPV | 9.77 (9.54 – 9.99) | 9.74 (9.36 – 10.12) | 9.78 (9.49 – 10.07) | 0.852 |
| PDW | 14.49 (14.10 – 14.88) | 14.41 (13.73 – 15.09) | 14.53 (14.05 – 15.01) | 0.568 |
| PCT | 0.25 (0.24 – 0.27) | 0.24 (0.22 – 0.26) | 0.26 (0.24 – 0.28) | 0.245 |
| MPV/PLT ratio | 0.038 (0.036 – 0.040) | 0.037 (0.034 – 0.040) | 0.039 (0.036 – 0.042) | 0.474 |
| BLE Acrophase | 11:27 (10:07 – 12:47) | 11:04 (8:23 – 13:45) | 11:40 (10:10 – 13:10) | 0.794 |
| BLE M10 | 8.68 (7.45 – 9.90) | 10.78 (7.96 – 13.61) | 7.53 (6.44 – 8.63) | 0.076 |
| BLE L5 | 0.081 (0.051 – 0.110) | 0.088 (0.028 – 0.149) | 0.077 (0.044 – 0.110) | 0.564 |
| BLE M10 Onset | 8:37 (8:23 – 8:51) | 8:25 (7:56 – 8:53) | 8:44 (8:28 – 8:59) | 0.271 |
| BLE L5 Onset | 2:19 (1:58 – 2:41) | 2:02 (1:32 – 2:31) | 2:29 (2:00 – 2:58) | 0.330 |
| NA BLE | 1.22 (1.16 – 1.29) | 1.25 (1.13 – 1.37) | 1.21 (1.13 – 1.29) | 0.259 |
| Wake time | 8:25 (8:09 – 8:41) | 8:20 (7:51 – 8:49) | 8:28 (8:09 – 8:47) | 0.550 |
| Bedtime | 0:16 (23:56 – 0:37) | 23:51 (23:08 – 0:35) | 0:51 (0:09 – 0:51) | 0.169 |
| Total Sleep | 7:14 (6:54 – 7:33) | 7:22 (6:41 – 8:02) | 7:09 (6:49 – 7:29) | 0.945 |
| Sleep Efficacy | 89.79 (88.90 – 90.69) | 89.97 (88.42 – 91.52) | 89.70 (88.59 – 90.81) | 0.259 |
| PA Amplitude | 1516 (1424 – 1609) | 1584 (1420 – 1748) | 1480 (1367 – 1593) | 0.158 |
| PA Acrophase | 15:50 (15:31 – 16:09) | 15:28 (15:00 – 15:56) | 16:02 (15:36 – 16:27) | 0.142 |
| PA M10 | 3633 (3457 – 3808) | 3801 (3514 – 4087) | 3544 (3321 – 3768) | 0.124 |
| PA L5 | 219 (187 – 250) | 230 (169 – 290) | 213 (175 – 250) | 0.571 |
| PA M10 Onset | 9:12 (8:56 – 9:29) | 9:01 (8:29 – 9:34) | 9:18 (8:59 – 9:38) | 0.390 |
| PA L5 Onset | 3:00 (2:36 – 3:24) | 3:04 (2:15 – 3:52) | 2:58 (2:31 – 3:26) | 0.550 |
| RA PA | 0.896 (0.884 – 0.907) | 0.897 (0.876 – 0.919) | 0.895 (0.880 – 0.909) | 0.802 |
Notes: Sex – chi-squared (χ² = 0.479); Age: Chronological age in years (yr); BMI: Body Mass Index = weight (kg) / height² (m²) – unit: kg/m²; BLE phase – acrophase of BLE in hh:mm; M10 – blue light received during 10 hours of maximum exposure in μw/cm²; BLE L5 – blue light received during 5 hours of least exposure in μw/cm²; NA BLE: Normalized Circadian Amplitude of Blue Light Exposure – dimensionless index (0–1), where 1 = maximal circadian alignment with natural blue light patterns; PLT: Platelet Count – number of platelets per microliter (×10⁹/L); MPV: Mean Platelet Volume – average platelet size (fL); PDW: Platelet Distribution Width – coefficient of variation in platelet size (%); PCT: Plateletcrit –percentage volume of blood occupied by platelets (%). All means and 95% CI bounds rounded to two decimal places. 95% CIs are presented as lower – upper in a single column. Group labels: COVID– = COVID-19 negative, COVID+ = COVID-19 positive. NA BLE is a normalized circadian metric: values <1 suggest low day-night contrast in light exposure; values <1 suggest insufficient daytime exposure. Significant (p < 0.05) predictors are in bold. Borderline significant (p < 0.10) are in bold italic.
Table 3.
Circadian Predictors of Mean Platelet Volume (MPV) in Young Adults after in multi-variate model corrected for age and sex.
Table 3.
Circadian Predictors of Mean Platelet Volume (MPV) in Young Adults after in multi-variate model corrected for age and sex.
| Predictor | Group | β (95% CI) | p-value | Partial η² |
|---|---|---|---|---|
| BLE L5 Onset | Total (n = 112) | –0.286 (-0.463; –0.110) | 0.002 | 0.083 |
| COVID– (n = 38) | 0.202 (–0.112; 0.516) | 0.200 | 0.043 | |
| COVID+ (n = 74) | –0.479 (-0.686; –0.272) | <0.001 | 0.226 | |
| NA BLE | Total (n = 112) | 0.280 (0.094; 0.466) | 0.003 | 0.075 |
| COVID– (n = 38) | 0.052 (–0.291; 0.395) | 0.763 | 0.003 | |
| COVID+ (n = 74) | 0.415 (0.193; 0.637) | <0.001 | 0.166 | |
| Wake Time | Total (n = 112) | –0.278 (–0.455; –0.101) | 0.002 | 0.077 |
| COVID– (n = 38) | 0.007 (–0.314; 0.327) | 0.967 | 0.001 | |
| COVID+ (n = 74) | –0.426 (–0.638; –0.214) | <0.001 | 0.178 | |
| PA Acrophase | Total (n = 112) | –0.274 (–0.449; –0.098) | 0.003 | 0.076 |
| COVID– (n = 38) | –0.007 (–0.389; 0.253) | 0.672 | 0.005 | |
| COVID+ (n = 74) | –0.355 (–0.572; –0.137) | 0.002 | 0.125 | |
| PA L5 Onset | Total (n = 112) | –0.220 (-0.400; –0.040) | 0.017 | 0.049 |
| COVID– (n = 38) | 0.168 (–0.151; 0.487) | 0.293 | 0.030 | |
| COVID+ (n = 74) | –0.443 (-0.653; –0.232) | <0.001 | 0.191 | |
| PA RA | Total (n = 112) | 0.166 (–0.015; 0.346) | 0.072 | 0.028 |
| COVID– (n = 38) | –0.044 (–0.368; 0.279) | 0.783 | 0.002 | |
| COVID+ (n = 74) | 0.254 (0.028; 0.480) | 0.028 | 0.063 | |
| PA Amplitude | Total (n = 112) | 0.163 (-0.400; –0.040) | 0.078 | 0.027 |
| COVID– (n = 38) | –0.010 (–0.337; 0.317) | 0.945 | <0.001 | |
| COVID+ (n = 74) | 0.265 (0.042; 0.488) | 0.020 | 0.071 |
Notes: Mean Platelet Volume – average platelet size (fL). BLE L5 Onset – onset of 5 hours of least blue light exposure; NA BLE: Normalized Amplitude of Blue Light Exposure. PA – Physical Activity. PA L5 Onset – onset of 5 least active hours; RA – relative amplitude is (M10 – L5)/(M10 + L5). COVID–: Participants without a history of COVID-19 infection. COVID+: Participants with a history of COVID-19 infection. Beta coefficients represent the change in MCV for a one-unit increase in the predictor. Partial Eta Squared (η²) indicates the proportion of variance in MCV explained by the predictor within each group. Age and sex were not significant (p > 0.112) predictors in either model. Significant (p < 0.05) predictors are in bold. Borderline significant (p < 0.10) are in bold italic.
Disclaimer/Publisher’s Note: The statements, opinions and data contained in all publications are solely those of the individual author(s) and contributor(s) and not of MDPI and/or the editor(s). MDPI and/or the editor(s) disclaim responsibility for any injury to people or property resulting from any ideas, methods, instructions or products referred to in the content. |
© 2026 by the authors. Licensee MDPI, Basel, Switzerland. This article is an open access article distributed under the terms and conditions of the Creative Commons Attribution (CC BY) license.
Copyright: This open access article is published under a Creative Commons CC BY 4.0 license, which permit the free download, distribution, and reuse, provided that the author and preprint are cited in any reuse.