
Submitted:
25 October 2026
Posted:
27 October 2026
You are already at the latest version
Abstract
Photovoltaic (PV) deployment in China has accumulated silver in long-lived crystalline-silicon modules, yet the timing and scale of its end-of-life (EOL) release remain uncertain. This study develops a cohort-based dynamic material flow analysis (MFA) for PV modules installed in China during 2000–2025 and projects silver flows to 2060. Technology-specific pure-silver intensities are reconstructed from cell dimensions and efficiency, paste consumption, metallization composition, and technology shares. Weibull lifetime distributions are used to compare four module-lifetime scenarios, while four recovery-rate pathways assess the effect of recovery-capacity timing. Parameter uncertainty is examined using Latin-hypercube Monte Carlo simulation. From 2018 to 2025, technology-weighted pure-silver intensity fell by 62.0% (from 23.33 to 8.86 mg/W), whereas annual installation silver inflow rose by 170.4% (from 1,149.66 to 3,108.88 t). Under the baseline lifetime scenario, EOL silver flow peaks at 739.34 t/yr in 2044, nine years before retired capacity peaks in 2053. At the end of 2025, the in-use stock reached 17,784.12 t, equivalent to 99.5% of cumulative installation inflow. Cumulative potentially recoverable silver during 2025–2060 ranges from 3,606.94 to 15,335.65 t across the specified recovery scenarios. Module lifetime primarily determines release timing, whereas silver intensity affects the magnitude of release. Recovery estimates are scenario-based and do not represent actual secondary-silver production.
Keywords:
photovoltaic modules
; silver flows
; in-use silver stocks
; dynamic material flow analysis
; end-of-life recovery
; uncertainty analysis
1. Introduction
China's photovoltaic capacity has expanded rapidly under its carbon-peaking and carbon-neutrality goals, making PV generation an important component of the low-carbon transition of the power system [1,2,3,4]. This expansion reduces operational carbon emissions but also increases demand for glass, aluminum, silicon, copper, silver, and other materials. Because PV modules typically remain in service for several decades, these materials accumulate in long-lived in-use stocks and will gradually enter a rapidly growing end-of-life stream as early-generation modules are retired. If recycling infrastructure does not develop in parallel, end-of-life modules may increase solid-waste management pressure and cause the loss of high-value materials [5,6,7,8,9,10,11,12].
Silver is a key raw material for the metallization electrodes of crystalline-silicon cells because it combines low mass requirements with high value and supply constraints [5,9,11,13,14]. Fine-line printing, silver thrifting, and copper substitution have reduced silver intensity per unit of power, but the transition from PERC to TOPCon, HJT, and XBC technologies, together with continued capacity expansion, may offset part of the demand reduction attributable to silver thrifting [15,16,17]. Silver-resource management in PV therefore needs to address two linked questions: how much in-use silver stock is created by primary inputs, and when and in what quantity will modules from different installation years and technology generations release end-of-life silver?
Previous studies have followed two main analytical pathways. One group has used fixed lifetimes, Weibull lifetime distributions, or dynamic material flow analysis to estimate retired PV capacity, module mass, and associated material flows at national or regional scales [5,6,7,8,9,10,18,19]. Another group has combined deployment growth, technology shares, material intensities, and substitution pathways to assess PV silver demand, metal constraints, and life-cycle silver flows and stocks [15,16,17,20,21]. These studies provide a basis for assessing PV waste and silver-resource pressure, but the connection between the end-of-life stream and the silver content of retired modules remains insufficiently resolved.
Three gaps remain. First, end-of-life projections often use installed capacity or module mass as the main indicator and apply a fixed bill of materials or a single average silver intensity, which cannot represent differences in silver content among Al-BSF, PERC, TOPCon, HJT, and XBC technologies. Second, silver-demand studies focus mainly on future manufacturing inputs and pay less attention to the in-use accumulation, retirement timing, and technology sources of silver in China's installed PV module cohorts. Third, some studies provide recycling scenarios without clearly separating the effect of the end-of-life silver flow from the effect of the assumed recovery rate. This study therefore asks when end-of-life silver flows will increase and peak, how their technology sources will change, and how the timing of recovery-capacity formation will affect potential recovery.
We analyze module cohorts installed in China from 2000 to 2025 and trace silver from installation inflows through in-use accumulation to end-of-life release. First, we reconstruct annual technology-specific pure-silver intensities from technology shares, cell parameters, paste consumption, and metallization composition. Second, we use Weibull lifetime distributions to estimate installation silver inflows, in-use silver stocks, and end-of-life silver flows under four lifetime scenarios: baseline lifetime, early retirement, active replacement, and extended operation. Third, we compare four recovery-rate scenarios to examine how the timing of recovery-capacity formation affects cumulative potentially recoverable silver. Finally, Latin-hypercube sampling and Monte Carlo simulation are used to test the robustness of peak-year and cumulative-flow estimates to parameter uncertainty. The results identify the release window and changing feedstock composition of silver in China's installed PV module cohorts; the recovery estimates are scenario results rather than actual secondary-silver production.
2. Materials and Methods
2.1. Study Framework and System Boundary
The analysis follows the sequence of installation silver inflow, in-use accumulation, and end-of-life release, with recovery-rate scenarios added after the end-of-life silver flow. Global PV silver demand and module production are used to calibrate historical pure-silver intensity. The theoretical silver demand of China's PV manufacturing sector represents silver input associated with cell production. The domestic installation MFA uses annual newly installed capacity as the inflow and tracks silver entering in-use modules and leaving the in-use stock when modules are retired.
The dynamic MFA covers module cohorts installed in China from 2000 to 2025 and projects their evolution to 2060. Core outputs include installation silver inflow, in-use silver stock, retired capacity, and end-of-life silver flow. Potentially recoverable silver is used only to compare recovery-rate scenarios and does not represent actual recovered output, refined silver production, or economically recoverable reserves. Reported Chinese installation additions retain their official GWac source basis, but the cohort MFA converts the full 2000–2025 queue to a central module-rated GWdc-equivalent using 1.11323 (=309/277.57), calibrated to IEA PVPS 2024 (277.57 GWac ≈309 GWdc). The same factor is applied across the full queue; the IEA PVPS 2024 range of 309–357 GWdc and the independent IEA PVPS Trends 2026 estimate of 415 GW for 2025 are retained as external checks. Pure-silver intensity is reported per watt of module-rated power, and 1 GWdc × 1 mg W−1 equals 1 t of silver.
The theoretical manufacturing demand and domestic installation silver inflow refer to different system stages. Cells manufactured in China supply both domestic and export markets, while domestic installations may use modules from different sources. Because module imports and exports and annual inventory changes are not explicitly modeled, the two quantities do not form a closed mass balance and are therefore calculated and interpreted separately.
2.2. Data Sources and Parameterization
Global PV silver demand was obtained from the World Silver Survey series [14], and global PV module production was obtained from annual IEA PVPS reports [3]. China's annual newly installed PV capacity, cell production, PV cell technology shares, cell dimensions, conversion efficiencies, and paste consumption were compiled mainly from the China Photovoltaic Industry Development Report, the annual China Photovoltaic Industry Development Roadmap, and industry statistics [22,23,24,25,26,27,28,29,35,36,37]. Module lifetime parameters and silver recovery rates were specified using studies of PV-module reliability, end-of-life volumes, and resource recovery [6,7,8,30,31,32]. The data sources are summarized in Table 1; complete annual sequences and conversion rules are provided in the Supplementary Materials. For the cohort MFA, reported annual additions are converted to the central GWdc-equivalent series described above before silver inflow and stock calculations.
The annual newly installed PV-capacity series for China covers 2000–2025 and was compiled from the China Photovoltaic Industry Development Report, annual China Photovoltaic Industry Development Roadmaps, and industry statistics. All capacity data were converted to GW and organized into installation-year cohorts. The annual additions and cumulative capacity series were harmonized to consistent statistical boundaries to avoid duplication or omission caused by differences between AC and DC capacity and between grid connection and commissioning.
The Chinese cell-production series covers 2010–2024. The 2010–2018 historical series was taken from industry roadmaps; the 2019 value of 108.6 GW was taken directly from the 2019 China Photovoltaic Industry Development Roadmap; and values for 2020–2024 were taken from the corresponding annual roadmaps or technology-development reports. This series is used only to estimate theoretical manufacturing silver demand. Years reported only as ranges or lower bounds without an exact value under a consistent statistical definition were excluded from the manufacturing-demand comparison.
PV cell technologies were classified as aluminum back-surface-field (Al-BSF), passivated emitter and rear cell (PERC), tunnel-oxide passivated contact (TOPCon), heterojunction (HJT), and interdigitated back-contact (XBC) cells. Annual technology shares were compiled from China Photovoltaic Industry Association roadmaps [22,23,24,25,26,27,28,29]. Table 2 reports the market shares of the four major technology routes from 2021 to 2025. In 2021, the PERC share was taken directly from the roadmap, whereas TOPCon, HJT, and XBC shares were approximated by allocating the annual n-type share using adjacent-year technology composition. Directly reported values were used for 2022–2025. End-of-life source composition was aggregated into four groups: early-generation crystalline-silicon modules, PERC, TOPCon, and HJT/XBC.
Note: * denotes an estimated value. The table lists four major technology routes only; the full annual technology mix used in the calculations, including any residual legacy-technology share, must be documented in Supplementary Table S2.
2.3. Technology-Specific Pure-Silver Intensity
Silver input to PV cells is determined jointly by cell power, paste consumption, and the metallization system. To obtain a pure-silver intensity suitable for the dynamic MFA, paste data reported under different units and definitions were converted into silver mass per unit of rated power through the following chain: single-cell power conversion, wet-paste-mass conversion, metallization-composition correction, technology-share weighting, and statistical-boundary harmonization.
For paste consumption reported in mg cell−1, representative cell power was first calculated from cell area and conversion efficiency:
where denotes the representative power of a cell using technology in year (W cell−1), denotes cell area (m² cell−1), is the irradiance under standard test conditions (1000 W m−2), and is cell conversion efficiency. After front- and rear-side paste consumption was combined, wet paste mass per unit of power was calculated as:
where is the combined front- and rear-side or bifacial wet paste mass (mg cell−1), and is wet paste intensity (mg W−1).
Let denote the silver-equivalent composition coefficient of the paste or electrode system for technology in year . The initial pure-silver intensity was calculated as:
For HJT, silver intensity was further resolved by considering the application shares of pure-silver and silver-coated-copper electrodes and the silver fraction of the silver-coated-copper material:
Here, the first two terms represent the application shares of pure-silver and silver-coated-copper electrodes, respectively, and the last term represents the silver mass fraction of the silver-coated-copper material. This treatment captures the material heterogeneity and silver-intensity changes associated with copper substitution; annual parameters were taken from data on electrode structures.
To harmonize the calculation with global statistics, annual average pure-silver intensity was calculated from global PV silver demand and global module production:
The numerator is global PV silver demand in tonnes and the denominator is global PV module production in GW. Their ratio directly represents pure-silver intensity per unit of rated power and provides a historical total-volume constraint.
Because China's cell production represents a substantial share of global production, technology shares in China were used to weight the initial technology-specific pure-silver intensities and obtain the annual initial weighted-average intensity:
The annual statistical-boundary coordination coefficient was calculated as the ratio of the annual global average pure-silver intensity to the initial weighted-average intensity:
The coordinated technology-specific pure-silver intensity was then calculated as:
The coordination coefficient absorbs systematic deviations associated with differences in paste-solids content, single-cell power conversion, and statistical boundaries between global PV silver demand and module production; it does not represent the physical silver content of the paste. For years with continuous global statistics, the coefficient was derived from global PV silver demand and module production. For early years without comparable continuous data, representative intensities from adjacent technology stages were used. For the latest year, when consistent global statistics were unavailable, the technology-specific calculation was used directly. The resulting annual technology-specific pure-silver intensities were used for both theoretical manufacturing-demand estimates and the domestic installation MFA.
2.4. Dynamic Material Flow Model
The theoretical silver demand of China's PV manufacturing sector during 2010–2024 was calculated from cell production, the technology structure, and technology-specific pure-silver intensity:
In Equation (9), D denotes theoretical silver demand in China’s PV manufacturing sector in year t (t), P denotes Chinese cell production (GW), and m denotes the share of technology k in annual cell production. Because continuous technology-specific production data are unavailable, technology shares reported in industry roadmaps are used as a proxy. Manufacturing demand is calculated separately and is not treated as inflow to the domestic in-use module stock.
Domestic installation MFA was conducted using annual installation cohorts as the basic computational unit. The silver inflow into China's in-use PV systems from technology in year was calculated as:
where is the installation silver inflow from technology in year (t), is China's newly installed PV capacity in year (GW), and and are the corresponding technology share and pure-silver intensity, respectively.
Module service life was described using a Weibull distribution. Under lifetime scenario , the cumulative probability that a module of age has exited the in-use system is:
where and are the scale and shape parameters of lifetime scenario , respectively. For annual discrete calculations, the probability that a module exits the in-use system in the year corresponding to age is:
When , was used. This discrete formulation distributes each installation cohort across multiple retirement years and avoids concentrating all modules at a single retirement year, as occurs under a fixed-lifetime method.
The retired capacity of technology in year under lifetime scenario was calculated as:
The corresponding end-of-life silver flow and in-use silver stock were calculated as follows:
Here, , , and denote retired capacity, end-of-life silver flow, and in-use silver stock, respectively, for technology in year . Annual totals were obtained by summing across technology routes. In every year, cumulative installation silver inflow, cumulative end-of-life silver flow, and in-use silver stock satisfy the following mass-balance relationship:
2.5. Module Lifetime and Silver-Recovery Scenarios
Four lifetime scenarios were specified: baseline lifetime, early retirement, active replacement, and extended operation. Parameters were selected from studies of PV-module reliability, lifetime distributions, and end-of-life projections [6,30,31,32]. The baseline scenario represents the central retirement pathway for existing cohorts under normal operation and uses separate parameters for modules installed in 2000–2013, 2014–2020, and 2021–2025. Early retirement uses lower Weibull shape parameters to represent a higher probability of early failure and a more dispersed retirement pattern. Active replacement tests the processing pressure caused by concentrated retirement following large-scale retrofits. Extended operation identifies the boundary case in which longer service life shifts the retirement peak to later years. Scenario parameters are listed in Table 3.
Potentially recoverable silver was calculated using an overall recovery rate. Based on previous studies, one low-recovery scenario and three recovery-capacity improvement scenarios were specified. In the low-recovery scenario, the recovery rate remains at 21%. In the improvement scenarios, the recovery rate increases linearly from 2025 and reaches 90% in 2030, 2045, or 2060. These settings are scenario parameters used to compare the timing of recovery-capacity formation and do not represent observed recovery rates or confirmed policy schedules. For a target year, the recovery rate in each year was calculated as:
Under the baseline lifetime scenario, potentially recoverable silver in year was calculated as:
Here, denotes potentially recoverable silver under the recovery-rate scenario corresponding to target year , and is the sum of annual end-of-life silver flows across technology routes under the baseline lifetime scenario. Recovery-rate scenarios are used only to compare the effect of recovery-capacity formation timing and do not represent future actual recovery rates or secondary-silver production.
2.6. Uncertainty Analysis
Module lifetime, technology-specific pure-silver intensity, and historical technology shares are all uncertain. To evaluate their effects on predicted end-of-life silver flows, Latin-hypercube sampling and Monte Carlo simulation were used [33,34]. Module-lifetime scale parameters, technology-specific pure-silver intensities, and historical technology shares were jointly perturbed. Each lifetime scenario was simulated 10,000 times, while annual capacity additions were held at their historical observations. P50 was used as the median estimate, P10–P90 described the range generated by the specified parameter bounds, and Spearman rank correlations were used to identify the main drivers of the peak year, peak silver flow, and cumulative end-of-life silver flow.
3. Results
3.1. Formation of Installation Silver Inflows and In-Use Stocks
Figure 1 shows the change in technology-weighted average pure-silver intensity and annual silver inflow associated with new PV installations. From 2018 to 2025, China's technology-weighted average pure-silver intensity declined from 23.33 to 8.86 mg W−1, a reduction of 62.0%, whereas annual installation silver inflow increased from 1,149.66 to 3,108.88 t, an increase of 170.4%. The decline in silver intensity per unit of power did not translate into a simultaneous decline in primary silver input, indicating that deployment growth outweighed silver thrifting during the study period.
The installation cohorts formed during 2000–2025 carried a cumulative 17,880.61 t of silver. At the end of 2025, 17,784.12 t remained in in-use modules, equivalent to 99.5% of cumulative installation silver inflow. Silver does not leave the system immediately after installation; it enters a long-lived in-use stock, and subsequent release depends on the lifetime distribution and technology composition of the installation cohorts.
Annual installation silver inflow therefore characterizes the scale of primary silver entering the PV system, whereas in-use silver stock represents the future basis for secondary-resource release. Together, they provide the starting point for predicting end-of-life silver flows.
3.2. Lifetime-Driven End-of-Life Silver Flows and Peak-Year Mismatch
Figure 2 compares annual retired capacity and end-of-life silver flows under four lifetime scenarios. Under the baseline lifetime scenario, end-of-life silver flow increased from 34.64 t yr−1 in 2025 to a peak of 739.34 t yr−1 in 2044, before declining to 287.18 t yr−1 in 2060; cumulative retired silver during 2025–2060 was 17,175.88 t. Retired capacity peaked at 70.77 GWdc yr−1 in 2053, nine years after the silver-flow peak. This mismatch indicates that retired capacity does not directly represent silver-resource release intensity: early installation cohorts were smaller but had higher silver intensity, whereas later cohorts were larger but had lower silver intensity.
Lifetime assumptions mainly shift the timing and concentration of end-of-life silver flow. The early-retirement and active-replacement scenarios both peaked in 2042, with peak flows of 565.54 and 1,424.71 t yr−1, respectively; the extended-operation scenario peaked later, in 2052, at 878.64 t yr−1. Early retirement advances and spreads module exit, active replacement compresses cohort migration into a narrower window, and extended operation delays resource release. Module lifetime therefore mainly determines when silver is released, whereas technology-specific pure-silver intensity determines how much is released.

Table 4.
Key indicators of retired PV capacity and silver flows under different lifetime scenarios.
| Lifetime scenario | Capacity peak year | Peak retired capacity (GWdc/yr) | Silver peak year | Peak silver flow (t/yr) | Cumulative EOL silver, 2025–2060 (t) | In-use silver stock in 2060 (t) |
|---|---|---|---|---|---|---|
| Baseline lifetime | 2053 | 70.77 | 2044 | 739.34 | 17,175.88 | 642.88 |
| Early retirement | 2046 | 43.06 | 2042 | 565.54 | 15,267.91 | 2,111.08 |
| Active replacement | 2042 | 155.65 | 2042 | 1,424.71 | 17,828.68 | <0.01 |
| Extended operation | 2054 | 70.79 | 2052 | 878.64 | 15,880.72 | 1,988.17 |
Note: <0.01 indicates that in-use silver stock in the modeled cohort is below 0.01 t.
Across 2025–2060, retired silver totaled 17,175.88, 15,267.91, 17,828.68, and 15,880.72 t under the baseline lifetime, early-retirement, active-replacement, and extended-operation scenarios, respectively. In-use silver stocks in 2060 were 642.88, 2,111.08, <0.01, and 1,988.17 t, respectively. Retired capacity is useful for estimating module-processing scale, whereas end-of-life silver flow is more informative for identifying the release window of high-value resources.
3.3. Technology-Generation Shifts in End-of-Life Silver Sources
Under the baseline lifetime scenario, end-of-life silver sources gradually shift from early-generation crystalline-silicon modules to PERC and TOPCon modules. Early-generation crystalline-silicon modules contributed 88.4% of retired silver in 2025. At the 2044 silver-flow peak, early-generation crystalline-silicon, PERC, and TOPCon modules accounted for 48.6%, 31.1%, and 16.6%, respectively; by 2060, PERC and TOPCon together accounted for 91.0%. This technology-generation shift means that recycling facilities must be designed according to both retired capacity and the technology composition and silver intensity of the retirement cohorts.
Lifetime scenarios further alter peak-period feedstock composition. Under early retirement, the TOPCon share increases from 16.6% in the baseline scenario to 26.1%. Under active replacement, PERC and TOPCon together account for 91.2% of the 2042 peak. Under extended operation, PERC and TOPCon account for 31.7% and 29.2%, respectively, of the 2052 peak. Recycling networks and silver-extraction processes therefore require technology-aware sorting, pretreatment, and capacity allocation.
Table 5.
Peak end-of-life silver flows and their source composition under different lifetime scenarios.
Table 5.
Peak end-of-life silver flows and their source composition under different lifetime scenarios.
| Lifetime scenario | Peak year | Peak silver flow (t/yr) | Early-generation c-Si (%) | PERC (%) | TOPCon (%) | HJT/XBC (%) |
|---|---|---|---|---|---|---|
| Baseline lifetime | 2044 | 739.3 | 48.6 | 31.1 | 16.6 | 3.6 |
| Early retirement | 2042 | 565.5 | 39.8 | 29.6 | 26.1 | 4.5 |
| Active replacement | 2042 | 1,424.7 | 0.8 | 35.8 | 55.4 | 8.0 |
| Extended operation | 2052 | 878.6 | 34.2 | 31.7 | 29.2 | 4.9 |
3.4. Effects of Recovery-Capacity Formation Timing on Potentially Recoverable Silver
Table 6 and Figure 3 compare four recovery-rate scenarios. In the low-recovery scenario, the overall recovery rate remains at 21%, yielding 3,606.94 t of potentially recoverable silver during 2025–2060. If the recovery rate increases linearly from 2025 and reaches 90% in 2030, 2045, or 2060, cumulative potentially recoverable silver reaches 15,335.65, 13,682.07, and 10,611.51 t, respectively. These results compare the timing of recovery-capacity formation and do not represent actual recovery rates or secondary-silver production.
Compared with the scenario reaching 90% recovery in 2030, reaching the same target in 2045 or 2060 reduces cumulative potentially recoverable silver by 1,653.57 or 4,724.14 t, corresponding to decreases of 10.8% and 30.8%, respectively. End-of-life silver flow exceeds 500 t yr−1 from 2039 and remains high around 2040; therefore, later recovery-capacity formation leaves more retired modules outside high-recovery processing. Recovery-system development should be synchronized with the resource-release window, while actual silver output will also depend on collection rates, processing costs, silver prices, process efficiency, and the quality of recycled products.
3.5. Uncertainty Analysis and Main Drivers
To evaluate the effect of parameter uncertainty on predicted end-of-life silver flow, module-lifetime scale parameters, technology-specific pure-silver intensities, and historical technology shares were jointly perturbed using Latin-hypercube sampling and Monte Carlo simulation. Each lifetime scenario was simulated 10,000 times. P50 represents the median result, P10–P90 represents the range generated by parameter variation, and Spearman rank correlations were used to identify the drivers of end-of-life silver-flow variation.
The simulations changed the exact peak year and magnitude but did not alter the overall trajectory. Under the baseline lifetime scenario, the median peak year was 2044, with 80% of simulations falling between 2039 and 2048. The median peak silver flow was 752.28 t yr−1, with a P10–P90 range of 679.15–839.58 t yr−1. Within the specified parameter bounds, silver in the installed PV-module stock is therefore expected to be released most intensively around 2040.
The module-lifetime scale parameter was strongly positively correlated with peak year (ρ = 0.881) and negatively correlated with peak silver flow and cumulative retired silver (ρ = −0.805 and −0.750, respectively). Technology-specific pure-silver intensity was positively correlated with peak silver flow and cumulative retired silver (ρ = 0.389 and 0.398, respectively). Historical technology-share perturbations had a smaller effect. Module lifetime primarily determines the timing window of silver release, technology-specific pure-silver intensity controls the magnitude of end-of-life silver flow, and technology composition determines the source structure of retired silver.
4. Discussion
4.1. Interpreting Silver Thrifting alongside Deployment Growth
The decline in silver intensity does not necessarily imply a decline in total installation-related silver inflow. Intensity measures silver input per unit of rated power, whereas aggregate inflow also depends on the amount of new capacity installed and the technology composition of that capacity. In the period examined here, deployment growth outweighed the reduction in silver use per watt. This distinction means that evaluating progress in silver thrifting requires both intensity indicators and absolute material-flow estimates; intensity improvements alone cannot establish that total resource demand is falling. This interpretation is consistent with PV silver-demand studies that examine both material intensity and deployment trajectories [15,16,17,20,21].
4.2. Retired Capacity Is Not a Direct Proxy for Silver Availability
The difference between the peak in retired capacity and the peak in EOL silver flow reflects the variation in silver intensity among installation cohorts. Earlier cohorts were generally smaller but more silver-intensive per watt, while later cohorts combine larger installed capacity with lower average intensity and different metallization systems. Consequently, a year with less retired capacity can release more silver than a later year with a larger capacity outflow. Forecasts based only on capacity or module mass may therefore misrepresent the timing of high-value secondary-resource availability. The result should be interpreted as a cohort-model estimate, however, because the timing and composition of actual retirements will also depend on field conditions, replacement decisions, and future technology shares. Earlier PV-waste assessments have similarly emphasized cohort lifetime and retirement timing, while the present analysis translates these dynamics into technology-specific silver mass [5,6,7,8,9,10,18,19].
4.3. Recovery Timing, Uncertainty, and Model Limitations
The recovery scenarios isolate the effect of the assumed recovery-rate pathway after EOL silver flows have been estimated. Their differences arise from the interaction between the timing of EOL silver release and the assumed ramp-up of recovery rates, rather than from changes in the underlying retirement flow. The estimates are conditional on the baseline lifetime scenario and the specified linear recovery-rate pathways. They do not explicitly account for collection losses, facility utilization, process-specific silver yields, costs, silver-market conditions, or the economic feasibility of recovering silver from particular feedstocks; they should therefore be interpreted as potentially recoverable quantities rather than forecasts of actual secondary-silver output. This distinction is important when comparing resource-recovery scenarios with techno-economic estimates of closed-loop recycling [7,8,13].
The uncertainty analysis indicates that, within the parameter ranges tested, the principal release window remains concentrated around the 2040s. The lifetime scale parameter is most strongly associated with the timing of the peak, whereas technology-specific silver intensity is associated with peak and cumulative flow magnitude. These findings support the qualitative distinction between release timing and release quantity, but they do not eliminate structural uncertainty arising from incomplete historical technology shares, the calibration of global silver intensity to domestic installations, or the simplified representation of module trade and inventory changes. Further validation would benefit from transparent annual retirement data, technology-resolved module composition, measured recycling yields, and publication of the input series and simulation outputs.
5. Conclusions and Policy Implications
5.1. Main Conclusions
This study analyzed cohorts of PV modules installed in China from 2000 to 2025 by integrating annual installation, technology-specific pure-silver intensity, and module lifetime distributions into a dynamic MFA. Following the sequence of silver-stock formation in installation cohorts, lifetime-driven stock release, technology-driven changes in retired feedstock, and recovery-system matching to the release window, we characterized the evolution of silver from installation input through in-use accumulation to end-of-life release. The main conclusions are as follows.
(1) Silver thrifting and deployment expansion occur simultaneously. From 2018 to 2025, China's technology-weighted average pure-silver intensity declined from 23.33 to 8.86 mg W−1, a reduction of 62.0%, whereas annual installation silver inflow increased from 1,149.66 to 3,108.88 t, an increase of 170.4%. The reduction in silver per unit of power has not yet offset the increase in total silver input caused by deployment growth.
(2) Installation cohorts first form in-use silver stocks and then migrate out of the stock under lifetime constraints. Cumulative installation silver inflow during 2000–2025 was 17,880.61 t, of which 17,784.12 t remained in installed PV-module cohorts at the end of 2025. Under the baseline lifetime scenario, end-of-life silver flow peaked at 739.34 t yr−1 in 2044, whereas retired capacity peaked at 70.77 GWdc yr−1 in 2053. The silver peak preceded the capacity peak by nine years. Across the four lifetime scenarios, silver-flow peaks occurred between 2042 and 2052 and ranged from 565.54 to 1,424.71 t yr−1, indicating that lifetime primarily controls release timing and concentration.
(3) Retired feedstock shifts across technology generations, and recovery capacity must cover the resource-release window. Early-generation crystalline-silicon modules dominated retired silver in 2025, whereas PERC and TOPCon together accounted for 91.0% in 2060. Under the 21% low-recovery scenario, cumulative potentially recoverable silver during 2025–2060 was 3,606.94 t; reaching 90% recovery in 2030 increased this value to 15,335.65 t. Earlier recovery-capacity formation provides more complete coverage of the high end-of-life silver flow around 2040.
5.2. Policy Implications
(1) Recovery-system development should be scheduled around the end-of-life silver-flow growth window near 2040. Module registration, cross-regional collection, and standardized processing networks should be established before high end-of-life flows emerge, with additional capacity reserved for concentrated retirement caused by active replacement.
(2) Sorting and silver-extraction processes should be configured according to the technology sources of retired feedstock. Early-generation crystalline-silicon, PERC, TOPCon, HJT, and XBC modules differ in metallization systems and silver intensity per unit of power. Facility planning should therefore consider the technology composition and silver intensity of retirement cohorts in addition to retired capacity.
(3) Continuous retirement statistics should be established for model calibration. Information on module commissioning, retirement registration, enterprise receipts, and standardized processing should be connected to produce annual retired-capacity and technology-composition series. These data would support calibration of the silver-flow peak year, retired silver mass, and actual recovery output.
Supplementary Materials
The following supporting information will be provided with the online article: Table S1: Annual PV installation capacity in China, 2000–2025; Table S2: Annual market shares of PV cell technologies; Table S3: Cell parameters, paste consumption, metallization parameters, and pure-silver-intensity calculations; Table S4: Weibull parameters for the four module-lifetime scenarios; Table S5: Annual installation silver inflows, retired capacity, end-of-life silver flows, and in-use silver stocks; Table S6: Annual recovery-rate pathways and potentially recoverable silver; Table S7: Parameter ranges and summary results of the uncertainty analysis.
Author Contributions
Conceptualization, J.J. and Q.Z.; methodology, J.J., L.Z. and Q.Z.; software, J.J. and L.Z.; formal analysis, J.J., Q.Z., Y.K. and S.X.; data curation, J.J., L.Z., W.Q. and Y.K.; investigation, J.J.; visualization, J.J.; writing—original draft preparation, J.J.; writing—review and editing, Q.Z.; supervision, Q.Z. and S.X.; project administration, Q.Z. and D.W.; funding acquisition, D.W. All authors have read and agreed to the published version of the manuscript.
Funding
This research was supported by the Tianjin Science and Technology Plan Project, entitled “Intelligent Recycling and Circular Utilization Technology and Application of Retired Crystalline Silicon Photovoltaic Modules” (Contract No. 25ZXSFSN0050), and the Central Guidance on Local Science and Technology Development Fund (Science and Technology Innovation Base Project), entitled “Research on Key Technologies for Efficient and Environmentally Friendly Recycling and Reuse of Retired Photovoltaic Modules Assisted by Artificial Intelligence” (Project No. 254Z3803G).
Institutional Review Board Statement
Not applicable.
Informed Consent Statement
Not applicable.
Data Availability Statement
The data supporting the findings of this study are provided in the article and its Supplementary Materials. The annual PV installation-capacity series, technology-share data, technology-specific pure-silver-intensity calculations, module-lifetime and recovery-rate parameters, and model outputs are provided in Supplementary Tables S1–S7. The underlying data sources are identified and cited in the reference list.
Acknowledgments
During the preparation of this manuscript, the authors used ChatGPT (OpenAI) for English-language editing and manuscript-structure refinement. The authors reviewed and edited the output and take full responsibility for the content of this publication.
Conflicts of Interest
The funding organizations had no role in the design of the study; in the collection, analyses, or interpretation of data; in the writing of the manuscript; or in the decision to publish the results.
References
- Central Committee of the Communist Party of China; State Council of the People's Republic of China. Opinions on Fully, Accurately, and Comprehensively Implementing the New Development Philosophy and Carbon Peaking and Carbon Neutrality. Available online: https://www.gov.cn/zhengce/2021-10/24/content_5644613.htm (accessed on 31 July 2026). [In Chinese].
- Zhang Z G, Kang C Q. Challenges and prospects for constructing the new-type power system towards a carbon neutrality future. Proceedings of the CSEE, 2022, 42(8): 2806-2818 [In Chinese]. [CrossRef]
- IEA PVPS. Trends in Photovoltaic Applications 2025. Paris: International Energy Agency Photovoltaic Power Systems Programme, 2025.
- Wang X M, Ma Z Y, Zhou W X, et al. Carbon neutralization in photovoltaic power generation system and influencing factors. Resources Science, 2022, 44(8): 1735-1744 [In Chinese]. [CrossRef]
- IRENA, IEA-PVPS. End-of-Life Management: Solar Photovoltaic Panels. Abu Dhabi: International Renewable Energy Agency, 2016.
- Zhang Q, Fu L Z. Research on photovoltaic module waste prediction in China. Environmental Engineering, 2020, 38(6): 214-220 [In Chinese]. [CrossRef]
- Wang Y, Chen L D, Shi X Q. Prediction of scrap volume and recyclable resource potential of distributed photovoltaic power generation equipment in the Beijing-Tianjin-Hebei region. Resources Science, 2023, 45(10): 2076-2088 [In Chinese]. [CrossRef]
- Zhang T Y, Wei K X, Dong H J. Prediction of China's photovoltaic waste volume and associated by-product metals recycling potential under carbon neutrality pathway. Resources Science, 2025, 47(5): 1002-1015 [In Chinese]. [CrossRef]
- Lin, M.; Wu, Y.S.; Qin, B.J.; et al. Response to the upcoming emerging waste: Necessity and feasibility analysis of photovoltaic waste recovery in China. Environmental Science & Technology, 2022, 56(23): 17396-17409. [CrossRef]
- Song, G.; Lu, Y.; Liu, B.; et al. Photovoltaic panel waste assessment and embodied material flows in China, 2000-2050. Journal of Environmental Management, 2023, 338: 117675. [CrossRef]
- Peters, I.M.; Hauch, J.; Brabec, C.J. Cradle-to-cradle recycling in terawatt photovoltaics: A vision of perpetual utility. Joule, 2024, 8(4): 899-912. [CrossRef]
- Wang, C.; Zuo, J.; Chen, X.; et al. Towards an equitable future of global photovoltaic waste recycling. Nature, 2026, 656: 888-896. [CrossRef]
- Wang, Q.; Wang, Y.; Huang, B.; et al. Techno-economic and environmental assessment of closed-loop photovoltaic recycling in China. Sustainable Production and Consumption, 2025, 56: 1-12. [CrossRef]
- The Silver Institute. World Silver Survey 2026. Washington, DC: The Silver Institute, 2026.
- Hallam, B.; Kim, M.; Zhang, Y.; et al. The silver learning curve for photovoltaics and projected silver demand for net-zero emissions by 2050. Progress in Photovoltaics: Research and Applications, 2023, 31(6): 598-606. [CrossRef]
- Ren, K.; Tang, X.; Höök, M. Evaluating metal constraints for photovoltaics: Perspectives from China's PV development. Applied Energy, 2021, 282: 116148. [CrossRef]
- Cattaneo, V.; Mast, J.; Hackenhaar, I.; et al. Forecasting silver demand and supply by 2030: Impact of silver-intensive photovoltaic cells and sectoral competition. Resources, Conservation and Recycling, 2026, 224: 108562. [CrossRef]
- Paiano, A. Photovoltaic waste assessment in Italy. Renewable and Sustainable Energy Reviews, 2015, 41: 99-112. [CrossRef]
- Mahmoudi, S.; Huda, N.; Behnia, M. Photovoltaic waste assessment: Forecasting and screening of emerging waste in Australia. Resources, Conservation and Recycling, 2019, 146: 192-205. [CrossRef]
- Tang, Z.; Geng, Y.; Xiao, S.; et al. Tracing the evolution of silver flows and stocks in China during 2000-2023. Resources, Conservation & Recycling Advances, 2026, 30: 200339. [CrossRef]
- Wang, Z.; Liu, L.; Li, B.; et al. Multidimensional dynamic assessment of critical metal availability in China's PV industry: Integrating material flow and cash flow analysis. Resources, Conservation and Recycling, 2026, 233: 109006. [CrossRef]
- China Photovoltaic Industry Association. China Photovoltaic Industry Development Roadmap (2018 Edition). Beijing: China Photovoltaic Industry Association, 2019. [In Chinese].
- China Photovoltaic Industry Association. China Photovoltaic Industry Development Roadmap (2019 Edition). Beijing: China Photovoltaic Industry Association, 2020. [In Chinese].
- China Photovoltaic Industry Association. China Photovoltaic Industry Development Roadmap (2020 Edition). Beijing: China Photovoltaic Industry Association, 2021. [In Chinese].
- China Photovoltaic Industry Association. China Photovoltaic Industry Development Roadmap (2021 Edition). Beijing: China Photovoltaic Industry Association, 2022. [In Chinese].
- China Photovoltaic Industry Association. China Photovoltaic Industry Development Roadmap (2022-2023 Edition). Beijing: China Photovoltaic Industry Association, 2023. [In Chinese].
- China Photovoltaic Industry Association. China Photovoltaic Industry Development Roadmap (2023-2024 Edition). Beijing: China Photovoltaic Industry Association, 2024. [In Chinese].
- China Photovoltaic Industry Association. China Photovoltaic Industry Development Roadmap (2024-2025 Edition). Beijing: China Photovoltaic Industry Association, 2025. [In Chinese].
- China Photovoltaic Industry Association. China Photovoltaic Industry Development Roadmap (2025-2026 Edition). Beijing: China Photovoltaic Industry Association, 2026. [In Chinese].
- Wang X W, Bai J B, Song H, et al. Reliability and lifetime distribution of photovoltaic modules in accelerated aging tests. Renewable Energy Resources, 2017, 35(5): 675-680 [In Chinese]. [CrossRef]
- Yu R B. Research on service reliability evaluation method of photovoltaic modules based on performance degradation. Guangzhou: South China University of Technology, 2016. [In Chinese].
- Fu L Z. Research on forecasting and recycling network planning of photovoltaic module waste in China. Nanjing: Nanjing University of Aeronautics and Astronautics, 2020. [In Chinese].
- McKay, M.D.; Beckman, R.J.; Conover, W.J. A comparison of three methods for selecting values of input variables in the analysis of output from a computer code. Technometrics, 1979, 21(2): 239-245. [CrossRef]
- Jorio, M.; Amaral, A.; Ferreira, P. Dynamic and probabilistic material flow analysis for circular economy strategies in the photovoltaic sector. Environment, Development and Sustainability, 2026. [CrossRef]
- IEA PVPS. IEA PVPS Country Update 2024—China. IEA PVPS, 2025. Available online: https://iea-pvps.org/wp-content/uploads/2025/04/PVPS_Annual_Report_2024_Country_Updates.pdf.
- IEA PVPS. National Survey Report of PV Power Applications in China 2024. IEA PVPS Task 1, 2025. Available online: https://iea-pvps.org/national_survey/nsr-china-2024/.
- IEA PVPS. Trends in Photovoltaic Applications 2026. IEA PVPS Task 1, 2026. Available online: https://iea-pvps.org/trends_reports/trends-2026/.
Figure 1.
Technology-weighted mean pure-silver intensity (a) and silver inflow associated with new PV installations (b) in China, 2018–2025. The year labels shown below panel (b) apply to both panels.
Figure 1.
Technology-weighted mean pure-silver intensity (a) and silver inflow associated with new PV installations (b) in China, 2018–2025. The year labels shown below panel (b) apply to both panels.
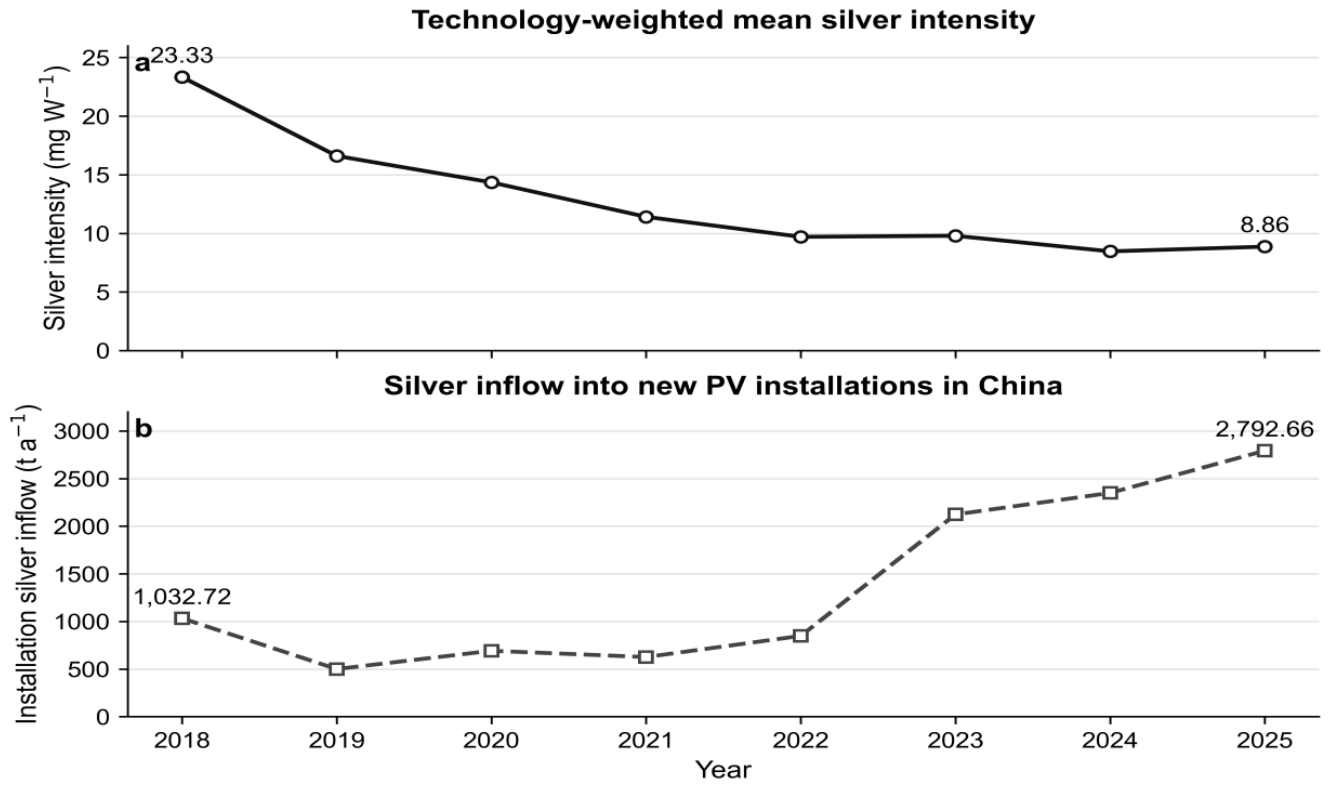
Figure 2.
Annual retired PV capacity and end-of-life silver flows under four module-lifetime scenarios. Note: (a) annual retired capacity; (b) annual end-of-life silver flow. Baseline lifetime, early retirement, active replacement, and extended operation are shown with solid lines and circles, dashed lines and squares, dash-dot lines and triangles, and dotted lines and diamonds, respectively; filled markers indicate scenario peaks.
Figure 2.
Annual retired PV capacity and end-of-life silver flows under four module-lifetime scenarios. Note: (a) annual retired capacity; (b) annual end-of-life silver flow. Baseline lifetime, early retirement, active replacement, and extended operation are shown with solid lines and circles, dashed lines and squares, dash-dot lines and triangles, and dotted lines and diamonds, respectively; filled markers indicate scenario peaks.
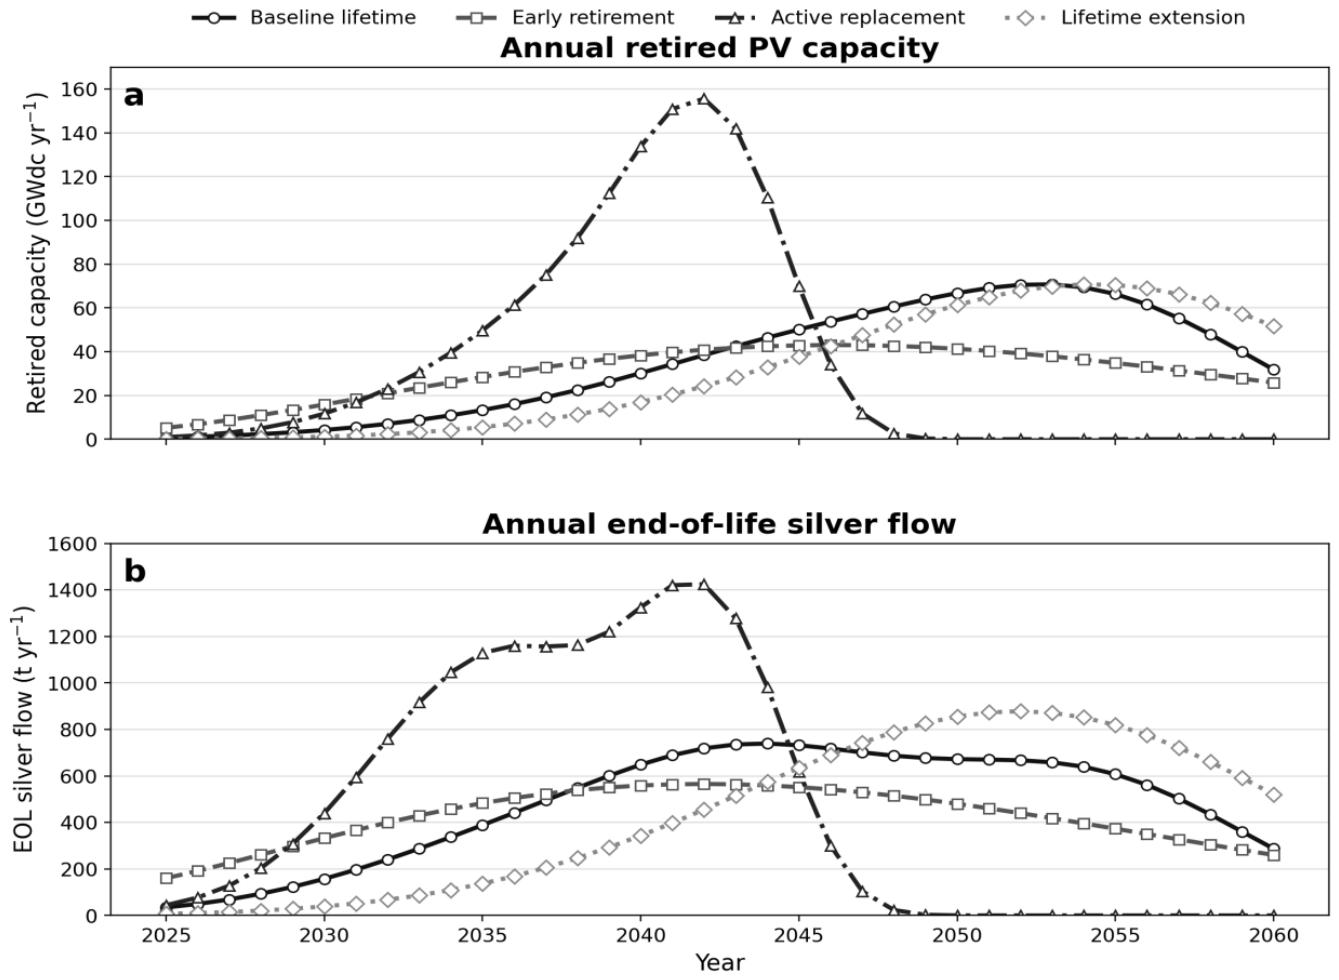
Figure 3.
Cumulative potentially recoverable silver under four recovery-rate scenarios, 2025–2060.
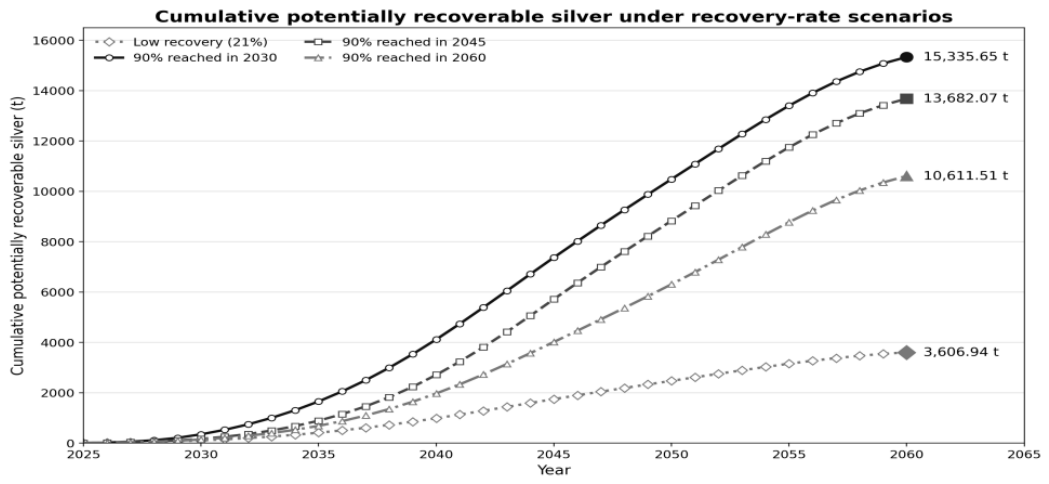
Table 1.
Main data sources.
| Data category | Indicator used | Main source |
|---|---|---|
| Global PV silver demand | PV silver demand | Annual World Silver Survey reports [14] |
| Global PV manufacturing | Global PV module production | IEA PVPS, Trends in Photovoltaic Applications [3] |
| China PV installations | Annual newly installed capacity (GWac source basis; harmonized to GWdc for the cohort MFA) | China PV Development Reports, China PV Industry Roadmaps, IEA PVPS Country Update 2024, NSR China 2024, and industry statistics [22,23,24,25,26,27,28,29,35,36] |
| China cell manufacturing | Annual cell production | Annual China Photovoltaic Industry Roadmaps and PV technology-development reports [22,23,24,25,26,27,28,29] |
| Cell technology structure | Annual shares of Al-BSF, PERC, TOPCon, HJT, and XBC | Annual China Photovoltaic Industry Roadmaps and related technology reports [22,23,24,25,26,27,28,29] |
| Metallization parameters | Paste consumption, electrode structure, cell dimensions, and conversion efficiency | Annual China Photovoltaic Industry Roadmaps [22,23,24,25,26,27,28,29] |
| Module lifetime | Stage-specific Weibull shape and scale parameters | Studies of module reliability, lifetime distributions, and end-of-life projections [6,30,31,32] |
| Silver recovery | Overall recovery rate and improvement pathway | Studies of PV-module end-of-life and resource recovery [7,8] |
Table 2.
Market shares of major photovoltaic cell technologies in China, 2021–2025 (%).
| Year | PERC | TOPCon | HJT | XBC | Data source |
|---|---|---|---|---|---|
| 2021 | 91.2 | 2.2* | 0.6* | 0.2* | China Photovoltaic Industry Roadmap (2021) [25] |
| 2022 | 88.0 | 8.3 | 0.6 | 0.2 | China Photovoltaic Industry Roadmap (2022–2023) [26] |
| 2023 | 73.0 | 23.0 | 2.6 | 0.9 | China Photovoltaic Industry Roadmap (2023–2024) [27] |
| 2024 | 20.5 | 71.1 | 3.3 | 5.0 | China Photovoltaic Industry Roadmap (2024–2025) [28] |
| 2025 | 3.0 | 87.6 | 2.6 | 6.7 | China Photovoltaic Industry Roadmap (2025–2026) [29] |
Table 3.
Photovoltaic-module lifetime-scenario parameters.
| Lifetime scenario | Installation stage | Shape parameter β | Scale parameter α (yr) |
|---|---|---|---|
| Baseline lifetime | 2000–2013 | 5.3759 | 20.840 |
| 2014–2020 | 5.3759 | 25.000 | |
| 2021–2025 | 5.3759 | 30.000 | |
| Early retirement | 2000–2013 | 2.8304 | 20.840 |
| 2014–2020 | 2.4928 | 25.000 | |
| 2021–2025 | 2.4928 | 30.000 | |
| Active replacement | All installation stages | 8.0000 | 18.051 |
| Extended operation | All installation stages | 5.0000 | 32.674 |
Table 6.
Cumulative potentially recoverable silver under different recovery-rate scenarios.
| Recovery-rate scenario | Rate path | Year | Cumulative potentially recoverable silver (t) | Share of cumulative retired silver (%) | Increment vs. low recovery (t) |
|---|---|---|---|---|---|
| Low recovery | 21% | — | 3,606.94 | 21.0 | — |
| 90% reached in 2030 | 90% | 2030 | 15,335.65 | 89.3 | 11,728.71 |
| 90% reached in 2045 | 90% | 2045 | 13,682.07 | 79.7 | 10,075.13 |
| 90% reached in 2060 | 90% | 2060 | 10,611.51 | 61.8 | 7,004.57 |
Disclaimer/Publisher’s Note: The statements, opinions and data contained in all publications are solely those of the individual author(s) and contributor(s) and not of MDPI and/or the editor(s). MDPI and/or the editor(s) disclaim responsibility for any injury to people or property resulting from any ideas, methods, instructions or products referred to in the content. |
© 2026 by the authors. Licensee MDPI, Basel, Switzerland. This article is an open access article distributed under the terms and conditions of the Creative Commons Attribution (CC BY) license (http://creativecommons.org/licenses/by/4.0/).
Copyright: This open access article is published under a Creative Commons CC BY 4.0 license, which permit the free download, distribution, and reuse, provided that the author and preprint are cited in any reuse.