

Submitted:
23 October 2026
Posted:
26 October 2026
You are already at the latest version
Abstract
Circulating histones are increasingly recognised as biologically relevant components of extracellular chromatin, but their composition and treatment-associated dynamics in acute myeloid leukaemia (AML) remain poorly defined. In this prospective single-centre observational study, we profiled 13 histone measures by ImageStream imaging flow cy-tometry in 31 plasma samples from 15 newly diagnosed AML patients at diagnosis/day 7/day 28 (n=15/10/6), with 30 healthy controls and 12 patients with myelodysplastic neoplasms with increased blasts. At diagnosis, nine of 13 measures differed from controls after false discovery rate (FDR) correction, defining a bidirectional profile with higher H2A-, H2B- and macroH2A1-associated measures and lower H3, H4 and H3/H4; the largest differences included in-creased macroH2A1.1 (7.07% vs. 0.47%; δ=0.98) and reduced H4 (0.14% vs. 3.25%; δ=−0.87). By day 7, five measures remained FDR-significant, all decreasing: H4, H3/H4 and the three tetrameric complexes. At day 28, no paired comparison remained FDR-significant; however, H3/H4 showed a significant overall temporal change across the six complete serial trajectories (q = 0.0334). Exploratory day-28 trajectories showed concordant decreases in all three tetrameric complexes in complete remission, with opposite changes in residual disease. MDS with increased blasts showed higher macroH2A1-containing tetrameric complexes than controls and AML. These findings support disease- and treatment-associated redistribution of circulating histone populations across myeloid neoplasia.
Keywords:
acute myeloid leukaemia
; circulating histones
; extracellular chromatin
; myelodysplastic neoplasms with increased blasts
; imaging flow cytometry
1. Introduction
Increasing attention has focused on the release of histones into the extracellular compartment and their biological effects outside the nucleus. Circulating nucleosomal material is detectable at low levels under physiological conditions [1]. Histones and histone-containing chromatin can be released during apoptosis, necrotic cell death and neutrophil extracellular trap formation, and may accumulate when their release exceeds clearance capacity [2,3]. Increased circulating histone and nucleosomal levels have been reported in conditions characterised by extensive cellular injury, inflammation or increased cell turnover, including sepsis, major trauma, inflammatory disorders and malignancy [3,4,5,6]. Experimental and clinical evidence indicates that extracellular histones are not merely by-products of cellular injury but can function as damage-associated molecular patterns and exert direct cytotoxic, pro-inflammatory and prothrombotic effects [4,5,7,8]. Through membrane-mediated cytotoxicity and signalling involving innate immune receptors, including Toll-like receptors, extracellular histones have been implicated in endothelial injury, inflammatory cytokine release, platelet activation and enhanced thrombin generation, thereby contributing to microvascular thrombosis, thromboinflammation and organ dysfunction [4,5,7,8]. Collectively, these observations suggest a dual biological perspective in which circulating histones may both reflect cellular injury and death and actively participate in the propagation of pathological processes.
Acute myeloid leukaemia (AML) provides a relevant setting for investigating extracellular chromatin dynamics because of its high and rapidly changing leukaemic cell burden, substantial spontaneous cellular turnover and treatment-induced cytoreduction. In acute leukaemia, circulating histone–DNA complexes have been reported at increased levels and associated with peripheral-blood blast counts [9]. Experimental studies have shown that leukaemic cell lines can release extracellular histones through reactive-oxygen-species-dependent mechanisms. These studies also indicate that extracellular histones can induce endothelial adhesion-molecule expression and promote leukaemic-cell adhesion and survival [9]. Increased extracellular-trap formation, contact-system activation and enhanced thrombin generation have also been described in acute leukaemia, supporting an association between extracellular chromatin and an inflammatory and procoagulant milieu [10]. Longitudinal data, however, remain limited. Serial measurements of serum nucleosomal DNA during induction therapy demonstrated an overall decline during the first treatment week, with a transient early increase in some patients and early nucleosomal kinetics associated with subsequent treatment response [11]. More recent studies have explored cell-free tumour DNA kinetics during AML treatment as a minimally invasive approach to monitoring treatment response [12].
Previous studies of circulating chromatin in AML have predominantly focused on cell-free DNA, nucleosomal DNA or aggregate histone–DNA complexes [9,11,12]. A recent plasma-based study reported disease-associated differences in circulating histone profiles in myelodysplastic neoplasms (MDS) and solid malignancies [13]. However, comparatively little is known about the relative distribution of individual histones, histone variants and histone-containing complexes at AML diagnosis, or whether these populations change differentially during antileukaemic treatment. This distinction may be biologically relevant because extracellular histones, nucleosomes and cell-free DNA represent related but structurally and functionally non-equivalent components of circulating chromatin [2]. MacroH2A1 is of particular interest because of its role in chromatin organisation and regulation, and experimental evidence implicating macroH2A1.1 in haematopoietic stem-cell homeostasis and myeloid differentiation [14,15]. In this prospective single-centre observational study, we used ImageStream imaging flow cytometry to profile the canonical histones H2A, H2B, H3 and H4, the macroH2A1 variants macroH2A1.1 and macroH2A1.2, and histone complexes. We aimed to characterise the circulating histone profile at AML diagnosis and assess its longitudinal changes during early antileukaemic treatment and at response assessment. Cross-sectional comparisons with healthy controls and patients with myelodysplastic neoplasms with increased blasts (MDS-IB) were included to evaluate the AML profile against both physiological and disease-associated comparators.
2. Results
2.1. Study Cohort Characteristics and Sample Availability
The AML cohort comprised 15 patients with newly diagnosed AML, with a median age of 49 years (interquartile range [IQR] 41.5–66.5); 9 patients (60.0%) were male. According to the European LeukemiaNet (ELN) 2022 risk classification, 1 patient (6.7%) was classified as favourable risk, 7 (46.7%) as intermediate risk and 7 (46.7%) as adverse risk. A total of 31 AML plasma samples were analysed: 15 at diagnosis, 10 on day 7 and 6 on day 28. Six patients contributed samples at all three predefined time points.
The MDS with increased blasts (MDS-IB) cohort comprised 12 patients, with a median age of 70.5 years (IQR, 62.5–72.8); 8 patients (66.7%) were male. Three patients (25.0%) had MDS-IB1 and 9 (75.0%) had MDS-IB2. The healthy-control group comprised 30 individuals, with a median age of 61.5 years (IQR, 54.25–71.25); 18 (60.0%) were male. Baseline characteristics of the three study groups are summarised in Table 1.
2.2. Circulating Histone Measures at AML Diagnosis
At diagnosis, nine of the 13 predefined histone measures differed significantly between patients with AML and healthy controls after Benjamini–Hochberg false-discovery-rate correction, as presented in Figure 1; Supplementary Table S1A. The profile was bidirectional rather than reflecting a uniform increase in circulating histone-associated material. H2A, H2B, macroH2A1.1 and macroH2A1.2 and the canonical H2A/H2B/H3/H4 tetrameric complex showed higher relative abundance in AML, whereas H3, H4 and H3/H4 were lower. H2A/H2B also differed between groups after FDR correction, although the median value was 0% in both groups, reflecting differences in the distribution and frequency of non-zero observations (q = 0.0019).
The largest effect sizes were observed for the macroH2A1 variants. Median relative abundance of macroH2A1.1 was 7.070% in AML compared with 0.470% in healthy controls (q = 1.35 × 10⁻⁶; Cliff’s δ = 0.982), while macroH2A1.2 was 10.960% versus 0.395%, respectively (q = 1.35 × 10⁻⁶; Cliff’s δ = 0.960). In contrast, H4 was markedly lower in AML (0.140% vs. 3.250%; q = 9.14 × 10⁻⁶; Cliff’s δ = −0.867). H3 and H3/H4 were likewise significantly lower after FDR correction.
No FDR-significant differences were observed for macroH2A1.1/H2B, macroH2A1.2/H2B or either macroH2A1-containing tetrameric complex. Complete statistics for all 13 histone measures in the AML–healthy-control comparison are presented in Supplementary Table S1A.
2.3. Early Longitudinal Changes During Antileukaemic Treatment
Among the 10 patients with paired samples available at diagnosis and day 7 of treatment, five of the 13 predefined histone measures showed significantly lower relative abundance at day 7 after FDR correction: H4, H3/H4 and all three tetrameric complexes (Figure 2; Figure 3; Supplementary Table S2A).
Median H4 decreased from 0.1054% at diagnosis to 0.0064% at day 7 (exact p = 0.0039; q = 0.0102; paired rank-biserial r = −0.96; Figure 3A), while H3/H4 decreased from 2.0228% to 0.0011% (exact p = 0.0020; q = 0.0102; r = −1.00; Figure 3B). The canonical H2A/H2B/H3/H4 tetrameric complex decreased from 7.1621% to 1.1813% (exact p = 0.0020; q = 0.0102; r = −1.00; Figure 3C). Similarly, macroH2A1.1/H2B/H3/H4 decreased from 5.5531% to 0.7171%, and macroH2A1.2/H2B/H3/H4 from 10.0773% to 1.0632% (exact p = 0.0039; q = 0.0102; r = −0.96 for both comparisons; Figure 3D, E).
Three additional monomeric measures showed nominal decreases that did not remain significant after FDR correction. H3 decreased from 0.2266% to 0.0419% (exact p = 0.0273; q = 0.0592), macroH2A1.2 from 8.5965% to 2.8948% (exact p = 0.0371; q = 0.0603), and macroH2A1.1 from 6.4160% to 2.4095% (exact p = 0.0371; q = 0.0603). H2A increased from 0.2694% to 2.5446%, but the paired difference was not statistically significant (exact p = 0.0840; q = 0.1213).
Figure 2 summarises the direction and magnitude of the paired effects across all 13 measures, whereas Figure 3 shows individual paired trajectories for the five measures remaining significant after FDR correction. Complete diagnosis-to-day-7 statistics for all 13 predefined histone measures are provided in Supplementary Table S2A.
2.4. Day-28 Histone Dynamics and Exploratory Response Analysis
Among the six patients with paired samples available at diagnosis and day 28, none of the 13 predefined histone measures remained statistically significant after FDR correction.
Median relative abundance of H4 decreased from 0.1054% (IQR, 0.0412–0.2757) at diagnosis to 0.0076% (IQR, 0.0043–0.0159) on day 28, but the paired difference was not statistically significant (exact p = 0.0625; q = 0.4063; paired rank-biserial r = −0.90). H3/H4 decreased from 2.1013% (IQR, 0.2917–5.0236) to 0.0036% (IQR, 0.0008–0.0043), with nominal significance that did not remain significant after FDR correction (exact p = 0.0313; q = 0.4063; r = −1.00). All three tetrameric complexes showed lower median relative abundance at day 28. H2A/H2B/H3/H4 decreased from 3.7400% to 2.6512% (exact p = 0.3125; q = 0.8125; r = −0.52), macroH2A1.1/H2B/H3/H4 from 5.3601% to 2.1840% (exact p = 0.4375; q = 0.9141; r = −0.43), and macroH2A1.2/H2B/H3/H4 from 6.9097% to 2.3551% (exact p = 0.5625; q = 0.9141; r = −0.33). None of these paired differences was statistically significant. Median H2A relative abundance increased from 0.2030% to 4.5547%, with increases in five of the six patients (exact p = 0.3125; q = 0.8125). Median H2B relative abundance increased from 0.0007% to 0.0103% (exact p = 0.2188; q = 0.8125). Neither paired difference was statistically significant. Complete paired statistics are provided in Supplementary Table S2B.
In the six patients with complete serial samples across diagnosis, day 7 and day 28, H3/H4 was the only measure showing a significant overall temporal difference after FDR correction. Its median relative abundance was 2.1013% at diagnosis, 0.0000% at day 7 and 0.0036% at day 28 (exact Friedman p = 0.0026; q = 0.0334; Kendall’s W = 0.85). Median H4 values were 0.1054%, 0.0054% and 0.0076%, respectively (exact p = 0.1840; q = 0.3418; W = 0.33). The three tetrameric complexes showed lower median values at both post-treatment time points, but their overall comparisons did not remain significant after FDR correction (exact p = 0.0289; q = 0.0940; W = 0.58 for each). Complete three-time-point statistics are provided in Supplementary Table S2C.
An exploratory response analysis included the same six patients. All three tetrameric complexes decreased from diagnosis to day 28 in each of the four patients achieving complete remission and increased in both patients with residual bone-marrow blasts >5% (Figure 4). Between-group comparisons of individual T2 − T0 changes were not statistically significant (two-sided exact Mann–Whitney U = 0; p = 0.133 for each complex). The association between response status and direction of change was also not statistically significant (two-sided Fisher’s exact p = 0.067). Given the small subgroup sizes, this directional pattern should be considered exploratory and hypothesis-generating.
2.5. Cross-Sectional Histone Measures in MDS with Increased Blasts
Compared with healthy controls, 7 of the 13 analysed histone measures differed significantly in patients with MDS-IB after FDR correction (Figure 5). H2A showed higher relative abundance, whereas H3, H4 and the H3/H4 dimer were lower; all three tetrameric complexes were higher. The largest differences involved the macroH2A1-containing tetrameric complexes. Median macroH2A1.1/H2B/H3/H4 was 27.375% in MDS with increased blasts versus 4.140% in healthy controls (q=1.16×10⁻⁵; Cliff’s δ=0.99), while macroH2A1.2/H2B/H3/H4 was 28.290% versus 4.035%, respectively (q=5.82×10⁻⁵; Cliff’s δ=0.89). The canonical H2A/H2B/H3/H4 complex was likewise higher in MDS-IB (21.145% vs 1.505%; q=0.0078; Cliff’s δ=0.61). Conversely, H4 and H3/H4 were lower than in healthy controls (2.159% vs 3.250%, q=0.0321; and 0.455% vs 3.410%, q=0.0146, respectively). Complete MDS–healthy-control comparisons are provided in Supplementary Table S1B.
Direct comparison between MDS-IB and newly diagnosed AML identified significant differences in eight of 13 histone measures after FDR correction (Figure 5). H2A, H2B, H3, macroH2A1.1 and macroH2A1.2 were lower in MDS-IB, whereas H4 and both macroH2A1-containing tetrameric complexes were higher. This contrast was particularly pronounced for the macroH2A1-associated populations: macroH2A1.2 was markedly lower in MDS-IB than in AML (0.305% vs 10.960%; q=3.68×10⁻⁴; Cliff’s δ=−0.92), whereas macroH2A1.1/H2B/H3/H4 was substantially higher (27.375% vs 4.650%; q=3.68×10⁻⁴; Cliff’s δ=0.94). H4 was likewise higher in MDS-IB (2.159% vs 0.140%; q=5.53×10⁻⁴; Cliff’s δ=0.88). The canonical H2A/H2B/H3/H4 complex was numerically higher in MDS-IB but did not remain significant after FDR correction. Complete cross-sectional comparisons are provided in Supplementary Table S1C.
To further characterise differences in circulating histone and histone-complex profiles among untreated AML, MDS-IB, and healthy controls, we performed principal component analysis (PCA). The three groups occupied distinct but partially overlapping regions of the principal component 1 (PC1) and principal component 2 (PC2) space (Figure 6A). The first two principal components accounted for approximately 60.6% of the total variance (PC1, 35.7%; PC2, 24.8%). Healthy controls were distributed predominantly toward negative PC1 values, whereas AML samples were shifted toward positive PC1 values and showed the greatest within-group dispersion. MDS-IB samples were displaced predominantly along PC2 and did not simply occupy an intermediate position between healthy controls and AML. The overall silhouette coefficient was 0.306, consistent with moderate group structure, with group-specific silhouette coefficients of 0.388 for healthy controls, 0.425 for MDS-IB, and 0.045 for AML. The Calinski–Harabasz index was 30.33, providing additional exploratory support for the observed multivariate group structure. These findings should be interpreted as descriptive of group geometry rather than as evidence of diagnostic classification.
The loading plot (Figure 6B) indicated that group separation reflected coordinated contributions from multiple histone measures rather than a single variable. Positive PC1 loadings were observed for H2A, H2B, H2A/H2B, macroH2A1.1, macroH2A1.2, and the macroH2A1-containing H2B dimers, whereas H3, H4, and H3/H4 were oriented toward negative PC1. The three tetrameric complexes—H2A/H2B/H3/H4, macroH2A1.1/H2B/H3/H4, and macroH2A1.2/H2B/H3/H4—showed strong positive loadings on PC2, with the largest PC2 contributions observed for the two macroH2A1-containing tetrameric complexes.
Comparison of the score and loading plots provided a consistent representation of the multivariate differences among the three groups. Healthy controls were distributed predominantly toward negative PC1 values, whereas AML samples were shifted toward positive PC1 values and showed greater within-group dispersion. MDS-IB samples were displaced predominantly along PC2 and occupied a distinct but partially overlapping region of the PC1–PC2 space. This spatial organisation was consistent with the loading structure: negative PC1 values were associated predominantly with H3, H4, and H3/H4, whereas positive PC1 values were associated with H2A, H2B, H2A/H2B, the macroH2A1 variants, and their H2B-containing dimers. Positive PC2 values were driven predominantly by the three tetrameric complexes—H2A/H2B/H3/H4, macroH2A1.1/H2B/H3/H4, and macroH2A1.2/H2B/H3/H4. These PCA-derived patterns were consistent with the cross-sectional differences in the corresponding circulating histone measures described above.
Additionally, a complementary heatmap of standardised group medians further illustrated the contrasting patterns of canonical histones, macroH2A1 variants, and multi-epitope histone populations across healthy controls, MDS with increased blasts, and AML (Supplementary Figure S1).
3. Discussion
This study identified a distinct, non-uniform circulating histone profile in newly diagnosed AML and demonstrated substantial reorganisation of this compartment during early antileukaemic treatment. At diagnosis, selected H2A-, H2B-, and macroH2A1-associated populations were enriched, whereas H3-, H4-, and H3/H4-associated populations were reduced relative to healthy controls. H4, H3/H4, and all three histone complexes decreased by day 7, while H3/H4 showed a significant overall temporal difference in the complete serial cohort. In the complete serial cohort, H3/H4 alone showed significant overall variation across diagnosis, day 7 and day 28 after FDR correction. The divergent day-28 trajectories of tetrameric complexes according to response status provide an additional exploratory observation. In parallel, MDS-IB displayed a distinct cross-sectional configuration, characterised particularly by enrichment of macroH2A1-containing tetrameric complexes and a markedly different distribution of macroH2A1 forms compared with AML. These findings provide a complementary analytical perspective to previous AML studies of circulating histone–DNA complexes, nucleosomal DNA and cell-free tumour DNA [9,11,12]. They also complement recent plasma-based profiling of circulating histone populations in MDS and solid malignancies [13].
The bidirectional baseline pattern cautions against interpreting all circulating histone populations as equivalent indicators of extracellular chromatin release. This distinction is biologically relevant because free histones, nucleosomes and cell-free DNA represent related but structurally and functionally non-equivalent components of extracellular chromatin [2]. Experimental studies have shown that chromatin fragmentation during apoptosis may be accompanied by dissociation of histones from nucleosomal DNA [16]. Serum DNase I and the plasminogen system can contribute to chromatin degradation during necrosis [17]. Extracellular histones are also susceptible to proteolytic processing, including factor VII-activating protease-mediated cleavage [18]. These observations provide a mechanistic rationale for considering cellular release, structural disassembly, extracellular enzymatic processing and clearance as potential determinants of circulating histone composition, rather than attributing it solely to the magnitude of cell death.
Nucleosome architecture provides an additional conceptual framework for interpreting the differential representation of circulating histone-associated forms. The nucleosomal core comprises a central (H3–H4)₂ tetramer flanked by two H2A–H2B dimers, with H2A–H2B dimers exhibiting greater dynamic exchange during transcription-associated nucleosome disassembly and reassembly [19,20]. Although these observations derive from nuclear chromatin dynamics rather than extracellular chromatin, they illustrate that individual histone components are not structurally equivalent during nucleosome remodelling. This structural organisation provides a biologically plausible context for the relative enrichment of selected H2A/H2B-associated measures together with the lower abundance of H3- and H4-associated populations observed in AML. However, the present data do not establish that these circulating patterns result directly from nucleosomal disassembly. This interpretation should therefore be regarded as a mechanistic hypothesis rather than evidence of a causal process.
Previous disease-specific observations support the biological relevance of extracellular histone-containing material in acute leukaemia. Circulating histone–DNA complexes have been associated with peripheral-blood blast counts, while leukaemic cell lines have been shown experimentally to release extracellular histones through reactive-oxygen-species-dependent mechanisms [9]. Extracellular histones have also been shown to induce endothelial adhesion-molecule expression and promote leukaemic-cell adhesion and survival, suggesting potential biological effects within the leukaemic microenvironment [9]. Increased circulating extracellular-trap markers, contact-system activation and enhanced thrombin generation have been reported in acute leukaemia [10]. Together, these observations provide a disease-specific context in which leukaemic burden, extracellular chromatin release, endothelial perturbation and haemostatic activation may converge.
Among the baseline findings, the higher abundance of circulating macroH2A1.1 and macroH2A1.2 monomeric forms in AML compared with healthy controls was particularly notable. MacroH2A1 belongs to the H2A histone-variant family and contributes to specialised chromatin states and transcriptional regulation [14]. Experimental evidence further implicates the macroH2A1.1 isoform in haematopoietic stem-cell homeostasis and myeloid differentiation [15]. In MDS-derived mesenchymal stromal cells, macroH2A1.1 accumulation has been linked to TLR4-associated inflammatory, epigenetic and metabolic programmes [21]. These intracellular observations do not establish the cellular origin or functional significance of circulating macroH2A1-containing populations in AML. Nevertheless, the marked differences observed for both macroH2A1 variants highlight histone-variant representation as a prominent component of the baseline AML circulating histone profile and provide a rationale for further mechanistic investigation.
The day-7 analysis provided early treatment-associated changes in the abundance of circulating histone populations. H4, the H3/H4 dimer and all three tetrameric complexes decreased significantly, with large paired effect sizes, whereas the remaining monomeric forms showed heterogeneous numerical changes. Longitudinal data on circulating chromatin in AML remain limited. Mueller et al. reported dynamic changes in serum nucleosomal DNA during AML induction therapy, including early transient increases in some patients followed by subsequent decline, with early nucleosomal kinetics associated with subsequent treatment response [11]. The present findings complement these observations by characterising early treatment-associated changes at the level of individual histones, histone variants and histone-containing complexes. Importantly, the lower abundance of selected histone populations observed at day 7 should not be interpreted as evidence of reduced histone release per se. An earlier phase of treatment-associated chromatin release could have preceded the day-7 sampling point, with subsequent structural disassembly, extracellular processing and clearance contributing to the observed profile. Previously reported early fluctuations in serum nucleosomal DNA during AML induction therapy support the plausibility of such temporal dynamics [11]. Modelling of serial ctDNA measurements during intensive AML therapy has likewise incorporated blast-cell death, transfer of tumour-derived DNA into peripheral blood and subsequent decay as separate processes [12]. Although these findings concern different analytes, they provide a rationale for considering the temporal relationship between cellular release and the subsequent fate of circulating chromatin-derived material.
At day 28, no individual histone measure remained statistically significant in the paired diagnosis-to-day-28 comparison after correction for multiple testing, a finding that should be interpreted in the context of the small evaluable cohort. However, in the six patients with complete serial sampling, H3/H4 showed significant overall temporal changes across diagnosis, day 7 and day 28, with markedly lower median values at both post-treatment time points. The three tetrameric complexes likewise remained below their baseline median levels, although their overall three-time-point comparisons did not retain FDR-adjusted significance. These findings suggest that the circulating histone profile remained altered at response assessment, although the small number of evaluable patients precludes firm conclusions regarding the persistence or biological significance of these changes.
The biological context at day 28 differs from that at diagnosis and during early cytoreduction. In patients achieving complete remission, reduction of the malignant cell compartment occurs alongside recovery of non-leukaemic haematopoiesis, potentially altering the cellular sources and extracellular processing of chromatin-derived material. Conversely, residual leukaemic blasts may constitute a persistent source of extracellular chromatin. Previous observations linking circulating histone–DNA complexes to peripheral-blood blast counts provide biological plausibility for such a relationship [9]. Nevertheless, the present study did not establish the cellular origin of the detected histone-associated populations, and these potential contributions remain mechanistic hypotheses rather than demonstrated explanations for the day-28 profile. Within this context, the individual response evaluation revealed concordant directions of change across all three tetrameric complexes: their relative abundance decreased from diagnosis to day 28 in each of the four patients achieving complete remission and increased in both patients with residual bone-marrow blasts >5%. However, neither the between-group comparisons of paired changes nor the analysis of directional concordance reached statistical significance. Previous studies have associated early nucleosomal DNA kinetics with treatment response in AML [11]. Treatment-related ctDNA kinetics have also been investigated in relation to bone-marrow blast clearance [12]. Against this background, the observed directional pattern raises the hypothesis that changes in circulating tetrameric complexes may be related to disease clearance or persistence. Given the small subgroup sizes, however, this observation remains hypothesis-generating and should not be interpreted as evidence of predictive, prognostic or biomarker utility.
The MDS-IB findings provide a complementary perspective on the distribution of circulating histone-associated populations across myeloid neoplasms. Compared with healthy controls, patients with MDS with increased blasts demonstrated higher abundance of all three tetrameric complexes and lower H3, H4 and H3/H4. More notably, comparison with newly diagnosed AML further highlighted an even more distinctive distribution of macroH2A1-associated populations: both macroH2A1.1 and macroH2A1.2 monomeric forms were lower in MDS, whereas both macroH2A1-containing tetrameric complexes were higher. Thus, the circulating histone profile in MDS with increased blasts was not simply intermediate between healthy controls and AML but instead exhibited a distinct configuration of monomeric and tetrameric macroH2A1-associated forms.
Several biological processes may contribute to the contrasting circulating histone profiles in MDS and AML. Historical studies have reported increased intramedullary apoptosis in MDS, particularly in earlier disease, while demonstrating that apoptotic activity varies with disease stage [22]. NLRP3 inflammasome activation and pyroptotic cell death have also been implicated in ineffective haematopoiesis in MDS [23]. Inflammasome-associated release of oxidised mitochondrial DNA into the circulation provides further evidence of extracellular release of intracellular material in MDS [24]. These observations support the broader concept that disease-specific cell-death and inflammatory pathways may influence the nature and subsequent extracellular processing of chromatin-derived material. The enrichment of tetrameric complexes in MDS may reflect differences in chromatin release, structural disassembly or extracellular processing relative to AML, although these mechanisms were not directly assessed.
Collectively, these findings support further investigation of histone-resolved profiling of circulating chromatin as a complementary approach to characterising disease-associated differences across myeloid neoplasms and treatment-associated changes in AML.
Strengths and Limitations
The principal limitation of the present study is the modest cohort size, particularly for the longitudinal analyses and the exploratory response-associated analysis, which limits the precision of effect estimates and the scope of subgroup comparisons. Although serial sampling was prospectively scheduled, only six patients contributed complete samples at all three predefined time points, with attrition resulting from early deaths.
Several aspects of the study nevertheless strengthen the internal consistency of the findings. Consecutive enrolment of newly diagnosed patients, prospective sampling at predefined clinically relevant time points and repeated measurements within the same individuals enabled assessment of treatment-associated changes. The inclusion of both healthy controls and a biologically related MDS cohort with increased blasts allowed the AML findings to be evaluated against both physiological and disease-associated comparator groups. In addition, parallel assessment of canonical histones, macroH2A1 variants and tetrameric complexes provided a differentiated characterisation of the circulating histone profile. Finally, the statistical approach was tailored to the structure and size of the dataset, incorporating non-parametric and exact methods with effect-size estimation and false-discovery-rate correction within prespecified analytical families, allowing the findings to be interpreted in terms of both effect magnitude and statistical evidence while accounting for multiple testing.
4. Materials and Methods
4.1. Study Design and Participants
This prospective single-centre observational study was conducted at the Clinic of Haematology, St. Marina University Hospital, Varna, Bulgaria, and included 15 consecutive adult patients with newly diagnosed acute myeloid leukaemia (AML) with serial sampling at predefined time points. AML was classified according to the 2022 World Health Organization (WHO) classification of myeloid neoplasms [25], and genetic risk stratification was performed according to the 2022 European LeukemiaNet (ELN) recommendations [26]. For cross-sectional comparison, the study included 30 healthy controls and 12 patients with myelodysplastic neoplasms with increased blasts (MDS-IB). Patients with MDS-IB were recruited at the same centre and healthy-control plasma samples were obtained from Proteogenex (CA, USA). All plasma samples from healthy controls, patients with AML, and patients with MDS-IB were subsequently subjected to the same standardised downstream laboratory workflow, including thawing, immunostaining, ImageStream acquisition, fluorescence compensation, and analysis using the same instrument settings and gating strategy. MDS was classified according to the 2022 WHO criteria [25]. All MDS-IB samples were obtained before initiation of disease-directed therapy. First-line AML treatment was selected according to disease characteristics, ELN risk, patient fitness and eligibility for intensive therapy. Given the cohort size and treatment heterogeneity, treatment-specific comparisons were not prespecified. In the AML cohort, plasma samples were collected at diagnosis before initiation of antileukaemic therapy (T0), on day 7 of treatment (T1) and on day 28 (T2), corresponding to the planned response assessment. A total of 31 AML plasma samples were analysed: 15 at T0, 10 at T1 and 6 at T2. Six patients contributed samples at all three predefined time points. All missing longitudinal samples were attributable to early deaths. Paired comparisons were restricted to patients with samples available at both relevant time points. No missing longitudinal data were imputed.
4.2. Blood Collection, Plasma Processing and ImageStream-Based Histone Profiling
Peripheral blood was collected into K2EDTA tubes, maintained at 4 °C and processed within 2 h of venepuncture. Plasma was separated by centrifugation at 3000 × g for 20 min at 4 °C, carefully transferred without disturbing the cellular fraction, aliquoted and stored at −80 °C until analysis. Separate plasma aliquots were used to minimise repeated freeze–thaw cycles.
Circulating histone-positive objects were analysed using multichannel ImageStream imaging flow cytometry, using an approach adapted from a previously described protocol [27]. A four-colour acquisition configuration was used, with each plasma sample analysed separately in three four-antibody panels. For each panel, 25 μL of plasma was incubated overnight at 4 °C with the corresponding primary antibodies against H2A, macroH2A1.1, macroH2A1.2, H2B, H3 and H4, each at a 1:50 dilution. Samples were subsequently incubated for 2 h at room temperature with the respective fluorochrome-conjugated secondary antibodies at a 1:100 dilution. Primary- and secondary-antibody specifications are provided in Supplementary Table S3.
For each sample and antibody panel, 20,000 objects were acquired using an ImageStreamX Mark II multispectral imaging flow cytometer. Fluorescence compensation was performed using single-colour controls. The predefined gating strategy comprised selection of focused objects, exclusion of cellular objects using bright-field morphological parameters and identification of fluorescence-positive extracellular objects. Compensated image files were analysed using IDEAS software version 6.2. Detailed laser configurations, channel assignments, compensation procedures and gating parameters are provided in the Supplementary Methods.
Single-marker-positive objects were operationally designated as monomeric forms, dual-marker-positive objects as dimeric forms, and objects positive for all four epitopes within a given antibody panel as tetrameric complexes. These designations represent operational imaging-flow-cytometry classifications based on simultaneous immunofluorescent detection of the corresponding epitopes and do not constitute direct biochemical confirmation of molecular stoichiometry, physical histone–histone interactions or intact nucleosomal structure. The 13 predefined histone measures comprised H2A, H2B, H3, H4, H2A/H2B, H3/H4, H2A/H2B/H3/H4, macroH2A1.1, macroH2A1.1/H2B, macroH2A1.1/H2B/H3/H4, macroH2A1.2, macroH2A1.2/H2B and macroH2A1.2/H2B/H3/H4. Histone measures were expressed as the percentage of corresponding histone-positive objects within the final gated population and therefore represent relative abundance rather than absolute plasma concentration.
4.3. Statistical Analysis
Continuous variables were summarised as median and interquartile range (IQR), and categorical variables as number and percentage. Cross-sectional analyses comprised three predefined pairwise comparisons: newly diagnosed AML versus healthy controls, MDS-IB versus healthy controls, and MDS-IB versus newly diagnosed AML. These comparisons were performed using two-sided Mann–Whitney U tests, with Cliff’s delta reported as the corresponding effect-size measure.
Longitudinal changes in the AML cohort were evaluated using two-sided exact Wilcoxon signed-rank tests for diagnosis versus day 7 and diagnosis versus day 28. Exact p values were obtained by enumeration of all possible sign assignments among non-zero paired differences; zero differences were excluded from the rank calculation, and tied absolute differences were assigned average ranks. Paired rank-biserial correlation was reported as the effect-size measure. In patients with samples available at all three predefined time points, overall temporal changes were assessed using the exact Friedman test, with Kendall’s W reported as the effect-size measure. Exact Friedman p values were obtained by enumerating all 46,656 within-patient permutations of the three time-point labels, using average ranks and a tie-corrected statistic.
Benjamini–Hochberg false-discovery-rate (FDR) correction was applied separately across the 13 predefined histone measures within each of six analytical families: AML versus healthy controls, MDS with increased blasts versus healthy controls, MDS-IB versus AML, diagnosis versus day 7, diagnosis versus day 28, and the overall three-time-point analysis. Each family addressed a distinct biological comparison. Benjamini–Hochberg-adjusted p values are reported as q values, with q < 0.05 considered statistically significant within the corresponding family.
Day-28 response analyses were considered exploratory because of the limited number of evaluable patients. Response status was defined according to the 2022 European LeukemiaNet criteria [26]. Changes from diagnosis to day 28 in the three tetrameric histone complexes were compared between patients achieving complete remission and those with residual bone-marrow blasts >5% using two-sided exact Mann–Whitney U tests. The association between response status and the direction of change, categorised as a decrease or increase, was additionally assessed using a two-sided Fisher’s exact test.
Principal component analysis (PCA) was performed on the 13 circulating histone measures using all 57 cross-sectional samples (30 healthy controls, 12 patients with MDS-IB and 15 patients with newly diagnosed AML). Histone measures were log1p-transformed and z-standardised before PCA. The silhouette coefficient and Calinski–Harabasz index were calculated in the PC1–PC2 space as exploratory descriptors of the predefined group structure. PCA was considered descriptive and was not used for diagnostic classification.
A complementary heatmap was generated using z-standardised group medians. Measures with a median of 0% in all three groups were omitted. PCA and heatmap analyses were descriptive and were not used for inferential testing or diagnostic classification.
Statistical analyses used IBM SPSS Statistics (version 26.0) and Python (version 3.12.14) with SciPy (version 1.17.0). PCA was performed in R version 4.4.3 within RStudio.
GenAI was used as an assistive tool for preparation and formatting of selected data visualisations. All visualisations were reviewed against the underlying source data by the authors, who take full responsibility for the final content.
5. Conclusions
This study used ImageStream-based imaging flow cytometry to characterise circulating canonical histones, macroH2A1 variants and histone complexes in AML at diagnosis, during early antileukaemic treatment and at day-28 response assessment. The analysis identified a distinct circulating histone profile in newly diagnosed AML compared with healthy controls and characterised longitudinal patterns of change in the relative abundance of histone populations during antileukaemic treatment and at day-28 response evaluation. Exploratory analysis showed divergent trajectories of tetrameric complexes according to response status. The contrasting distribution of macroH2A1-associated populations in MDS with increased blasts further highlights differences in circulating histone profiles between myeloid neoplasms. Together, these observations support the potential value of examining histone composition and dynamics as a complementary dimension of circulating-chromatin assessment. Validation in larger independent cohorts is required to establish the reproducibility, biological basis, and potential translational relevance of these patterns.
Supplementary Materials
The following supporting information can be downloaded at the website of this paper posted on Preprints.org: Figure S1: Standardised group-median heatmap of circulating histone profiles across healthy controls, MDS with increased blasts and newly diagnosed AML; Table S1: Cross-sectional pairwise comparisons of circulating histone measures among healthy controls, MDS with increased blasts and newly diagnosed AML; Table S2: Longitudinal dynamics of circulating histone measures from diagnosis through early treatment to response assessment in AML; Table S3: Antibodies used for immunostaining of plasma samples; Supplementary Methods: Detailed antibody-panel and plasma-immunostaining procedures, ImageStream acquisition and fluorescence compensation, image analysis and gating, operational classification and quantification of histone-positive populations.
Author Contributions
Conceptualization, I.R., I.M. and N.D.; Methodology, M.V., D.T., D.B. and J.C.; Formal analysis, N.D., I.R. and I.M.; Investigation, N.D.; Resources, N.D., I.M., I.R., M.V., D.B. and J.C.; Data curation, N.D., I.R. and I.M.; Writing—original draft preparation, N.D.; Writing—review and editing, N.D., I.R. and I.M.; Visualization, N.D.; Supervision, I.R. and I.M.; Project administration, I.R. and M.V.; Funding acquisition, I.R. and M.V. All authors have read and agreed to the published version of the manuscript.
Funding
This research was supported by the TRANSTEM project (Translational Stem Cell Biology) at the Medical University of Varna, funded by the European Union’s Horizon 2020 Research and Innovation Programme under Grant Agreement No. 856871.
Institutional Review Board Statement
The study was conducted in accordance with the Declaration of Helsinki and approved by the Research Ethics Committee of the Medical University of Varna “Prof. Dr. Paraskev Stoyanov” (Approval Code 142; 18 April 2024).
Informed Consent Statement
Written informed consent was obtained from all patients with AML or MDS with increased blasts before study participation and sample collection. Healthy-control plasma samples were obtained from a commercial biorepository in de-identified form in accordance with the supplier’s applicable donor-consent and ethical procedures.
Data Availability Statement
The data supporting the findings of this study are available from the corresponding author upon reasonable request. Individual-level clinical data are not publicly available because of ethical and privacy considerations related to human participant data.
Acknowledgments
During the preparation of this manuscript, the authors used ChatGPT (OpenAI) for the preparation of selected data visualisations. The authors reviewed and verified the generated output and take full responsibility for the content of the publication.
Conflicts of Interest
The authors declare no conflicts of interest.
References
- Holdenrieder, S.; Stieber, P.; Bodenmüller, H.; Busch, M.; von Pawel, J.; Schalhorn, A.; Nagel, D.; Seidel, D. Circulating nucleosomes in serum. Ann. N. Y. Acad. Sci. 2001, 945, 93–102. [Google Scholar] [CrossRef]
- Marsman, G.; Zeerleder, S.; Luken, B.M. Extracellular histones, cell-free DNA, or nucleosomes: differences in immunostimulation. Cell Death Dis. 2016, 7, e2518. [Google Scholar] [CrossRef]
- Allam, R.; Kumar, S.V.R.; Darisipudi, M.N.; Anders, H.-J. Extracellular histones in tissue injury and inflammation. J. Mol. Med. 2014, 92, 465–472. [Google Scholar] [CrossRef]
- Xu, J.; Zhang, X.; Pelayo, R.; Monestier, M.; Ammollo, C.T.; Semeraro, F.; Taylor, F.B.; Esmon, N.L.; Lupu, F.; Esmon, C.T. Extracellular histones are major mediators of death in sepsis. Nat. Med. 2009, 15, 1318–1321. [Google Scholar] [CrossRef]
- Abrams, S.T.; Zhang, N.; Manson, J.; Liu, T.; Dart, C.; Baluwa, F.; Wang, S.S.; Brohi, K.; Kipar, A.; Yu, W.; et al. Circulating histones are mediators of trauma-associated lung injury. Am. J. Respir. Crit. Care Med. 2013, 187, 160–169. [Google Scholar] [CrossRef]
- Tsoneva, D.K.; Ivanov, M.N.; Conev, N.V.; Manev, R.; Stoyanov, D.S.; Vinciguerra, M. Circulating histones to detect and monitor the progression of cancer. Int. J. Mol. Sci. 2023, 24, 942. [Google Scholar] [CrossRef]
- Semeraro, F.; Ammollo, C.T.; Morrissey, J.H.; Dale, G.L.; Friese, P.; Esmon, N.L.; Esmon, C.T. Extracellular histones promote thrombin generation through platelet-dependent mechanisms: involvement of platelet TLR2 and TLR4. Blood 2011, 118, 1952–1961. [Google Scholar] [CrossRef]
- Nicolaes, G.A.F.; Soehnlein, O. Targeting extranuclear histones to alleviate acute and chronic inflammation. Trends Pharmacol. Sci. 2024, 45, 651–662. [Google Scholar] [CrossRef]
- Yoo, H.J.; Lee, J.-S.; Kim, J.-E.; Gu, J.; Koh, Y.; Kim, I.; Kim, H.K. Extracellular histone released from leukemic cells increases their adhesion to endothelium and protects them from spontaneous and chemotherapy-induced leukemic cell death. PLoS ONE 2016, 11, e0163982. [Google Scholar] [CrossRef]
- Kim, T.Y.; Gu, J.-Y.; Jung, H.S.; Koh, Y.; Kim, I.; Kim, H.K. Elevated extracellular trap formation and contact system activation in acute leukemia. J. Thromb. Thrombolysis 2018, 46, 379–385. [Google Scholar] [CrossRef]
- Mueller, S.; Holdenrieder, S.; Stieber, P.; Haferlach, T.; Schalhorn, A.; Braess, J.; Nagel, D.; Seidel, D. Early prediction of therapy response in patients with acute myeloid leukemia by nucleosomal DNA fragments. BMC Cancer 2006, 6, 143. [Google Scholar] [CrossRef]
- Wang, D.; Rausch, C.; Buerger, S.A.; Tschuri, S.; Rothenberg-Thurley, M.; Schulz, M.; Hasenauer, J.; Ziemann, F.; Metzeler, K.H.; Marr, C. Modeling early treatment response in AML from cell-free tumor DNA. iScience 2023, 26, 108271. [Google Scholar] [CrossRef]
- Tsoneva, D.K.; Buzova, D.; Bianco, S.D.; Micheva, I.; Efraim, M.; Daskalova, N.; Resnick, I.; Teneva, M.; Chervenkov, T.; Conev, N.V.; et al. Histone-based liquid biopsy discriminates between myelodysplastic syndrome and solid malignancies. Clin. Epigenet. 2025, 17, 199. [Google Scholar] [CrossRef]
- Buschbeck, M.; Hake, S.B. Variants of core histones and their roles in cell fate decisions, development and cancer. Nat. Rev. Mol. Cell Biol. 2017, 18, 299–314. [Google Scholar] [CrossRef]
- Bereshchenko, O.; Lo Re, O.; Nikulenkov, F.; Flamini, S.; Kotaskova, J.; Mazza, T.; Le Pannérer, M.-M.; Buschbeck, M.; Giallongo, C.; Palumbo, G.; et al. Deficiency and haploinsufficiency of histone macroH2A1.1 in mice recapitulate hematopoietic defects of human myelodysplastic syndrome. Clin. Epigenet. 2019, 11, 121. [Google Scholar] [CrossRef]
- Wu, D.; Ingram, A.; Lahti, J.H.; Mazza, B.; Grenet, J.; Kapoor, A.; Liu, L.; Kidd, V.J.; Tang, D. Apoptotic release of histones from nucleosomes. J. Biol. Chem. 2002, 277, 12001–12008. [Google Scholar] [CrossRef]
- Napirei, M.; Wulf, S.; Mannherz, H.G. Chromatin breakdown during necrosis by serum Dnase1 and the plasminogen system. Arthritis Rheum. 2004, 50, 1873–1883. [Google Scholar] [CrossRef]
- Marsman, G.; von Richthofen, H.; Bulder, I.; Lupu, F.; Hazelzet, J.; Luken, B.M.; Zeerleder, S. DNA and factor VII-activating protease protect against the cytotoxicity of histones. Blood Adv. 2017, 1, 2491–2502. [Google Scholar] [CrossRef]
- Luger, K.; Mäder, A.W.; Richmond, R.K.; Sargent, D.F.; Richmond, T.J. Crystal structure of the nucleosome core particle at 2.8 Å resolution. Nature 1997, 389, 251–260. [Google Scholar] [CrossRef]
- Thiriet, C.; Hayes, J.J. Histone dynamics during transcription: exchange of H2A/H2B dimers and H3/H4 tetramers during pol II elongation. Results Probl. Cell Differ. 2006, 41, 77–90. [Google Scholar] [CrossRef]
- Giallongo, C.; Dulcamare, I.; Giallongo, S.; Duminuco, A.; Pieragostino, D.; Cufaro, M.C.; Amorini, A.M.; Lazzarino, G.; Romano, A.; Parrinello, N.; et al. MacroH2A1.1 as a crossroad between epigenetics, inflammation and metabolism of mesenchymal stromal cells in myelodysplastic syndromes. Cell Death Dis. 2023, 14, 686. [Google Scholar] [CrossRef]
- Parker, J.E.; Mufti, G.J.; Rasool, F.; Mijovic, A.; Devereux, S.; Pagliuca, A. The role of apoptosis, proliferation, and the Bcl-2-related proteins in the myelodysplastic syndromes and acute myeloid leukemia secondary to MDS. Blood 2000, 96, 3932–3938. [Google Scholar] [CrossRef]
- Basiorka, A.A.; McGraw, K.L.; Eksioglu, E.A.; Chen, X.; Johnson, J.; Zhang, L.; Zhang, Q.; Irvine, B.A.; Cluzeau, T.; Sallman, D.A.; et al. The NLRP3 inflammasome functions as a driver of the myelodysplastic syndrome phenotype. Blood 2016, 128, 2960–2975. [Google Scholar] [CrossRef]
- Ward, G.A.; McGraw, K.L.; Abbas-Aghababazadeh, F.; Meyer, B.S.; McLemore, A.F.; Vincelette, N.D.; Lam, N.B.; Aldrich, A.L.; Al Ali, N.H.; Padron, E.; et al. Oxidized mitochondrial DNA released after inflammasome activation is a disease biomarker for myelodysplastic syndromes. Blood Adv. 2021, 5, 2216–2228. [Google Scholar] [CrossRef]
- Khoury, J.D.; Solary, E.; Abla, O.; Akkari, Y.; Alaggio, R.; Apperley, J.F.; Bejar, R.; Berti, E.; Busque, L.; Chan, J.K.C.; et al. The 5th edition of the World Health Organization Classification of Haematolymphoid Tumours: Myeloid and Histiocytic/Dendritic Neoplasms. Leukemia 2022, 36, 1703–1719. [Google Scholar] [CrossRef]
- Döhner, H.; Wei, A.H.; Appelbaum, F.R.; Craddock, C.; DiNardo, C.D.; Dombret, H.; Ebert, B.L.; Fenaux, P.; Godley, L.A.; Hasserjian, R.P.; et al. Diagnosis and management of AML in adults: 2022 recommendations from an international expert panel on behalf of the ELN. Blood 2022, 140, 1345–1377. [Google Scholar] [CrossRef]
- Buzova, D.; Maugeri, A.; Liguori, A.; Napodano, C.; Lo Re, O.; Oben, J.; Alisi, A.; Gasbarrini, A.; Grieco, A.; Cerveny, J.; et al. Circulating histone signature of human lean metabolic-associated fatty liver disease (MAFLD). Clin. Epigenet. 2020, 12, 126. [Google Scholar] [CrossRef]
Figure 1.
Cross-sectional comparison of circulating histone measures between patients with newly diagnosed acute myeloid leukaemia and healthy controls. Blue symbols represent healthy controls (HC; n = 30), and orange symbols represent patients with acute myeloid leukaemia (AML; n = 15) at diagnosis. Symbols indicate group medians, and whiskers indicate interquartile ranges. The nine measures showing differences after Benjamini–Hochberg false-discovery-rate (FDR) correction are presented: (A) H2A, (B) H2B, (C) H3, (D) H4, (E) H2A/H2B, (F) H3/H4, (G) H2A/H2B/H3/H4, (H) macroH2A1.1 and (I) macroH2A1.2. Relative histone abundance is expressed as the percentage of corresponding histone-positive objects within the final gated population. Comparisons were performed using two-sided Mann–Whitney U tests, with Benjamini–Hochberg FDR correction across all 13 predefined histone measures. Adjusted p values are reported as q values above each panel; q < 0.05 was considered statistically significant. For H2A/H2B, both group medians were 0%, and the difference reflects the underlying distributions rather than different medians. Sample sizes are indicated below the group labels. Y-axis scales differ among panels. Complete statistics for all 13 measures are provided in Supplementary Table S1A.
Figure 1.
Cross-sectional comparison of circulating histone measures between patients with newly diagnosed acute myeloid leukaemia and healthy controls. Blue symbols represent healthy controls (HC; n = 30), and orange symbols represent patients with acute myeloid leukaemia (AML; n = 15) at diagnosis. Symbols indicate group medians, and whiskers indicate interquartile ranges. The nine measures showing differences after Benjamini–Hochberg false-discovery-rate (FDR) correction are presented: (A) H2A, (B) H2B, (C) H3, (D) H4, (E) H2A/H2B, (F) H3/H4, (G) H2A/H2B/H3/H4, (H) macroH2A1.1 and (I) macroH2A1.2. Relative histone abundance is expressed as the percentage of corresponding histone-positive objects within the final gated population. Comparisons were performed using two-sided Mann–Whitney U tests, with Benjamini–Hochberg FDR correction across all 13 predefined histone measures. Adjusted p values are reported as q values above each panel; q < 0.05 was considered statistically significant. For H2A/H2B, both group medians were 0%, and the difference reflects the underlying distributions rather than different medians. Sample sizes are indicated below the group labels. Y-axis scales differ among panels. Complete statistics for all 13 measures are provided in Supplementary Table S1A.
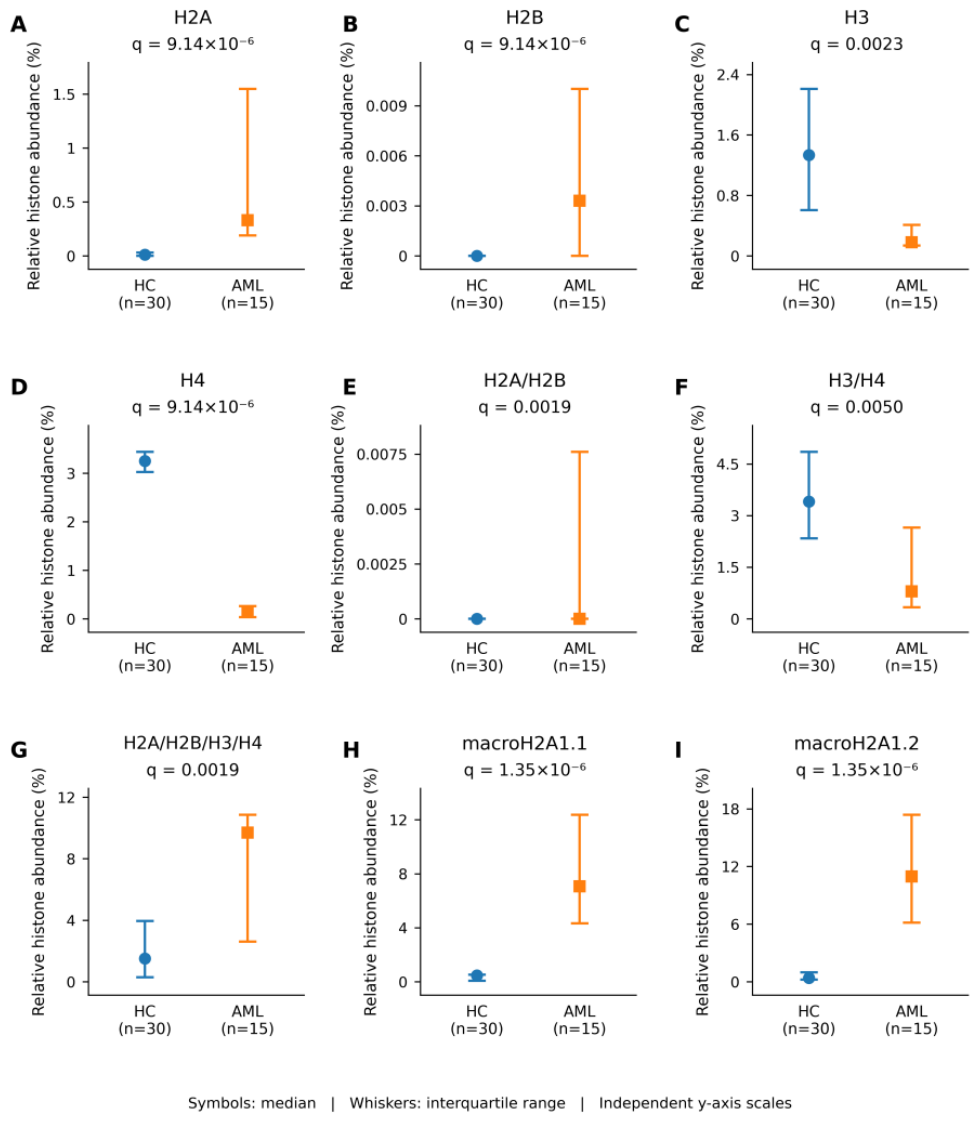
Figure 2.
Effect-size profile of early treatment-associated changes in circulating histone measures from diagnosis to day 7 in acute myeloid leukaemia. Paired rank-biserial effect sizes (r) are shown for changes from diagnosis (T0) to day 7 (T1) across the 13 predefined circulating histone measures in patients with paired samples (n = 10). Effect sizes were derived from two-sided exact Wilcoxon signed-rank tests. Negative r values indicate lower relative abundance at day 7 compared with diagnosis, whereas positive values indicate higher relative abundance. Squares denote measures remaining significant after Benjamini–Hochberg false-discovery-rate (FDR) correction across the 13 predefined measures (q < 0.05), whereas circles denote non-significant measures. Horizontal lines connect each effect estimate to the null value (r = 0) and do not represent confidence intervals. Corresponding FDR-adjusted q values are shown in the right-hand column. H4, H3/H4, H2A/H2B/H3/H4, macroH2A1.1/H2B/H3/H4 and macroH2A1.2/H2B/H3/H4 remained significant after FDR correction. T0, diagnosis; T1, day 7; FDR, false discovery rate.
Figure 2.
Effect-size profile of early treatment-associated changes in circulating histone measures from diagnosis to day 7 in acute myeloid leukaemia. Paired rank-biserial effect sizes (r) are shown for changes from diagnosis (T0) to day 7 (T1) across the 13 predefined circulating histone measures in patients with paired samples (n = 10). Effect sizes were derived from two-sided exact Wilcoxon signed-rank tests. Negative r values indicate lower relative abundance at day 7 compared with diagnosis, whereas positive values indicate higher relative abundance. Squares denote measures remaining significant after Benjamini–Hochberg false-discovery-rate (FDR) correction across the 13 predefined measures (q < 0.05), whereas circles denote non-significant measures. Horizontal lines connect each effect estimate to the null value (r = 0) and do not represent confidence intervals. Corresponding FDR-adjusted q values are shown in the right-hand column. H4, H3/H4, H2A/H2B/H3/H4, macroH2A1.1/H2B/H3/H4 and macroH2A1.2/H2B/H3/H4 remained significant after FDR correction. T0, diagnosis; T1, day 7; FDR, false discovery rate.
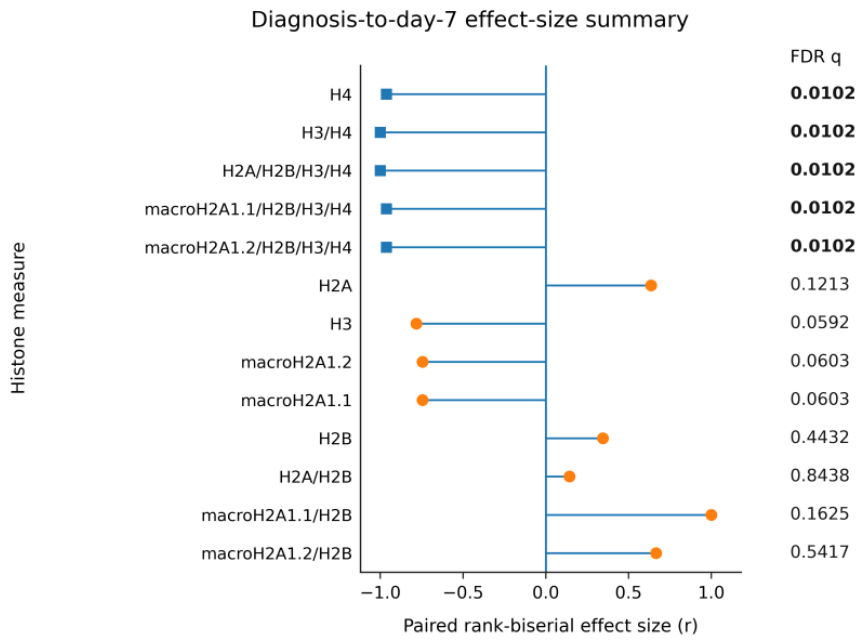
Figure 3.
Individual paired trajectories of circulating histone measures showing significant early treatment-associated changes in acute myeloid leukaemia. Individual trajectories from diagnosis (T0) to day 7 of treatment (T1) are shown for the five measures that remained significant after Benjamini–Hochberg false-discovery-rate (FDR) correction: (A) H4, (B) H3/H4, (C) H2A/H2B/H3/H4, (D) macroH2A1.1/H2B/H3/H4 and (E) macroH2A1.2/H2B/H3/H4. Each line connects paired measurements from the same patient (n = 10); line colours are used only to distinguish individual patients and do not denote clinical subgroups. Horizontal bars indicate the median at each time point. Histone measures are expressed as percentages of corresponding histone-positive objects within the final gated population. Paired comparisons were performed using two-sided exact Wilcoxon signed-rank tests with Benjamini–Hochberg FDR correction across the 13 predefined histone measures; adjusted q values are shown in each panel. All five displayed measures showed lower relative abundance at day 7 than at diagnosis. T0, diagnosis; T1, day 7; FDR, false discovery rate.
Figure 3.
Individual paired trajectories of circulating histone measures showing significant early treatment-associated changes in acute myeloid leukaemia. Individual trajectories from diagnosis (T0) to day 7 of treatment (T1) are shown for the five measures that remained significant after Benjamini–Hochberg false-discovery-rate (FDR) correction: (A) H4, (B) H3/H4, (C) H2A/H2B/H3/H4, (D) macroH2A1.1/H2B/H3/H4 and (E) macroH2A1.2/H2B/H3/H4. Each line connects paired measurements from the same patient (n = 10); line colours are used only to distinguish individual patients and do not denote clinical subgroups. Horizontal bars indicate the median at each time point. Histone measures are expressed as percentages of corresponding histone-positive objects within the final gated population. Paired comparisons were performed using two-sided exact Wilcoxon signed-rank tests with Benjamini–Hochberg FDR correction across the 13 predefined histone measures; adjusted q values are shown in each panel. All five displayed measures showed lower relative abundance at day 7 than at diagnosis. T0, diagnosis; T1, day 7; FDR, false discovery rate.
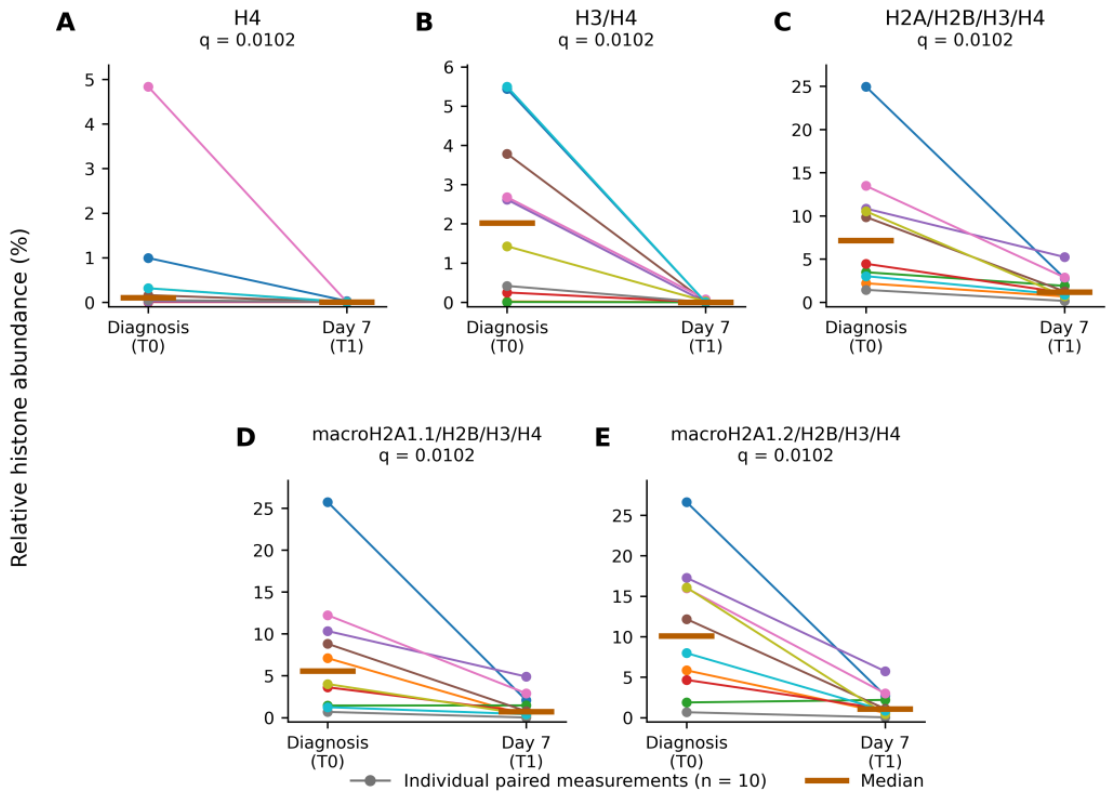
Figure 4.
Day-28 trajectories of circulating tetrameric histone complexes according to response status in acute myeloid leukaemia. Individual paired measurements from diagnosis (T0) to day 28 (T2) are shown for (A) H2A/H2B/H3/H4, (B) macroH2A1.1/H2B/H3/H4 and (C) macroH2A1.2/H2B/H3/H4. Each line connects paired measurements from the same patient. Blue solid lines with circles represent patients who achieved complete remission (n = 4), whereas orange dashed lines with squares represent patients with residual disease, defined here as residual bone-marrow blasts >5% (n = 2). Values represent relative histone abundance (%). All three tetrameric complexes decreased from diagnosis to day 28 in each patient achieving complete remission and increased in both patients with residual disease. Between-group comparisons of individual T2 − T0 changes were performed using two-sided exact Mann–Whitney U tests (U = 0; p = 0.133 for each complex). The association between response status and direction of change was assessed using a two-sided Fisher’s exact test (p = 0.067). T0, diagnosis; T2, day 28.
Figure 4.
Day-28 trajectories of circulating tetrameric histone complexes according to response status in acute myeloid leukaemia. Individual paired measurements from diagnosis (T0) to day 28 (T2) are shown for (A) H2A/H2B/H3/H4, (B) macroH2A1.1/H2B/H3/H4 and (C) macroH2A1.2/H2B/H3/H4. Each line connects paired measurements from the same patient. Blue solid lines with circles represent patients who achieved complete remission (n = 4), whereas orange dashed lines with squares represent patients with residual disease, defined here as residual bone-marrow blasts >5% (n = 2). Values represent relative histone abundance (%). All three tetrameric complexes decreased from diagnosis to day 28 in each patient achieving complete remission and increased in both patients with residual disease. Between-group comparisons of individual T2 − T0 changes were performed using two-sided exact Mann–Whitney U tests (U = 0; p = 0.133 for each complex). The association between response status and direction of change was assessed using a two-sided Fisher’s exact test (p = 0.067). T0, diagnosis; T2, day 28.
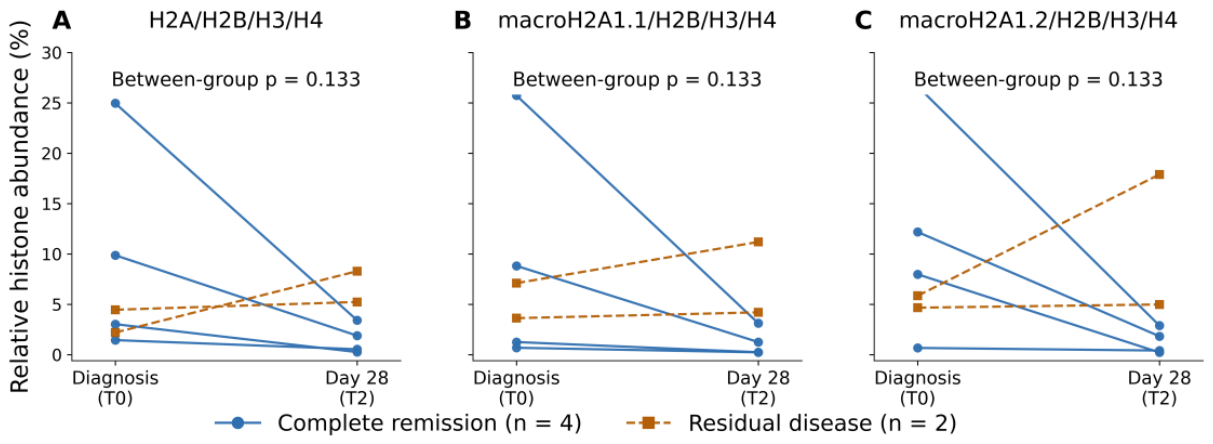
Figure 5.
Cross-sectional differences in circulating histone measures among healthy controls, patients with myelodysplastic neoplasms with increased blasts (MDS-IB), and patients with newly diagnosed acute myeloid leukaemia (AML). Median relative abundances (symbols) and interquartile ranges (whiskers) are shown for the ten histone measures reaching FDR-adjusted significance in at least one MDS-IB-related pairwise comparison: (A) H2A, (B) H2B, (C) H3, (D) H4, (E) H3/H4, (F) H2A/H2B/H3/H4, (G) macroH2A1.1, (H) macroH2A1.2, (I) macroH2A1.1/H2B/H3/H4 and (J) macroH2A1.2/H2B/H3/H4. Histone measures are expressed as percentages of corresponding histone-positive objects within the final gated population. Pairwise comparisons were performed using two-sided Mann–Whitney U tests, with Benjamini–Hochberg false-discovery-rate (FDR) correction applied separately across the 13 predefined histone measures for each comparison. Red brackets indicate significant differences between healthy controls (HC) and MDS-IB, whereas purple brackets indicate significant differences between MDS-IB and AML; corresponding FDR-adjusted q values are shown above the brackets. Only pairwise comparisons with q < 0.05 are displayed. HC n = 30, MDS-IB n = 12, and AML n = 15. Y-axis scales differ among panels. Complete pairwise statistics are provided in Supplementary Table S1B and S1C.
Figure 5.
Cross-sectional differences in circulating histone measures among healthy controls, patients with myelodysplastic neoplasms with increased blasts (MDS-IB), and patients with newly diagnosed acute myeloid leukaemia (AML). Median relative abundances (symbols) and interquartile ranges (whiskers) are shown for the ten histone measures reaching FDR-adjusted significance in at least one MDS-IB-related pairwise comparison: (A) H2A, (B) H2B, (C) H3, (D) H4, (E) H3/H4, (F) H2A/H2B/H3/H4, (G) macroH2A1.1, (H) macroH2A1.2, (I) macroH2A1.1/H2B/H3/H4 and (J) macroH2A1.2/H2B/H3/H4. Histone measures are expressed as percentages of corresponding histone-positive objects within the final gated population. Pairwise comparisons were performed using two-sided Mann–Whitney U tests, with Benjamini–Hochberg false-discovery-rate (FDR) correction applied separately across the 13 predefined histone measures for each comparison. Red brackets indicate significant differences between healthy controls (HC) and MDS-IB, whereas purple brackets indicate significant differences between MDS-IB and AML; corresponding FDR-adjusted q values are shown above the brackets. Only pairwise comparisons with q < 0.05 are displayed. HC n = 30, MDS-IB n = 12, and AML n = 15. Y-axis scales differ among panels. Complete pairwise statistics are provided in Supplementary Table S1B and S1C.
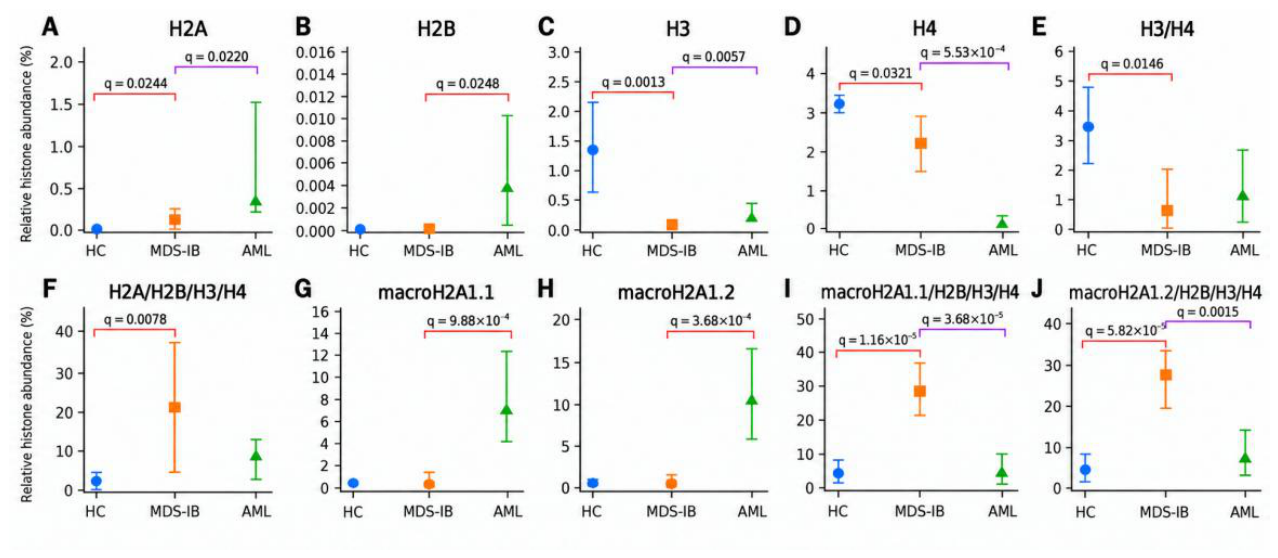
Figure 6.
Principal component analysis of circulating histone profiles across healthy controls, patients with myelodysplastic neoplasms with increased blasts (MDS-IB), and patients with newly diagnosed acute myeloid leukaemia (AML). (A) PCA score plot based on 13 circulating histone measures in 57 cross-sectional samples (healthy controls, n = 30; MDS-IB, n = 12; AML at diagnosis, n = 15). PC1 and PC2 explained 35.7% and 24.8% of the total variance, respectively. (B) Loading plot showing the contribution of individual histone measures to PC1 and PC2. Arrows indicate the direction and magnitude of the corresponding loadings.
Figure 6.
Principal component analysis of circulating histone profiles across healthy controls, patients with myelodysplastic neoplasms with increased blasts (MDS-IB), and patients with newly diagnosed acute myeloid leukaemia (AML). (A) PCA score plot based on 13 circulating histone measures in 57 cross-sectional samples (healthy controls, n = 30; MDS-IB, n = 12; AML at diagnosis, n = 15). PC1 and PC2 explained 35.7% and 24.8% of the total variance, respectively. (B) Loading plot showing the contribution of individual histone measures to PC1 and PC2. Arrows indicate the direction and magnitude of the corresponding loadings.
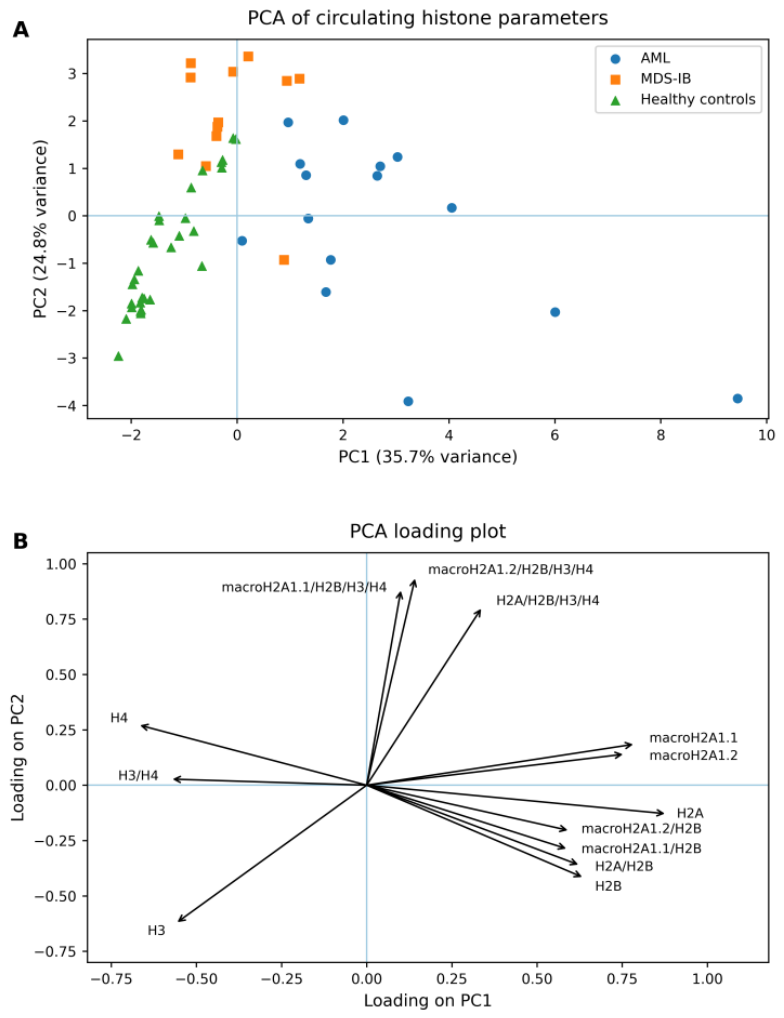

Table 1.
Baseline demographic and disease characteristics of the study groups. Data are presented as median (interquartile range [IQR]) or n (%), as appropriate. An em dash (—) indicates not applicable. AML, acute myeloid leukaemia; MDS, myelodysplastic neoplasm; MDS with increased blasts (MDS-IB); ELN, European LeukemiaNet; IPSS-R, Revised International Prognostic Scoring System; WHO, World Health Organization.
Table 1.
Baseline demographic and disease characteristics of the study groups. Data are presented as median (interquartile range [IQR]) or n (%), as appropriate. An em dash (—) indicates not applicable. AML, acute myeloid leukaemia; MDS, myelodysplastic neoplasm; MDS with increased blasts (MDS-IB); ELN, European LeukemiaNet; IPSS-R, Revised International Prognostic Scoring System; WHO, World Health Organization.
| Characteristic | AML (n = 15) | MDS with increased blasts (n = 12) | Healthy controls (n = 30) |
|---|---|---|---|
| Age, years, median (IQR) | 49 (41.5–66.5) | 70.5 (62.5–72.8) | 61.5 (54.25–71.25) |
| Male sex, n (%) | 9 (60.0) | 8 (66.7) | 18 (60.0) |
| 2022 WHO MDS subtype, n (%) | — | — | |
| MDS-IB1 | — | 3 (25.0) | — |
| MDS-IB2 | — | 9 (75.0) | — |
| 2022 ELN risk classification, n (%) | — | — | |
| Favourable | 1 (6.7) | — | — |
| Intermediate | 7 (46.7) | — | — |
| Adverse | 7 (46.7) | — | — |
| IPSS-R risk, n (%) | — | — | |
| Intermediate | — | 2 (16.7) | — |
| High | — | 7 (58.3) | — |
| Very high | — | 3 (25.0) | — |
| First-line AML treatment, n (%) | — | — | |
| 7+3 | 10 (66.7) | — | — |
| Azacitidine + venetoclax | 5 (33.3) | — | — |
Disclaimer/Publisher’s Note: The statements, opinions and data contained in all publications are solely those of the individual author(s) and contributor(s) and not of MDPI and/or the editor(s). MDPI and/or the editor(s) disclaim responsibility for any injury to people or property resulting from any ideas, methods, instructions or products referred to in the content. |
© 2026 by the authors. Licensee MDPI, Basel, Switzerland. This article is an open access article distributed under the terms and conditions of the Creative Commons Attribution (CC BY) license.
Copyright: This open access article is published under a Creative Commons CC BY 4.0 license, which permit the free download, distribution, and reuse, provided that the author and preprint are cited in any reuse.