

Submitted:
23 October 2026
Posted:
26 October 2026
You are already at the latest version
Abstract
Pooled multi-site surveys mix several reasons a predictor can be absent: a jurisdiction did not ask the item, the item was not on that year’s questionnaire, or a student did not answer. Prediction models usually treat all of these as one missing value. Here, we use the CDC Youth Risk Behavior Survey combined high-school data, 2015–2023 (1,008,297 records; 250 site-year surveys), and code each predictor cell by provenance using only what the released data identify. Ten models predicted past-year suicide attempt (684,688 students) and injurious suicide attempt (504,707 students) from 15 behavioural items and demographics, comparing conventional handling (complete-case analysis, mean imputation, missing indicators, chained-equations imputation and gradient boosting) with provenance-aware indicators and pattern submodels. Evaluation used held-out school clusters, survey weights and a cluster bootstrap, and a structure-only model and 12 sensitivity analyses tested whether gains reflected survey recognition. Weighted prevalence was 8.8–10.7% for any attempt and 3.1–3.4% for injurious attempt. Most absent predictor cells came from surveys not asking the item (10.5% of all cells) rather than missingness where asked (3.5%). Provenance-split indicators improved AUROC over a single missing indicator by 0.0037 (95% CI 0.0019–0.0057) for any attempt and 0.0057 (0.0023–0.0090) for injurious attempt; the best model reached 0.853 and 0.849, whereas a site-year-and-pattern-only model reached 0.55. The gain disappeared in the national survey, where sites do not omit items, and grew when whole jurisdictions were held out (0.0054 and 0.0104). In a contrasting adult test bed built from BRFSS 2023 adverse childhood experience items, provenance handling made no difference. Distinguishing “not asked” from “not answered” gives small, consistent and transportable gains in pooled youth-survey prediction that are not explained by survey recognition, and pooled-survey analyses should code the source of absence.
Keywords:
missing data
; survey methodology
; Youth Risk Behavior Survey
; suicide attempt
; prediction models
; adolescent health
; public health surveillance
1. Introduction
The Youth Risk Behavior Surveillance System (YRBSS) is the main U.S. source of school-based data on adolescent suicidal behavior. CDC’s combined high-school data set pools the national survey with state and large urban district surveys so that multi-site, multi-year analyses are possible [1].
In the pooled file, a blank predictor can mean different things. A jurisdiction may have dropped the question from its questionnaire. The question may not have been on that year’s standard questionnaire. The student may have skipped it, or CDC may have set an inconsistent answer to missing. CDC states that, at the individual level, these mechanisms cannot be separated in the released data [2]. The 2023 move to tablet administration added skip patterns, but legitimately skipped questions are coded to their implied response rather than left missing [2].
Prediction studies usually treat every blank as one kind of missing value. In a pooled file this has two risks. A model can lose information that differs by source of absence. It can also learn which survey a student came from, because survey content and outcome prevalence both vary by site and year. Work on missing data for prediction shows that the right handling depends on what is available at deployment [3,4], and pattern-based models can avoid imputing values that were never collected [5].
Machine-learning prediction of adolescent suicide attempts from school-based risk-behaviour surveys is established, much of it in the Korea Youth Risk Behavior Survey [6,7]. Nonresponse has also been studied as an outcome in its own right in YRBS, for the suicide-attempt item [8] and the sexual identity item [9]. We did not find work that separates survey-level omission from student-level nonresponse when building prediction models from the pooled YRBS file.
We asked three questions using 2015–2023 YRBS data: (i) how absent predictor information is distributed across sources that the released data can identify; (ii) whether provenance-aware handling changes discrimination and calibration for predicting past-year suicide attempt and injurious suicide attempt, compared with conventional handling; and (iii) whether any gain is explained by survey structure (site and year) rather than student-level information. The Behavioral Risk Factor Surveillance System (BRFSS) adverse childhood experiences (ACE) module served as a contrasting adult test bed, where state participation, questionnaire versions and in-module breakoff create different kinds of absence.
2. Results
2.1. Cohort and Outcome Prevalence
All five cycles from 2015 to 2023 met the pre-stated availability rules (Section 4.1). The primary cohorts held 684,688 students in 235 surveys (any attempt) and 504,707 students in 211 surveys (injurious attempt; Table 1). In state and district surveys, weighted prevalence of any past-year suicide attempt ranged from 8.8% (2015) to 10.7% (2021). Injurious attempt ranged from 3.1% (2019) to 3.4% (2021), about one student in 30 (Supplementary Table S2). In the national survey, 2023 weighted prevalence of any attempt was 9.5% (95% CI 8.4–10.6%), matching CDC’s published estimate.
2.2. Where Predictor Information Was Absent
Across the 15 predictors, 82.0% of cells were observed. Not asked by the survey was the largest absent class (10.5% of cells), followed by unresolved missingness where asked (3.5%), structurally not applicable (2.5%, all from dating violence) and not on the year’s questionnaire (1.5%, all from prescription pain medicine in early cycles) (Figure 1; Supplementary Table S1). Site omission was all-or-nothing: no item was between 95% and 99.99% missing in any survey, so the 95% sensitivity rule labelled the same cells as the primary rule.
Complete-case analysis was therefore impractical. Only 8.6% of test-set students in the any-attempt cohort, and 11.4% in the injurious cohort, had all 15 items observed.
2.3. Primary Comparison
Test sets held 136,298 students (any attempt) and 99,003 students (injurious attempt). Table 2 and Figure 2 show survey-weighted performance.
All four pre-specified contrasts favoured the provenance- or structure-aware model for any attempt. AUROC differences were PROV_LR vs MIND_LR +0.0037 (95% CI +0.0019 to +0.0057), PATTERN_LR vs MEAN_LR +0.0027 (+0.0015 to +0.0040), PROV_HGB vs HGB_NATIVE +0.0039 (+0.0024 to +0.0053) and PROV_LR vs MICE_LR +0.0057 (+0.0030 to +0.0085). For injurious attempt the corresponding differences were +0.0057 (+0.0023 to +0.0090), +0.0003 (−0.0021 to +0.0024), +0.0076 (+0.0034 to +0.0117) and +0.0156 (+0.0097 to +0.0223).
Calibration slopes for the imputation, indicator, provenance and boosting models were close to 1 (0.96–1.04; Table 3, Figure 3). For injurious attempt, calibration intercepts were negative for most models (for example −0.091 for MIND_LR and −0.074 for PROV_LR), indicating slight overprediction in the weighted population.
2.4. Survey Structure Versus Student Information
A model using only site, year and which questions the survey asked reached AUROC 0.552 (any attempt) and 0.557 (injurious), below demographics alone. Provenance-aware gains therefore did not come from recognising surveys. Three sensitivity analyses sharpen this (Figure 4; Supplementary Table S3 and Table S4):
- National survey only, where site omission does not occur: the PROV_LR vs MIND_LR gain disappeared for any attempt (−0.0004, −0.0033 to +0.0018).
- Whole jurisdictions held out: the gain was larger, +0.0054 (+0.0022 to +0.0086) for any attempt and +0.0104 (+0.0032 to +0.0178) for injurious attempt.
- Site and year fixed effects added: the any-attempt gain held (+0.0035), but the injurious gain shrank to +0.0018 (−0.0021 to +0.0054), so part of the injurious advantage tracks survey structure.
2.5. Other Sensitivity Analyses
Excluding 2021, excluding 2023, dropping items not asked in over 30% of surveys and weighted training all left the direction and size of the provenance contrasts similar. In 2023 alone, the PROV_LR vs MIND_LR difference for injurious attempt was negative (−0.0049, −0.0087 to −0.0011), and excluding 2021 widened the injurious interval to include zero (+0.0066, −0.0007 to +0.0125). Adding ideation and planning raised AUROC to 0.905–0.922 for any attempt and the provenance contrasts stayed positive. Every survey in the window carried a weight, so the planned “include unweighted surveys” scenario was identical to the primary analysis.
2.6. Subgroups
Discrimination was lower for students identifying as gay or lesbian (PROV_LR AUROC 0.780, 0.739–0.838) or questioning (0.761, 0.696–0.823) than heterosexual students (0.851, 0.825–0.874) for any attempt. It was also lower for Native Hawaiian or other Pacific Islander students (0.779, 0.703–0.851) and Black students (0.802, 0.776–0.834) than White students (0.862, 0.851–0.874) (Supplementary Table S5). Sexual identity was not asked in every survey, so these subgroups come from a subset of sites.
2.7. BRFSS Contrasting Test Bed
The BRFSS cohort held 430,736 adults; weighted prevalence of ever-diagnosed depressive disorder was 20.2% (19.9–20.4%). ACE items were absent for 76.9% of respondents because their state did not field the module, 7.1% because their state fielded it only on a split questionnaire version they did not receive (Ohio and Maryland), and 3.1% who were in module states but answered no ACE item. Don’t-know or refused answers were 0.2–0.4% per item and in-module breakoff 0.02–0.14%. Provenance handling made almost no difference: within-state AUROC was 0.683 for MIND_LR and 0.684 for PROV_LR, and leave-states-out AUROC was 0.709 for both (Supplementary Table S6). Indiana is listed by CDC as using the module, but none of the four public 2023 files (main and versions 1–3) holds Indiana ACE responses.
3. Discussion
In about one million YRBS records, most absent predictor information came from surveys that did not ask an item, not from students who skipped it. Encoding why a value is absent gave small but consistent gains over pooling all absences into one missing indicator: about 0.004 AUROC for any attempt and 0.006 for injurious attempt. The gains are modest in size. Their pattern matters more than their magnitude.
Three checks point to student-relevant information rather than survey recognition. A model using only site, year and which questions were asked barely beat chance. The gain disappeared in the national survey, where site omission does not occur. And the gain grew, rather than shrank, when whole jurisdictions were held out. This last result ran against our pre-stated hypothesis. A plausible explanation is that a single pooled indicator mixes “this survey never asks” with “this student skipped”, so its coefficient transfers poorly to a jurisdiction with a different questionnaire; separating them keeps the student-level signal from being diluted by survey design. For injurious attempt, adding site and year fixed effects removed most of the gain, so for the rarer outcome some of the advantage does track survey structure.
Multiple imputation did not help. MICE was no better than mean imputation with missing indicators (AUROC 0.841 vs 0.843 for any attempt; 0.828 vs 0.838 for injurious attempt). Imputing an item a survey never asked borrows information from other surveys and discards the fact that it was not asked. Complete-case analysis is not a realistic option in pooled YRBS data: it scored fewer than one student in eight.
At public-health screening thresholds, positive predictive values were low: at 80% sensitivity about one in four flagged students had attempted suicide, and about one in 12 to 14 had an injurious attempt. Provenance handling moved these by less than one percentage point. These models are better suited to surveillance and to studying risk structure than to identifying individual students. Discrimination was also lower for gay or lesbian, questioning, Native Hawaiian or Pacific Islander and Black students, which deserves attention before any applied use.
The BRFSS contrast was instructive in the other direction. Most absent ACE data there came from whole states not fielding the module, and provenance handling added nothing for predicting depression. Encoding provenance helps when the absence mechanism varies within the modelling population and relates to the outcome; it is not a general fix.
This study has limitations. Item nonresponse, CDC edits to missing and (in national data) students who received a site questionnaire are pooled as one class, and questionnaires removed by CDC quality control are not in the release. Electronic versus paper administration can be identified only for the national survey, so mode effects on missingness were not tested at site level. Bootstrap intervals hold the fitted model fixed and do not include model-fitting variability; seed-repetition runs are planned. Bootstrap strata were collapsed to the survey level after the first run showed most design strata had one test PSU (point estimates were unaffected). Sensitivity scenarios share the primary test sets, so they are not independent replications. Four predictors matched more than one CDC variable; the choices are documented in the code release. Associations are not causal, and suicide attempts are self-reported. A branching, structure-preserving method developed with W. Merchant was not evaluated here.
In pooled YRBS data, telling apart “not asked” from “skipped” improves suicide-attempt prediction slightly, holds up when whole jurisdictions are held out, and is not explained by recognising surveys. Analysts pooling multi-site surveys should code the source of absence rather than treat every blank alike.
4. Methods
The analysis protocol, hypotheses and decision log were written before any test-set scoring; the one post hoc change is reported in Section 4.7. Reporting follows the TRIPOD+AI statement where it applies [10].
4.1. Data
We used the CDC YRBS 2023 combined high-school data set (1991–2023 release), restricted to 2015–2023 by pre-stated availability rules: each outcome asked in at least half of a year’s surveys, and at least 80% of predictor concepts on that year’s questionnaire. The file held 1,008,297 student records from 250 site-year surveys. The primary population was state and district surveys. The national survey was analysed separately and never pooled with site surveys in a model, because the two represent different target populations.
4.2. Outcomes
Any past-year suicide attempt was one or more attempts in the past 12 months (Q29; CDC QN29 definition). Injurious suicide attempt was an attempt resulting in injury, poisoning or overdose treated by a doctor or nurse, among all respondents including those who did not attempt (Q30; CDC QN30 definition). Records with a missing outcome, or from surveys that did not ask the outcome item, were excluded (Table 1).
4.3. Predictors
Fifteen CDC dichotomous indicators covered sadness or hopelessness, bullying at school and online, physical fighting, carrying a weapon at school, forced sex, physical dating violence, skipping school for safety, current alcohol, marijuana, vaping and cigarette use, prescription pain medicine misuse, sleep and grades (Supplementary Table S1). Variables were matched to concepts from CDC’s SAS labels. Demographics (age, sex, grade, race and ethnicity, sexual identity) entered with an explicit missing level. Suicidal ideation and planning were excluded from primary models as same-construct items. Site and year identifiers were excluded from individual-level models.
4.4. Missingness Provenance
Each predictor cell received exactly one code, restricted to what the released data can identify (Table 4). Skip-implied values were treated as observed, in line with CDC coding. Quality-control exclusions are not visible in the release and are a selection limitation.
4.5. Comparators
Ten models were compared (Table 5). All preprocessing was fit on training rows only. Hyperparameters were fixed in advance (logistic: L2, C = 1; boosting: learning rate 0.05, up to 500 iterations with early stopping, 31 leaves, at least 50 samples per leaf). The pre-specified primary contrasts were PROV_LR vs MIND_LR, PATTERN_LR vs MEAN_LR, PROV_HGB vs HGB_NATIVE and PROV_LR vs MICE_LR.
4.6. Splits
Within each site-year survey, primary sampling units (PSUs) were assigned 60/20/20 to training, validation and test sets with a fixed seed, so no school cluster spans training and test. Splits were hashed and frozen. For any attempt this gave 411,571 training, 136,819 validation and 136,298 test records; for injurious attempt, 305,003, 100,701 and 99,003. Alternative structures held out whole jurisdictions (leave-sites-out) or the latest cycle (temporal).
4.7. Survey Design and Evaluation
Prevalence was estimated with survey weights and Taylor-linearized standard errors, with strata and PSUs made unique per site-year. Models were trained unweighted; because evidence on weighting in gradient boosting is mixed [11], weighted training was a sensitivity analysis. Performance was estimated on the test set both unweighted and survey-weighted; weighted results are reported unless stated.
Metrics were AUROC, PR-AUC, Brier score, calibration intercept and slope, and sensitivity, specificity, PPV and NPV at three thresholds chosen on the validation set (80% sensitivity; top 10% and top 5% of predicted risk). Subgroups were reported when they had at least 30 events.
Confidence intervals came from a bootstrap that resampled PSUs with replacement within each site-year survey, with the fitted model held fixed (1,000 replicates for every analysis). Method contrasts used paired draws. Post hoc change: the protocol specified the surveys’ own design strata. After the first run, 1,874 of 2,908 design strata (64%) held a single test-set PSU, which contributes no bootstrap variance. We therefore resampled within whole surveys (1 of 235 surveys had a single test PSU). This is conservative and leaves point estimates unchanged.
4.8. Sensitivity Analyses
Twelve pre-specified scenarios were run for both outcomes: leave-sites-out; temporal; national survey only; excluding 2021; excluding 2023; 2023 only; dropping items not asked in more than 30% of surveys; a 95% threshold for “not asked”; adding ideation and planning; adding site and year fixed effects; weighted training; and including unweighted surveys.
4.9. BRFSS Test Bed
We used the 2023 BRFSS main file and questionnaire versions 1–3 [13]. The outcome was ever being told of a depressive disorder (ADDEPEV3). Predictors were the 11 ACE items, whose module nonresponse has been described previously [12]. Provenance codes were: state did not field the module; module fielded only on a version this respondent did not receive; breakoff within the module; other blank; don’t know or refused; and “parents not married” (observed, not applicable). Models were evaluated within states and leaving states out.
4.10. Software
Analyses used Python with pandas, NumPy and scikit-learn. Fixed-width files were read with layouts parsed from CDC’s SAS input programs. The full pipeline ran on a laptop; scripts for a Slurm cluster are included in the code release.
Supplementary Materials
The following supporting information can be downloaded at the website of this paper posted on Preprints.org.
Funding
This work received no specific grant from any funding agency.
Institutional Review Board Statement
This study used only de-identified, publicly available data (CDC YRBS and BRFSS public-use files) and therefore does not meet the definition of human subjects research under 45 CFR 46.102. It was not submitted for institutional review board review. No attempt was made to identify any individual.
Data Availability Statement
YRBS combined high-school data (2023 release) and BRFSS 2023 are public-use files from CDC (https://www.cdc.gov/yrbs/data/index.html; https://www.cdc.gov/brfss/annual_data/annual_2023.html). No restricted data were used. Analysis code, frozen split hashes, aggregate results and figures are available at https://github.com/SelormB/p2-yrbs-provenance under the MIT license.
Acknowledgments
The author conceived the study and made its design decisions (outcomes, predictor set, provenance taxonomy, comparators and split design). An AI assistant (Claude, Anthropic) wrote the pipeline code, ran the analyses, and drafted this manuscript, including its text, figures and tables. Every number in the manuscript is generated from the released pipeline outputs.
Conflicts of Interest
None declared.
References
- Centers for Disease Control and Prevention. 2023 YRBS National, State, and District Combined Datasets User’s Guide; CDC: Atlanta, 2024. [Google Scholar]
- Brener, Nancy D; Mpofu, Jonetta J; Krause, Kathleen H; et al. Overview and methods for the Youth Risk Behavior Surveillance System — United States, 2023. MMWR Suppl. 2024, 73(4), 1–12. [Google Scholar] [CrossRef]
- Sperrin, Matthew; Martin, Glen P; Sisk, Rose; Peek, Niels. Missing data should be handled differently for prediction than for description or causal explanation. J. Clin. Epidemiol. 2020, 125, 183–187. [Google Scholar] [CrossRef]
- Sisk, Rose; Sperrin, Matthew; Peek, Niels; van Smeden, Maarten; Martin, Glen P. Imputation and missing indicators for handling missing data in the development and deployment of clinical prediction models: a simulation study. Stat. Methods Med. Res. 2023. [Google Scholar] [CrossRef]
- Mercaldo, Sarah Fletcher; Blume, Jeffrey D. Missing data and prediction: the pattern submodel. Biostatistics 2020, 21(2), 236–252. [Google Scholar] [CrossRef]
- Jung, Jun Su; et al. Prediction models for high risk of suicide in Korean adolescents using machine learning techniques. PLoS ONE 2019, 31170212. [Google Scholar]
- Lim, Jae Seok; et al. Prediction models for suicide attempts among adolescents using machine learning techniques. Clin. Psychopharmacol. Neurosci. 2022, 36263637. [Google Scholar] [CrossRef]
- Baiden, Philip; et al. Racial/ethnic differences in adolescents’ non-response to suicide attempt: findings from the Youth Risk Behavior Survey. J. Psychiatr. Res. 2023. [Google Scholar] [CrossRef] [PubMed]
- He, Y.; et al. Predicting nonresponse to sexual identity question in youth risk behavior surveillance: a machine learning analysis of complex survey data. Ann. Epidemiol. 2026, 41621502. [Google Scholar] [CrossRef]
- Collins, Gary S; Moons, Karel G M; Dhiman, Paula; et al. TRIPOD+AI statement: updated guidance for reporting clinical prediction models that use regression or machine learning methods. BMJ 2024, 385, e078378. [Google Scholar] [CrossRef]
- MacNell, Nathaniel; Feinstein, Lydia; Wilkerson, Jesse; et al. Implementing machine learning methods with complex survey data: lessons learned on the impacts of accounting sampling weights in gradient boosting. PLoS ONE 2023, 18(1), e0280387. [Google Scholar] [CrossRef]
- Besera, Ghenet; Annor, Francis B; Swedo, Elizabeth A; Aslam, Maria V; Massetti, Greta M. Adverse childhood experiences module nonresponse: Behavioral Risk Factor Surveillance System, 2019 and 2021. Am. J. Prev. Med. 2024, 67(6), 941–950. [Google Scholar] [CrossRef]
- Centers for Disease Control and Prevention. Behavioral Risk Factor Surveillance System 2023 Survey Data and Documentation; CDC: Atlanta, 2024. [Google Scholar]
Figure 1.
Share of student records with each predictor absent, by provenance, across all 1,008,297 records from 2015–2023 (national, state and district surveys). Most absence comes from surveys that did not ask the item, not from students who skipped it.
Figure 1.
Share of student records with each predictor absent, by provenance, across all 1,008,297 records from 2015–2023 (national, state and district surveys). Most absence comes from surveys that did not ask the item, not from students who skipped it.
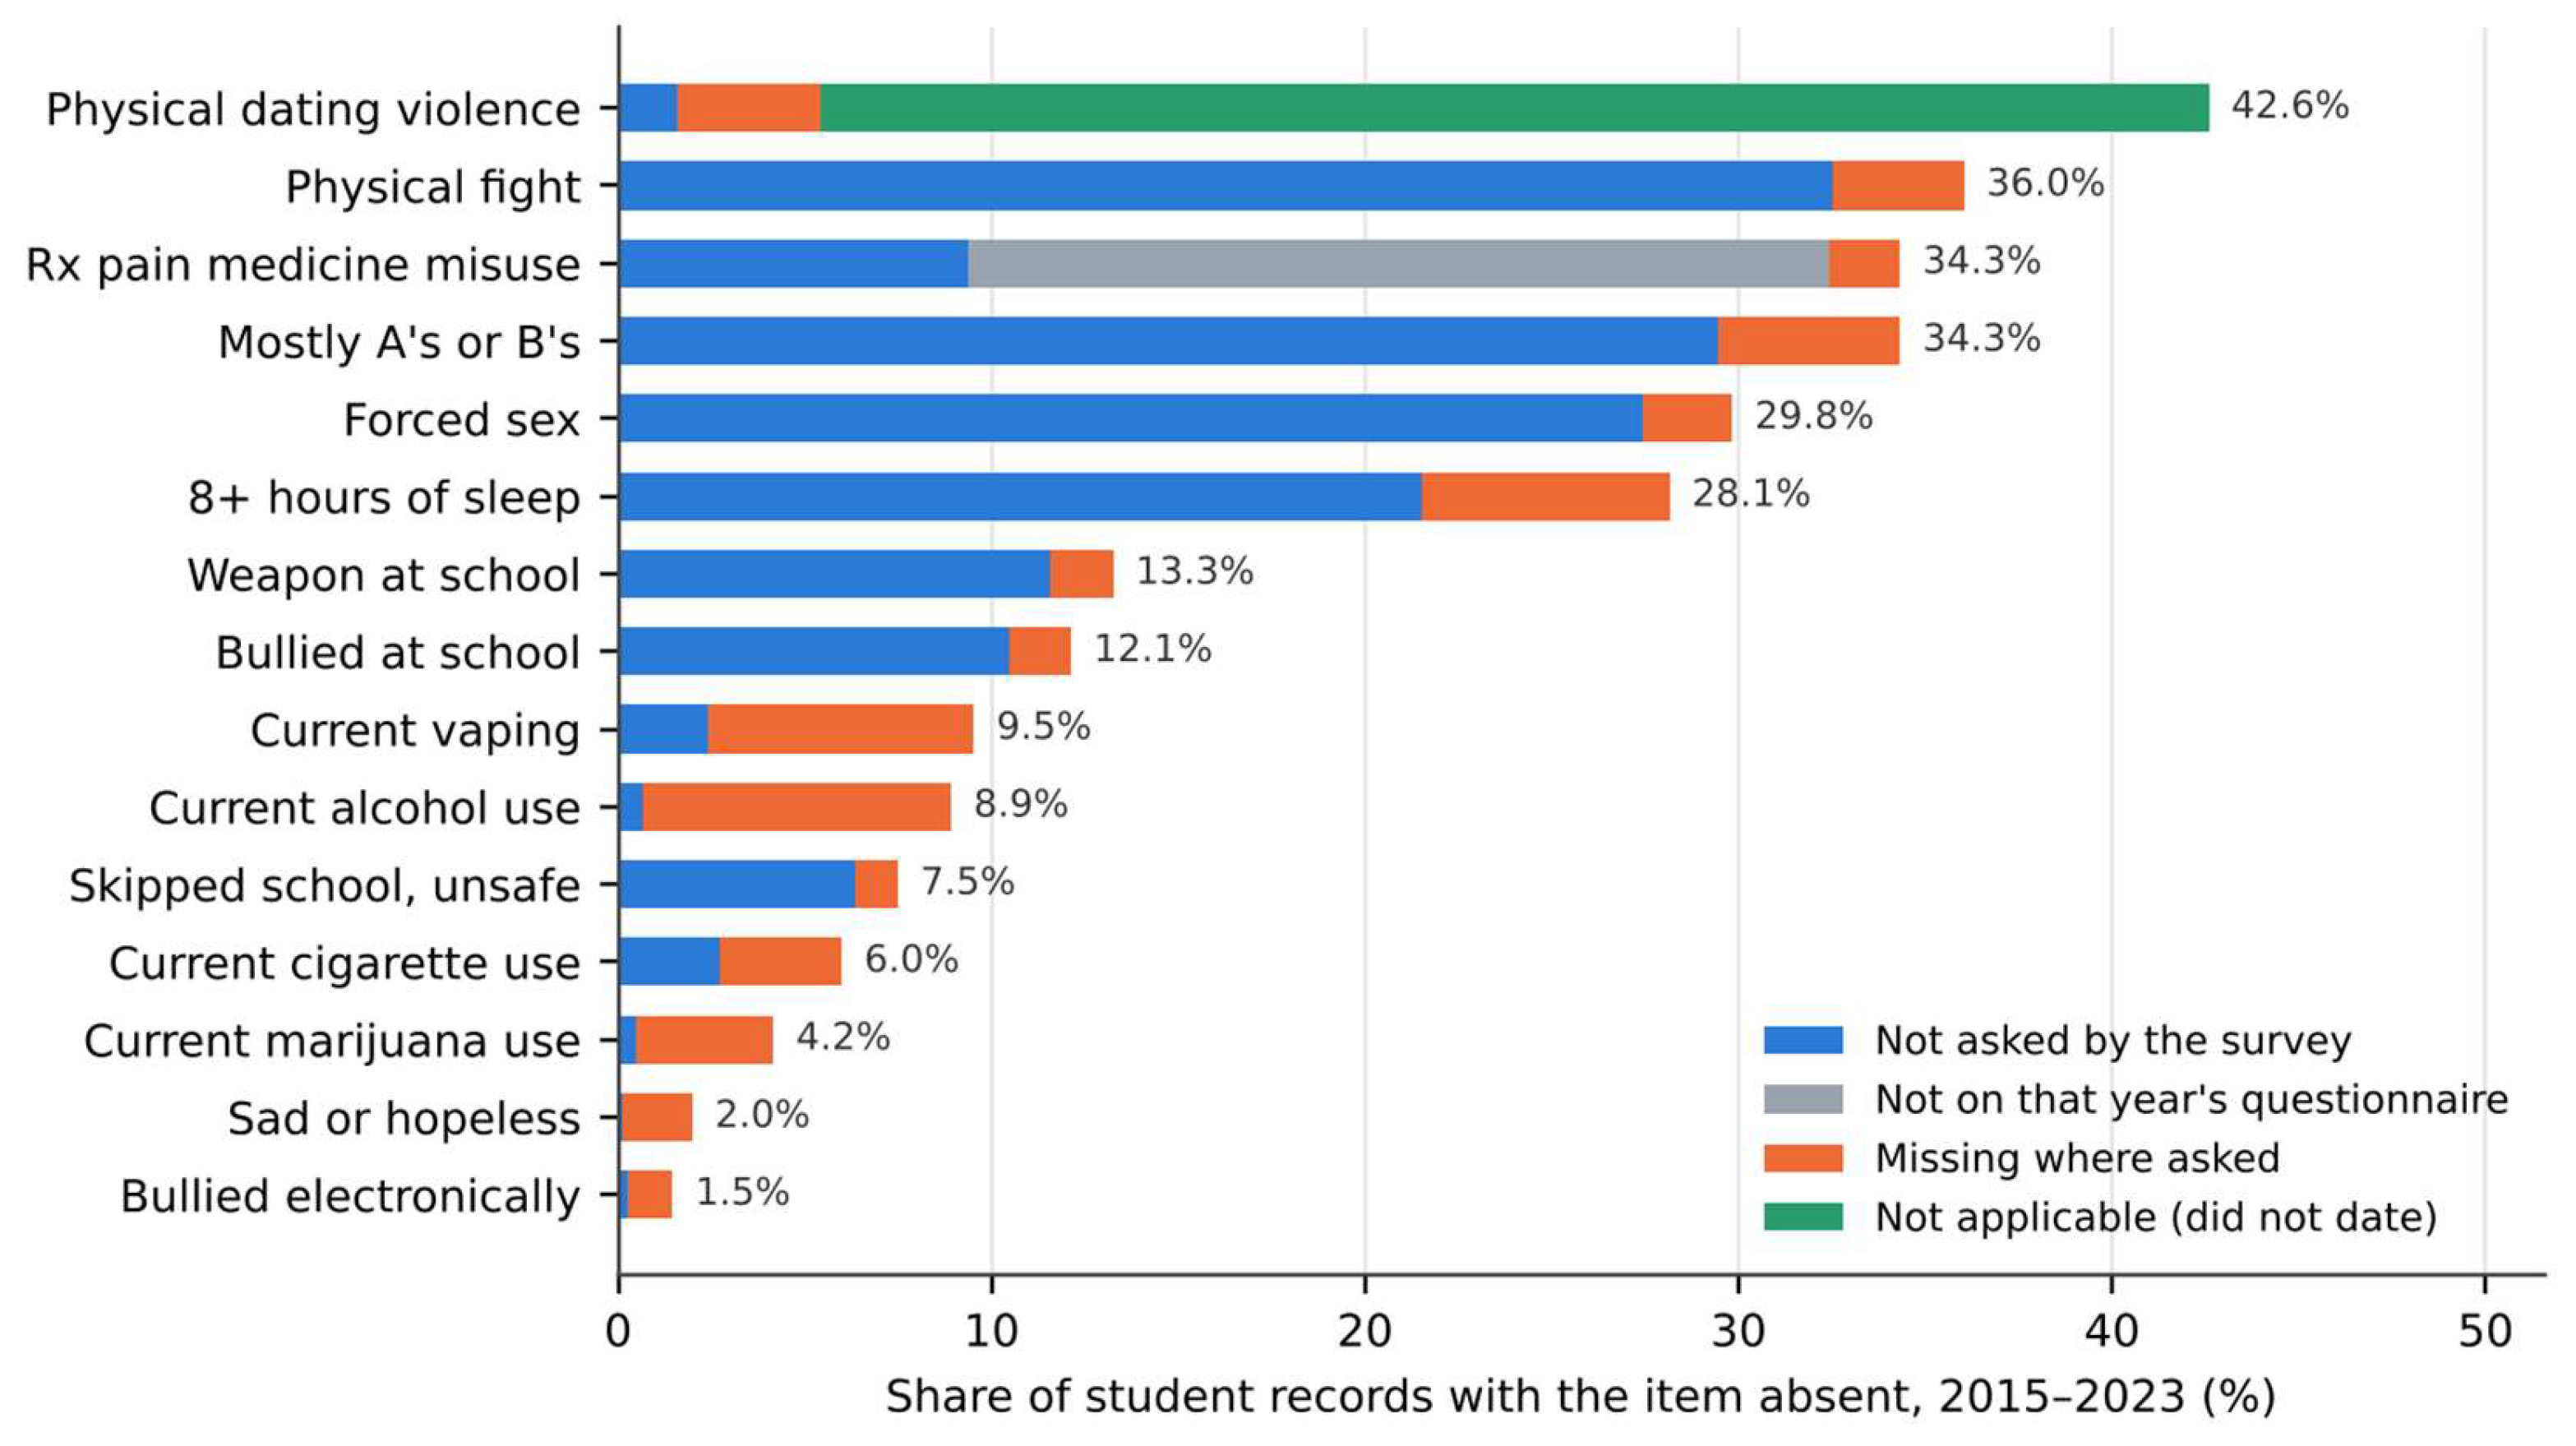
Figure 2.
Survey-weighted test-set AUROC with 95% PSU-bootstrap intervals in the primary analysis. The diagnostic STRUCT_ONLY model uses only site, year and which items the survey asked.
Figure 2.
Survey-weighted test-set AUROC with 95% PSU-bootstrap intervals in the primary analysis. The diagnostic STRUCT_ONLY model uses only site, year and which items the survey asked.
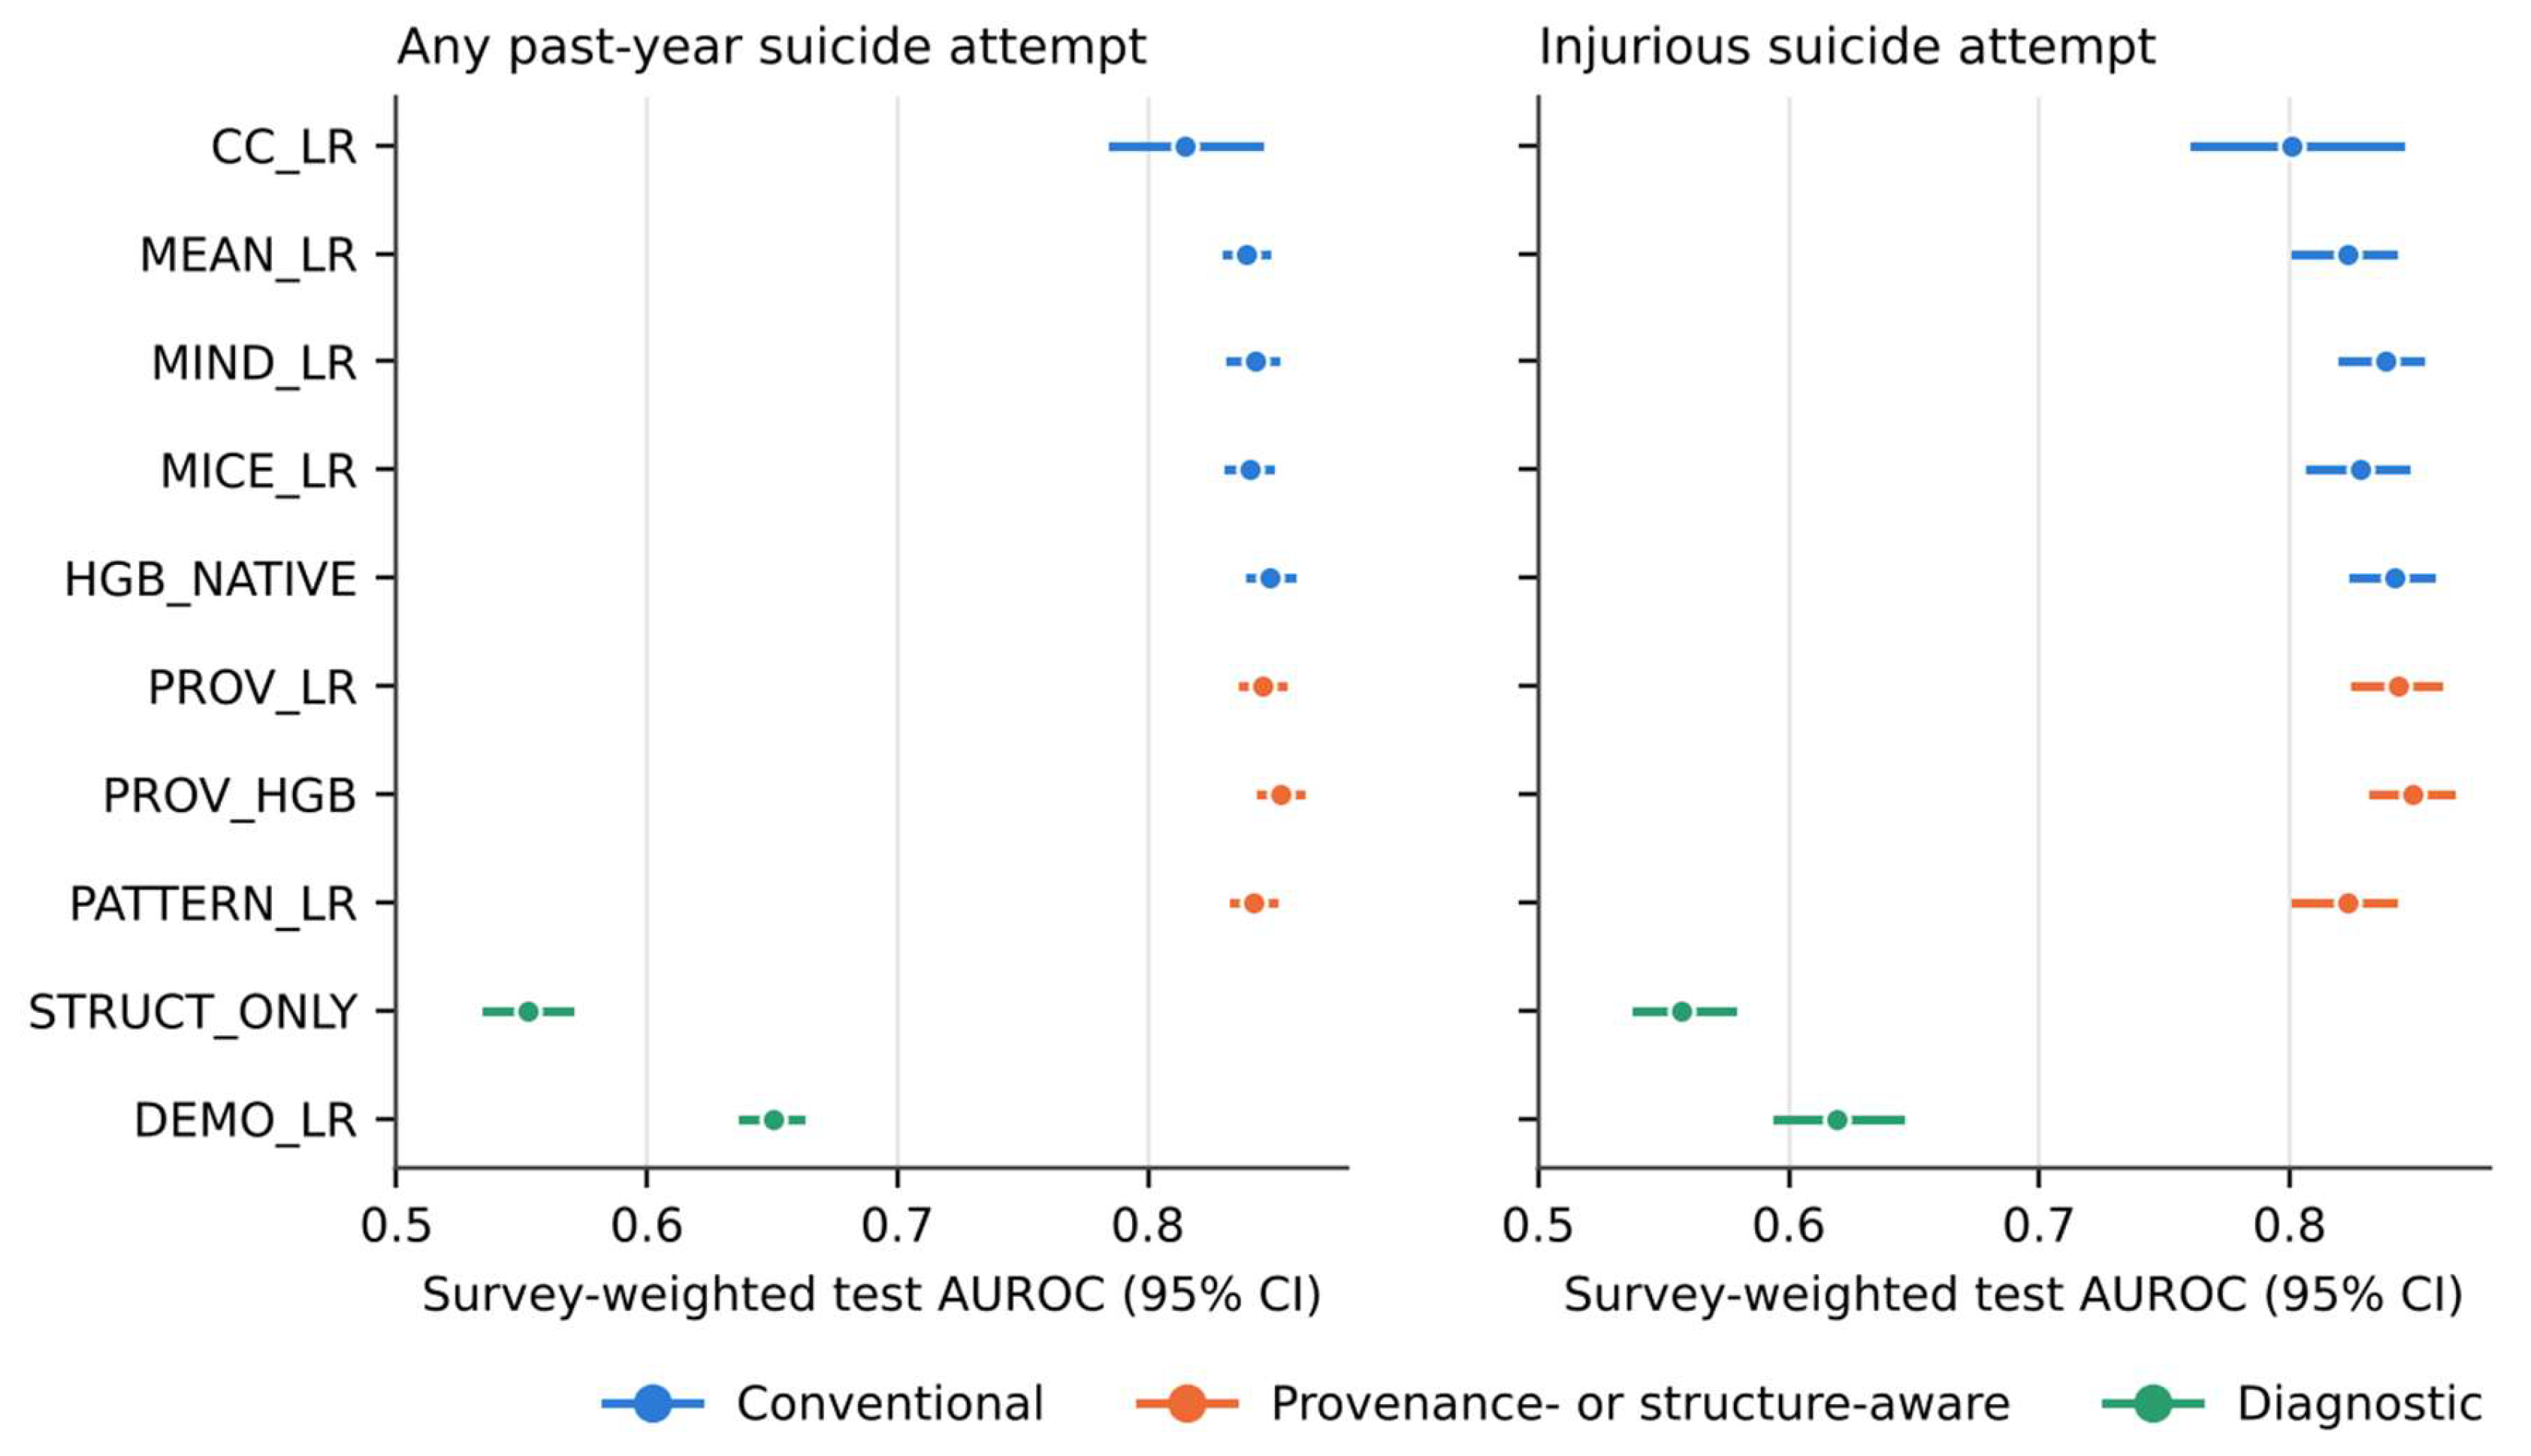
Figure 3.
Survey-weighted calibration by decile of predicted risk on the primary test sets. The dashed line marks perfect calibration.
Figure 3.
Survey-weighted calibration by decile of predicted risk on the primary test sets. The dashed line marks perfect calibration.
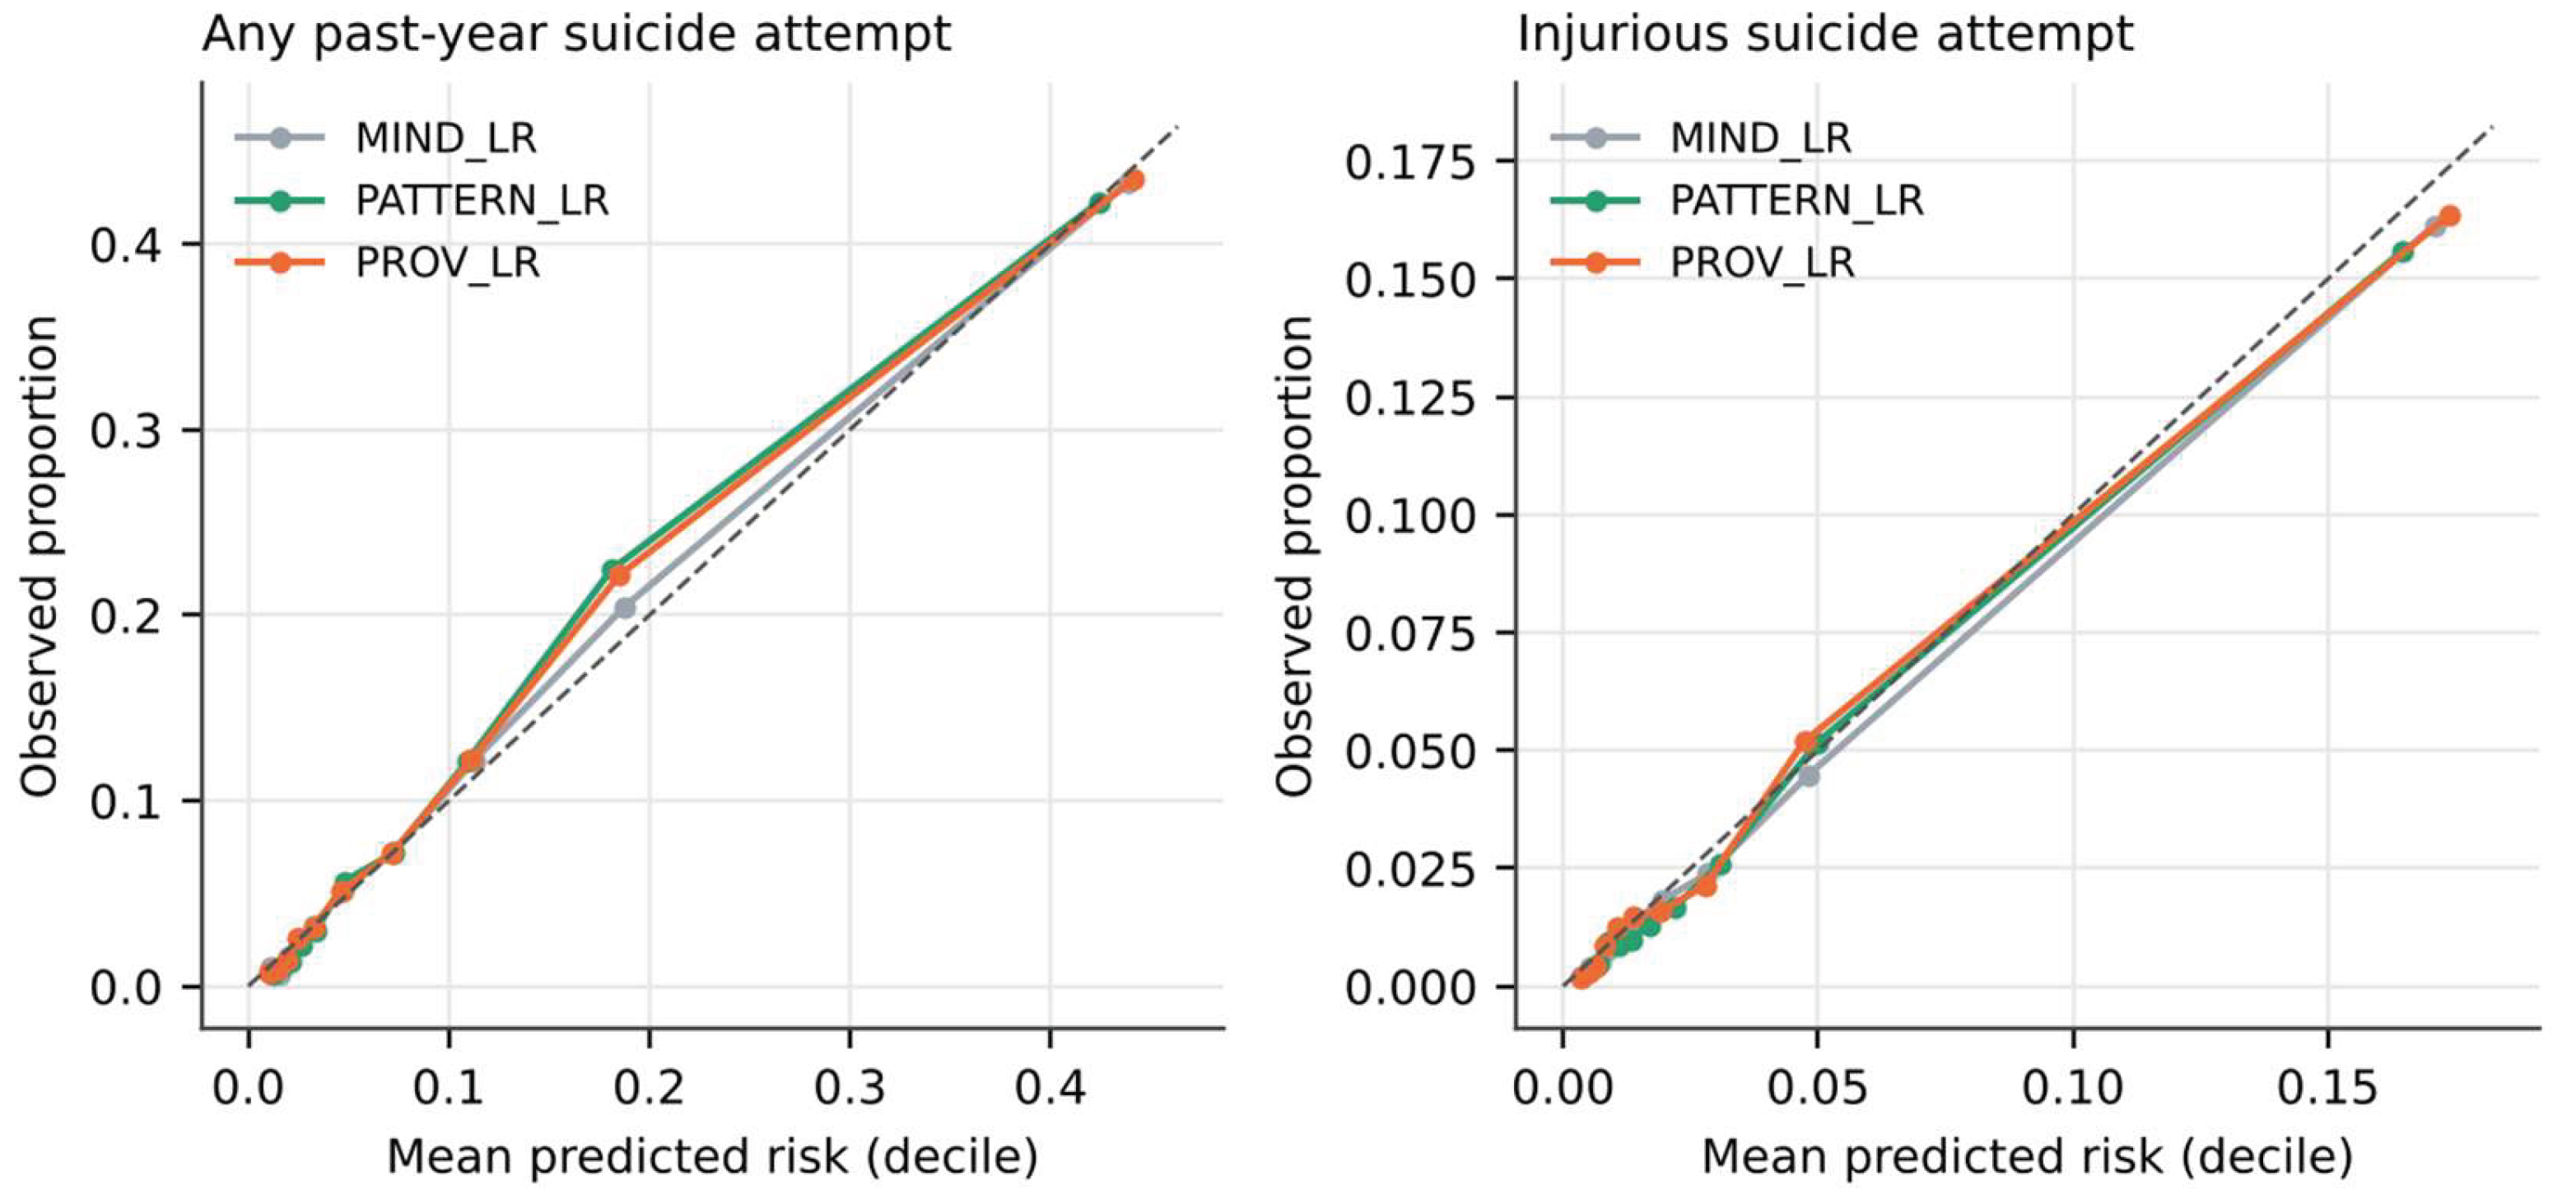
Figure 4.
PROV_LR minus MIND_LR difference in survey-weighted AUROC (×0.001) across the pre-specified scenarios, with paired 95% CIs from 1,000 replicates. Right of zero favours provenance-split indicators. The national survey, where sites do not omit items, shows no gain.
Figure 4.
PROV_LR minus MIND_LR difference in survey-weighted AUROC (×0.001) across the pre-specified scenarios, with paired 95% CIs from 1,000 replicates. Right of zero favours provenance-split indicators. The national survey, where sites do not omit items, shows no gain.
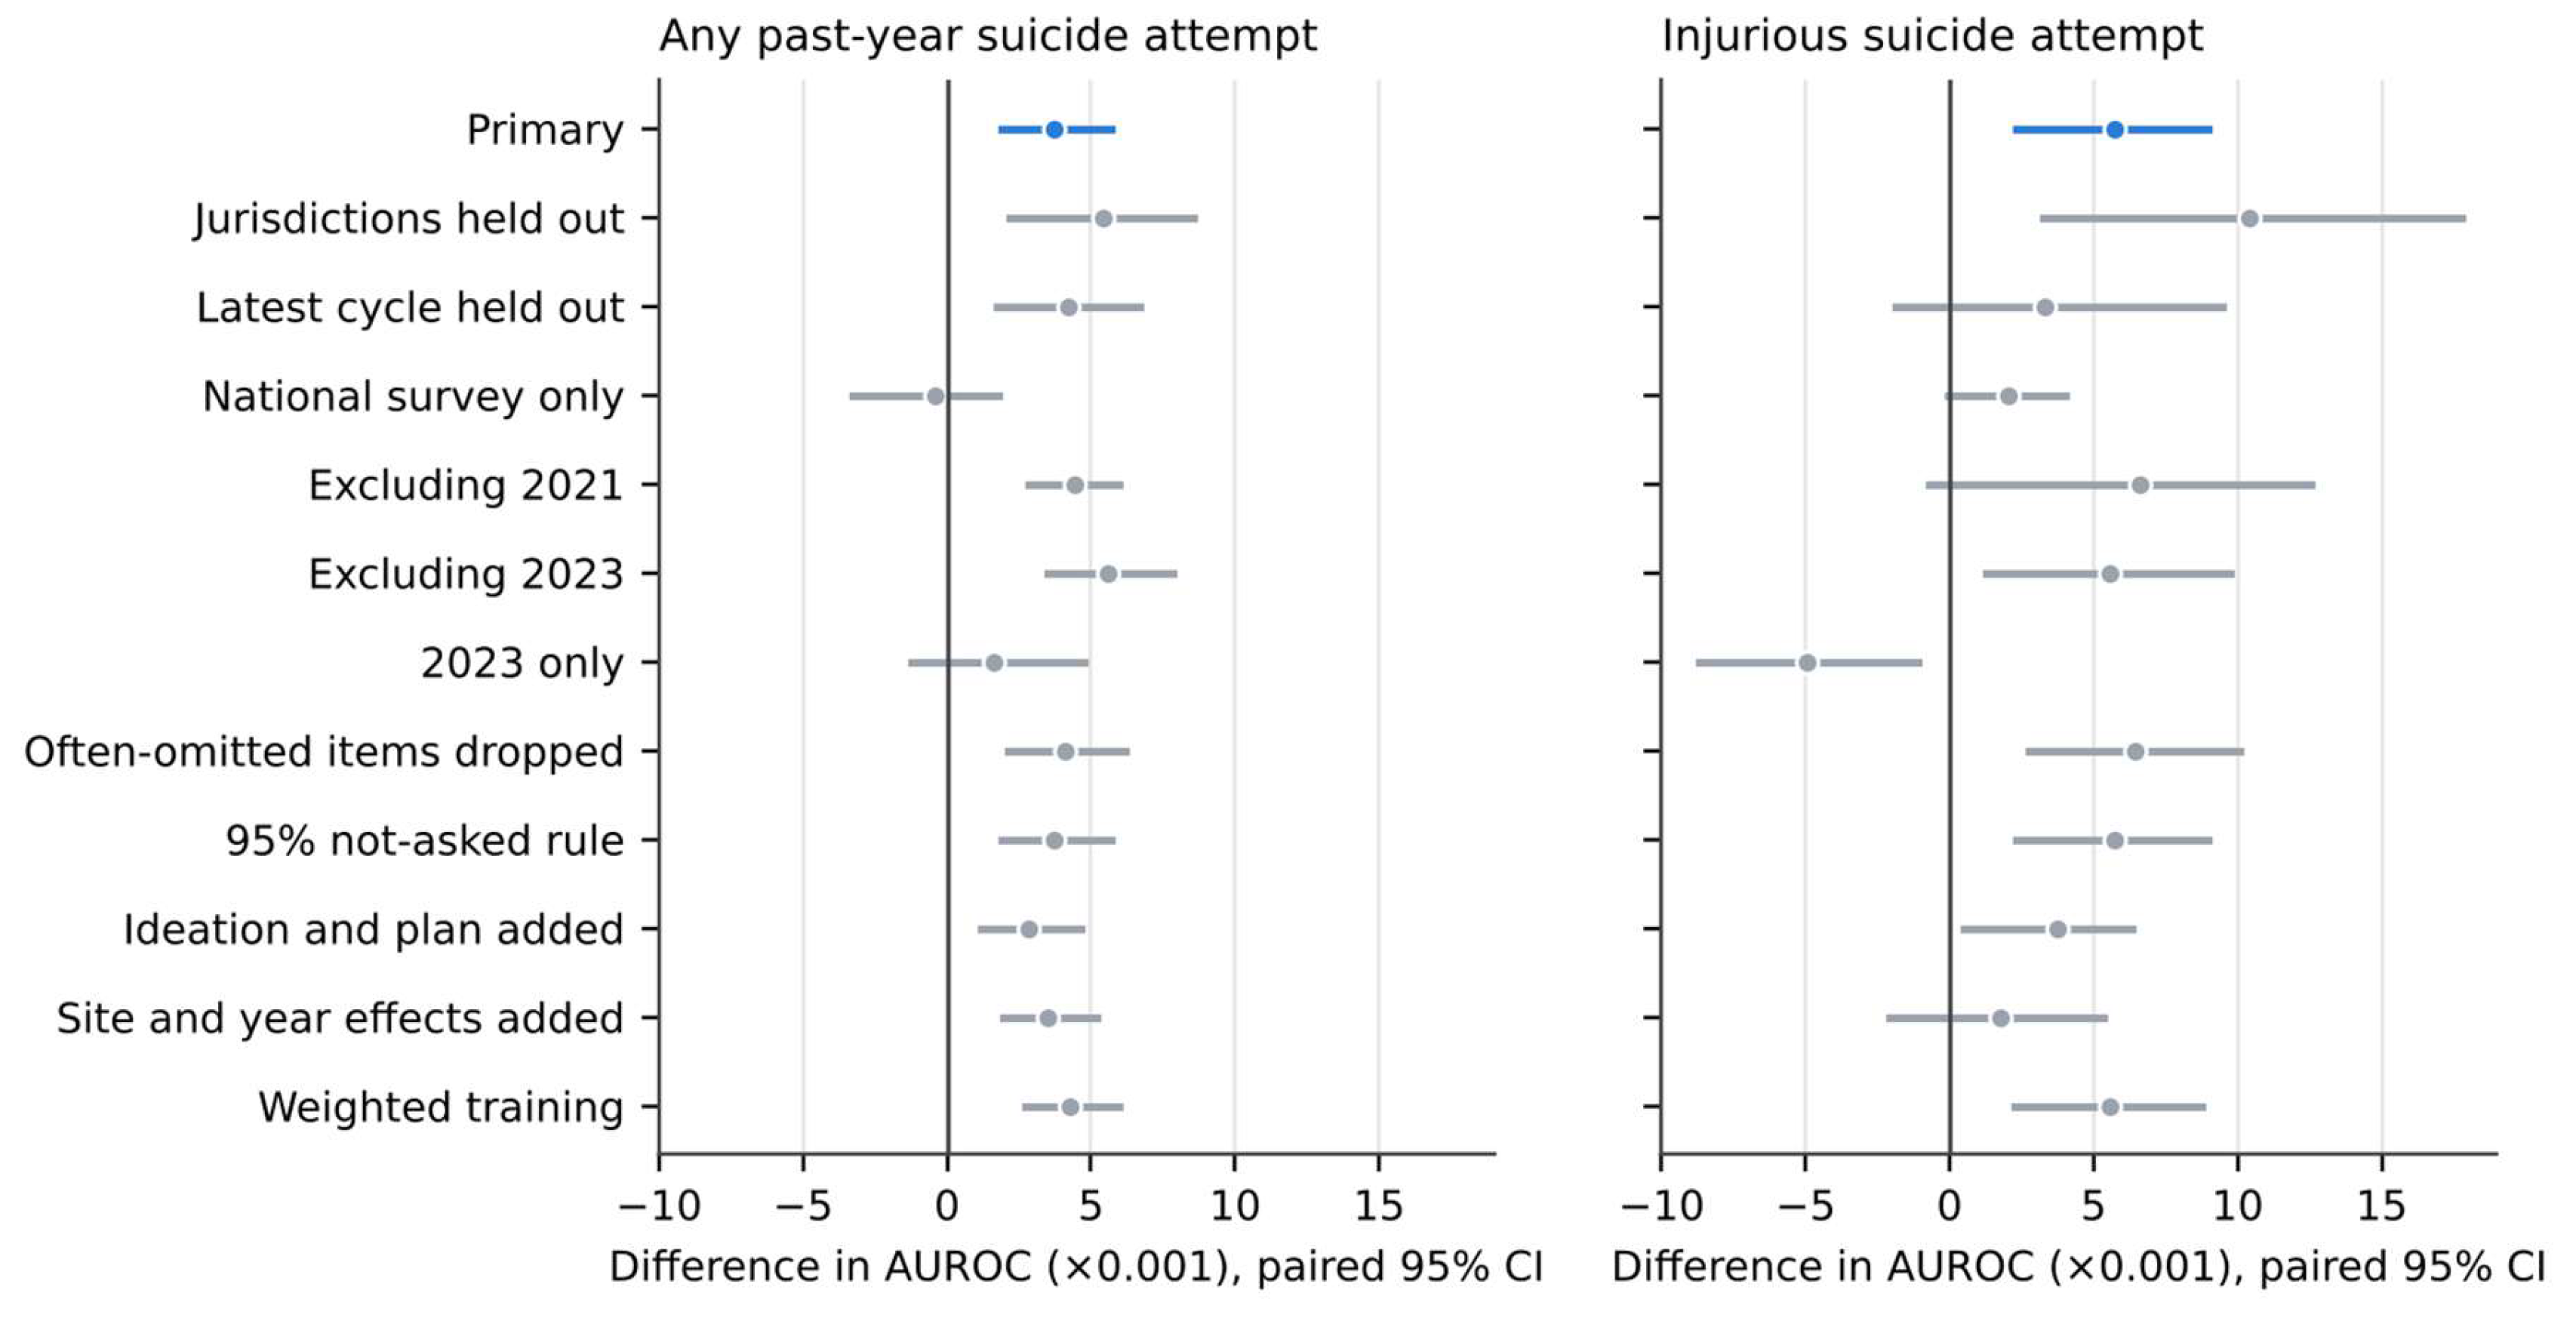

Table 1.
Cohort flow, state and district surveys, 2015–2023.
| Any attempt | Injurious attempt | |||
|---|---|---|---|---|
| Step | Students | Surveys | Students | Surveys |
| Records in the combined file (1991–2023 release) | 1,008,297 | 250 | 1,008,297 | 250 |
| Survey years 2015–2023 | 1,008,297 | 250 | 1,008,297 | 250 |
| State and district surveys (national excluded) | 926,896 | 245 | 926,896 | 245 |
| Weighted (representative) surveys | 926,896 | 245 | 926,896 | 245 |
| Survey asked the outcome item | 766,807 | 235 | 590,937 | 211 |
| Valid outcome response (analytic cohort) | 684,688 | 235 | 504,707 | 211 |
Table 2.
Survey-weighted test-set discrimination in the primary analysis (95% CI, 1,000 PSU bootstrap replicates). PPV80: positive predictive value at the threshold giving 80% sensitivity on the validation set. †Complete-case analysis scores only students with all items observed (8.6% and 11.4% of the test sets), so its metrics describe a different, smaller population.
Table 2.
Survey-weighted test-set discrimination in the primary analysis (95% CI, 1,000 PSU bootstrap replicates). PPV80: positive predictive value at the threshold giving 80% sensitivity on the validation set. †Complete-case analysis scores only students with all items observed (8.6% and 11.4% of the test sets), so its metrics describe a different, smaller population.
| Any past-year attempt | Injurious attempt | |||||
|---|---|---|---|---|---|---|
| Model | AUROC | PR-AUC | PPV80 | AUROC | PR-AUC | PPV80 |
| PROV_HGB | 0.853 (0.845–0.861) | 0.458 (0.436–0.478) | 0.251 (0.239–0.263) | 0.849 (0.833–0.864) | 0.231 (0.207–0.260) | 0.085 (0.078–0.091) |
| HGB_NATIVE | 0.849 (0.841–0.857) | 0.451 (0.430–0.472) | 0.243 (0.232–0.255) | 0.842 (0.825–0.856) | 0.223 (0.199–0.254) | 0.078 (0.072–0.083) |
| PROV_LR | 0.846 (0.838–0.854) | 0.440 (0.419–0.460) | 0.244 (0.233–0.256) | 0.843 (0.826–0.859) | 0.214 (0.192–0.239) | 0.078 (0.072–0.083) |
| MIND_LR | 0.843 (0.833–0.851) | 0.435 (0.413–0.457) | 0.238 (0.227–0.250) | 0.838 (0.821–0.852) | 0.215 (0.191–0.244) | 0.072 (0.067–0.077) |
| PATTERN_LR | 0.842 (0.834–0.850) | 0.418 (0.400–0.437) | 0.235 (0.224–0.245) | 0.823 (0.802–0.841) | 0.200 (0.176–0.227) | 0.070 (0.065–0.075) |
| MICE_LR | 0.841 (0.832–0.849) | 0.425 (0.406–0.443) | 0.237 (0.226–0.248) | 0.828 (0.808–0.846) | 0.207 (0.183–0.234) | 0.068 (0.063–0.072) |
| MEAN_LR | 0.839 (0.831–0.847) | 0.414 (0.396–0.433) | 0.238 (0.227–0.249) | 0.823 (0.802–0.841) | 0.195 (0.172–0.222) | 0.069 (0.064–0.074) |
| CC_LR† | 0.815 (0.786–0.844) | 0.376 (0.333–0.422) | 0.202 (0.181–0.223) | 0.801 (0.762–0.844) | 0.210 (0.160–0.281) | 0.049 (0.039–0.059) |
| DEMO_LR | 0.650 (0.638–0.661) | 0.190 (0.176–0.205) | 0.119 (0.113–0.125) | 0.619 (0.595–0.644) | 0.052 (0.046–0.061) | 0.034 (0.032–0.037) |
| STRUCT_ONLY | 0.552 (0.536–0.569) | 0.122 (0.113–0.134) | 0.106 (0.099–0.112) | 0.557 (0.539–0.577) | 0.038 (0.034–0.044) | 0.031 (0.029–0.034) |
Table 3.
Survey-weighted Brier score and calibration intercept and slope in the primary analysis (95% CI).
Table 3.
Survey-weighted Brier score and calibration intercept and slope in the primary analysis (95% CI).
| Any past-year attempt | Injurious attempt | |||||
|---|---|---|---|---|---|---|
| Model | Brier | Intercept | Slope | Brier | Intercept | Slope |
| PROV_HGB | 0.069 (0.066–0.072) | 0.020 (−0.032–0.078) | 0.999 (0.957–1.038) | 0.025 (0.023–0.027) | −0.081 (−0.160–−0.004) | 0.993 (0.936–1.052) |
| HGB_NATIVE | 0.070 (0.067–0.073) | 0.012 (−0.040–0.069) | 0.992 (0.950–1.033) | 0.025 (0.023–0.027) | −0.125 (−0.202–−0.051) | 0.971 (0.913–1.031) |
| PROV_LR | 0.071 (0.067–0.074) | 0.048 (−0.006–0.106) | 1.004 (0.964–1.043) | 0.025 (0.024–0.027) | −0.074 (−0.155–0.003) | 0.964 (0.906–1.021) |
| MIND_LR | 0.071 (0.068–0.074) | 0.017 (−0.036–0.073) | 1.001 (0.960–1.042) | 0.025 (0.024–0.027) | −0.091 (−0.173–−0.017) | 0.968 (0.908–1.030) |
| PATTERN_LR | 0.072 (0.069–0.075) | 0.050 (−0.001–0.105) | 1.028 (0.991–1.066) | 0.026 (0.024–0.027) | −0.113 (−0.195–−0.040) | 0.992 (0.928–1.056) |
| MICE_LR | 0.071 (0.068–0.075) | 0.041 (−0.011–0.095) | 1.043 (1.006–1.081) | 0.025 (0.024–0.027) | −0.050 (−0.131–0.024) | 0.983 (0.918–1.043) |
| MEAN_LR | 0.072 (0.069–0.075) | 0.007 (−0.045–0.060) | 1.030 (0.991–1.067) | 0.026 (0.024–0.027) | −0.064 (−0.145–0.009) | 0.962 (0.898–1.023) |
| CC_LR | 0.069 (0.063–0.074) | 0.006 (−0.100–0.103) | 0.934 (0.834–1.050) | 0.021 (0.018–0.025) | −0.103 (−0.315–0.085) | 0.924 (0.798–1.068) |
Table 4.
Missingness-provenance codes.
| Code | Meaning | Sources it contains |
|---|---|---|
| OBS | Observed response | Answered items; skip-implied values from electronic administration |
| OBS_NONSUB | Observed, structurally not applicable | QN22 missing because the student did not date (Q22 = “did not date”) |
| NA_SITE | Not asked by this survey | Item missing for every record in the site-year survey but present in other surveys that year |
| NA_YEAR | Not on that year’s questionnaire | Item missing in every survey that year |
| NA_UNRES | Missing where asked | Item nonresponse and CDC edit-to-missing, which cannot be separated |
Table 5.
Comparators.
| Model | Role | Missing-data handling |
|---|---|---|
| CC_LR | Conventional | Complete-case logistic regression |
| MEAN_LR | Conventional | Training-mean imputation |
| MIND_LR | Conventional | Mean imputation + one missing indicator per item |
| MICE_LR | Conventional | Chained-equations imputation (m = 5, outcome excluded), predictions averaged |
| HGB_NATIVE | Conventional | Histogram gradient boosting with native missing-value routing |
| PROV_LR | Provenance-aware | Mean imputation + separate not-asked, unresolved and not-applicable indicators |
| PROV_HGB | Provenance-aware | Native routing + provenance indicators |
| PATTERN_LR | Structure-aware | One logistic model per survey availability pattern [5] |
| STRUCT_ONLY | Diagnostic | Site, year and availability pattern only; no student answers |
| DEMO_LR | Diagnostic | Demographics only |
Disclaimer/Publisher’s Note: The statements, opinions and data contained in all publications are solely those of the individual author(s) and contributor(s) and not of MDPI and/or the editor(s). MDPI and/or the editor(s) disclaim responsibility for any injury to people or property resulting from any ideas, methods, instructions or products referred to in the content. |
© 2026 by the authors. Licensee MDPI, Basel, Switzerland. This article is an open access article distributed under the terms and conditions of the Creative Commons Attribution (CC BY) license (http://creativecommons.org/licenses/by/4.0/).
Copyright: This open access article is published under a Creative Commons CC BY 4.0 license, which permit the free download, distribution, and reuse, provided that the author and preprint are cited in any reuse.