

Submitted:
24 October 2026
Posted:
26 October 2026
You are already at the latest version
Abstract
Background: Ischemia–reperfusion (I/R) injury is a major risk factor for the development of chronic kidney disease (CKD). However, effective treatments for preventing CKD progression following I/R injury have not yet been established. Methods: Mice underwent bilateral renal I/R injury and received continuous treatment with TY51469, a chymase-specific inhibitor. Renal injury and fibrosis were as-sessed six weeks after I/R. Blood urea nitrogen (BUN) levels, renal collagen deposition, mast cell ac-cumulation, mouse mast cell protease-4 (MMCP-4) expression, and the expression of fibrosis- and in-flammation-related genes were evaluated. Correlations between MMCP-4 and fibrosis- and inflamma-tion-related gene expression were also analyzed. Results: Six weeks after I/R injury, mice exhibited elevated BUN levels, increased renal collagen deposition, and upregulated expression of fibrosis- and inflammation-related genes, including transforming growth factor-beta 1 (TGF-β1), collagen I, matrix metalloproteinase-9 (MMP-9), and tumor necrosis factor-alpha (TNF-α). Mast cell accumulation and MMCP-4 expression were also markedly increased, particularly in fibrotic regions. Continuous treat-ment with TY51469 significantly attenuated BUN elevation, renal fibrosis, mast cell accumulation, MMCP-4 expression, and the upregulation of fibrosis- and inflammation-related genes. Furthermore, MMCP-4 expression was strongly positively correlated with the expression of TGF-β1, collagen I, MMP-9, and TNF-α. Conclusions: These findings suggest that mast cell-derived chymase contributes to renal fibrotic progression following I/R injury and that chymase inhibition may represent a poten-tial therapeutic strategy for preventing CKD development.
Keywords:
kidney
; ischemia–reperfusion
; chymase
; mast cells
; chymase inhibitor
1. Introduction
Acute kidney injury (AKI) is a clinical condition characterized by a rapid decrease in renal function, resulting in transient impairment of kidney function. Traditionally, it was assumed that renal function would fully recover once AKI resolved. However, large-scale clinical studies have demonstrated that patients with a history of AKI have a significantly increased risk of subsequently developing chronic kidney disease (CKD) [1,2,3]. These findings suggest that renal injury caused by AKI may persist even when appropriate treatment is administered according to clinical guidelines and laboratory parameters return to normal ranges. Indeed, numerous reports have shown that structural damage within renal tissue can remain long after serum creatinine levels have normalized, ultimately contributing to progression to CKD [4,5,6].
Although the mechanisms underlying the progression of AKI to CKD have not been fully clarified, several factors, including endothelial dysfunction [7,8], interstitial inflammation [9,10], fibrosis [11,12], and tubular epithelial injury [13,14], are believed to play important roles. For example, endothelial dysfunction decreases oxygen delivery to renal tissues, leading to mitochondrial impairment in multiple cell types and subsequent injury to renal tubular epithelial cells, ultimately triggering sterile interstitial inflammation [15]. Concurrently, tissue repair pathways are activated in response to this inflammation. However, when these reparative responses become excessive following AKI, they can promote renal fibrosis, disrupt normal kidney architecture, and accelerate the progression from AKI to CKD [10]. In recent years, increasing attention has been directed toward the molecular mechanisms that drive the above-mentioned inflammation and fibrosis after AKI. Following renal ischemia-reperfusion (I/R) injury, renal tubular epithelial cells produce inflammatory mediators such as tumor necrosis factor-alpha (TNF-α), interleukin-1β (IL-1β), and interleukin-6 (IL-6) [16,17,18]. In addition, transforming growth factor-beta1 (TGF-β1), a central mediator of fibrosis, is markedly upregulated in interstitial cells of I/R-injured mouse kidneys [19]. These findings indicate that activation of inflammation-related and fibrosis-related pathways plays a crucial role in the progression of AKI to CKD. Although several contributing factors have been identified in animal models, effective pharmacological strategies to prevent this transition have not yet been established in clinical practice.
Recently, mast cell-derived chymase has been recognized as a novel component of the renin-angiotensin system (RAS). Under ischemic or inflammatory conditions, mast cells undergo degranulation and release chymase, which converts angiotensin I (Ang I) to angiotensin II (Ang II) in a manner similar to angiotensin-converting enzyme (ACE) [20]. Chymase also activates latent TGF-β1 and pro- matrix metalloproteinase-9 (MMP-9), converting them into their active forms [21,22]. Ang II is a well-known pro-inflammatory mediator that contributes not only to hypertension, but also to fibrosis in various organs. Based on these observations, the present study investigated chymase expression in the kidney following I/R injury and evaluated whether long-term administration of the chymase-specific inhibitor TY51469 (23,24) could attenuate renal dysfunction and fibrosis in a chronic bilateral renal I/R injury mouse model.
2. Materials and Methods
2.1. Animals
Male BALB/c mice (6 weeks old, 18–22 g; SLC, Shizuoka, Japan) were used in this study. All animal procedures were conducted in accordance with the institutional guidelines of Osaka Medical and Pharmaceutical University and were approved by the local ethics committee (AM26-001). Mice were maintained under controlled temperature, humidity, and lighting conditions, provided with standard chow, and allowed free access to tap water.
2.2. Establishment of the Bilateral Renal I/R injury Model
The bilateral renal I/R model was established using a mixed intraperitoneal anesthetic consisting of medetomidine (0.3 mg/kg), midazolam (4.0 mg/kg), and butorphanol tartrate (5.0 mg/kg). After induction of anesthesia, each mouse was placed in the prone position. A 1-cm longitudinal incision was made through the skin and subcutaneous tissue on both sides of the lumbar spine, near the kidneys, and both renal pedicles were bluntly dissected. Arterial clamps were then applied to each pedicle for 30 minutes to induce ischemia (Figure 1A). Throughout the ischemic period, body temperature was maintained at approximately 37 °C. After 30 minutes, the clamps were removed (Figure 1B), the incisions were sutured, and the mice were allowed to recover. Sham-operated mice underwent the same surgical procedures except for the vascular clamping.
2.3. Experimental Groups and Tissue Collection
An I/R model was established using 20 animals, which were then divided into two groups of 10—a placebo-treated group and a group treated with TY51469—ensuring no significant difference in mean body weight between the groups. TY51469, a chymase inhibitor, was administered intraperitoneally at 10 mg/kg once daily from postoperative day 1 until the end of the experiment. An additional 8 mice underwent sham surgery. At 6 weeks post-surgery, all mice were anesthetized with a combination of three agents, after which whole blood was collected from the abdominal vena cava for renal function assessment. Subsequently, both kidneys were harvested and weighed. Each kidney was bisected longitudinally; one half was fixed in Carnoy’s solution for histological analysis, and the other half was snap-frozen for biochemical assays. No postoperative deaths were observed in the three groups mentioned above.
2.4. Real-time Polymerase Chain Reaction (RT-PCR)
Gene expressions of MMCP-4, TGF-β1, collagen I, MMP-9, and TNF-α were quantified by RT-PCR according to previously described methods [24]. Total RNA was extracted from renal tissue using Trizol reagent (Life Technologies, Rockville, MD, USA) and dissolved in RNase-free water (Takara Bio Inc., Otsu, Japan). One microgram of RNA was reverse-transcribed into cDNA using Superscript VIRO (Invitrogen, Carlsbad, CA, USA). RT-PCR was performed using the Stratagene Mx3000P system (Agilent Technologies, San Francisco, CA, USA) with TB Green Premix Ex Taq II (Tli RNaseH Plus, Takara, Kusatsu, Japan). Primers and probes for MMCP-4, TGF-β1, collagen I, MMP-9, TNF-α, and GAPDH were designed by Roche Diagnostics (Tokyo, Japan). The sequences of PCR primers used were as follows:
MMCP-4: F 5′-CTCTCTCCAAGCTGTGACCGAC-3′, R 5′- CTATGAGCTCCAAGGGTGACA-3′; Collagen I: F 5′- AACTTTGCTTCCCAGATGTCC-3′, R 5′- AGCCTCGGTGTCCCTTCA-3′; TGF-β1: F 5′-ACCATCCATGACATGAACCG-3′, R 5′- GCTTGCGACCCACGTA-3′; MMP-9: F 5′-TCGAACTTCGACACTGACAAGAA-3′, R 5′-CGGCACGCTGGAATGATC-3′; TNF-α: F 5′-CGTCAGCCGATTTGCTATCT-3′, R 5′- CGGACTCCGCAAAGTCTAAG-3′; and GAPDH: F 5′-TTCATTGACCTCAACTACATG-3′, R 5′-GTGGCAGTGATGGCATGGACT-3′. Gene expression levels were normalized to GAPDH.
2.5. Histological Analysis
Carnoy-fixed kidneys were embedded in paraffin, and 3-µm-thick serial sections were prepared using a sliding microtome (LITORATOMU, REM-710, Yamato Koki Kogyo Ltd., Asagiri, Saitama, Japan). The first section was stained with Azan-Mallory stain to evaluate fibrosis. Three microscopic fields exhibiting the most prominent fibrotic changes per section were examined at 200× magnification, and fibrotic areas were quantified using WinROOF2021, an image analysis software (MITANI corporation, Tokyo, Japan). The second section was stained with toluidine blue to assess mast cell distribution. After deparaffinization, sections were immersed in 0.5% toluidine blue (pH 4.8) for 15 min, differentiated in 0.5% acetic acid, dried, and mounted. The third section was subjected to immunohistochemistry using an anti-MMCP-4 antibody (ab92368, Abcam, Cambridge, UK) as previously described [23]. After blocking endogenous peroxidase and nonspecific binding, sections were incubated with the primary antibody (1:100) for 1 hour at room temperature, followed by detection using the LSAB kit (Dako LSAB kit, Carpinteria, CA, USA) and visualization with 3,3′-diaminobenzidine (DAB). Sections were counterstained with hematoxylin and mounted. Mast cells and chymase-positive cells were quantified using an image analysis system (Nikon, ECLIPSE Ci-L, Japan) and compared between groups.
2.6. Statistical Analysis
Data are presented as mean ± standard error of the mean (SEM) values. Statistical comparisons among multiple groups were performed using one-way analysis of variance (ANOVA), followed by Fisher’s post hoc test. Differences between two groups were evaluated using a paired t-test. A p value < 0.05 was considered significant. Correlations were analyzed using Pearson’s correlation coefficient.
3. Results
3.1. Establishment of I/R Model and Subsequent Changes in Serum Creatinine and Blood Urea Nitrogen Levels
Figure 1A shows a representative photograph of the left and right kidneys from an anesthetized mouse after 30 min of renal ischemia. Renal ischemia was induced by occluding blood flow to both the left and right kidneys using vascular clamps placed on the renal pedicles. As shown in Figure 1A, the renal surface changed to a dark purple color 30 min after pedicle clamping, indicating blood stasis due to ischemia. However, within a few seconds after removal of the clamps, the kidney returned rapidly to a light red color (Figure 1B), demonstrating successful restoration of renal blood flow.
Figure 2 shows the changes in serum creatinine and blood urea nitrogen (BUN) levels 6 weeks after renal I/R. Serum creatinine levels did not differ significantly among the three groups (Figure 2A). In contrast, BUN levels were significantly higher in the placebo group than in the sham group, and continuous administration of TY51469, a chymase-specific inhibitor, significantly suppressed the elevation of BUN levels following renal I/R compared with the placebo group (Figure 2B).
3.2. Changes in Body Weight (BW) and Kidney Weight (KW)-to-BW Ratio 6 Weeks after Renal I/R Injury
As shown in Figure 3D, the BW for all experimental groups was comparable before the start of the study. However, BW increased significantly in the sham-operated and TY51469-treated groups 6 weeks after surgery. In contrast, the placebo-treated group showed little increase in BW compared with the preoperative values following I/R injury. The greater increase in BW observed in the TY51469-treated group compared with the placebo-treated I/R group suggests that chymase inhibition may contribute to improvement of the overall physiological condition following I/R injury.
Figure 3A shows representative photographs of the right and left kidneys obtained 6 weeks after sham operation. No apparent difference in kidney size was observed between the two kidneys. Consistently, the KW-to-BW ratio for the left and right kidneys showed no significant difference 6 weeks after sham operation (Figure 3E). Following I/R injury, the left kidney KW-to-BW ratio for both the placebo- and TY51469-treated groups was comparable to that for the sham-operated group (Figure 3B, C, and E). In contrast, the right kidney showed a tendency toward a lower KW-to-BW ratio compared with the sham-operated group in all experimental groups. Although the underlying mechanism remains unclear, the right kidney consistently exhibited more severe adhesion formation than the left kidney during tissue collection. These adhesions may have impaired compensatory hypertrophy of the right kidney.
3.3. Effect of Chymase Inhibition on Renal Fibrosis Following I/R Injury
As shown in Figure 4A, Azan-Mallory staining of sham-operated kidneys demonstrated normal renal architecture without significant fibrotic changes. The Azan-Mallory staining method is widely used to detect collagen fibers in fibrotic connective tissues, which are visualized by blue staining. Because collagen fibers are physiologically present around blood vessels, these regions may exhibit blue staining even in normal renal tissue. In the sham-operated kidneys shown in Figure 4A, blue staining was observed only in the areas surrounding blood vessels, with no apparent collagen deposition in the renal parenchyma.
In contrast, kidneys subjected to I/R injury and treated with placebo for 6 weeks exhibited markedly increased blue staining, predominantly in the cortical region and at the corticomedullary junction (Figure 4B). Consistent with these histological findings, the quantified fibrotic areas in both the left and right kidneys were significantly greater in the placebo-treated I/R group than in the sham-operated group (Figure 4D). Conversely, administration of TY51469, started one day after I/R injury, significantly attenuated renal fibrosis, as demonstrated by reduced blue staining and a decreased fibrotic area in the I/R-injured kidneys (Figure 4C,D).
3.4. Changes in Chymase-positive Mast Cells in Renal Fibrosis Areas After I/R
The toluidine blue staining and mouse mast cell protease-4 (MMCP-4) immunostaining images in Figure 5 correspond to the regions outlined by yellow squares in the Azan-stained section. Approximately five types of proteases are present in mouse mast cells, and it has been reported that, of them, the enzymatic properties of MMCP-4 resemble those of human chymase [25]. Figure 5A shows representative toluidine blue staining for the identification of mast cells in a sham-operated kidney 6 weeks after surgery. Toluidine blue staining is a simple and traditional method used to identify mast cells. The cytoplasm of mast cells exhibits metachromatic staining, appearing red-purple, which makes them easily distinguishable from other cell types. In the kidney tissue of the sham-operated group, mast cells were extremely scarce, and, as shown in this representative histological section, only a single mast cell could be identified. The bottom panel in Figure 5A shows MMCP-4 immunostaining results. This section is a serial section adjacent to the kidney tissue section used for the toluidine blue staining shown above. However, the mast cell identified in the toluidine blue-stained section did not exhibit MMCP-4-positive staining in the corresponding region.
The middle image of Figure 5B shows a representative toluidine blue-stained section of the kidney from the placebo group 6 weeks after I/R. As shown, numerous mast cells were observed at the corticomedullary junction. In the adjacent serial section subjected to MMCP-4 immunostaining (Figure 5B, bottom image), the locations of these mast cells overlapped partially with MMCP-4-positive staining, indicating that mast cells express MMCP-4. The middle and bottom images of Figure 5C show representative toluidine blue staining and MMCP-4 immunostaining results for the TY51469-treated group 6 weeks after I/R. In these sections, the numbers of mast cells and MMCP-4-positive cells appeared slightly lower than in the placebo group.
Quantification of mast cells and MMCP-4-positive cells per unit area in the kidney tissue demonstrated that, as shown in Figure 6A,B, the number of both cell types tended to be increased or were significantly elevated in the placebo group following I/R, regardless of whether the left or right kidney was examined. In contrast, the numbers of mast cells and MMCP-4-positive cells in the TY51469-treated group showed a decreasing trend or were significantly decreased compared with those in the placebo group.
3.5. Changes in Gene Expression Levels of MMCP-4, TGF-β1, Collagen I, MMP-9, and TNF-α After I/R
Figure 7A shows MMCP-4 mRNA expression levels 6 weeks after surgery. As seen in the bar graph in Figure 6A, MMCP-4 expressions were significantly higher in both left and right I/R-injured kidneys than in non-injured sham-operated kidneys. However, MMCP-4 expressions in both left and right I/R-injured kidneys were significantly suppressed by TY51469 treatment. Fibrosis-related factors, such as TGF-β1, collagen I, and MMP-9, were also significantly elevated in both left and right I/R-injured kidneys compared with the sham-operated kidneys. These elevations tended to decrease or be significantly suppressed by TY51469 treatment (Figure 6B-D). Compared with the contralateral kidney, the expression level of collagen I in the right kidney was significantly higher in the placebo-treated group. Figure 7E shows TNF-α mRNA expression levels 6 weeks after surgery; TNF-α expressions were significantly higher in both left and right I/R-injured kidneys than in non-injured sham-operated kidneys, and these expressions were largely suppressed by the chymase inhibitor TY51469.
3.6. Correlations Between Renal MMCP-4 Expression and TGF-β1, Collagen I, MMP-9, and TNF-α Gene Expression Levels After I/R
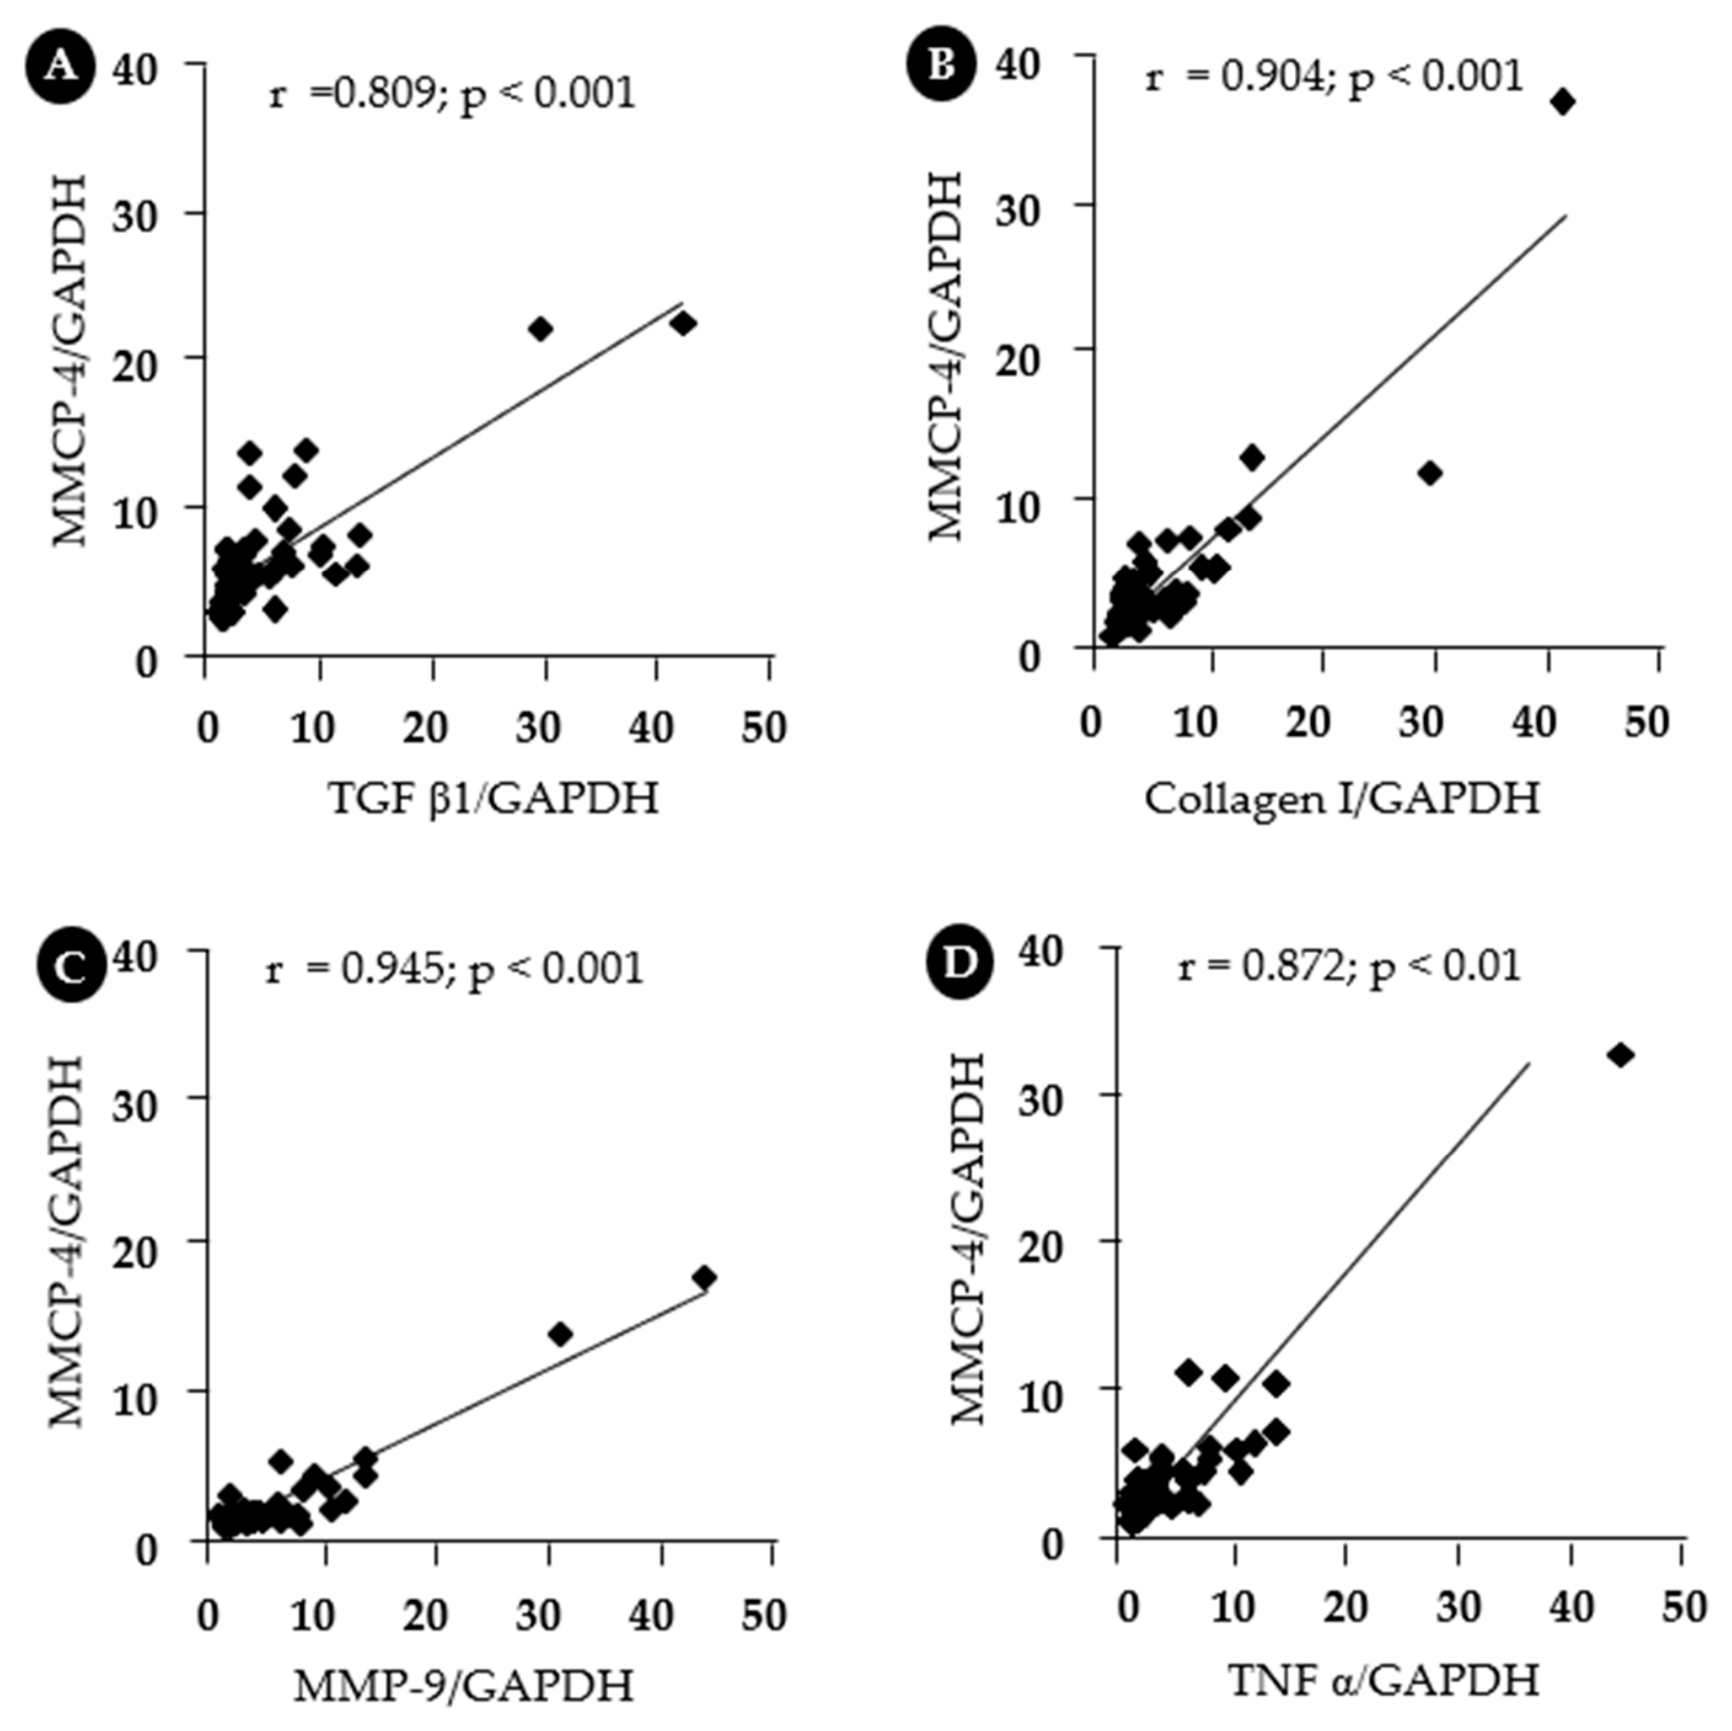
Figure 8 illustrates the correlations between MMCP-4 and fibrosis-related, as well as inflammatory, factors across all samples from the sham, placebo, and TY-treated groups. As shown, the mRNA expression level of MMCP-4 exhibited very strong correlations with TGF-β1 (r =0.809; p < 0.001), collagen I (r = 0.904; p < 0.001), MMP-9 (r = 0.945; p < 0.001), and TNF-α (r = 0.872; p < 0.01).
4. Discussion
AKI is now recognized as an important risk factor for the development of CKD. Renal ischemia causes oxygen deprivation and subsequent injury to several renal cell types. Although reperfusion restores oxygen delivery, it can paradoxically exacerbate renal damage through excessive production of reactive oxygen species (ROS) [26,27]. Renal I/R injury is characterized by endothelial dysfunction, apoptotic and necrotic cell death, and inflammatory cell infiltration, all of which contribute to progressive renal fibrosis. When the repair process following I/R injury becomes dysregulated, restoration of normal renal architecture is impaired, thereby promoting the progression of AKI to CKD [28,29]. Therefore, elucidating the mechanisms underlying persistent inflammation and fibrosis after AKI is clinically important for developing novel therapeutic strategies to prevent CKD progression.
In the present study, a bilateral renal I/R injury model that induced chronic renal changes, including increased expression of fibrosis-related genes, collagen accumulation, and elevated BUN levels, was successfully established. These findings indicate that this model is useful for investigating the mechanisms involved in the progression of AKI to CKD. Mice used in this study express several chymase isoforms, including MMCP-1, MMCP-2, MMCP-3, and MMCP-4, which exhibit distinct enzymatic properties [25]. Of these isoforms, MMCP-4 has been reported to have Ang II-generating activity that is most similar to that of human chymase [30]. Ang II promotes oxidative stress by activating NADPH oxidase (NOX) and increasing superoxide production [31], and it subsequently induces inflammatory responses through NF-κB activation, leading to increased production of pro-inflammatory cytokines such as TNF-α, IL-1β, and IL-6 [32,33]. In addition, chymase can activate latent TGF-β1 and proMMP-9, thereby promoting fibrotic remodeling [21,22]. These inflammatory and fibrogenic mediators are known to be upregulated after renal I/R injury [25,26], and TGF-β1 is considered a key factor involved in the progression from AKI to CKD [27,28].
Previously, we investigated the pathophysiological role of chymase in renal fibrosis using a unilateral renal I/R model. The expression pattern for chymase and the distribution of chymase-positive cells within fibrotic regions were highly similar to those observed in the present bilateral I/R model. However, in the unilateral model, serum parameters reflecting renal function showed minimal differences compared with sham-operated animals (23). These findings suggest that the bilateral I/R model used in the present study more accurately reflects the clinical process of the AKI-to-CKD transition by producing sustained renal dysfunction together with fibrotic remodeling.
In the present study, successful induction of ischemia and reperfusion was confirmed by transient changes in renal color following vascular occlusion and restoration of blood flow (Figure 1). Six weeks after I/R injury, BUN levels were significantly increased, whereas treatment with the chymase-specific inhibitor TY51469 significantly suppressed this elevation (Figure 2). Although serum creatinine levels did not differ significantly among the groups, the reduction in BUN elevation suggests that chymase inhibition may contribute to the preservation of renal function and prevention of progressive renal injury after I/R. Histological analysis demonstrated that renal I/R injury induced prominent fibrotic changes, particularly collagen deposition in the renal cortex and corticomedullary region (Figure 4). At the molecular level, renal I/R injury induced marked accumulation of mast cells and increased expression of MMCP-4 (Figure 5, Figure 6 and Figure 7), a marker of chymase-expressing mast cells, particularly within fibrotic regions. In contrast, administration of TY51469 reduced both MMCP-4-positive mast cell accumulation and MMCP-4 expression, and TY51469 treatment markedly reduced fibrotic areas, as demonstrated by Azan-Mallory staining (Figure 4D). These findings indicate that chymase activation contributes to chronic fibrotic remodeling following renal I/R injury and that inhibition of chymase activity may suppress the progression of renal fibrosis. In the present study, renal I/R injury significantly increased the expression of fibrosis-related genes, including TGF-β1, collagen I, and MMP-9, as well as the inflammatory cytokine TNF-α (Figure 7). These alterations were significantly attenuated by TY51469 treatment. Importantly, MMCP-4 expression showed strong positive correlations with TGF-β1, collagen I, MMP-9, and TNF-α expression levels (Figure 8), supporting the hypothesis that chymase activation is closely associated with inflammatory responses and fibrotic progression after renal I/R injury.
5. Conclusions
In conclusion, this study demonstrates that chymase inhibition with TY51469 suppresses renal fibrosis and inflammatory responses after chronic renal I/R injury. The close association between MMCP-4 expression and fibrosis-related pathways suggests that mast cell-derived chymase may play an important role in the progression of AKI to CKD. Therefore, chymase represents a potential therapeutic target for preventing chronic renal fibrosis after ischemic kidney injury.
Author Contributions
S.L. and D.J. conceived and supervised the study, contributed to manuscript preparation, and performed histological and gene expression analyses. S.T. performed gene expression analyses and reviewed and edited the manuscript. All authors have read and agreed to the published version of the manuscript.
Funding
This study was supported in part by Grants-in-Aid 17K09741, 24590336, 21590295, 15590240, 13670102, and 20K08601 for Scientific Research (C) from the Ministry of Education, Science, Sports, and Culture in Japan.
Institutional Review Board Statement
All experimental procedures were conducted in accordance with the guidelines of Osaka Medical and Pharmaceutical University for medical experiments and were approved by the local institutional ethics committee (AM26-001).
Data Availability Statement
The original contributions presented in this study are included in the article. Further inquiries can be directed to the corresponding author.
Acknowledgments
This study was supported in part by Grants-in-Aid 17K09741, 24590336, 21590295, 15590240, 13670102, and 20K08601 for Scientific Research (C) from the Ministry of Education, Science, Sports, and Culture in Japan.
Conflicts of Interest
The authors declare no conflicts of interest.
References
- Bucaloiu, I.D.; Kirchner, H.L.; Norfolk, E.R.; Hartle, J.E.; Perkins, R.M. Increased risk of death and de novo chronic kidney disease following reversible acute kidney injury. Kidney Int. 2012, 81, 477–485. [Google Scholar] [CrossRef]
- Coca, S.G.; Singanamala, S.; Parikh, C.R. Chronic kidney disease after acute kidney injury: a systematic review and meta-analysis. Kidney Int. 2012, 81, 442–448. [Google Scholar] [CrossRef]
- Hsu, C.Y.; Chertow, G.M.; McCulloch, C.E.; Fan, D.; Ordoñez, J.D.; Go, A.S. Nonrecovery of kidney function and death after acute on chronic renal failure. Clin. J. Am. Soc. Nephrol. 2009, 4, 891–898. [Google Scholar] [CrossRef]
- Li, Z.; Li, N. Epigenetic modification drives acute kidney injury-to-chronic kidney disease progression. Nephron 2021, 145, 737–747. [Google Scholar] [CrossRef]
- Liu, J.; Kumar, S.; Dolzhenko, E.; Alvarado, G.F.; Guo, J.; Lu, C.; Chen, Y.; Li, M.; Dessing, M.C.; Parvez, R.K.; et al. Molecular characterization of the transition from acute to chronic kidney injury following ischemia/reperfusion. JCI Insight 2017, 2, e94716. [Google Scholar] [CrossRef]
- Liu, B.C.; Tang, T.T.; Lv, L.L.; Lan, H.Y. Renal tubule injury: A driving force toward chronic kidney disease. Kidney Int. 2018, 93, 568–579. [Google Scholar] [CrossRef]
- Basile, D.P. The endothelial cell in ischemic acute kidney injury: Implications for acute and chronic function. Kidney Int. 2007, 72, 151–156. [Google Scholar] [CrossRef]
- Basile, D.P.; Collett, J.A.; Yoder, M.C. Endothelial colony-forming cells and pro-angiogenic cells: Clarifying definitions and their potential role in mitigating acute kidney injury. Acta. Physiol. (Oxf) . 2018, 222, e12914. [Google Scholar] [CrossRef]
- Anders, H.J.; Schaefer, L. Beyond Tissue Injury—Damage-Associated Molecular Patterns, Toll-Like Receptors, and Inflammasomes Also Drive Regeneration and Fibrosis. J. Am. Soc. Nephrol. 2014, 25, 1387–1400. [Google Scholar] [CrossRef]
- Sato, Y.; Yanagita, M. Immune cells and inflammation in AKI to CKD progression. Am. J. Physiol. Ren. Physiol. 2018, 315, F1501–F1512. [Google Scholar] [CrossRef]
- Mack, M.; Yanagita, M. Origin of myofibroblasts and cellular events triggering fibrosis. Kidney Int. 2015, 87, 297–307. [Google Scholar] [CrossRef]
- Nakamura, J.; Sato, Y.; Kitai, Y.; Wajima, S.; Yamamoto, S.; Oguchi, A.; Yamada, R.; Kaneko, K.; Kondo, M.; Uchino, E. Myofibroblasts acquire retinoic acid–producing ability during fibroblast-to-myofibroblast transition following kidney injury. Kidney Int. 2019, 95, 526–539. [Google Scholar] [CrossRef]
- Kaissling, B.; Lehir, M.; Kriz, W. Renal epithelial injury and fibrosis. Biochim. Biophys. Acta 2013, 1832, 931–939. [Google Scholar] [CrossRef]
- Zhao, J.; Wang, X.; Wu, Y.; Zhao, C. Kruppel-like factor 4 modulates the miR-101/COL10A1 axis to inhibit renal fibrosis after AKI by regulating epithelial-mesenchymal transition. Ren. Fail. 2024, 46, 2316259. [Google Scholar] [CrossRef]
- Szeto, H.H.J. Pharmacologic Approaches to Improve Mitochondrial Function in AKI and CKD. Am. Soc. Nephrol. 2017, 28, 2856–2865. [Google Scholar] [CrossRef]
- Maryam, B.; Smith, M.E.; Miller, S.J.; Natarajan, H.; Zimmerman, K.A. Macrophage Ontogeny, Phenotype, and Function in Ischemia Reperfusion-Induced Injury and Repair. Kidney360 2024, 5, 459–470. [Google Scholar] [CrossRef]
- Mantovani, A.; Sica, A.; Sozzani, S.; Allavena, P.; Vecchi, A.; Locati, M. The chemokine system in diverse forms of macrophage activation and polarization. Trends Immunol. 2004, 25, 677–686. [Google Scholar] [CrossRef]
- Guzzi, F.; Cirillo, L.; Roperto, R.M.; Romagnani, P.; Lazzeri, E. Molecular Mechanisms of the Acute Kidney Injury to Chronic Kidney Disease Transition: An Updated View. Int. J. Mol. Sci. 2019, 20, 4941. [Google Scholar] [CrossRef]
- Kim, D.J.; Kang, J.M.; Park, S.H.; Kwon, H.K.; Song, S.J.; Moon, H.; Kim, S.M.; Seo, J.W.; Lee, Y.H.; Kim, Y.G.; et al. Diabetes Aggravates Post-ischaemic Renal Fibrosis through Persistent Activation of TGF-beta(1) and Shh Signalling. Sci. Rep. 2017, 7, 16782. [Google Scholar] [CrossRef]
- Takai, S.; Shiota, N.; Yamamoto, D.; Okunishi, H.; Miyazaki, M. Purification and characterization of angiotensin II-generating chymase from hamster cheek pouch. Life Sci. 1996, 58, 591–597. [Google Scholar] [CrossRef]
- Lindstedt, K.A.; Wang, Y.; Shiota, N.; Saarinen, J.; Hyytiäinen, M.; Kokkonen, J.O.; Keski-Oja, J.; Kovanen, P.T. Activation of paracrine TGF-beta1 signaling upon stimulation and degranulation of rat serosal mast cells: A novel function for chymase. FASEB J. 2001, 15, 1377–1388. [Google Scholar] [CrossRef]
- Takai, S.; Jin, D. Pathophysiological Role of Chymase-Activated Matrix Metalloproteinase-9. Biomedicines 2022, 10, 2499. [Google Scholar] [CrossRef]
- Kure, S.; Toba, H.; Jin, D.; Mima, A.; Takai, S. Chymase Inhibition Attenuates Kidney Fibrosis in a Chronic Mouse Model of Renal Ischemia-Reperfusion Injury. Int. J. Mol. Sci. 2025, 26, 3913. [Google Scholar] [CrossRef]
- Terai, K.; Jin, D.; Watase, K.; Imagawa, A.; Takai, S. Mechanism of Albuminuria Reduction by Chymase Inhibition in Diabetic Mice. Int. J. Mol. Sci. 2020, 21, 7495. [Google Scholar] [CrossRef]
- Caughey, G.H.; Raymond, W.W.; Wolters, P.J. Angiotensin II generation by mast cell alpha- and beta-chymases. Biochim. Biophys. Acta. 2000, 1480, 245–257. [Google Scholar] [CrossRef]
- Zhao, M.; Wang, Y.; Li, L.; Liu, S.; Wang, C.; Yuan, Y.; Yang, G.; Chen, Y.; Cheng, J.; Lu, Y.; et al. Mitochondrial ROS promote mitochondrial dysfunction and inflammation in ischemic acute kidney injury by disrupting TFAM-mediated mtDNA maintenance. Theranostics 2021, 11, 1845–1863. [Google Scholar] [CrossRef]
- Fan, Y.; Yuan, Y.; Xiong, M.; Jin, M.; Zhang, D.; Yang, D.; Liu, C.; Petersen, R.B.; Huang, K.; Peng, A.; et al. Tet1 deficiency exacerbates oxidative stress in acute kidney injury by regulating superoxide dismutase. Theranostics 2023, 13, 5348–5364. [Google Scholar] [CrossRef]
- Nieuwenhuijs-Moeke, G.J.; Pischke, S.E.; Berger, S.P.; Sanders, J.S.F.; Pol, R.A.; Struys, M.M.R.F.; Ploeg, R.J.; Leuvenink, H.G.D. Ischemia and reperfusion injury in kidney transplantation: Relevant mechanisms in injury and repair. J. Clin. Med. 2020, 9, 253. [Google Scholar] [CrossRef]
- Bonventre, J.V.; Yang, L. Cellular pathophysiology of ischemic acute kidney injury. J. Clin. Investig. 2011, 121, 4210–4221. [Google Scholar] [CrossRef]
- Andersson, M.K.; Karlson, U.; Hellman, L. The extended cleavage specificity of the rodent betachymases rMCP-1 and mMCP-4 reveal major functional similarities to the human mast cell chymase. Mol. Immunol. 2008, 45, 766–775. [Google Scholar] [CrossRef]
- Griendling, K.K.; Minieri, C.A.; Ollerenshaw, J.D.; Alexander, R.W. Angiotensin II stimulates NADH and NADPH oxidase activity in cultured vascular smooth muscle cells. Circ. Res. 1994, 74, 1141–1148. [Google Scholar] [CrossRef]
- Garrido, A.M.; Griendling, K.K. NADPH oxidases and angiotensin II receptor signaling. Mol. Cell. Endocrinol. 2009, 302, 148–158. [Google Scholar] [CrossRef]
- Asehnoune, K.; Strassheim, D.; Mitra, S.; Kim, J.Y.; Abraham, E. Involvement of reactive oxygen species in Toll-like receptor 4-dependent activation of NF-kappa B. J. Immunol. 2004, 172, 2522–2529. [Google Scholar] [CrossRef]
Figure 1.
Changes in renal surface color during ischemia and reperfusion. (A) Both the left and right renal pedicles are clamped using vascular clamps for 30 min to induce renal ischemia. (B) The clamps are removed to initiate reperfusion.
Figure 1.
Changes in renal surface color during ischemia and reperfusion. (A) Both the left and right renal pedicles are clamped using vascular clamps for 30 min to induce renal ischemia. (B) The clamps are removed to initiate reperfusion.
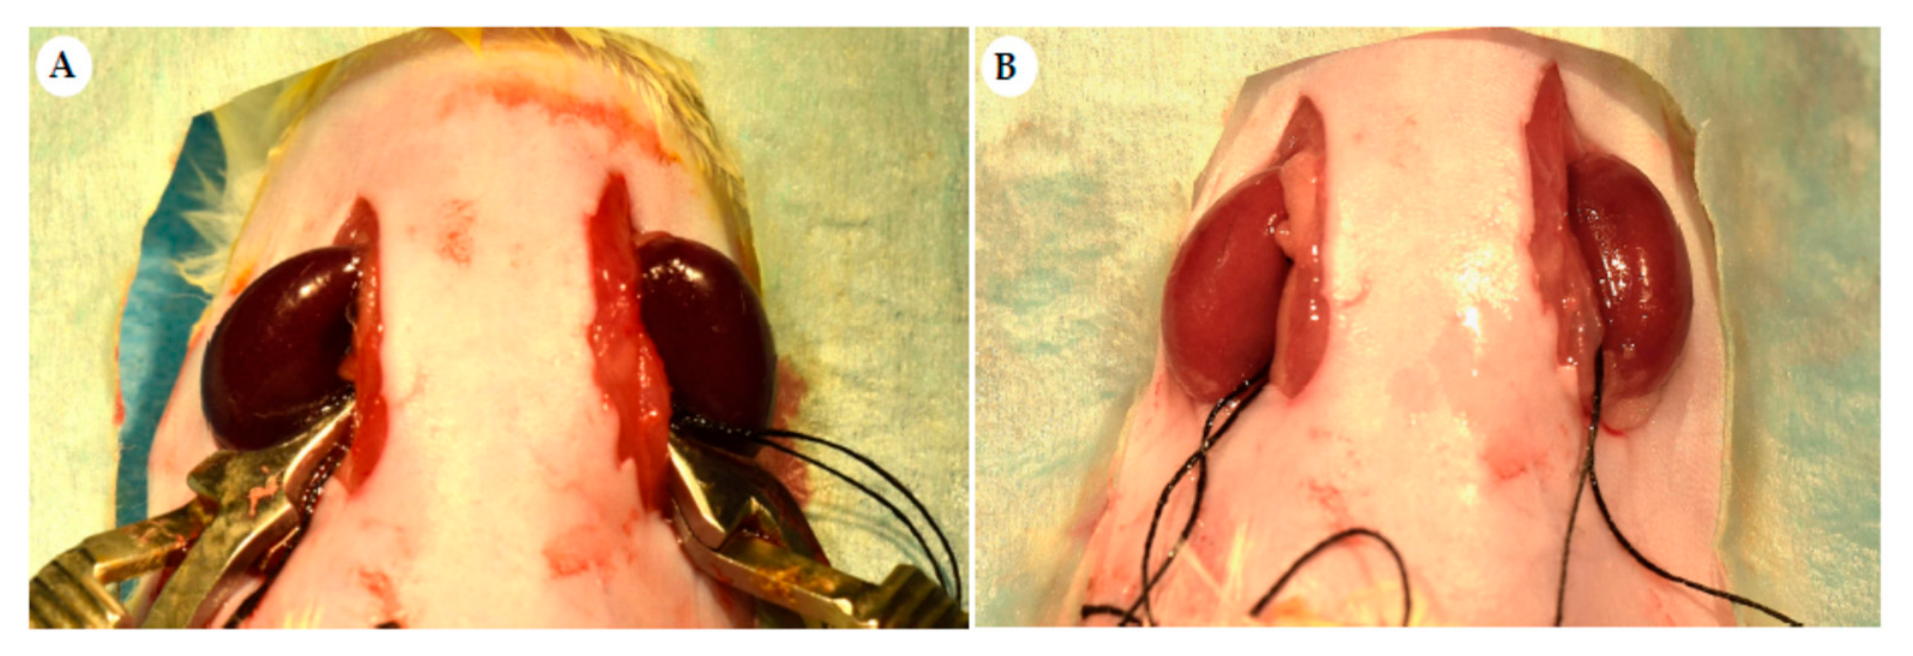
Figure 2.
Changes in serum creatinine and BUN levels 6 weeks after renal ischemia–reperfusion injury. Bar graphs show changes in serum creatinine (A) and BUN (B) levels following I/R-induced kidney injury.
Figure 2.
Changes in serum creatinine and BUN levels 6 weeks after renal ischemia–reperfusion injury. Bar graphs show changes in serum creatinine (A) and BUN (B) levels following I/R-induced kidney injury.
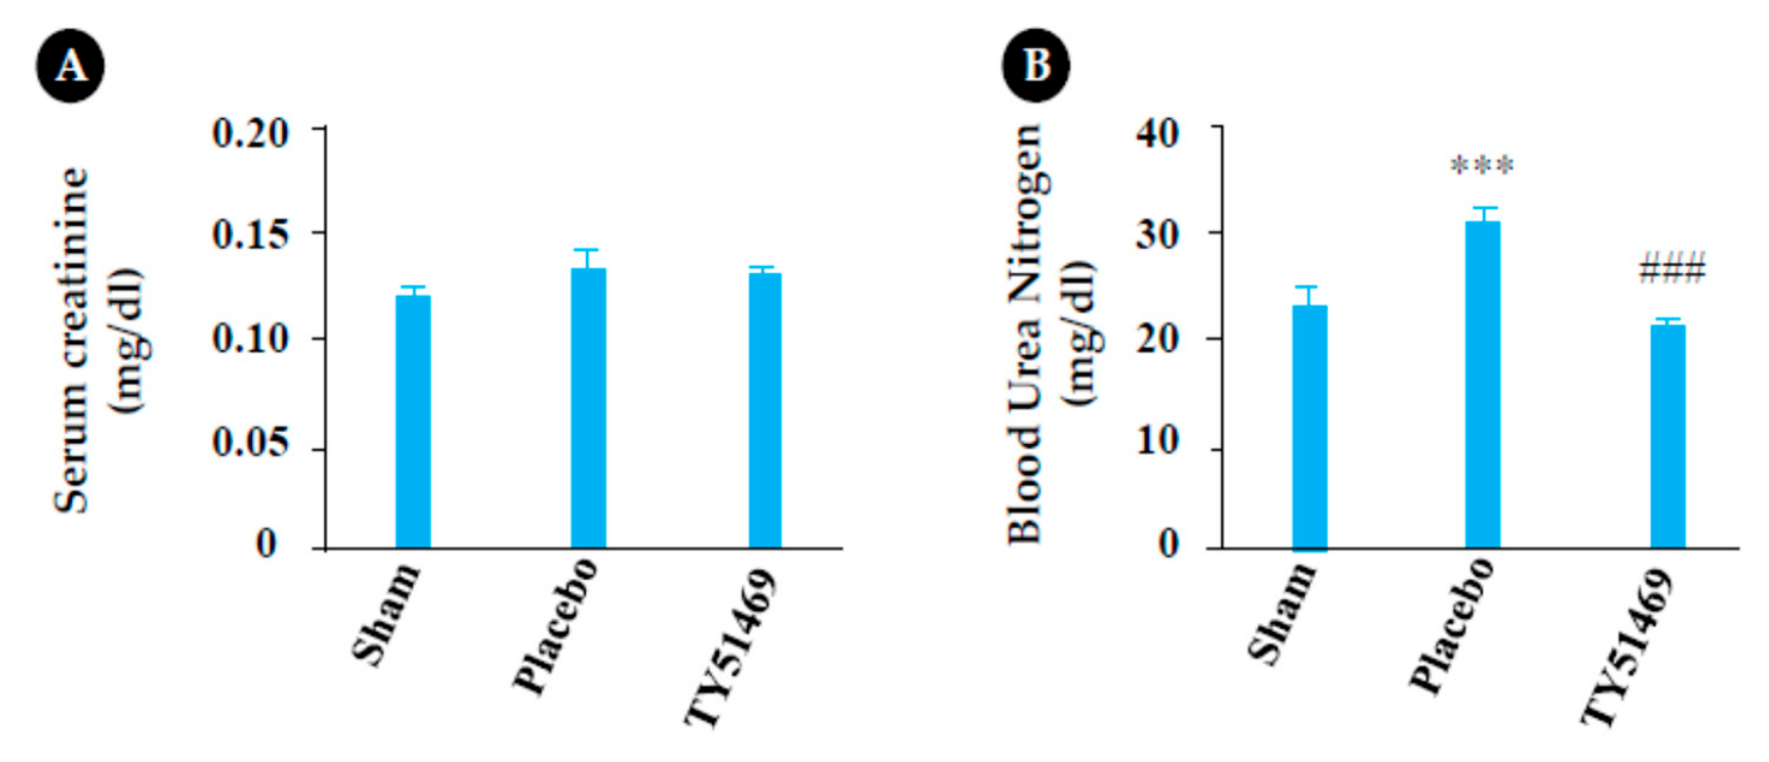
Figure 3.
Changes in body weight and kidney weight 6 weeks after sham operation or renal I/R injury. Representative photographs of the right and left kidneys obtained 6 weeks after surgery from a sham-operated mouse (A) and I/R mice treated with placebo (B) or TY51469 (C). (D) Changes in BW 6 weeks after sham operation or I/R injury. (E) Changes in the KW-to-BW ratio 6 weeks after sham operation or I/R injury. **p < 0.01 vs. the sham-operated group. ##p < 0.01 vs. the placebo group. $p < 0.05 and $$p < 0.01 vs. preoperative values.
Figure 3.
Changes in body weight and kidney weight 6 weeks after sham operation or renal I/R injury. Representative photographs of the right and left kidneys obtained 6 weeks after surgery from a sham-operated mouse (A) and I/R mice treated with placebo (B) or TY51469 (C). (D) Changes in BW 6 weeks after sham operation or I/R injury. (E) Changes in the KW-to-BW ratio 6 weeks after sham operation or I/R injury. **p < 0.01 vs. the sham-operated group. ##p < 0.01 vs. the placebo group. $p < 0.05 and $$p < 0.01 vs. preoperative values.
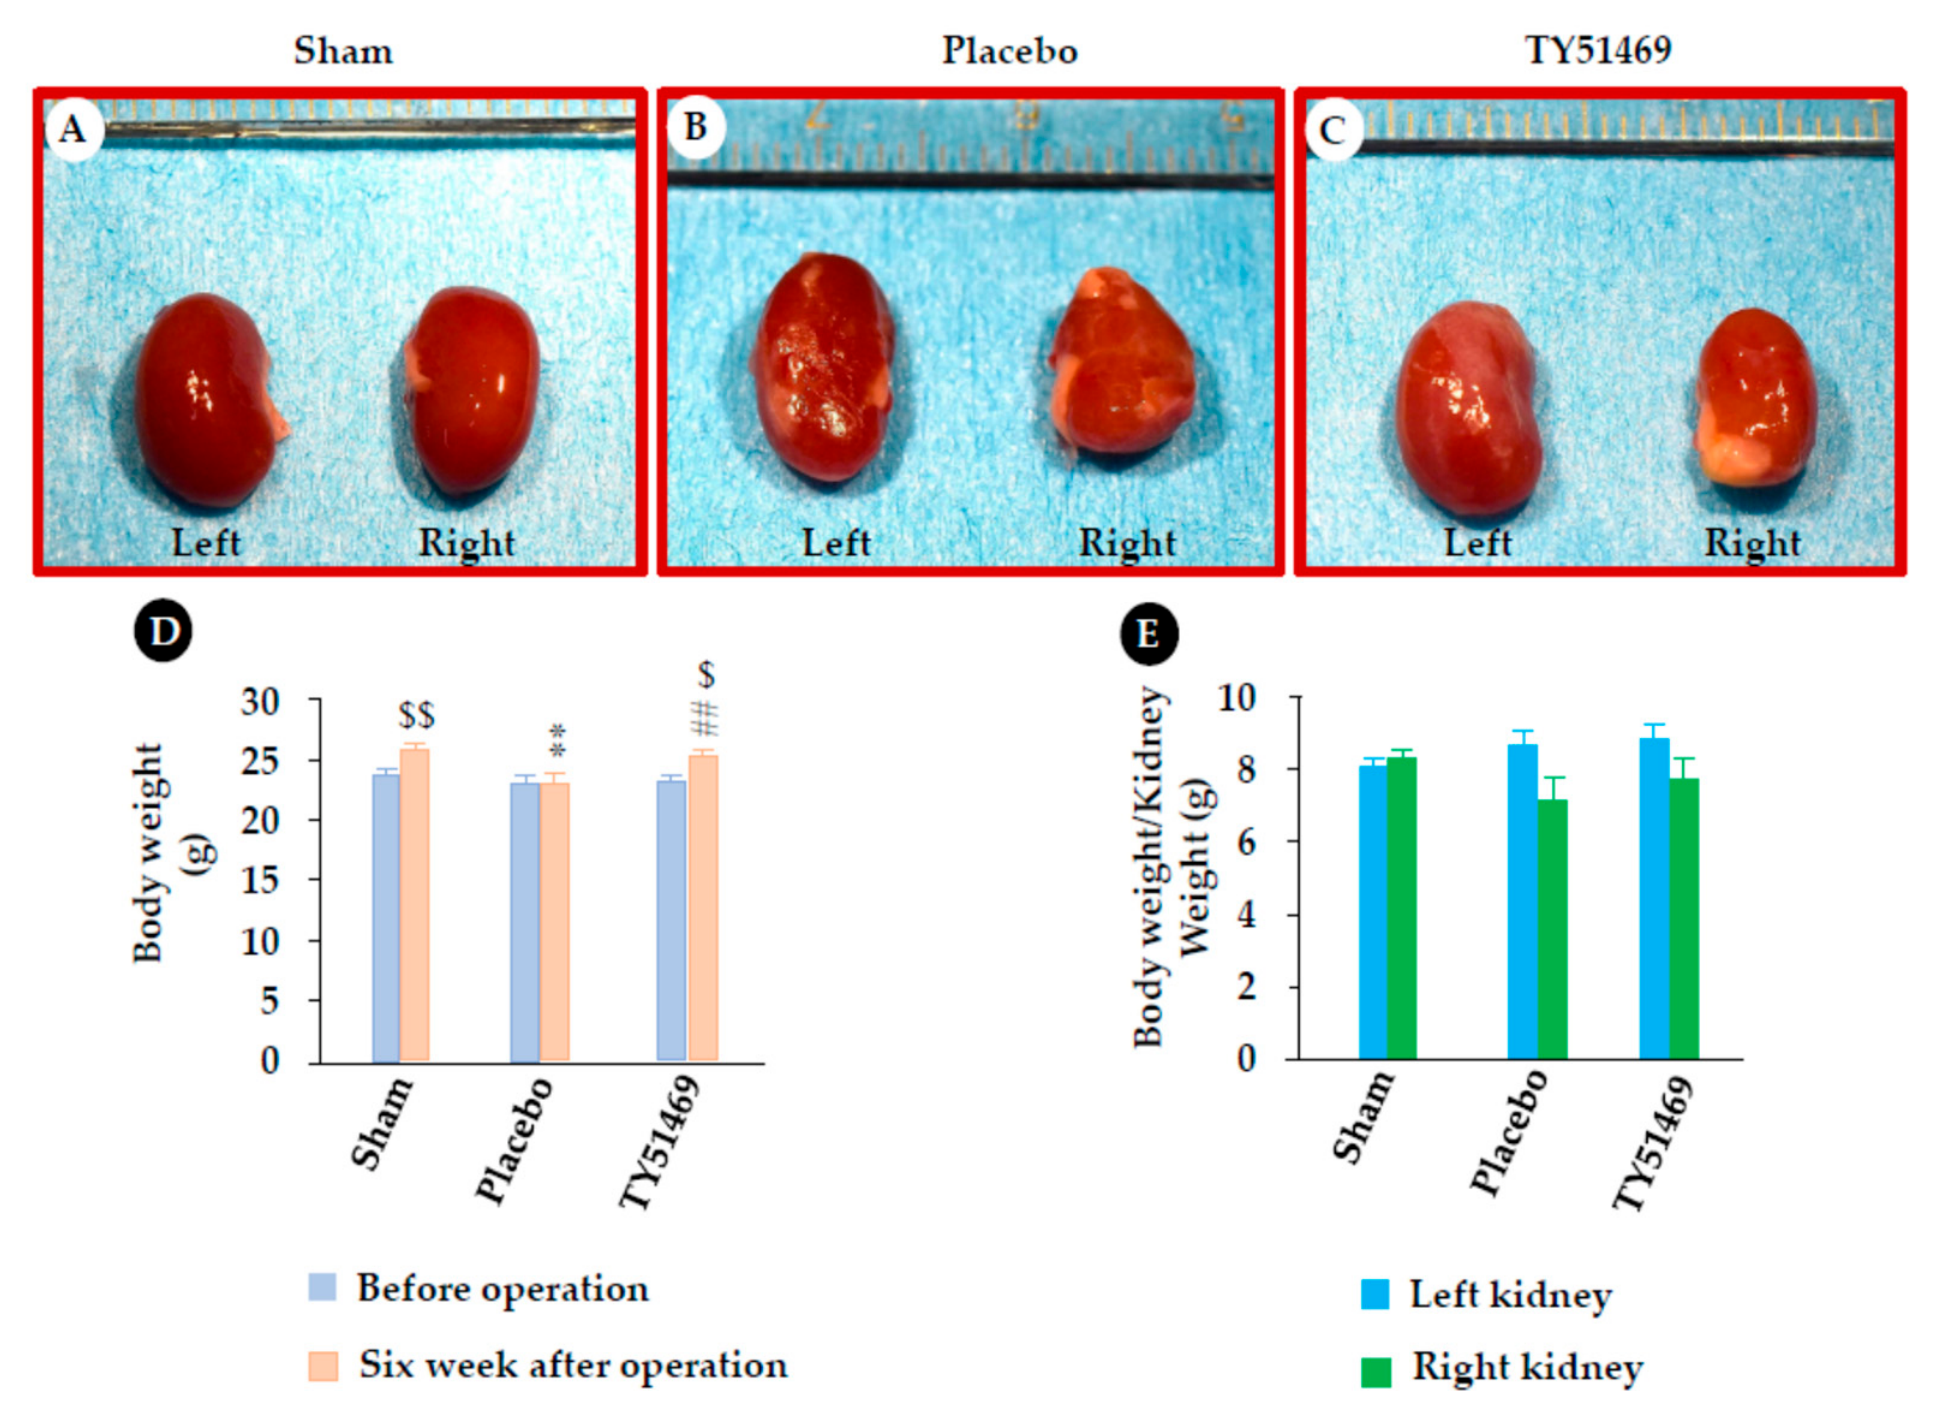
Figure 4.
Quantification of renal fibrotic areas. Representative images of Azan-Mallory-stained kidney sections from a sham-operated mouse (A) and I/R-injured mice treated with placebo (B) or TY51469 (C). Blue staining indicates collagen deposition. (D) Quantitative analysis of interstitial fibrotic areas in kidney sections from sham-operated mice and I/R-injured mice treated with placebo or TY51469. **p < 0.01 and ***p < 0.001 vs. the sham-operated group; #p < 0.05 and ##p < 0.01 vs. the placebo-treated group.
Figure 4.
Quantification of renal fibrotic areas. Representative images of Azan-Mallory-stained kidney sections from a sham-operated mouse (A) and I/R-injured mice treated with placebo (B) or TY51469 (C). Blue staining indicates collagen deposition. (D) Quantitative analysis of interstitial fibrotic areas in kidney sections from sham-operated mice and I/R-injured mice treated with placebo or TY51469. **p < 0.01 and ***p < 0.001 vs. the sham-operated group; #p < 0.05 and ##p < 0.01 vs. the placebo-treated group.
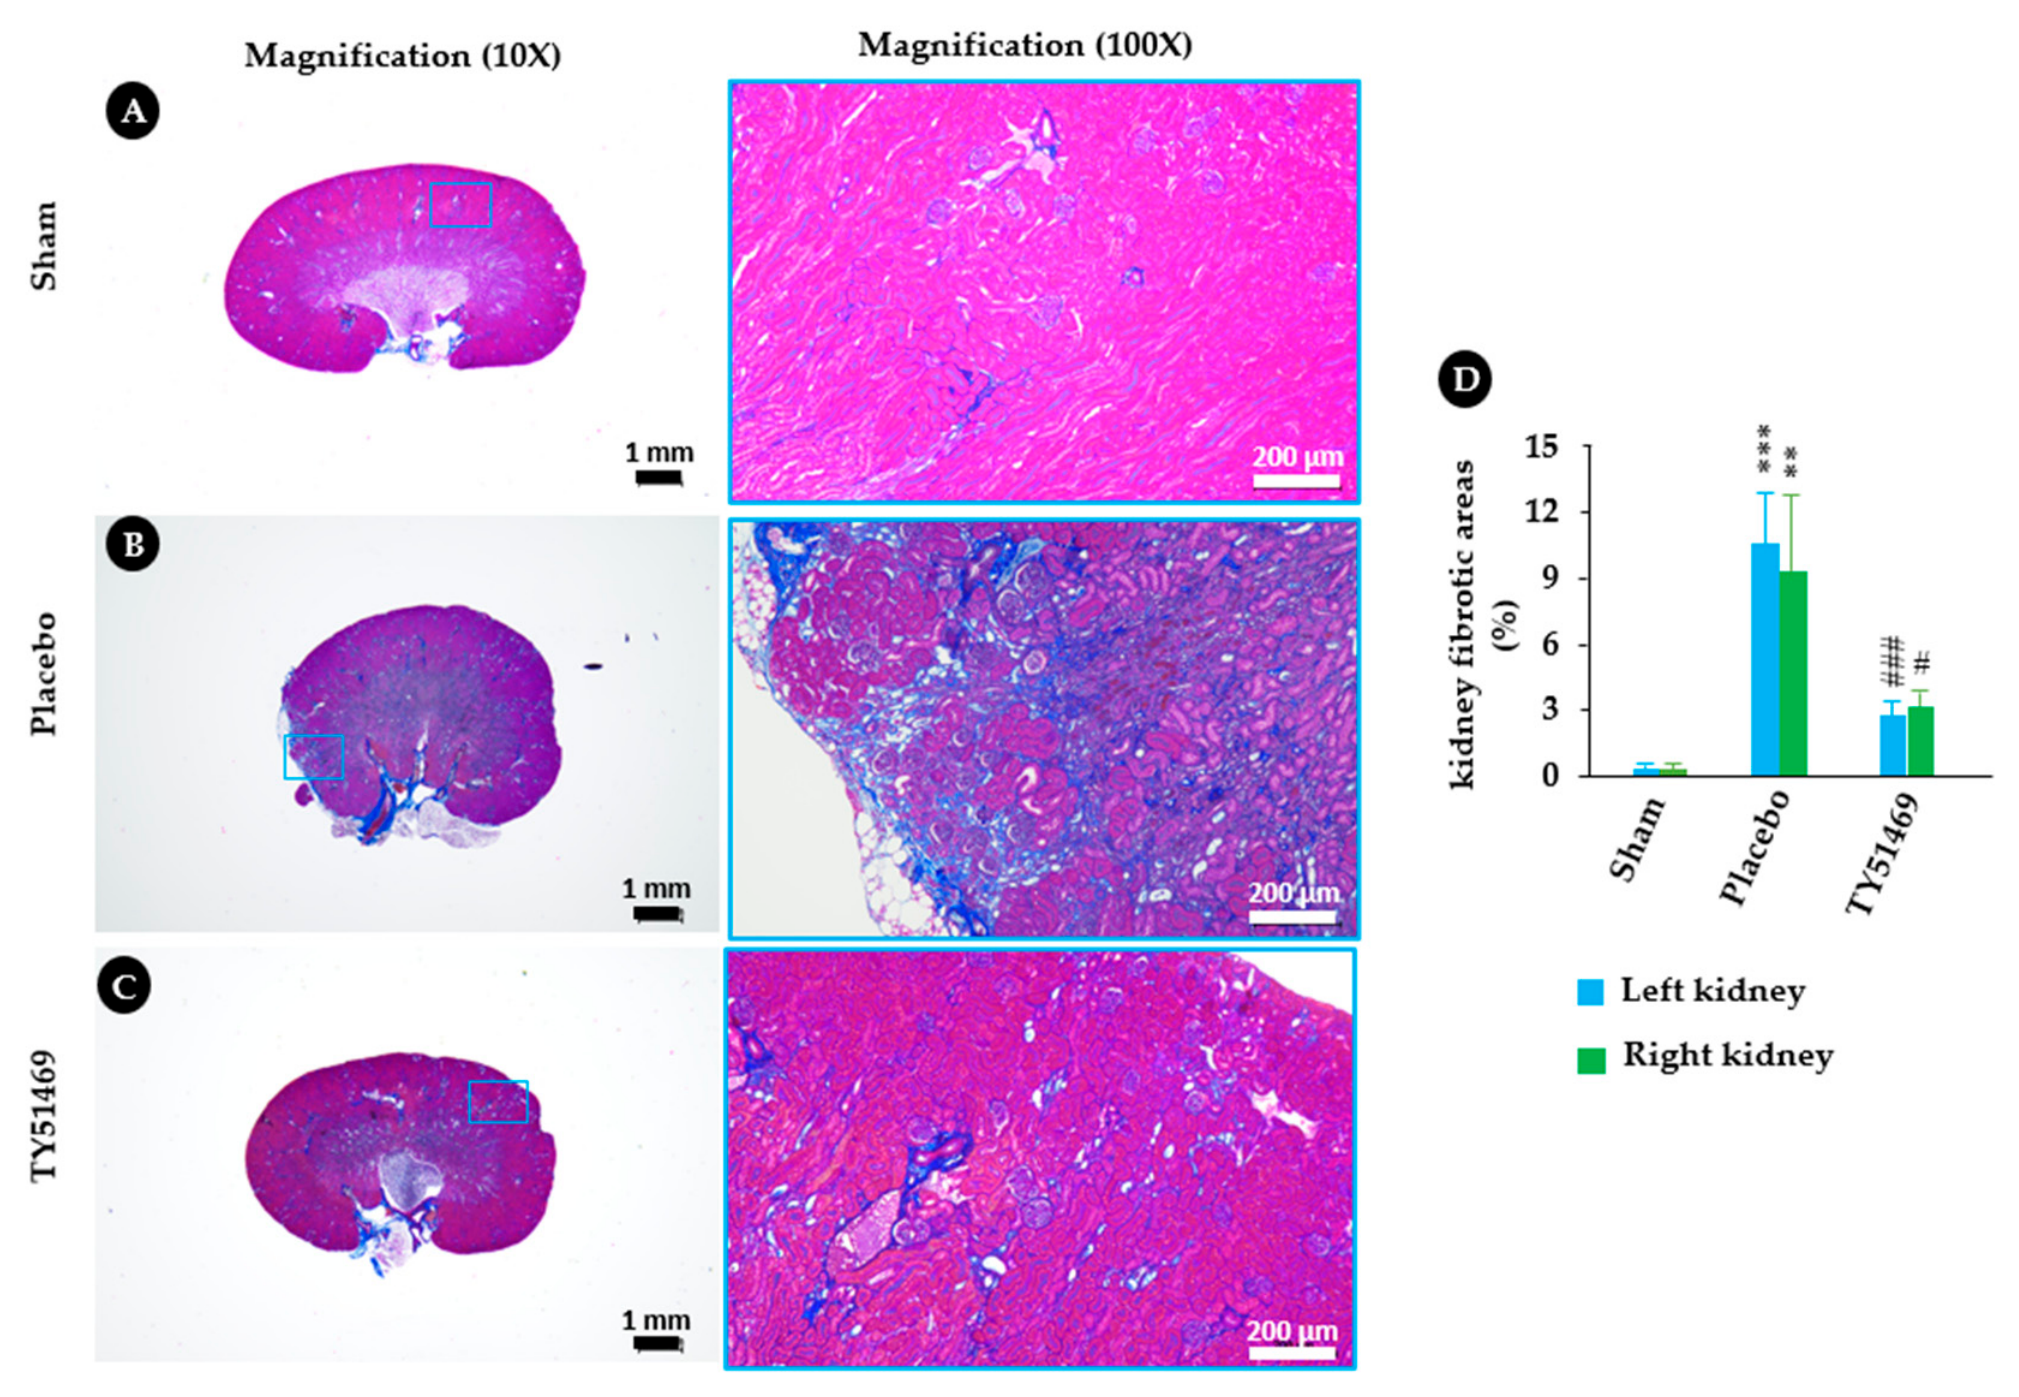
Figure 5.
Toluidine blue staining and MMCP-4 immunostaining Representative images of toluidine blue staining and MMCP-4 immunostaining in the kidneys from a sham-operated mouse (A) and I/R mice treated with a placebo (B) and TY51469 (C). Mast cells and MMCP-4-positive cells are indicated by green and black arrows. respectively.
Figure 5.
Toluidine blue staining and MMCP-4 immunostaining Representative images of toluidine blue staining and MMCP-4 immunostaining in the kidneys from a sham-operated mouse (A) and I/R mice treated with a placebo (B) and TY51469 (C). Mast cells and MMCP-4-positive cells are indicated by green and black arrows. respectively.
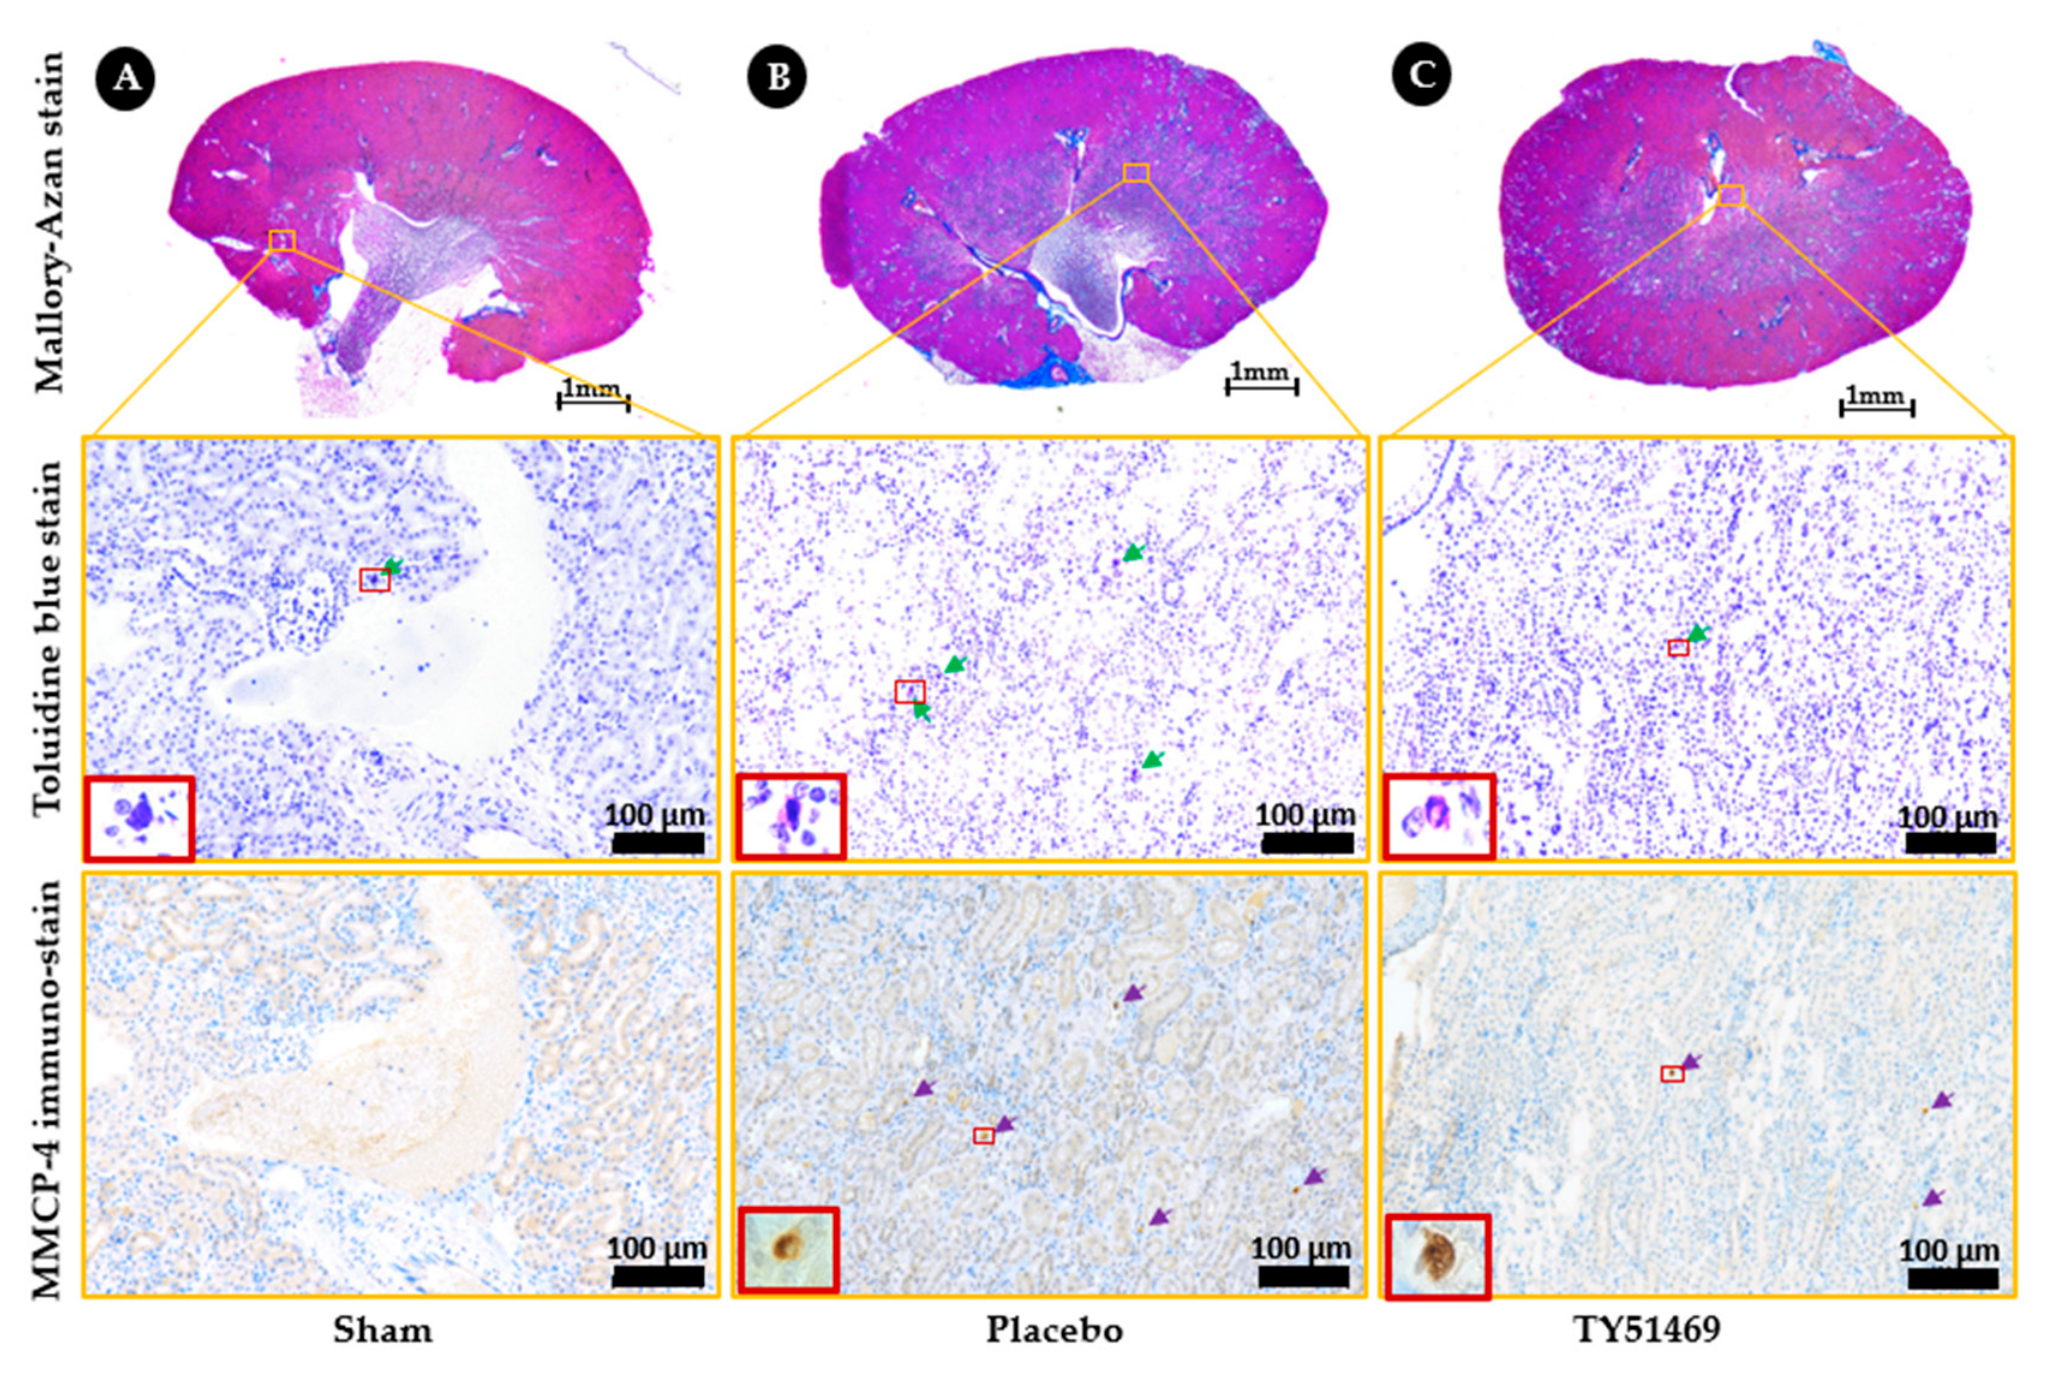
Figure 6.
Quantification of mast cells and MMCP-4-positive cells. A and B indicate quantification from the left and right kidneys, respectively. * p < 0.05 vs. the sham-operated group. # p < 0.05 vs. the placebo-treated group.
Figure 6.
Quantification of mast cells and MMCP-4-positive cells. A and B indicate quantification from the left and right kidneys, respectively. * p < 0.05 vs. the sham-operated group. # p < 0.05 vs. the placebo-treated group.
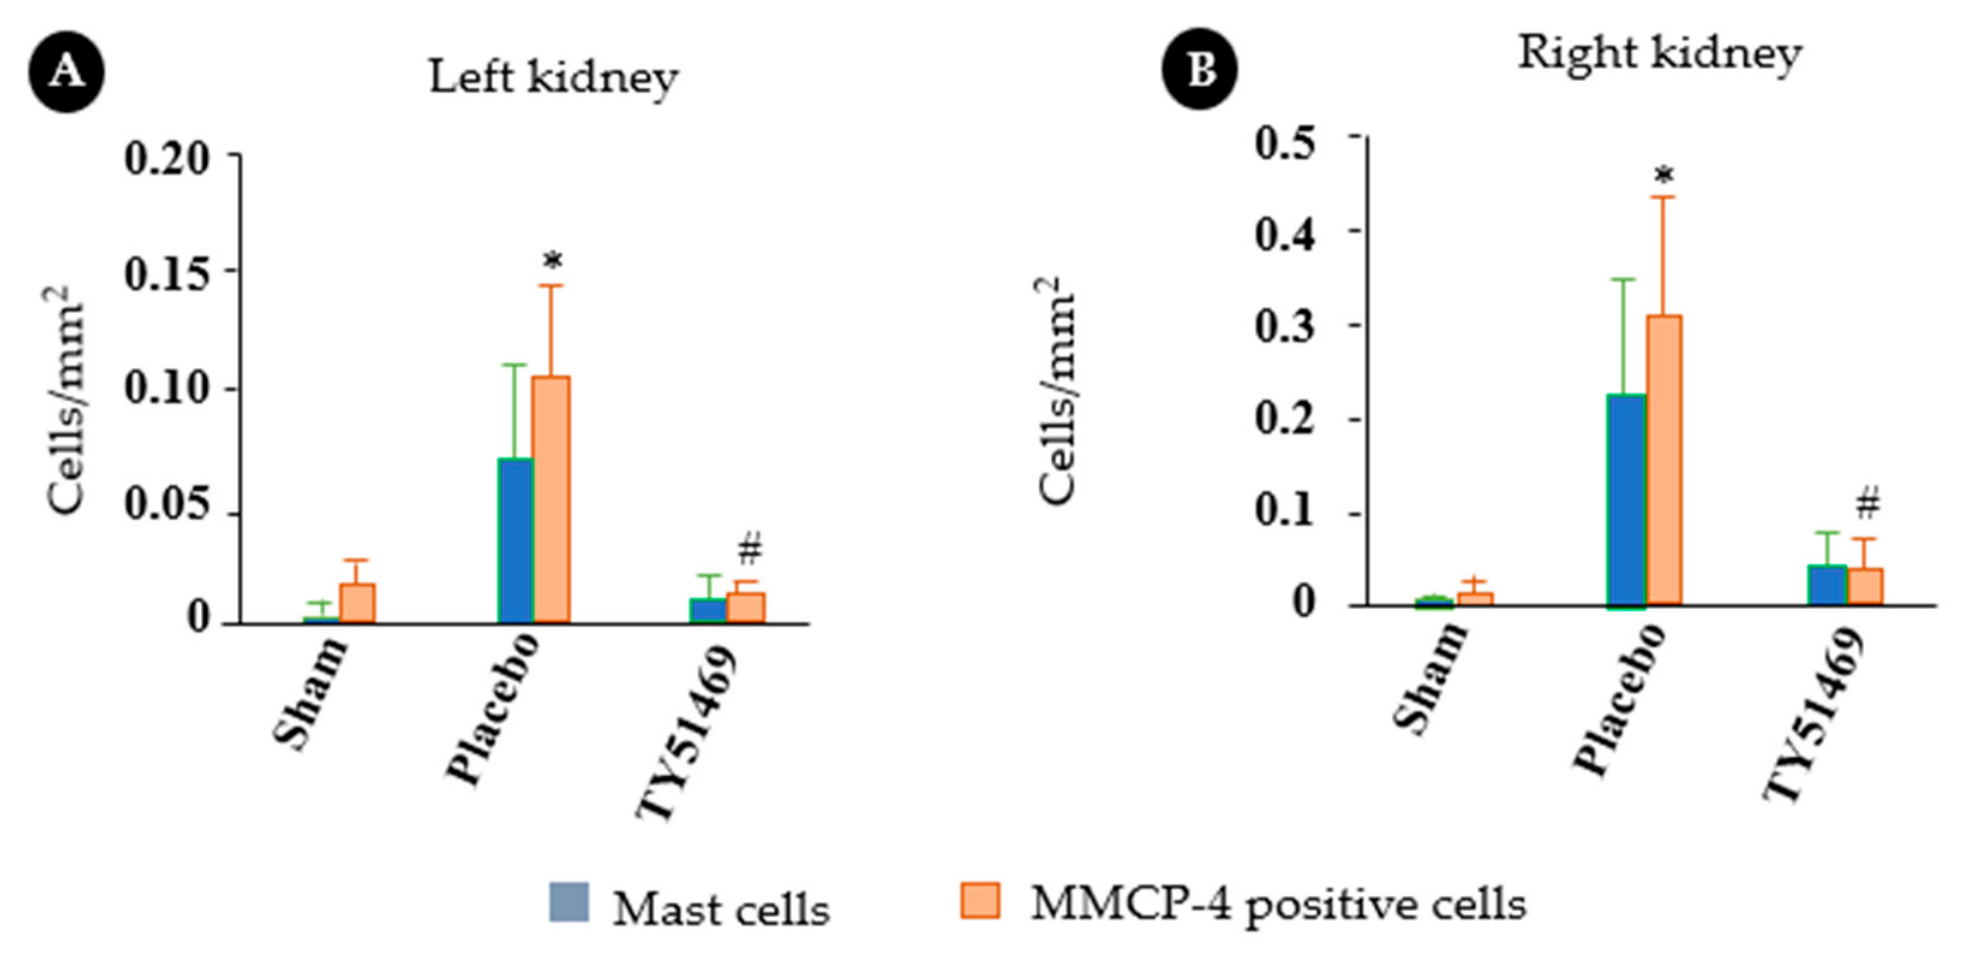
Figure 7.
Altered expressions of MMCP-4 and fibrosis- and inflammation-related genes after renal I/R injury. Changes in MMCP-4 (A), TGF-β1 (B), collagen I (C), MMP-9 (D), and TNF-α mRNA (E) expressions 6 weeks after the sham operation or I/R. * p < 0.05, ** p < 0.01 vs. the sham-operated group. # p < 0.05, ## p < 0.01 vs. the placebo-treated group. $p < 0.05, vs. the contralateral kidney.
Figure 7.
Altered expressions of MMCP-4 and fibrosis- and inflammation-related genes after renal I/R injury. Changes in MMCP-4 (A), TGF-β1 (B), collagen I (C), MMP-9 (D), and TNF-α mRNA (E) expressions 6 weeks after the sham operation or I/R. * p < 0.05, ** p < 0.01 vs. the sham-operated group. # p < 0.05, ## p < 0.01 vs. the placebo-treated group. $p < 0.05, vs. the contralateral kidney.
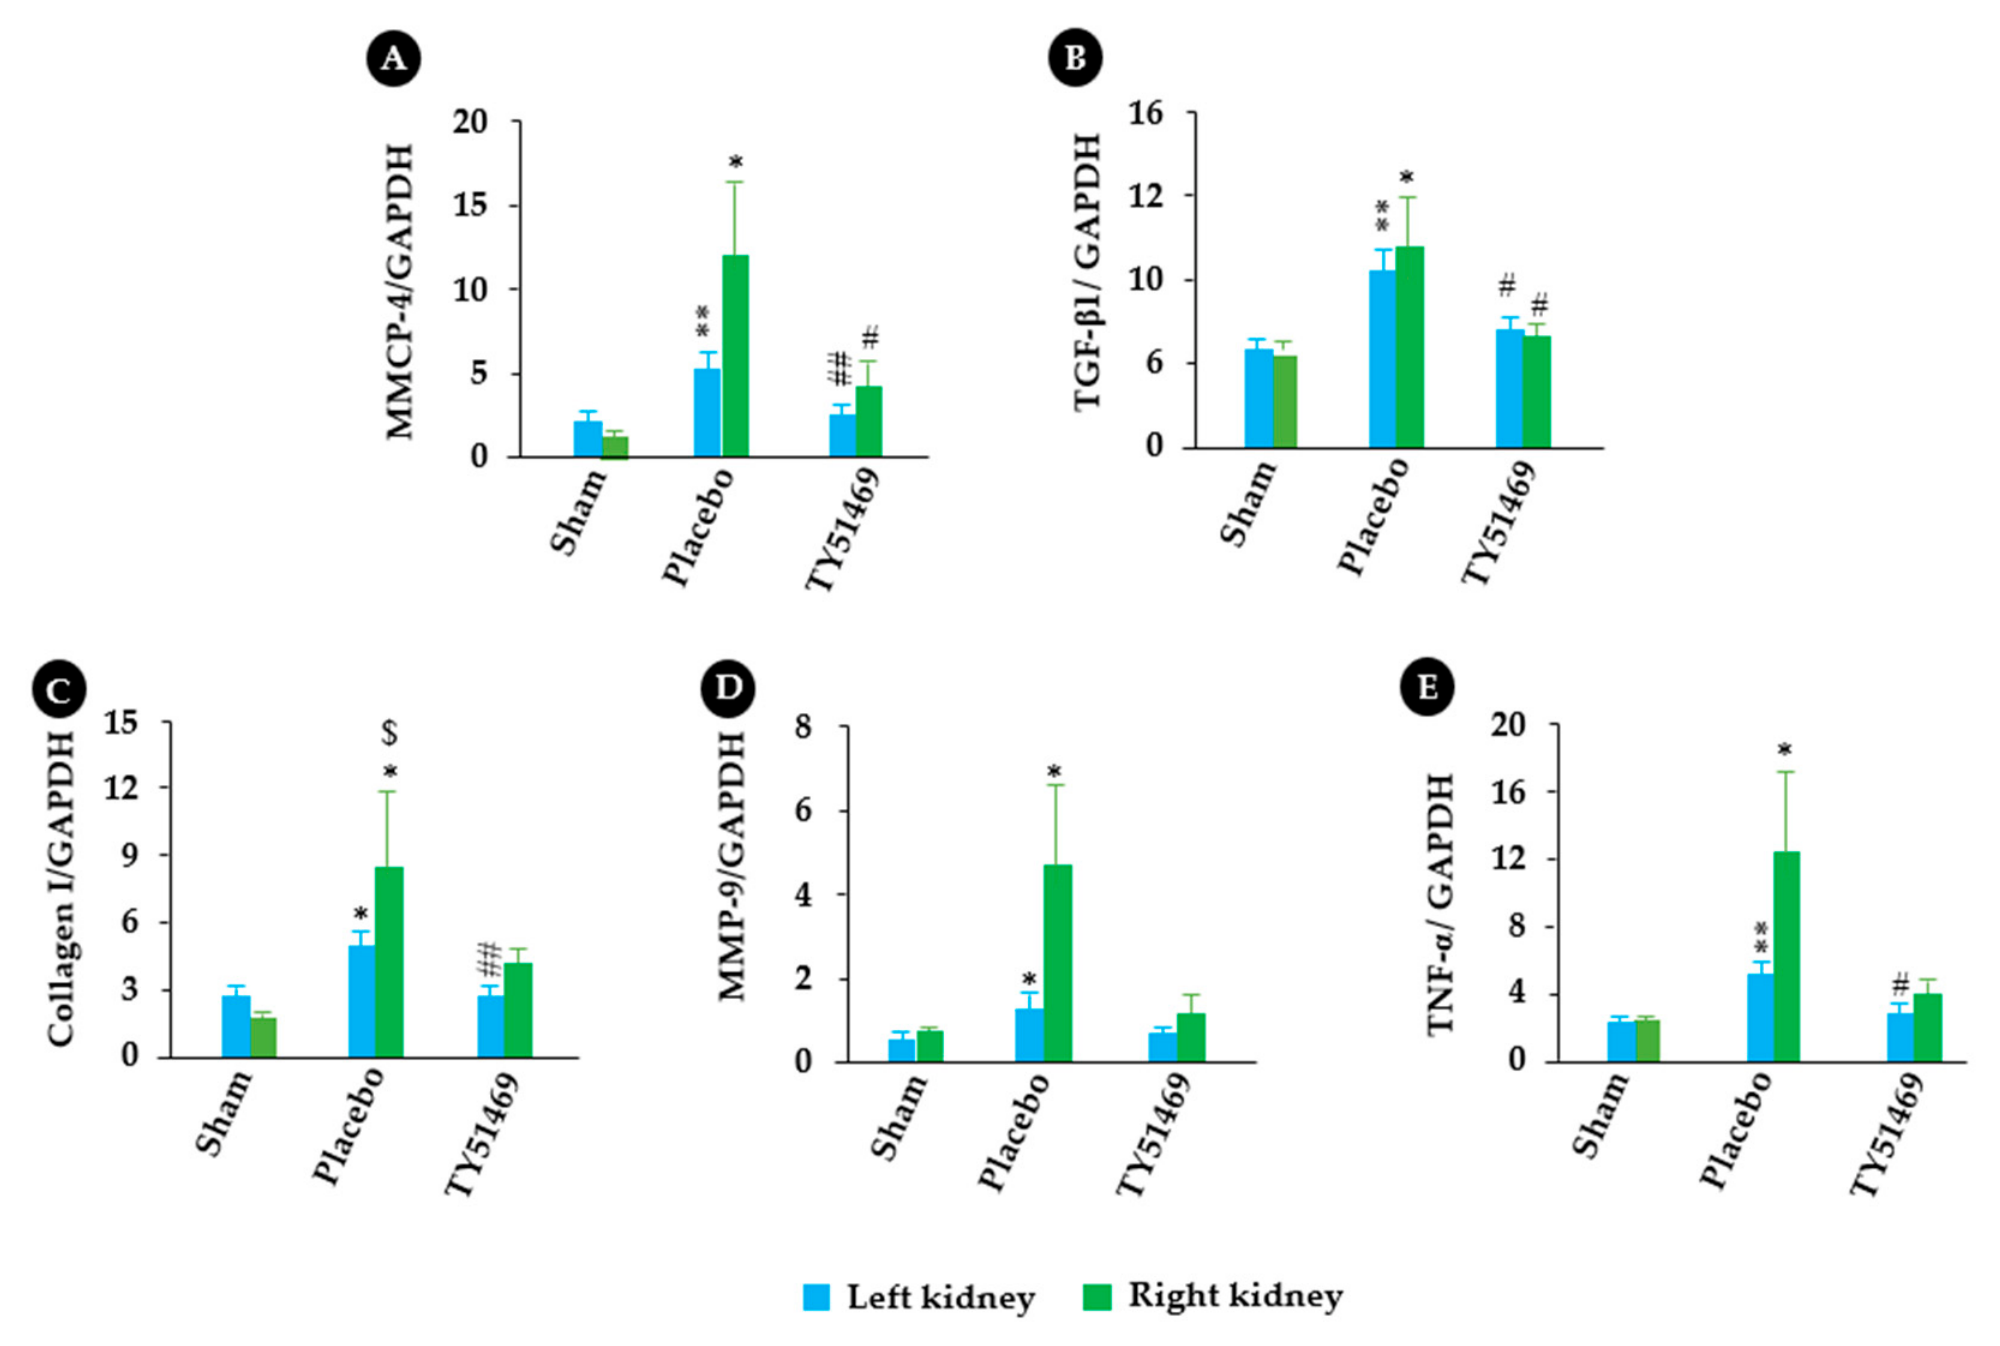
Figure 8.
Linear regression analyses of the relationships between MMCP-4 and TGF-β1, MMP-9 and TNF-α. (A) to (D) show correlations between MMCP-4 and TGF-β1, collagen I, MMP-9, and TNF-α mRNA levels in all examined kidneys 6 weeks after surgery.
Figure 8.
Linear regression analyses of the relationships between MMCP-4 and TGF-β1, MMP-9 and TNF-α. (A) to (D) show correlations between MMCP-4 and TGF-β1, collagen I, MMP-9, and TNF-α mRNA levels in all examined kidneys 6 weeks after surgery.
Disclaimer/Publisher’s Note: The statements, opinions and data contained in all publications are solely those of the individual author(s) and contributor(s) and not of MDPI and/or the editor(s). MDPI and/or the editor(s) disclaim responsibility for any injury to people or property resulting from any ideas, methods, instructions or products referred to in the content. |
© 2026 by the authors. Licensee MDPI, Basel, Switzerland. This article is an open access article distributed under the terms and conditions of the Creative Commons Attribution (CC BY) license (http://creativecommons.org/licenses/by/4.0/).
Copyright: This open access article is published under a Creative Commons CC BY 4.0 license, which permit the free download, distribution, and reuse, provided that the author and preprint are cited in any reuse.