

Submitted:
23 October 2026
Posted:
26 October 2026
You are already at the latest version
Abstract
We constructed a two-dimensional lightning location network, FULMO (Fuji-centered Lightning Monitoring), from Boltek LRX-1 receivers around Mt. Fuji in central Japan. These receivers observe lightning electromagnetic waves mainly in the very low frequency and low frequency (VLF/LF) band, and locations are obtained by time-of-arrival. Performance was evaluated against the Japanese Lightning Detection Network (JLDN). With six operational stations, the relative detection efficiency was 52.6% for JLDN cloud-to-ground (CG) strokes and 22.6% for intracloud (IC) discharges; the median location difference for CG strokes was 1.60 km. The difference depended strongly on station geometry: 0.85 km where the largest angular gap between azimuthally adjacent stations, as seen from the discharge, was <180°, and 6.53 km where that gap was ≥180°, the smaller value corre-sponding to discharges inside the group. Five features of the LRX-1 specification limit research use: the catalog carries a systematic timing offset of −0.99898 s requiring correction before catalog matching; it provides no quality index for the azimuthal distribution of contributing stations; it records only four station identifiers per location although more can contribute, leaving that distri-bution unknown; it does not discriminate CG from IC discharges; and it gives no polarity. We rec-ommend that the manufacturer address these points.
Keywords:
lightning detection
; lightning location system
; time-of-arrival
; LRX-1
; FULMO network
; detection efficiency
; location accuracy
; Mt. Fuji
1. Introduction
Lightning location provides essential information not only for atmospheric electricity research but also for lightning damage prevention, power system protection, aviation safety, and meteorological analysis. A lightning location system (LLS) estimates the position of a lightning discharge by receiving the electromagnetic waves radiated by the discharge (sferics) at multiple stations and using their arrival times or arrival directions [1]. Two-dimensional lightning location mainly relies on electromagnetic waves in the very low frequency (VLF, 3–30 kHz) and low frequency (LF, 30–300 kHz) bands, and the discharge position is derived from the geometrical relationship among the stations. The principal techniques are magnetic direction finding (MDF) [2], time of arrival (TOA) [3], and its variant, time of group arrival (TOGA) [4]. In the MDF method, the direction of arrival of the magnetic field vector is determined at each station, and the discharge position is obtained by triangulation from multiple stations [2]. In the TOA method, hyperbolic positioning is performed using the differences in the arrival times of the electromagnetic waves at stations synchronized by global navigation satellite system (GNSS) time. A combined TOA/MDF approach has been implemented in the U.S. National Lightning Detection Network (NLDN) [5].
Ground-based lightning location networks can be broadly classified, according to their coverage and mode of operation, into global networks operated on a worldwide scale, regional networks that cover a particular country or region at high station density, and low-cost networks operated for citizen science or research purposes. Well-known global networks include the World Wide Lightning Location Network (WWLLN), which uses VLF receivers [4,6], the Global Lightning Dataset GLD360 operated by Vaisala [7,8], the Earth Networks Total Lightning Network (ENTLN) [9], and the citizen-based network Blitzortung.org [10,11]. Representative regional networks in Japan include the Japanese Lightning Detection Network (JLDN) operated by Franklin Japan Corporation [12], the Lightning Detection Network system (LIDEN) of the Japan Meteorological Agency [13], and the regional lightning location networks operated by several Japanese electric power companies [14]. In central Japan, Chubu Electric Power operates its own lightning location system (LLS), Chubu Electric Power LLS, referred to here as CLLS [15]. In addition, the Fast Antenna Lightning Mapping Array (FALMA) operated by Gifu University [16] serves as a research network for mapping lightning channels.
Lightning catalogs generally provide the time of occurrence, the latitude and longitude, and the number of events as basic information. However, because they differ in the observed frequency band and location technique, they also differ in their ability to discriminate between cloud-to-ground (CG) and intracloud (IC) discharges, in whether estimated peak current and polarity are provided, and in their coverage and detection efficiency. In this paper, IC is used in a broad sense to denote all lightning discharges that do not reach the ground, including intracloud, intercloud, and cloud-to-air discharges. Most lightning location systems record individual return strokes or discharge pulses, whereas some organize their output into flashes composed of several strokes. Furthermore, the time assigned to a lightning event depends on how each system identifies a characteristic feature of the received waveform, such as a threshold crossing, peak amplitude, or group arrival, and how the propagation delay is accounted for when estimating the time of the discharge. These differences in timing definitions and processing require careful attention when catalogs are compared directly [4,7,8,10].
One way to construct a lightning location network of this kind at relatively low cost is to use commercially available receivers. Boltek Corporation develops low-cost lightning observation instruments, long-range detectors (e.g., LD-250 and LD-350), and LRX-1 used in the present study [17]. LRX-1 is a lightning radio receiver designed for network observation, and it transmits GNSS-time-stamped lightning observation data to a central server [18].
A lightning location network using Boltek LRX-1 has also been constructed in India. It is operated by the National Remote Sensing Centre (NRSC) of the Indian Space Research Organisation (ISRO) and is referred to as the Lightning Detection Sensor Network (LDSN) in later descriptions of the network. Taori et al. [19] reported an LDSN of 25 LRX-1 stations. Subsequent studies describe an expanded network comprising 46 stations across India at a spacing of about 200 km, in which the location is obtained by the TOA method and a stroke is recorded only when four or more stations detect it; IC discharges are not classified [20]. LDSN data have been used to characterize the occurrence of CG lightning over India and derive essential climate variables [19], and the catalog itself has been examined by comparison with WWLLN [21] and with the other lightning location systems available in India [22]. The most recent of these comparisons found that LDSN recorded fewer strokes than either of the two other networks evaluated, and that its detections were largely confined to peak currents between 5 and 45 kA [22]. The authors attribute the loss of the weaker strokes to the sensitivity threshold of the sensors and that of the stronger ones to the saturation of the signal.
In the present study, we installed Boltek LRX-1 lightning observation instruments in Japan and constructed a lightning location network centered on the area around Mt. Fuji, which we refer to as the Fuji-centered lightning monitoring (FULMO) network. The objectives of this study were to compare the initial observational data of the FULMO network with existing lightning location catalogs and evaluate the basic performance and the problems of a lightning location network based on LRX-1. Dates and times in this paper are given in coordinated universal time (UTC) in principle, with Japan standard time (JST) added where necessary.
2. Comparative Lightning Catalogs
WWLLN is a global lightning location network operated by the University of Washington [23]. It comprises more than 80 stations worldwide and detects sferics radiated by lightning discharges mainly in the VLF band; its receivers cover 100 Hz to 24 kHz [6]. The time and location of a discharge are normally determined when the same VLF waveform packet is detected at five or more stations, by means of the TOGA method combined with a minimization procedure [4,6]. A distinctive feature of the network is that location is possible without a globally dense station distribution; it is widely used for climatological analyses of global lightning activity, including that over the oceans, and monitoring lightning activity over wide areas [6]. Because the network relies on long-range VLF propagation, the detected events are biased toward discharges with relatively large radiated energy, and both the flash- and stroke-level detection efficiency [23,24] and the location accuracy [23] are limited compared with regional dense networks. In the present study, the WWLLN is treated as a global, sparse, wide-area lightning catalog and is used as one of the references for comparison with FULMO. Its performance has been assessed against a regional network taken as ground truth [23], and its detection efficiency has been mapped globally in relative terms [24]; thus, it offers a common basis for comparison. A result expressed relative to WWLLN can be set beside evaluations of regional networks elsewhere, which a comparison against the Japanese networks alone would not permit.
GLD360 is a commercial global lightning data service owned and operated by Vaisala, providing near real-time lightning data over the entire globe, including the oceans [8]. Its sensors are sensitive to frequencies ranging from approximately 500 Hz to 50 kHz, encompassing the VLF band, and GLD360 combines TOA and MDF measurements from its sensors to locate discharges [8]. At each sensor, a waveform recognition algorithm identifies specific characteristic features of the sferic waveform, and a propagation correction is applied to the measured arrival times of those features, so consistent arrival times are obtained over a wide range of distances and under various propagation conditions. An attenuation model is applied to the waveform amplitude to obtain an estimate of the peak current [7,8]. The dataset used in the present study provides the time of occurrence, the latitude and longitude, the estimated peak current, the polarity, and a classification into IC and CG discharges. GLD360 reports stroke-level events; although CG return strokes dominate in this frequency band, impulsive discharge processes accompanied by large radiated electric fields, such as preliminary breakdown, leader pulses near the ground, and in-cloud K changes, are also detected [25]. According to Vaisala Xweather, the current GLD360 achieves a median location accuracy of 1 km [26].
ENTLN is a total lightning network operated by Earth Networks and consists of more than 1800 sensors deployed in more than 100 countries [9]. Each sensor records wideband electric field changes over the range from 1 Hz to 12 MHz [27]. Lightning discharges are located by the TOA method using the arrival times recorded at several sensors, and each event is classified as a CG or an IC discharge on the basis of the features of the received waveform. The data provided include the time of occurrence, location, discharge type, polarity, and estimated peak current. An evaluation of the upgraded 2021 processor against Florida ground-truth data showed that 94% of detected natural CG return strokes were correctly classified as CG, while the median location error for rocket-triggered lightning strokes was 92 m [9].
Blitzortung.org is a community-based lightning location network operating in the VLF band, composed of receiving stations installed by volunteers, and it locates lightning discharges on the basis of the TOA method [10,11]. The hardware costs about 300 euros, since participants assemble and install it themselves [11]. This low cost has allowed a large number of stations to be set up: station identifiers had been issued up to 3324 by 8 October 2026, of which 1067 stations were in operation on that date [28]. Each receiving station transmits the arrival times of the sferics it has detected, together with its own position, to a server. The lightning locations computed there are made available to participants free of charge [10]. However, the polarity and peak current are not provided [11]. In Japan, the stations have been deployed mainly by the University of Shizuoka and the Shonan Institute of Technology; about 40 receiving stations were installed as of January 2023, not all of them active [11], and the public station list gave 63 operating stations in Japan on 8 October 2026 [28]. Kamogawa et al. [11] evaluated the relative detection efficiency and the location accuracy of the Blitzortung.org catalog over Japan by comparison with JLDN (described in the following paragraph). For summer lightning in the Kanto region around Tokyo, which is surrounded by receiving stations, they estimated the relative detection efficiency for CG strokes in the most recent cases to be approximately 90%. The location difference with respect to JLDN had a mean of 5.3 km and a median of 2.9 km [11].
JLDN, operated by Franklin Japan, is the principal lightning location network in Japan, and its 31 sensors deployed nationwide provide seamless coverage of the Japanese islands [12]. It locates lightning by combining MDF and TOA, and because the network is dense, six to seven sensors on average contribute to the location of a single discharge, so the detection efficiency is not readily degraded by the failure of a few sensors [12]. The main data provided are the time of occurrence, the latitude and longitude, the estimated peak current, the polarity, and a classification into IC and CG discharges. The order of a stroke within its flash is not provided. The nominal performance over the land area of Japan is a detection efficiency of 90% or better and a location error of 300 m or less [12]. The performance of the catalog has also been examined repeatedly against ground truth using lightning strikes to wind turbines. For winter return strokes associated mainly with upward lightning striking wind turbines on the Sea of Japan coast in the early 2010s, the mean location error was approximately 580 m and the detection efficiency was about 29% (19 of 65 return strokes) [29]. For negative downward lightning in summer, the mean location errors of the first and subsequent strokes were about 557 m and 316 m, respectively [30]. Propagation delay corrections were introduced in 2016 and 2021, and all sensors were upgraded to LS7002 in 2023 [31]. Corrections alone were shown to reduce the mean summer location error from 436 m to 310 m [32]. The most recent evaluation used as ground-truth lightning strikes to wind turbines was measured with Rogowski coils at a wind farm in southern Akita Prefecture, on the Sea of Japan coast of northern Honshu, between November 2021 and February 2025 [31]. The median location error was 164 m, and the detection efficiency for return strokes was about 85% (22 of 26) and 100% when the peak current was 5 kA or more [31]. The misidentification of IC discharges as positive CG strokes has also been evaluated, although only for the network as it was in the early 2000s, before the corrections and sensor upgrades described above. Among the events then detected by JLDN as positive CG in summer, 43% proved to be of IC origin, and about half were still of IC origin at about 30 kA [33]. Those above 35 kA were considered genuine positive CG strokes [33]. Because the characteristics of the catalog have been examined at this level of detail, JLDN was used as the reference catalog to evaluate the detection efficiency and location error of FULMO.
LIDEN, introduced by the Japan Meteorological Agency to support aviation safety, consists of lightning detection stations installed at 30 airports nationwide; its data are distributed publicly [34] and have been used for climatological studies of the lightning activity in Japan [13]. Each station receives the LF-band electromagnetic waves radiated by lightning discharges and transmits the waveform information together with a precise time of reception. According to the published specification, locations are obtained mainly by the TOA method using two to five stations, with MDF used in combination at some stations [34]. However, TOA and MDF are currently used in combination at all stations. In the detailed LIDEN dataset used in the present study, events are classified into isolated IC discharges, the onset, intermediate stages and end of IC flashes, and first and subsequent CG return strokes. Each event contains the time of occurrence and the latitude and longitude, while the stroke number and the estimated peak current, together with the polarity, are provided for CG events.
In Japan, nine electric power companies have their own regional lightning location networks for the design and protection of transmission systems [14]. Each of these networks is operated within the service area of the company concerned, and the data are compiled by service area [14]. In the Chubu region of central Honshu, CLLS is run by Chubu Electric Power. CLLS was upgraded to a network of ten Vaisala LS7001 sensors in 2010–2011, and an evaluation of its performance after site-error corrections has been reported [15]. The network comprised eleven sensors at the time of the present study. Lightning location systems of this type detect the electromagnetic field signal produced by a lightning discharge at two or more sensors and estimate the position and peak current of the discharge [15]. The commercial CLLS dataset obtained from Chuden CTI Co., Ltd. for the present study contains only CG discharges aggregated into flashes. In addition, stroke-level data including subsequent strokes were provided by Chubu Electric Power and were used in the analysis. As a regional network in central Japan, CLLS provides a useful point of comparison for assessing how well FULMO reproduces the lightning activity from the area around Mt. Fuji to the Chubu and Kanto regions.
FALMA is an LF-band lightning location system developed by Gifu University, and consists of an array of fast antennas installed at several sites [16]. Each site receives the signals radiated by lightning discharges in the 500 Hz to 500 kHz band [16]. The initial FALMA was built in Gifu in the summer of 2017, with 12 sites over an area of about 90 × 90 km2. By means of an improved TOA method, it achieved three-dimensional location of lightning channels in as much detail as a Lightning Mapping Array operating in the very high frequency (VHF) band [16]. Because the distances between successive return strokes within the same CG flash are mostly 25 m or less, its location accuracy is extremely high [16]. Subsequently, from December 2018 to March 2019, a 14-site FALMA was installed in the Hokuriku region on the Sea of Japan coast, and winter lightning was observed [35]. In November 2021, the network was reconfigured into a long-baseline network, in which three sites more than 100 km from the Hokuriku cluster were added to the existing Hokuriku sites. Thus, observations now cover a wide area. As the area covered has been extended, the sampling rate was lowered from 25 MS/s in the initial configuration to 10 MS/s in the Hokuriku winter observation and 1 MS/s in the present long-baseline configuration. This configuration enables wide-area two-dimensional lightning location. The located discharge sources can be grouped into flashes, and the peak currents of return strokes can also be estimated. The two-dimensional location results of FALMA used in the present study contain, for each located point, the time of occurrence, the latitude and longitude, the estimated peak current, the number of sites used for the location, an index of location accuracy, and the probability that the point is a return stroke (Prs). This return-stroke probability is given by a machine-learning classifier constructed from a large number of return strokes and IC discharge pulses with three-dimensional location information, and is used to discriminate between CG and IC discharges [36].
As described above, the lightning catalogs used for comparison fall into two groups: the global networks WWLLN, GLD360, ENTLN, and Blitzortung.org, and JLDN, LIDEN, CLLS, and FALMA, whose main target is Japan or central Japan. Of these, JLDN, GLD360, and ENTLN are commercial services, LIDEN is a public system operated by a government agency, and CLLS is an operational system run by an electric power company. All of them provide some or all of the time, location, polarity, peak current, and discharge type of lightning discharges in a relatively systematic manner [7,9,12,15,34]. WWLLN and Blitzortung.org, in contrast, have their strengths in wide coverage or in low cost, but in global-scale analyses, they are strongly affected by regional differences in detection efficiency and distribution of receiving stations [10,11,23,24]. FALMA, a research network for mapping lightning channels, can locate the detailed development of a discharge, but its coverage is limited to parts of Japan [16], and its location accuracy may decrease in areas outside the network of observing stations [35].
The FULMO network is a low-cost, research-oriented regional network using Boltek LRX-1, and its coverage is centered on central Japan and the Kanto region. In this study, these catalogs are used in stages according to the purpose of each comparison. Blitzortung.org and CLLS are used to obtain an overview of the observed lightning activity, and an event-based intercomparison is performed for the single case for which all nine catalogs, including FULMO, were available. JLDN, whose performance has been validated against ground truth in the greatest detail, is then used as the reference catalog against which the relative detection efficiency, location difference, time offset, peak current estimates, and apparent multiplicity of FULMO are quantitatively evaluated.
3. The FULMO Network
Boltek LRX-1 detects lightning activity by receiving electromagnetic pulses (sferics) radiated by lightning discharges, and consists of a receiving sensor called ANT-50 and a main unit that performs signal processing and communication. ANT-50 is housed in a cylindrical case 124 mm in diameter and 254 mm long [18]. Inside the case, a GNSS receiver for timing is mounted at the top, below it is an aluminum plate that serves as the electric field antenna, and below that are two orthogonally arranged magnetic field sensors with their amplifier circuits (R. Boll, Boltek Corporation, personal communication, 2026). ANT-50 thus receives both the vertical electric field and the two horizontal magnetic field components. The frequency band of reception is not stated explicitly in the documents released by the manufacturer. Taori et al. [19], who constructed an observation network using LRX-1, describe the sensor as operating over the range from 1 Hz to 30 MHz, a figure repeated in a later description of that network [20]. They further state that the signals used for locating discharges lie in the 5 kHz to 1 MHz band [19]. The reported frequency range of the signals used for lightning location spans the VLF and LF bands and extends into the lower part of the MF band. Because the electromagnetic radiation from return strokes is mainly in the VLF/LF band [1], FULMO was treated as a network that observes lightning electromagnetic waves in this band. Neither the frequency response within this range nor the bandwidth actually processed on the server has been disclosed. The timing accuracy of the GNSS receiver is 15 ns, the signal is acquired with a time resolution of 100 ns and an amplitude resolution of 12 bits, and the maximum detection range is stated to be 800 km [18].
At each station, the lightning electromagnetic signal is detected and time stamped, and the detected events are transmitted to a central server via the Internet. On the server side, lightning locations are determined using the TOA method by comparing the detection times recorded at several stations [18]. According to the manufacturer (R. Boll, Boltek Corporation, personal communication, 2026), lightning discharges occurring within a given area can be located by deploying at least four LRX-1 units around it. The document released by the manufacturer describes the location in the networked LRX-1 units as being based on differences in arrival time among several stations [18]. Therefore, lightning locations in the FULMO network were treated as being determined by the TOA method.
The lightning catalog provided by LRX-1 contains, for each lightning event, the time of occurrence, the latitude and longitude, the estimated peak current, the polarity of the discharge, and a classification as either an IC or CG discharge. However, when the data used in the present study were obtained, the functions for determining the polarity and discharge classification had not been implemented, and although these fields are present in the catalog, they carry the same value for every event. Therefore, only the absolute value of the peak current was used, and the discharges were analyzed without distinction between IC and CG events. The catalog also contains a numerical field named “error,” the definition and scale of which are not documented by the manufacturer. The times in the LRX-1 data are recorded with millisecond resolution.
Lightning locations are computed on a server, which manages the acquired data, from the detections reported by several LRX-1 units (Figure 1). In the present study, the location results were obtained from a server operated by Boltek Corporation (Figure 2). The server integrates and processes data transmitted from stations installed by multiple groups; thus, stations installed by other groups can, in principle, contribute to a lightning location solution. Because the electromagnetic waves from lightning discharges with a large peak current can propagate over long distances, such signals may also be detected at distant stations and incorporated into the location solution. The catalog records the identifiers of four stations for each location, and in the data used in the present study, these four were always FULMO stations that were in operation at the time. The number of these fields is fixed at four; however, the server display shows that more than four stations can take part in a single location solution (Figure 2). Therefore, the identifiers in the catalog are not necessarily the complete set of stations that contributed to the solution.
LRX-1 stations were installed and a lightning location network was constructed in Japan (Figure 2). In the initial stage of observation, the network was operated with five stations: Suzu and Komatsu (Ishikawa), Gotemba (Shizuoka), Koganei (Tokyo), and Tsukuba (Ibaraki). The network was then extended to seven stations by the addition of Sekigahara (Gifu) in February 2026 and Koriyama (Fukushima) in April 2026. The receiving sensor of the Tsukuba station was damaged by a nearby lightning discharge on 20 August 2024, and was replaced on 16 May 2026; therefore, throughout the periods analyzed in this paper, the Tsukuba station did not contribute to any lightning location solutions. With these stations, an initial network for lightning observation centered on the Chubu and Kanto regions has been established.
Japanese regional names are used in this paper as follows. The Hokuriku region denotes the prefectures of Niigata, Toyama, Ishikawa, and Fukui, which face the Sea of Japan and are well known for winter lightning. The Chubu region denotes the central part of Honshu, comprising the four Hokuriku prefectures together with Yamanashi, Nagano, Gifu, Shizuoka, and Aichi. When “Chubu region” is used without further qualification, it refers to Yamanashi, Nagano, Gifu, Shizuoka, and Aichi. The Kanto region denotes Tokyo and the prefectures of Ibaraki, Tochigi, Gunma, Saitama, Chiba, and Kanagawa. It contains the Tokyo metropolitan area, the most densely populated part of Japan, and the Koganei and Tsukuba stations lie within it. The Tohoku region denotes the northeastern part of Honshu, including Fukushima Prefecture, where the Koriyama station is located. The prefectural boundaries are shown in Figure 2.
4. Observed Lightning Activity
Existing lightning location catalogs were compared to provide an overview of the characteristics of the lightning activity observed by the FULMO network. The lightning data of Blitzortung.org were used for this first comparison. First, the spatial distributions of the lightning locations during July and August 2025 were compared. The result is shown in Figure 3. The lightning locations determined by FULMO showed a spatial pattern broadly similar to the distribution of Blitzortung.org. In the area surrounded by the stations, in particular, the distribution follows that of the existing catalog closely. During this observation period, five stations had been installed in the FULMO network, but the Tsukuba station was not contributing, so the effective number of stations was four. However, FULMO tended to detect fewer lightning events than Blitzortung.org in areas farther from the operating stations. In addition, FULMO produced a series of locations aligned approximately along a straight line southwest of the Japanese islands, with no corresponding feature in the Blitzortung.org distribution. These are considered likely to be erroneous locations. Such locations are known to arise when the geometry of the discharge and receiving stations is unfavorable [1], as it is for sources lying far outside the group of four operating stations.
Next, to examine the temporal variation in lightning detections by FULMO, two days with sustained lightning activity over several hours within the analysis area were selected: 26 July and 24 August 2025. The analysis area is the region around Mt. Fuji indicated by the dashed rectangle in Figure 3. First, the spatial distributions of the lightning locations on the two days were compared (Figure 4). The locations obtained by FULMO correspond broadly to those of Blitzortung.org and CLLS. Next, to compare the temporal variation of the number of detections in each catalog, the number of detections per hour within the same area was calculated (Figure 5). The hourly counts of FULMO varied in step with those of Blitzortung.org and CLLS, which shows that FULMO captures the temporal variation of the lightning activity. The number of detections by FULMO was smaller than that of Blitzortung.org; however, it amounted to 53.6% (1198/2233) of the Blitzortung.org detections on 26 July and 29.8% (574/1926) on 24 August. The corresponding percentages for CLLS were 65.8% (1469/2233) and 55.4% (1067/1926). As Blitzortung.org and FULMO do not distinguish between CG and IC discharges, all located points were counted. The CLLS dataset used here contains only CG strokes, so the percentages for FULMO and CLLS are not directly comparable.
In addition, the event-by-event correspondence between the lightning catalogs was examined using an approach based on Kamogawa et al. [11]. In this method, two lightning catalogs are matched as the same lightning discharge when the time difference and spatial separation are both within prescribed limits. Pairs are formed in order of increasing horizontal distance, and each event is used at most once, so the matching is one-to-one; this rule is applied in the same form throughout the present paper. Kamogawa et al. [11] identified corresponding events from the time difference alone using a threshold of 0.1 ms; the upper limit on the horizontal distance and the one-to-one rule are added here. In the present study, the events of FULMO and Blitzortung.org were first matched under the conditions of a time difference within 0.1 ms and a separation within 20 km. Under these conditions, no event in either catalog had a counterpart in the other. Because the FULMO catalog records the discharge time in steps of 1 ms, a window of 0.1 ms is in any case narrower than the time resolution of the catalog. When the condition on the time difference was relaxed while the separation was kept at 20 km, almost no corresponding events were found for windows of 1 ms or 10 ms. Even for 100 ms, the number of matches remained at about 1% of the FULMO detections. When the time difference was relaxed to 1000 ms, the number of corresponding events increased sharply to 71.3% (854/1198) of the FULMO detections on 26 July and 76.5% (439/574) on 24 August. The time differences between the two catalogs were then examined for the matched events. The time difference is defined as Δt = tFULMO − treference. Its median was −0.9992 s on 26 July and −0.9990 s on 24 August, which shows that the times recorded by FULMO are about 1 s earlier than those of Blitzortung.org.
These results show that the distribution of lightning discharges and the temporal variation of the lightning activity obtained with the FULMO network are broadly consistent with those of existing lightning location catalogs, but that a systematic time difference of about 1 s is present. The same offset was found on both of the days examined here, to within the 1 ms resolution with which FULMO records the time. The offset is examined event by event in Section 5 and refined with a large dataset in Section 6, and its origin and implications are discussed in Section 7.
5. Event-Based Intercomparison
To examine the characteristics of the FULMO lightning catalog in more detail, a case study was conducted for lightning activity that was observed simultaneously by several lightning location networks. In the present study, the lightning activity that occurred off the coast of Shizuoka Prefecture between 15:30 and 16:30 UTC on 23 January 2025, was analyzed. At that time, five FULMO stations had been installed, but, as described in Section 3, the Tsukuba station did not contribute to lightning location, leaving four operating stations. This case was chosen for two reasons. It was the only period for which all nine of the lightning location catalogs compared in this paper could be obtained together. In addition, the lightning activity was concentrated in time and space, which allows individual discharges to be identified reliably. The area in which that activity occurred lies outside the area enclosed by the four operating stations; however, the choice of the area was dictated by where the lightning occurred and by which catalogs could be collected, not by the geometry of the network.
The analysis area was set to the range 33–35° N, 137.5–139.5° E, indicated by the dotted rectangle in Figure 3. Lightning activity in this area was also observed by eight other lightning location networks: WWLLN, GLD360, ENTLN, Blitzortung.org, JLDN, LIDEN, CLLS, and FALMA. The spatial distributions obtained by these networks and FULMO are shown in Figure 6. The number of detections differs between networks, but their spatial patterns are essentially the same. The activity is confined to a zone some 100 km across, elongated in the east–west direction, in the southwestern part of the analysis area off the coast of Shizuoka Prefecture.
A total of 22 lightning events were detected by FULMO during this period (Table 1). Their correspondence with the CG strokes of JLDN was examined by the following procedure. As shown in Section 4, the times recorded by FULMO are about 1 s early. For each FULMO event, therefore, the JLDN CG strokes whose time difference lay within ±0.01 s of −1 s and whose horizontal distance was within 10 km were first taken as candidates. Fifteen events had such a candidate, in every case exactly one, and no JLDN stroke was the candidate of more than one FULMO event, so the correspondence was one-to-one. Because no event had more than one candidate, the distance-ordered rule of Section 4 selected the same 15 pairs. Outliers were then removed from the distribution of the resulting time differences. Events lying more than five times the robust standard deviation (SD; 1.4826 times the median absolute deviation) from the median time difference were excluded; one event was removed and 14 remained. The time difference of the excluded event was −0.99658 s, which lies 1.7 ms from the nearest of the other 14 values (−0.99827 to −0.99902 s). Its deviation from the median was 9.8 times the robust SD, the next largest deviation being 1.9 times. It is therefore considered to have been matched to a different lightning discharge. The 14 events that were used are shown in bold in Table 1. The time difference obtained from these events was −0.99867 ± 0.00020 s (SD). The SD of 0.20 ms is smaller than the 1 ms recording resolution of FULMO, indicating that the timing offset is consistently determined from these 14 matched events. When the FULMO data were corrected for this time difference, the correspondence in time between the FULMO events and the events of the other lightning location networks improved greatly. The location difference from JLDN was then 4.25 ± 1.66 km on average, with a median of 4.60 km and a maximum of 6.30 km. Because the activity occurred outside the area enclosed by the operating stations, the location differences and detection efficiencies obtained in this section are values for the outer fringe of the network and do not represent the performance within the area surrounded by the stations. The determination of the time difference is unlikely to be significantly affected at the 1 ms recording resolution, since a positional difference of about 6 km corresponds to approximately 20 μs in electromagnetic wave propagation time. The discussion in this section is accordingly limited to two points: determination of time difference and relative performance of the catalogs.
The matching procedure described in Section 4 was applied, with events considered matched when the time difference was within 1 ms and the location difference was within 20 km. For the catalogs of Blitzortung.org, CLLS, FALMA, ENTLN, LIDEN, GLD360, WWLLN, and FULMO, the relative detection efficiency and the location difference with respect to the CG strokes and, where applicable, the IC discharges of JLDN were calculated (Table 2). The time resolution of CLLS is 1 ms, comparable to the matching tolerance used here. Quantization of the CLLS time stamps may cause otherwise marginal matches to fall outside the ±1 ms time window, potentially leading to an underestimation of the relative detection efficiency of CLLS. As stated in Section 4, the matching is one-to-one and is independent of the order in which the catalogs are taken. The two analyses are counted on different bases. The case study above began from the 22 FULMO events and asked which of them had a JLDN counterpart, whereas Table 2 begins from the JLDN events and gives the fraction of them that each catalog matched. The tolerances also differ: 10 km and a window of ±0.01 s about −1 s in the case study, against 20 km and ±1 ms after the time correction used here. Matching in Table 2 was performed separately against the CG and IC catalogs of JLDN, so one FULMO location can be counted in both. The counts and location differences in Table 2 are accordingly not directly comparable with those of the case study.
The average multiplicity of the lightning discharges was also compared. The multiplicity is the number of strokes contained in a single flash, and it is an important parameter when the detection characteristics of lightning location systems are compared. However, flash-level information is not provided by all of the catalogs, and where it is provided, the criteria by which strokes are grouped into flashes differ between networks. Therefore, to compare the multiplicity between networks, the flash information of the individual catalogs cannot be used as it stands. In the present study, a common criterion was applied to all the catalogs, and the multiplicity was recalculated for each dataset from its own events, independently of the flash information that the dataset provides. Because FULMO and Blitzortung.org do not discriminate between CG and IC discharges, the clusters obtained do not necessarily correspond to physical CG flashes. Thus, multiplicity was an apparent multiplicity obtained under a common clustering condition. Specifically, the strokes of each catalog were taken in time order. A stroke was assigned to a flash already formed if it lay between 3 ms and 1 s after the latest stroke of that flash and within a horizontal distance of 10 km of it; when several flashes satisfied the condition, the most recent was taken. A stroke that satisfied the condition for no flash started a new flash. The lower limit of 3 ms was used for the following reason. The shortest interstroke intervals reported in accurate stroke count studies of negative CG flashes are of the order of 1 ms, but such short intervals are rare. A limit of 3 ms excludes only 0.06% of the lognormal interstroke–interval distribution fitted by Ballarotti et al. [37], for which the median is 59 ms and the SD of the natural logarithm of the interval is 0.92. Therefore, no genuine subsequent stroke is lost. In catalogs that do not discriminate between CG and IC discharges, events separated by only tens of microseconds are sometimes recorded. These may represent IC activity or closely spaced discharge pulses rather than separate subsequent return strokes, and they were therefore not grouped as subsequent strokes of the same flash. Calculated with this criterion, the average multiplicity was 1.59 for ENTLN, 1.54 for LIDEN, 1.47 for JLDN, 1.25 for GLD360, 1.21 for Blitzortung.org, 1.19 for CLLS, 1.18 for WWLLN, and 1.10 for FULMO. FALMA is treated separately below, because its CG points must first be defined by applying a threshold to the return-stroke probability. Two detection limitations affect this quantity in opposite senses. A catalog that misses subsequent strokes reports flashes with fewer strokes than they contain, which lowers the multiplicity below the true value [38]. A catalog that misses weak single-stroke flashes loses the flashes of multiplicity one, so the flashes that remain are weighted toward the multi-stroke ones and the multiplicity is raised. Therefore, the multiplicity of a catalog cannot be read on its own as a measure of its sensitivity. The multiplicity of ENTLN is larger than that of JLDN; the median peak current reported by ENTLN is also larger, 29.7 kA against 25.0 kA; and the proportion of flashes consisting of a single stroke is lower, 61.1% against 74.3%. These differences are consistent with ENTLN being less sensitive to weak single-stroke flashes.
The two-dimensional location results of FALMA carry a return-stroke probability Prs for each located point, as described in Section 2. The classifier is a random forest, and raising the threshold increases the proportion of the points classified as return strokes that are genuine, while reducing the proportion of genuine return strokes that are so classified [36]. In the present analysis area, about 92.5% of the located points have Prs = 0%, and the remaining points take a wide range of higher values. A threshold of Prs ≥ 50% was used for classifying a point as a CG discharge. Under this threshold, 48 FALMA points within the analysis area were classified as CG discharges, and counterparts were found for 44 of the 103 CG strokes of JLDN, that is, for 42.7% of them. The location difference was 4.65 km on average with a median of 4.69 km, and the median time difference of the matched events was +3.8 μs. This relative detection efficiency varies little for thresholds between 30% and 70%, being 45.6% for Prs ≥ 30% and 39.8% for Prs ≥ 70%, but it falls to 31.1% for Prs ≥ 90% and 17.5% for Prs = 100%. Conversely, the proportion of the FALMA points classified as CG discharges for which a counterpart was found in the JLDN CG catalog was almost constant at 90–92% for any threshold between 30% and 90%. In this analysis area, most FALMA points classified as CG discharges have counterparts in the JLDN CG catalog, whereas more than half of the CG strokes detected by JLDN are not identified as CG discharges by FALMA. Because both quantities are insensitive to the threshold over a wide range, the choice of 50% is not critical for the comparison made here. When the common criterion described above is applied to the FALMA points classified as CG discharges, the average multiplicity is 1.14, smaller than the 1.47 of JLDN and the 1.54 of LIDEN. Subsequent strokes often have smaller peak currents than the first stroke and may be preferentially missed or excluded by the Prs threshold, contributing to the lower apparent multiplicity. For FALMA, only the probability that a located point is a return stroke is provided; no information that would allow IC discharges to be classified systematically is given. FALMA also outputs a large number of located points along the development of a discharge, so the number of IC discharge events cannot be defined on the same basis as in the other catalogs. CLLS, for its part, provides only CG discharges. The relative detection efficiency for IC discharges is therefore not calculated for these two catalogs.
These comparisons show that the events of every catalog have counterparts in JLDN to some degree, but that the relative detection efficiency and the location difference vary considerably among networks. As described in Section 2, the detection efficiency and location accuracy of JLDN have been evaluated repeatedly in previous studies, which makes JLDN a suitable benchmark for comparative studies of lightning location data in Japan. In the next section, JLDN is used as the reference data, the timing offset determined above is refined with a large number of discharges, and the relative detection efficiency and relative location accuracy of the FULMO network are evaluated.
6. Detection Efficiency and Location Accuracy
In this section, the FULMO catalog is compared with JLDN as the reference. While Section 5 determined the timing offset from individual events examined by hand, and fixed it to within the resolution with which FULMO records time, this section refines that offset with a large number of lightning discharges and gives a statistical evaluation of performance. The lightning activity of 13 May 2026 was used, when it was vigorous over a wide area from the Chubu region through the Kanto region to southern Tohoku and a sufficient number of discharges were observed for the analysis. The analysis period was 03:00–04:30 UTC (12:00–13:30 JST), and the analysis area was in the range 35–38° N, 136–141° E, indicated by the solid rectangle in Figure 3. This area contains the group of FULMO stations. However, the geometry of the stations as seen from a discharge is not uniform even within this area (Section 7). At the time of this analysis, seven FULMO LRX-1 stations had been installed in Japan, but, as described in Section 3, the Tsukuba station did not contribute to lightning location, leaving six operational stations. In the case of 23 January 2025 analyzed in Section 5, four stations were in operation, so that the present analysis is an evaluation with a larger number of operating stations.
The two catalogs were matched by the procedure described in Section 4. The timing offset was first refined, starting from the value determined by hand in Section 5. A provisional correction of +0.99867 s was applied to the recorded times of FULMO, and the FULMO events were matched to the JLDN CG strokes with the horizontal distance kept within 20 km and the time window widened to ±5 ms. The 863 pairs so obtained gave a median residual time difference of −0.31 ms, which places the offset at −0.99898 s; windows of ±2 ms, ±3 ms, and ±10 ms give the same value to five decimal places. A bootstrap over the 863 values gives a standard error of 0.02 ms for the median, so a residual of 0.31 ms is well resolved. Such a residual is invisible in any single event, since FULMO records the time only to 1 ms, but it matters because the matching window is itself 1 ms. With the correction of +0.99867 s the matching gives 790 CG pairs and a median location difference of 1.82 km, whereas with +0.99898 s, it gives 835 pairs and 1.60 km. Since Section 5 and Section 6 examine different observation periods and event samples, the two estimates need not be strictly identical, and the offset derived directly from the present dataset was therefore used for the following analysis. In the analysis that follows, a pair was accepted when the time difference was within 1 ms and the location difference was within 20 km. The locations given by the two catalogs are shown in Figure 7, where only the CG strokes of JLDN are plotted.
With JLDN as the reference, the relative detection efficiency of the FULMO network was 52.6% (835/1586) for CG strokes and 22.6% (764/3380) for IC discharges. For the case of 23 January 2025, analyzed in Section 5, the corresponding values were 14.6% (15/103) and 5.3% (6/114), respectively. The relative detection efficiencies were therefore higher in the present case, consistent with the larger number of operating stations and with the analysis area containing the group of stations. The two cases also differ in season; thus, the contributions of these factors cannot be separated on the basis of this comparison alone.
The matching is one-to-one within each catalog comparison, so a FULMO location matched to both the CG and the IC discharge catalog of JLDN is counted in both. The 835 CG pairs correspond to 41.8% of the 1998 FULMO locations and the 764 IC discharge pairs to 38.2%. The two sets overlap: 23 FULMO locations are matched to a JLDN CG stroke and a JLDN IC discharge, so the 835 and 764 pairs involve 1576 distinct FULMO locations, or 78.9% of the 1998. This is the fraction of the FULMO output corroborated by an independent lightning location catalog; the remaining 21.1% have a counterpart in neither the CG nor the IC discharge catalog of JLDN. The unmatched locations may include locations of signals not originating from lightning, locations of genuine discharges that JLDN did not detect, and locations of discharges detected by both networks that did not satisfy the matching criteria. The last category includes processes within a flash other than the JLDN return stroke. Since FULMO does not discriminate between CG strokes and IC discharges, an IC pulse a few milliseconds from a CG stroke of the same flash can be located by FULMO yet fall outside the 1 ms window.
The location differences of the matched events were used to evaluate the positional agreement between FULMO and JLDN. With JLDN as the reference, the mean location difference (± SD) was 3.75 ± 3.94 km for CG strokes and 3.24 ± 3.96 km for IC discharges, with medians of 1.60 km and 1.26 km, respectively. The median location difference was smaller in the present case than in the case of 23 January 2025 analyzed in Section 5, for which the mean location difference for CG strokes was 4.25 ± 1.66 km and the median was 4.60 km. For both CG strokes and IC discharges, the mean was more than twice the median, indicating a distribution with a tail toward larger location differences. The distributions of the location differences are shown in Figure 8, and the spatial distribution for CG strokes in Figure 9. The location differences for CG strokes vary considerably within the analysis area: the median was 0.54 km in the Chubu region, where the discharges occurred within the area surrounded by the stations, and 7.30 km north of 37° N.
The peak current estimates were compared next. The FULMO catalog does not identify the polarity of an individual discharge, and it provides the peak current as an absolute value. Among the matched CG events, the peak currents estimated by FULMO for the 606 pairs with a maximum azimuthal gap smaller than 180° (defined in Section 7) were compared with those of JLDN (Figure 10). The FULMO estimates tended to be smaller than those of JLDN, and the two showed a positive relationship, although with considerable scatter. A regression with the intercept fixed at zero gives |IJLDN| = 3.18 IFULMO, with a 95% confidence interval of 3.04–3.32 for the slope and a coefficient of determination of 0.42. The zero-intercept model was used to obtain a simple multiplicative scaling factor; a regression with a free intercept yields an intercept of only +0.08 kA. Therefore, multiplying the peak current estimated by FULMO by 3.18 provides an empirical conversion to the scale of the JLDN estimates under the conditions examined here. This relation was derived for IFULMO values between 1.6 and 20.1 kA and should not be extrapolated beyond this range without further validation. The relation is therefore an empirical rescaling of the FULMO estimates onto the JLDN scale rather than a calibration against directly measured lightning currents. The relation was obtained only from events that matched JLDN CG strokes.
Of the lightning located by FULMO, 764 events were matched to an IC discharge of JLDN, so a substantial part of the FULMO output corresponds to IC discharges. The relative detection efficiency of 22.6% is nevertheless low compared with the 52.6% for CG strokes. Within the analysis area and period, JLDN detected 3380 IC discharges, about twice the 1586 CG strokes. The value of 22.6% is therefore the fraction of the JLDN IC discharges that FULMO matched, not the fraction of all IC discharges that occurred in the area, and the two cannot be related without an independent measure of the IC activity. This is attributed to the relatively weak radiation from IC discharges, which is less often detected at the minimum number of stations required for a location to be computed.
The values were treated as relative detection efficiencies because the number of discharges that actually occurred was not determined independently; for IC discharges in particular, the detection efficiency of JLDN itself is not established to the same degree, so the 22.6% cannot be read as a fraction of all IC discharges. The location difference was similar for the two types, with medians of 1.60 km for CG strokes and 1.26 km for IC discharges, consistent with LRX-1 locating a discharge purely from the differences in arrival time, without discriminating its type. This does not establish that the absolute location accuracy is the same for the two types, since the location accuracy of JLDN has been evaluated only for discharges with a known ground strike point.
These results show that, for the analysis area that contains the group of FULMO stations, the LRX-1 network detected about half of the CG strokes located by JLDN, with a median location difference of about 1.6 km for the matched events. This median is a statistic for the analysis area as a whole; in the Chubu region, where the discharges occurred within the area surrounded by the stations, it was 0.54 km. The relative detection efficiency was higher, and the median location difference was smaller, than in the case analyzed in Section 5. Nearly half of the CG strokes located by JLDN were nevertheless not matched by FULMO, and 21.1% of the locations reported by FULMO had no counterpart in either the CG or the IC discharge catalog of JLDN. Increasing the number of stations and optimizing the configuration of the network are expected to improve the detection performance of the LRX-1 network further.
7. Discussion
The systematic time difference of about 1 s noted in Section 4 was also observed in the comparisons with JLDN. Measured against Blitzortung.org, it was −0.9992 s on 26 July 2025 and −0.9990 s on 24 August 2025; measured against JLDN it was −0.99867 s for the events examined individually on 23 January 2025 (Section 5) and −0.99898 s for the 863 pairs of 13 May 2026 (Section 6). The Blitzortung.org values were obtained with a time window of ±1000 ms. Since the offset is itself close to −1000 ms, time differences on the negative side lay near the edge of the window, and the tail of the distribution there may have been affected. When the approximate correction is applied first and the two catalogs are then re-matched within ±5 ms, the values become −0.99933 s and −0.99926 s, and they are insensitive to the width of the narrow window. These four values span 0.66 ms, consistent with a nearly constant offset at the epochs examined between January 2025 and May 2026 and against both of the reference catalogs. No drift was resolved at this precision, although four epochs do not establish that the offset was stable continuously between those dates. The offset is close to an integer second with a small residual: taking the most precisely determined of the four values, the FULMO time stamps precede the corresponding JLDN time stamps by 0.99898 s, that is, by 1.02 ms less than one second. The stability of the offset points to a systematic feature of the way in which the event time is assigned or processed rather than to a random timing error. The manufacturer specifies a timing accuracy of 15 ns for the GNSS timing receiver of LRX-1 [18], which makes a random timing error on the millisecond scale implausible. However, that specification does not establish the accuracy of the time stamps in the final catalog, and it does not exclude an error of an integer second in the association of the GNSS time information with the recorded event. In a GNSS-timed instrument, the precise epoch and its second label are delivered by separate channels, the one-pulse-per-second output and the serial time message, and the convention that relates them differs between receivers. Pairing a pulse with the label of the adjacent second shifts every time stamp by exactly 1 s, while the nanosecond-level accuracy of the pulse itself is preserved. Omission of the GPS-to-UTC correction, by contrast, would amount to the 18 s by which GPS time currently leads UTC, whereas an incorrect integer value for that correction could produce an error of 1 s; the present data do not identify which, if either, of these mechanisms is responsible. The origin of the millisecond-scale residual likewise cannot be established from the present data. The algorithm of the server is not disclosed, so the cause cannot be identified from outside the system. The first of the recommendations made in Section 8 is accordingly that the time stamp be referenced to the discharge itself and that its definition be documented.
The lightning activity of 23 January 2025, used for the detailed comparison in this study, falls in winter by the calendar. In Japanese atmospheric electricity, however, the term winter lightning is most often used for the characteristic phenomenon observed on the Sea of Japan side of the Hokuriku region, whereas the analysis area of Section 5 lies off the Pacific coast of Shizuoka Prefecture. Its known features are a low cloud base [39,40], with the charge regions in the cloud lying at low altitude [41], a markedly high proportion of positive CG discharges [39,40], large peak currents (both positive [42] and negative [43]), large charge transfer [42], and a predominance of discharges with upward leaders from tall structures such as wind turbines [41]. Flashes consisting of a single return stroke also predominate, although this is a property that positive CG flashes show generally and is no more marked in Hokuriku winter thunderstorms than elsewhere [35]. Of these features, only two can be examined with the catalogs used here: the proportion of positive CG discharges and the magnitude of the peak current. Charge transfer, for which events exceeding 300 C with long continuing currents have been reported [41,42], is not measured in these catalogs, and the peak current is no substitute for it. The height of the cloud base and the occurrence of upward lightning from tall structures cannot be addressed at all, since the discharges occurred over the sea.
We consider first the polarity. The proportion of positive CG discharges is 36.9% for JLDN and 35.0% for LIDEN when counted by stroke, and reaches 42.9% for JLDN and 46.3% for LIDEN when counted by the first stroke of each flash. The figures for first strokes are larger because negative flashes tend to carry subsequent strokes while positive ones are often single [44,45], so counting by stroke understates the positive share. By either count, the proportion is far above the figure of about 10% for summer lightning in Japan and lies within the 30–50% reported for winter lightning [41]. The multiplicity points the same way. Under the common criterion, the 103 CG strokes of JLDN resolve into 70 flashes and the 103 of LIDEN into 67, giving average multiplicities of 1.47 for JLDN and 1.54 for LIDEN. Separated by the polarity of the first stroke, the average multiplicity is 1.20 for JLDN and 1.29 for LIDEN for positive flashes, against 1.68 for JLDN and 1.75 for LIDEN for negative ones. These are of the same order as the ranges that JLDN gives for Japan as a whole, 1.11–1.22 for positive and 1.55–2.40 for negative flashes [46], and as the 1.24 reported for the positive CG flashes of Hokuriku winter thunderstorms [35]. None of these reference values [35,46] was obtained with the common criterion used here. The values obtained without separating the polarities, 1.47 for JLDN and 1.54 for LIDEN, therefore lie between the two, and are drawn down by the large share of positive flashes rather than by anything unusual in either polarity taken alone.
We consider next the peak current. The median of its absolute value was 25.0 kA for JLDN, 23.9 kA for LIDEN, 25.6 kA for FALMA, and 29.7 kA for ENTLN, broadly consistent among the catalogs, although they do not necessarily contain the same events. What marks winter lightning, however, is not the median but the large currents in the tail. In JLDN, 20.4% of the CG strokes exceeded 50 kA and 6.8% exceeded 100 kA, the largest reaching 237 kA; in LIDEN, 22.3% exceeded 50 kA and 6.8% exceeded 100 kA, the largest reaching 292 kA. The extreme end of that tail was dominated by positive strokes: all seven JLDN strokes above 100 kA were positive, as were 16 of the 21 above 50 kA, while the largest negative stroke reached only 80 kA. The medians are correspondingly far apart, 40.5 kA for positive and 16.0 kA for negative strokes in JLDN. The tail is thus both heavy and dominated by positive strokes, consistent with the large positive peak currents reported for Hokuriku winter lightning [42]. Those medians are also close to the winter values obtained three decades earlier by direct magnetic-link measurements, 45 kA for positive and 17 kA for negative strokes [42], which suggests that the peak currents estimated by JLDN in winter are not systematically displaced from directly measured values.
These are the features of a single hour in a single area. The nine catalogs compared in Section 5 could be obtained together only for that hour and only for the sea area off Shizuoka Prefecture. Of the features of Hokuriku-type winter lightning listed above, only the polarity distribution and the upper tail of the peak current could be examined. In those two, the present case resembled Hokuriku-type winter lightning, but one hour is not a basis on which to characterize either the season or the region, and the comparison is offered as a description of the case rather than a conclusion. How winter lightning on the Pacific side should be classified remains an open question in understanding the lightning activity of Japan. The present case suggests that the question is worth pursuing, in that the discharges occurred on the Pacific side, far from the coast with which winter lightning in Japan is usually associated, yet they carried its polarity distribution and its large positive peak currents. A statistical examination based on cases accumulated over several years is needed. The continued operation of a regional network such as FULMO, combined with the existing lightning location catalogs, is expected to provide an observational basis for this question.
As shown in Section 6, the location difference relative to JLDN is not uniform over the analysis area, but differs greatly from place to place within it even for the same analysis day and the same configuration of stations (Figure 9). This difference can be explained by the azimuthal distribution of the stations as seen from the location of the discharge. With the position given by JLDN taken as the point of the discharge, the azimuth of each of the six operational stations as seen from that point is obtained in a planar approximation. In that approximation, the difference in longitude is scaled by the cosine of the latitude of the discharge. Great circle azimuths change the gaps by less than 1° and change none of the values given below. The azimuths of the six stations are sorted in ascending order, and the largest of the differences between neighboring azimuths, including the difference from the last azimuth back to the first across 360°, is called the maximum azimuthal gap. If the stations surround the discharge evenly, the azimuths are 60° apart and the maximum azimuthal gap is 60°. If, on the other hand, they are all seen in nearly the same direction, the rest of the circle is empty and the gap approaches 360°, the largest values in the present analysis being a little over 300°. The maximum azimuthal gap is thus a measure of how far the stations surround the discharge, a smaller value meaning a configuration better suited to location. When the maximum azimuthal gap is obtained for each location, a clear relation with the location difference is found (Figure 11). Where the maximum azimuthal gap is below 180°, the median location difference is 0.85 km and shows no trend with the gap. Above 180°, in contrast, it jumps to 6.53 km and then increases monotonically with the gap, from 5.44 km for 180–210° to 9.35 km for 270–300°. A maximum azimuthal gap above 180° means that the discharge lies outside the area enclosed by the stations; a gap of 180° or less means that it lies inside. The jump at 180° therefore marks the point at which the discharge leaves the station group, beyond which the arrival-time differences constrain the location less well.
This measure is similar in concept to the maximal circular gap (MCG) that Blitzortung.org uses in deciding whether to accept a location. MCG is the largest angular gap between neighboring stations that received the signal, as seen from the discharge, and a location is accepted when it is smaller than 270° [11]. The catalog used here does not record the full set of contributing stations, so the quantity used in this study is calculated instead from the six FULMO stations that were in operation; it would be MCG itself if the catalog recorded the stations that received the signal. Kamogawa et al. [11] attribute the relatively small number of Blitzortung.org detections outside the areas where its receiving stations are dense to the MCG condition, and note that a smaller MCG would increase the number of such detections; the value of 270° is thus a compromise that retains detections at wide gaps. The present results show what that compromise buys: the location difference changes sharply at 180°, the angle at which the discharge passes outside the group of stations, so a criterion of 270° deliberately admits locations from outside that group. The comparison of peak currents in Section 6 was accordingly restricted to the 606 pairs with a gap below 180°. However, the scaling factor itself was insensitive to that restriction: it was 3.14 for all 835 pairs against 3.18 for the 606. This does not mean that the individual estimates are equally accurate; the peak current estimated by LRX-1 is presumably derived from the received amplitude and the distance to the location, and within the range examined here, the station geometry affected that estimate less than it affected the location difference.
The maximum azimuthal gap was calculated from the six FULMO stations that were in operation at the time. The catalog records four station identifiers for each location. In the case of 23 January 2025, when four stations were in operation, these account for all the FULMO stations that were operating, and the same four identifiers were recorded for every one of the 22 lightning locations; however, the catalog does not exclude a contribution from a station operated by another group. In the case of 13 May 2026, six stations were in operation while only four identifiers were recorded, so the geometry of the stations actually used for an individual location is not known. The six operational stations are therefore taken as the best available approximation to it. The identifiers that the catalog does record are nevertheless informative. A compilation of these identifiers showed that the four identifiers recorded for every location in both of the cases analyzed are those of FULMO stations, and that the Tsukuba station never appears among them. A fault at a station is hard to notice from the location results that the server produces, and the fault at the Tsukuba station was found late in the present study. Compiling at regular intervals the identifiers that the catalog records is a simple and effective means of quality control, by which a user can follow the operating status of the network.
8. Conclusions
A lightning location network named FULMO was constructed from Boltek LRX-1 receivers and its initial performance was evaluated in Japan. FULMO broadly reproduces the spatial distribution and temporal variation of the lightning activity within the observation area.
The catalog carries a systematic timing offset of −0.99898 s, determined here to within 0.02 ms, which must be corrected before its events can be matched with those of other networks. With JLDN as the reference and six stations in operation, the relative detection efficiency for CG strokes was 52.6% and the median location difference was 1.60 km, against 14.6% and 4.65 km in the earlier case with four operating stations. The two cases differ in season, kind of lightning activity, and analysis area, so the improvement is consistent with both the larger number of operating stations and a more favorable observation geometry. For the 606 pairs obtained under favorable geometry, the absolute value of the JLDN peak current was proportional to the FULMO estimate, |IJLDN| = 3.18 IFULMO (R² = 0.42), so an empirical conversion between the two scales is possible.
The location difference varies greatly within the analysis area: the median is 0.85 km where the maximum azimuthal gap seen from the discharge is below 180°, and 6.53 km where it is 180° or more. In adding stations it is therefore important not simply to increase their number but to place them so that the target area falls inside the group; the present network does not satisfy this condition over the whole of the analysis area.
Two features of the catalog could not be explained: the linear artifact in the distribution of locations noted in Section 4, and the 21.1% of FULMO locations with no counterpart in either the CG or the IC catalog of JLDN. Neither can be attributed to the timing offset, and the data available here do not identify their origin.
On the basis of these results, five recommendations are made to the manufacturer concerning the specification of LRX-1. The first concerns the way the event time is recorded. The systematic time difference of about 1 s found in this study took nearly the same value at four epochs spanning 16 months, behaving as a fixed quantity rather than a drift. As discussed in Section 7, the present data do not allow locating its origin, and an error of an integer second in the handling of the GNSS time information is among the possibilities. If the catalog provided an accurately UTC-referenced time stamp for each lightning discharge, with its definition documented, the empirical correction applied by users would become unnecessary.
The second concerns the calculation and provision of the maximum azimuthal gap. A measure equivalent to MCG [11] that Blitzortung.org uses in deciding whether to accept a location could be calculated on the server of LRX-1, which necessarily knows which stations contributed to each location even though the catalog does not record the complete set. That measure could then be attached to each location as a quality index. If a threshold on it could be set by the user, locations obtained under poor geometrical conditions could be excluded at the user’s discretion. The results of this study show that 180° is an effective guide for such a threshold.
The third concerns the discrimination between CG strokes and IC discharges. The present LRX-1 catalog does not distinguish the two, so a comparison with other catalogs has to be made against both, and the performance for each type cannot be evaluated from the FULMO catalog alone. The receiver responds to both; however, 764 of the FULMO locations were matched to IC discharges of JLDN, 22.6% of those that JLDN reported. A field for the type of discharge (named “striketype”) is already present in the catalog, so the classification appears to be intended; what is missing is the function that would populate it. Its early implementation would add considerably to the research value of the catalog.
The fourth concerns the polarity. Only the absolute value of the peak current was available in this study, so the proportion of positive discharges, which is a characteristic of winter lightning, could not be obtained from FULMO alone. A field named “polarity” is also already in the catalog and empty. Polarity is defined for a CG stroke, so this recommendation depends on the third. Both need the same thing: a classification made from the received waveform. The fields are already there; only the classification has to be written and the fields filled. The size of the peak current also needs work. The values reported by LRX-1 were about a third of those of JLDN, so they are not on a real current scale. JLDN has been checked many times against directly measured currents [29,30,31], so the LRX-1 estimates can be calibrated against a network of that kind, and this should be done soon.
The fifth concerns the record of the stations that contributed to each location. The catalog does record station identifiers, which allows a user to follow the operating status of the network, and this part of the specification should be retained. The number of these fields is fixed at four; however, more than four stations can take part in a single location. Thus, the identifiers that are recorded are not necessarily the complete set of the contributing stations. The set of stations that determined an individual location is therefore unknown, so a measure such as the maximum azimuthal gap cannot be evaluated location by location. This is what led us to approximate it by the stations that were in operation. The identifiers of all stations that contributed to a location should accordingly be recorded. If these improvements are realized, the research value of lightning location networks built from LRX-1, FULMO among them, will increase further.
Author Contributions
Conceptualization, M.K., T.Su., and Y.O.; methodology, M.K. and H.F.; software, M.K., T.Su., and H.F.; validation, M.K., T.Su., and H.F.; formal analysis, M.K. and H.F.; investigation, M.K., T.Su., H.F., Y.O., K.M., A.M., T.K., T.N., M.Y., T.Sh., K.Y., S.H., and H.O.; resources, M.K., T.Su., Y.O., A.M., T.K., T.N., K.Y., S.H., T.W., and D.W.; data curation, M.K. and T.Su.; writing—original draft preparation, M.K. and H.F.; writing—review and editing, M.K., T.Su., H.F., Y.O., T.W., and D.W.; visualization, M.K. and H.F.; supervision, M.K.; project administration, M.K. and T.Su.; funding acquisition, M.K., T.Su., Y.O., A.M., and D.W. All authors have read and agreed to the published version of the manuscript.
Funding
The installation of receiving stations around Mt. Fuji was supported by JSPS KAKENHI Grant Numbers JP20H02419, JP24H00269, JP25H00781, and JP26H02186. The installation of receiving stations in the Hokuriku region was supported by the cooperative research program of the Institute of Nature and Environmental Technology of Kanazawa University (16004, 17008, 18013, 19018, 21067, 23060, 25051). This study was also supported by the WNI WxBunka Foundation through its Meteorology and Technology R&D Grant Program in Asia and Pacific Region (2026–2027) (M.K., K.M., and H.O.).
Data Availability Statement
The FULMO lightning catalog generated in this study is available from the corresponding author upon reasonable request. The JLDN data are available from Franklin Japan Co., Ltd. (https://www.franklinjapan.jp/) at a cost. The LIDEN data are produced by the Japan Meteorological Agency and are available in Japan through several distributors of Japan Meteorological Agency data. The ENTLN data are available from AEM (https://www.aem.eco/) at a cost. The GLD360 data are available from Vaisala, Inc. (https://www.vaisala.com/) for academic use. Blitzortung.org data are available to users who participate in the Blitzortung network by operating a receiving station. The WWLLN data are available from the University of Washington (http://wwlln.net/) at nominal cost. The CLLS lightning data are available from Chuden CTI (https://www.chuden-cti.co.jp/) at a cost. The stroke-level CLLS data including subsequent strokes, used in Section 4 and Section 5, were provided by Chubu Electric Power and are not publicly available. The FALMA data are available from the authors at Gifu University upon reasonable request. Due to licensing restrictions associated with several commercial lightning location systems, the original catalogs obtained from commercial providers cannot be redistributed by the authors.
Acknowledgments
We are deeply grateful to Etsuo Arakawa of Tokyo Gakugei University for the installation of the observation system. We also thank the NPO Mount Fuji Research Station for supporting the installation at and around Mt. Fuji, and its members for their continuous support in maintaining the observation systems and operating the lightning location network in the Mt. Fuji region. The Blitzortung.org dataset was supported by the contributions of many volunteers who constructed receiving stations. We express our appreciation to WWLLN, a collaboration among universities and research institutions worldwide, for providing the lightning location data used in this study. We thank Vaisala for making the GLD360 data available for academic use, granting permission for the direct comparison with other lightning location networks presented here, and reviewing the GLD360-related content before submission. The English of this manuscript was edited by Scribendi. During the preparation of this manuscript, the authors used Claude (Anthropic) to assist with drafting and editing the English text, checking the internal consistency of the reported figures, and verifying the citations against the cited sources. The authors reviewed and edited all of the output and take full responsibility for the content of the publication.
Conflicts of Interest
The authors declare no conflicts of interest. The instruments used in this study were purchased independently by the authors, who have no financial relationship with Boltek Corporation. Boltek Corporation had no role in the study design, data analysis or interpretation, writing of the manuscript, or decision to publish the results.
References
- Betz, H.-D.; Schumann, U.; Laroche, P. (Eds.) Lightning: Principles, Instruments and Applications: Review of Modern Lightning Research; Springer: Dordrecht, The Netherlands, 2009. [Google Scholar]
- Krider, E.P.; Noggle, R.C.; Uman, M.A. A gated, wideband magnetic direction finder for lightning return strokes. J. Appl. Meteorol. 1976, 15, 301–306. [Google Scholar] [CrossRef]
- Lewis, E.A.; Harvey, R.B.; Rasmussen, J.E. Hyperbolic direction finding with sferics of transatlantic origin. J. Geophys. Res. 1960, 65, 1879–1905. [Google Scholar] [CrossRef]
- Dowden, R.L.; Brundell, J.B.; Rodger, C.J. VLF lightning location by time of group arrival (TOGA) at multiple sites. J. Atmos. Sol.-Terr. Phys. 2002, 64, 817–830. [Google Scholar] [CrossRef]
- Cummins, K.L.; Murphy, M.J.; Bardo, E.A.; Hiscox, W.L.; Pyle, R.B.; Pifer, A.E. A combined TOA/MDF technology upgrade of the U.S. National Lightning Detection Network. J. Geophys. Res. 1998, 103, 9035–9044. [Google Scholar] [CrossRef]
- Holzworth, R.H.; McCarthy, M.P.; Brundell, J.B.; Jacobson, A.R.; Rodger, C.J. Global distribution of superbolts. J. Geophys. Res. Atmos. 2019, 124, 9996–10005. [Google Scholar] [CrossRef]
- Said, R.K.; Inan, U.S.; Cummins, K.L. Long-range lightning geolocation using a VLF radio atmospheric waveform bank. J. Geophys. Res. 2010, 115, D23108. [Google Scholar] [CrossRef]
- Said, R.K.; Murphy, M.J. GLD360 upgrade: Performance analysis and applications. In Proceedings of the 24th International Lightning Detection Conference and International Lightning Meteorology Conference, San Diego, CA, USA, 18–21 April 2016; Available online: https://www.vaisala.com/sites/default/files/documents/Ryan%20Said%20and%20Martin%20Murphy.%20GLD360%20Upgrade%20Performance%20Analysis%20and%20Applications.pdf (accessed on 8 October 2026).
- Zhu, Y.; Stock, M.; Lapierre, J.; DiGangi, E. Upgrades of the Earth Networks Total Lightning Network in 2021. Remote Sens. 2022, 14, 2209. [Google Scholar] [CrossRef]
- Wanke, E.; Andersen, R.; Volgnandt, T. A World-Wide Low-Cost Community-Based Time-of-Arrival Lightning Detection and Lightning Location Network. Available online: https://www.blitzortung.org/Documents/TOA_Blitzortung_RED.pdf (accessed on 1 April 2026).
- Kamogawa, M.; Suzuki, T.; Fujiwara, H.; Narita, T.; Wanke, E.; Murata, K.; Nagao, T.; Kodama, T.; Izutsu, J.; Matsuki, A.; et al. Characteristics of the Blitzortung.org lightning location catalog in Japan. Atmosphere 2023, 14, 1507. [Google Scholar] [CrossRef]
- Franklin Japan Co.; Ltd. JLDN Zenkoku Kaminari Kansoku Network to wa [What the JLDN Nationwide Lightning Detection Network Is]. Available online: https://www.franklinjapan.jp/network/jldn (accessed on 18 October 2026).
- Ishii, K.; Hayashi, S.; Fujibe, F. Statistical analysis of temporal and spatial distributions of cloud-to-ground lightning in Japan from 2002 to 2008. J. Atmos. Electr. 2014, 34, 79–86. [Google Scholar] [CrossRef]
- Shindo, T.; Motoyama, H.; Sakai, A.; Honma, N.; Takami, J.; Shimizu, M.; Tamura, K.; Shinjo, K.; Ishikawa, F.; Miyazaki, K.; et al. Lightning occurrence data observed with lightning location systems of electric power companies in Japan: 1992–2008. In Proceedings of the 30th International Conference on Lightning Protection (ICLP), Cagliari, Italy, 13–17 September 2010. [Google Scholar] [CrossRef]
- Suzuki, F.; Tsuji, H.; Shimizu, H.; Shimizu, M. Evaluation of the new LS7001 network in the Chubu region of Japan after site-error corrections. In Proceedings of the International Lightning Detection Conference / International Lightning Meteorology Conference (ILDC/ILMC), Tucson, AZ, USA, 18–21 March 2014. [Google Scholar]
- Wu, T.; Wang, D.; Takagi, N. Lightning mapping with an array of fast antennas. Geophys. Res. Lett. 2018, 45, 3698–3705. [Google Scholar] [CrossRef]
- Boltek Corporation. Products. Available online: https://boltek.com/products/ (accessed on 18 October 2026).
- Boltek Corporation. LRX-1 Lightning Network Detector [Specification Sheet]; LRX-1-SS-03042017; Boltek Corporation: Port Colborne, ON, Canada, 2017; Available online: https://www.boltek.com/LRX-1-SS-03042017.pdf (accessed on 20 September 2026).
- Taori, A.; Suryavanshi, A.; Pawar, S.; Seshasai, M.V.R. Establishment of lightning detection sensors network in India: Generation of essential climate variable and characterization of cloud-to-ground lightning occurrences. Nat. Hazards 2022, 111, 19–32. [Google Scholar] [CrossRef]
- Goenka, R.; Taori, A.; Rao, G.S.; Chauhan, P. Leveraging INSAT-3D Indian geostationary satellite for advanced lightning detection and analysis. Geophys. Res. Lett. 2025, 52, e2024GL112764. [Google Scholar] [CrossRef]
- Taori, A.; Suryavanshi, A.; Goenka, R.; Venkatesh, D.; Rao, G.S. Inter-comparison of World Wide Lightning Location Network (WWLLN) and Lightning Detection Sensor Network (LDSN) data over India. J. Atmos. Sol.-Terr. Phys. 2024, 261, 106286. [Google Scholar] [CrossRef]
- Kundu, A.; Srivastava, A.; Kundu, S.S.; Taori, A.; Domkawale, M.A.; Guha, A.; Banik, T.; Thabah, L.; Gogoi, R.B.; Mahanta, R. Lightning location systems in India: A comparative evaluation with a focus over north-eastern region of India. Atmos. Res. 2026, 338, 108999. [Google Scholar] [CrossRef]
- Abarca, S.F.; Corbosiero, K.L.; Galarneau, T.J., Jr. An evaluation of the Worldwide Lightning Location Network (WWLLN) using the National Lightning Detection Network (NLDN) as ground truth. J. Geophys. Res. 2010, 115, D18206. [Google Scholar] [CrossRef]
- Hutchins, M.L.; Holzworth, R.H.; Brundell, J.B.; Rodger, C.J. Relative detection efficiency of the World Wide Lightning Location Network. Radio Sci. 2012, 47, RS6005. [Google Scholar] [CrossRef]
- Rudlosky, S.D.; Peterson, M.J.; Kahn, D.T. GLD360 performance relative to TRMM LIS. J. Atmos. Ocean. Technol. 2017, 34, 1307–1322. [Google Scholar] [CrossRef]
- Xweather, Vaisala. Global Lightning Detection Network GLD360. Available online: https://www.vaisala.com/en/products/systems/lightning/gld360 (accessed on 23 September 2026).
- Zhu, Y.; Rakov, V.A.; Tran, M.D.; Stock, M.G.; Heckman, S.; Liu, C.; Sloop, C.D.; Jordan, D.M.; Uman, M.A.; Caicedo, J.A.; et al. Evaluation of ENTLN performance characteristics based on the ground truth natural and rocket-triggered lightning data acquired in Florida. J. Geophys. Res. Atmos. 2017, 122, 9858–9866. [Google Scholar] [CrossRef]
- Blitzortung.org. Station List. Available online: https://www.blitzortung.org/en/station_list.php (accessed on 8 October 2026).
- Ishii, M.; Fujii, F.; Saito, M.; Natsuno, D.; Sugita, A. Detection of lightning return strokes hitting wind turbines in winter by JLDN. IEEJ Trans. Power Energy (In Japanese) 2013, 133, 1009–1010. [Google Scholar] [CrossRef]
- Matsui, M.; Michishita, K.; Kurihara, S. Accuracies of location and estimated peak current for negative downward return-strokes to wind turbine observed by JLDN. IEEJ Trans. Power Energy (In Japanese) 2015, 135, 644–645. [Google Scholar] [CrossRef]
- Matsui, M.; Michishita, K.; Miyama, Y. Validation of the Japanese Lightning Detection Network (JLDN) performance characteristics. In Proceedings of the XVIII International Symposium on Lightning Protection (SIPDA 2025), Thessaloniki, Greece, 21–26 September 2025. [Google Scholar] [CrossRef]
- Matsui, M.; Sugita, A.; Michishita, K.; Kurihara, S.; Honjo, N. Discussion on location accuracy improved by propagation delay corrections for the Japanese lightning detection network. In Proceedings of the 33rd International Conference on Lightning Protection (ICLP), Estoril, Portugal, 25–30 September 2016. [Google Scholar] [CrossRef]
- Ishii, M.; Saito, M.; Fujii, F.; Hojo, J.; Matsui, M.; Itamoto, N.; Shinjo, K. LEMP from lightning discharges observed by JLDN. IEEJ Trans. Power Energy 2005, 125, 765–770. [Google Scholar] [CrossRef]
- Japan Meteorological Agency; Observation Department. Specifications for Distributed Data No. 13201: Lightning Observation Data; JMA: Tokyo, Japan, 2020; Available online: https://www.data.jma.go.jp/suishin/shiyou/pdf/no13201 (accessed on 11 October 2026).
- Wu, T.; Wang, D.; Takagi, N. Multiple-stroke positive cloud-to-ground lightning observed by the FALMA in winter thunderstorms in Japan. J. Geophys. Res. Atmos. 2020, 125, e2020JD033039. [Google Scholar] [CrossRef]
- Wu, T.; Wang, D.; Takagi, N. High-accuracy classification of radiation waveforms of lightning return strokes. J. Geophys. Res. Atmos. 2023, 128, e2023JD038715. [Google Scholar] [CrossRef]
- Ballarotti, M.G.; Medeiros, C.; Saba, M.M.F.; Schulz, W.; Pinto, O., Jr. Frequency distributions of some parameters of negative downward lightning flashes based on accurate-stroke-count studies. J. Geophys. Res. 2012, 117, D06112. [Google Scholar] [CrossRef]
- Rakov, V.A.; Huffines, G.R. Return-stroke multiplicity of negative cloud-to-ground lightning flashes. J. Appl. Meteorol. 2003, 42, 1455–1462. [Google Scholar] [CrossRef]
- Brook, M.; Nakano, M.; Krehbiel, P.; Takeuti, T. The electrical structure of the Hokuriku winter thunderstorms. J. Geophys. Res. 1982, 87, 1207–1215. [Google Scholar] [CrossRef]
- Takeuti, T.; Nakano, M.; Brook, M.; Raymond, D.J.; Krehbiel, P. The anomalous winter thunderstorms of the Hokuriku coast. J. Geophys. Res. 1978, 83, 2385–2394. [Google Scholar] [CrossRef]
- New Energy and Industrial Technology Development Organization (NEDO). Guidelines for Wind Turbine Design in Japan: Lightning Protection (Nihon-gata Furyoku Hatsuden Gaidorain: Rakurai Taisaku Hen); NEDO: Kawasaki, Japan, 2008; Available online: https://www.nedo.go.jp/content/100107252.pdf (accessed on 23 September 2026).
- Goto, Y.; Narita, K. Electrical characteristics of winter lightning. J. Atmos. Terr. Phys. 1995, 57, 449–458. [Google Scholar] [CrossRef]
- Wu, T.; Wang, D.; Huang, H.; Takagi, N. The strongest negative lightning strokes in winter thunderstorms in Japan. Geophys. Res. Lett. 2021, 48, e2021GL095525. [Google Scholar] [CrossRef]
- Rakov, V.A. A review of positive and bipolar lightning discharges. Bull. Am. Meteorol. Soc. 2003, 84, 767–776. [Google Scholar] [CrossRef]
- Nag, A.; Rakov, V.A. Positive lightning: An overview, new observations, and inferences. J. Geophys. Res. 2012, 117, D08109. [Google Scholar] [CrossRef]
- Matsui, M.; Hara, Y. The number of strokes per flash measured by JLDN. In Proceedings of the 7th Asia-Pacific International Conference on Lightning (APL), Chengdu, China, 1–4 November 2011; pp. 248–253. [Google Scholar]
Figure 1.
Schematic of a lightning location network built from Boltek LRX-1 (a) and the ANT-50 sensor as installed at the Suzu station (b). The ANT-50 receiving sensor installed at each station detects the electromagnetic pulses (sferics) radiated by lightning discharges mainly in the VLF/LF band, and a GNSS receiver housed in the sensor provides the time reference. The main unit of LRX-1 performs signal processing and communication, and the detected event data are transmitted over the Internet to the central server operated by Boltek Corporation. On that server, the location of the discharge is computed by the time-of-arrival (TOA) method from the detection times at several stations. The stations carry out only the detection and time stamping; the system is thus one of distributed observation and centralized processing. In (b), the sensor is mounted on a mast secured by concrete blocks on the roof of a building, and the cable from the sensor is led to the main unit.
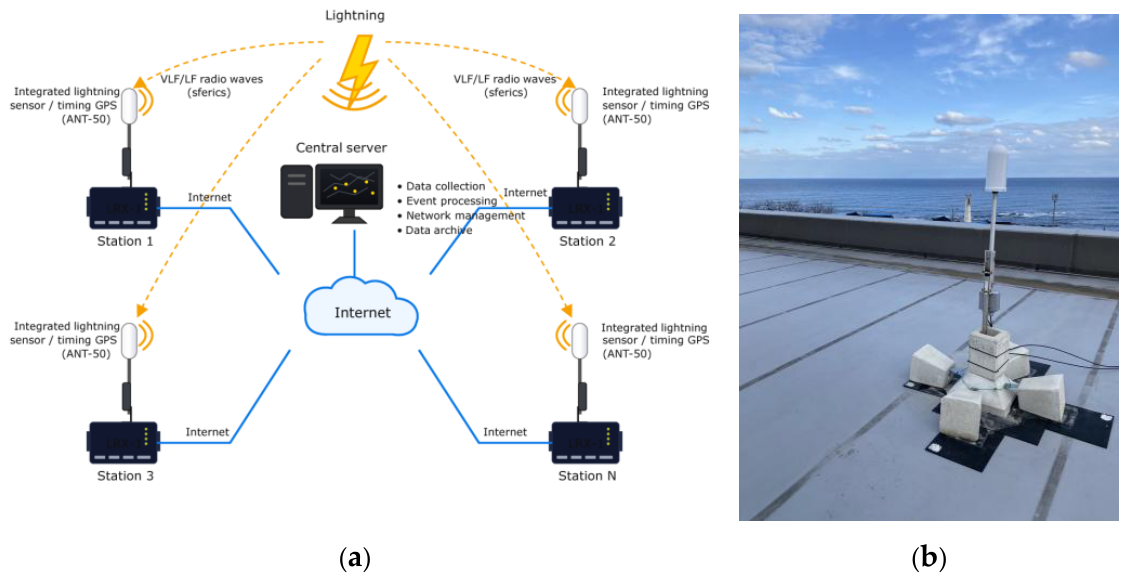
Figure 2.
Arrangement of FULMO stations and an example of lightning locations displayed by the server software of Boltek Corporation. The screenshot was taken at 06:30:19 UTC on 18 February 2026. Green dots denote the FULMO stations installed at that time, and purple lines, which join each station to the located position of the discharge, indicate the stations that contributed to locating that discharge. Six stations are joined to the discharge in this example, five FULMO stations and one station outside the area shown, whereas the catalog records only four station identifiers for each location. The easternmost green dot is the Tsukuba station, which is not joined to the discharge because its receiving sensor was damaged. The legend at the upper left relates the color of each discharge symbol to the time elapsed since it was located. The Koriyama station, installed in April 2026, was not yet in place when this screenshot was taken. The background map is from Google Maps (map data ©2026 Google).
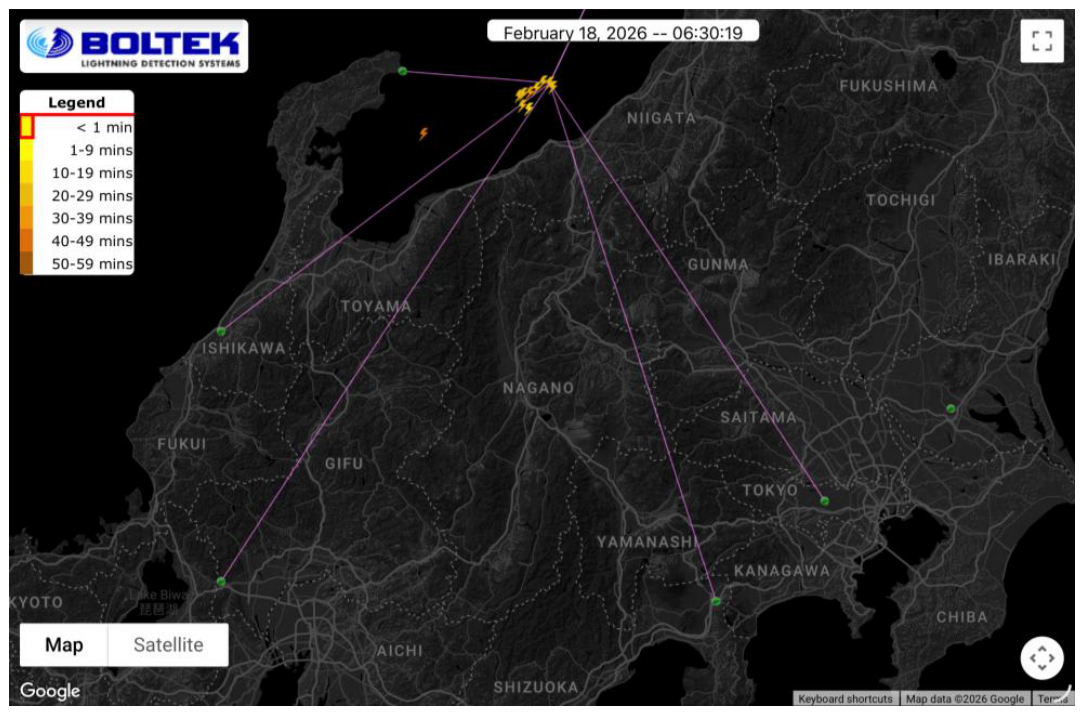
Figure 3.
Distribution of lightning locations in the FULMO (red) and Blitzortung.org (blue) catalogs from July to August 2025. Purple stars denote the four stations in operation during this period (Suzu, Komatsu, Gotemba, and Koganei), and gray stars denote the two stations installed after this period (Sekigahara, February 2026; Koriyama, April 2026). The open star denotes the Tsukuba station, which had been installed before this period but did not contribute to any location because its receiving sensor was damaged. The black triangle marks Mt. Fuji and the black circle marks Tokyo. The black rectangles outline the analysis areas of this study: the dashed one corresponds to Section 4 (34.36–36.36° N, 137.72–139.72° E), the dotted one to Section 5 (33–35° N, 137.5–139.5° E), and the solid one to Section 6 (35–38° N, 136–141° E). N in the legend is the number of locations in each catalog within the area of this figure. Coastlines are from the GSHHS database.
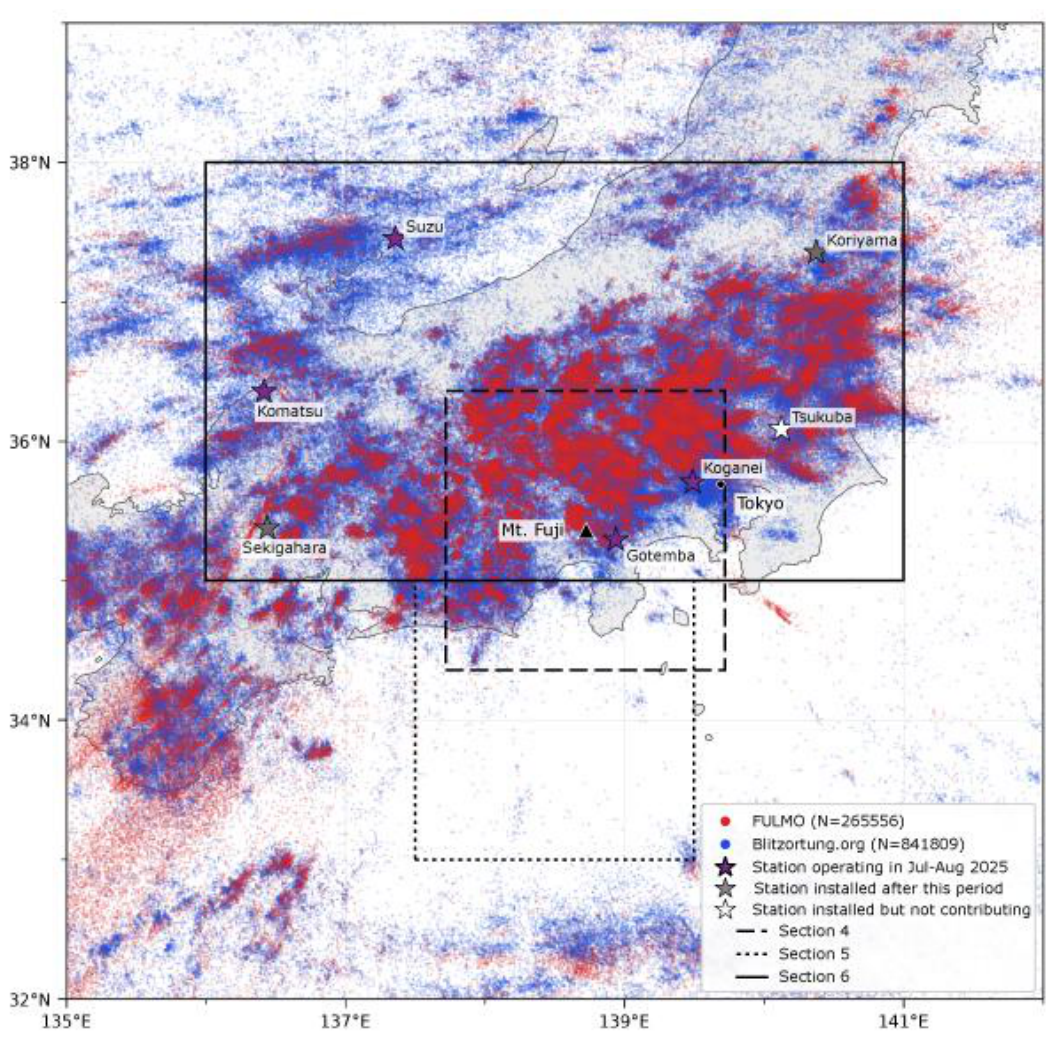
Figure 4.
Distribution of the lightning locations around Mt. Fuji on 26 July (a) and 24 August (b) 2025. The locations in the FULMO (red), Blitzortung.org (blue), and CLLS (green) catalogs within the area 34.36–36.36° N, 137.72–139.72° E are shown. N in the legend is the number of locations in each catalog within this analysis area on each day. Purple stars denote the two FULMO stations that lie within the analysis area (Gotemba and Koganei), and the black triangle marks Mt. Fuji. Coastlines are as in Figure 3, and the prefectural boundaries, shown by the gray dashed lines, are from Natural Earth.
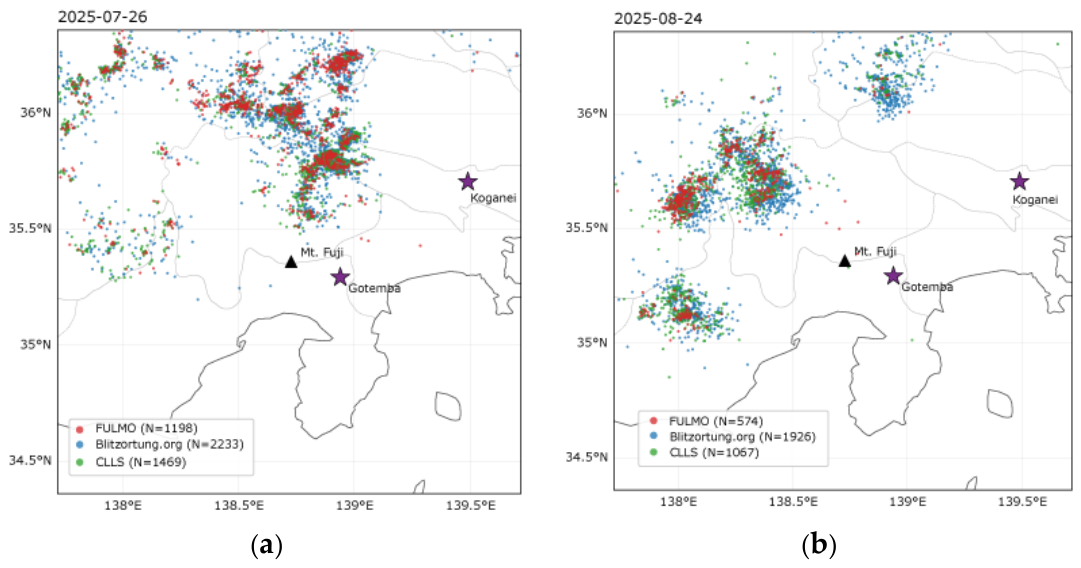
Figure 5.
Time series of the number of detections per hour on 26 July (a) and 24 August (b) 2025. The counts are those in the FULMO (red), Blitzortung.org (blue), and CLLS (green) datasets, taken over the same analysis area as in Figure 4. FULMO and Blitzortung.org do not discriminate between CG strokes and IC discharges, so all of their located points are counted, whereas CLLS provides CG strokes only; the counts of FULMO and CLLS are therefore not directly comparable. The horizontal axis is coordinated universal time (UTC).
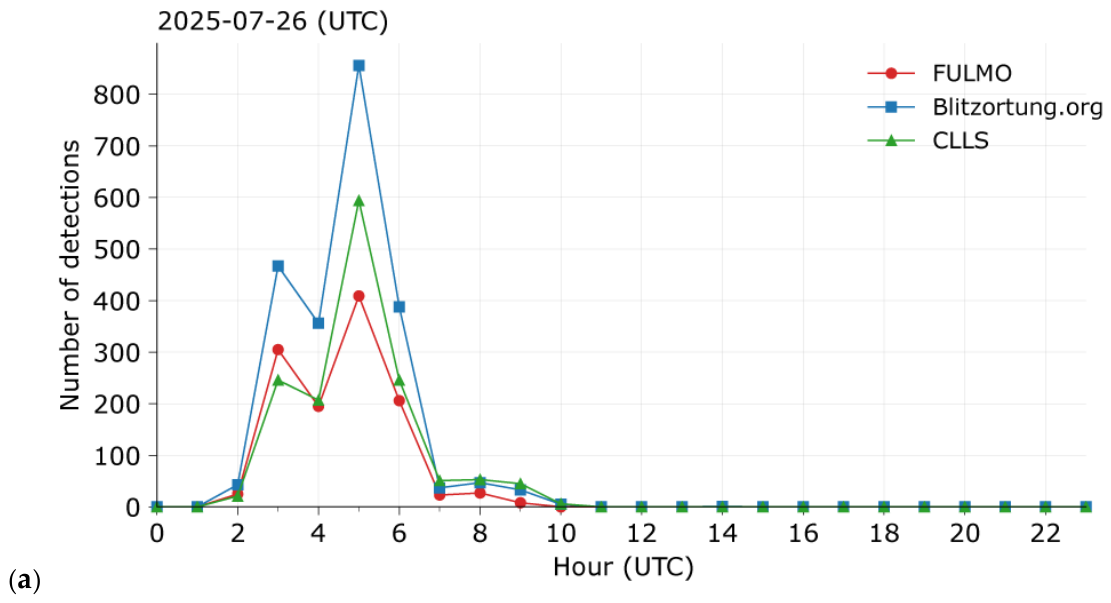
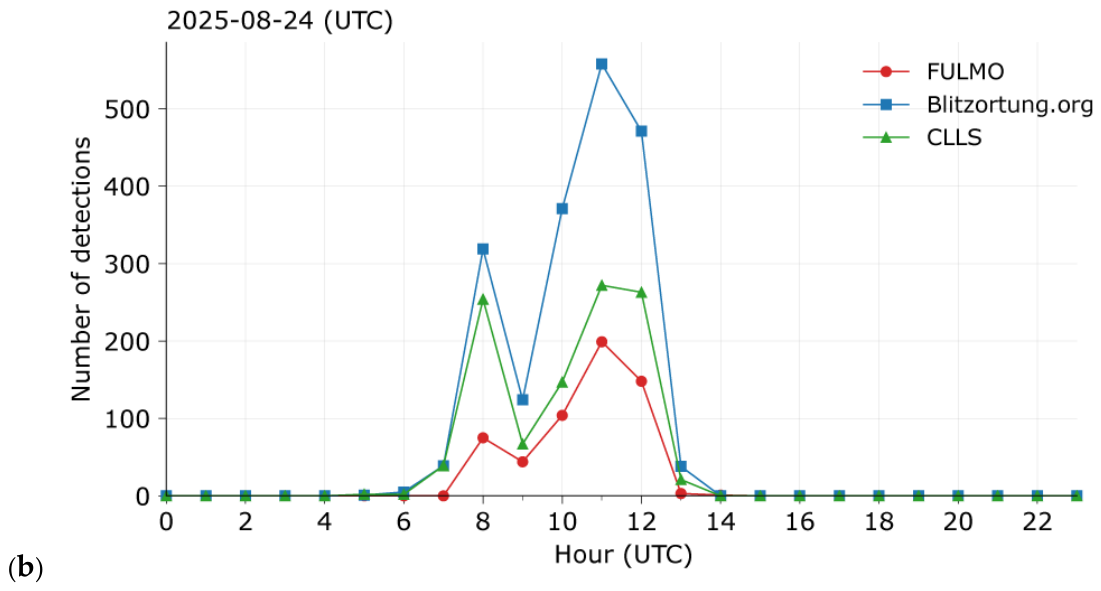
Figure 6.
Comparison of the locations of the lightning activity that occurred off Shizuoka Prefecture (33–35° N, 137.5–139.5° E) between 15:30 and 16:30 UTC on 23 January 2025. The lightning locations in the JLDN (black), FULMO (red), Blitzortung.org (blue), CLLS (green), LIDEN (orange), ENTLN (purple), GLD360 (brown), WWLLN (light blue), and FALMA (amber) catalogs are shown over the same area. N in the legend is the number of locations in each catalog within this analysis area and period. Where a catalog discriminates between CG strokes and IC discharges, only the CG strokes are shown; FULMO and Blitzortung.org do not make this discrimination, so all of their located points are shown, whereas CLLS provides CG strokes only. For FALMA, the located points with a return-stroke probability Prs of 50% or more were taken to be CG discharges.
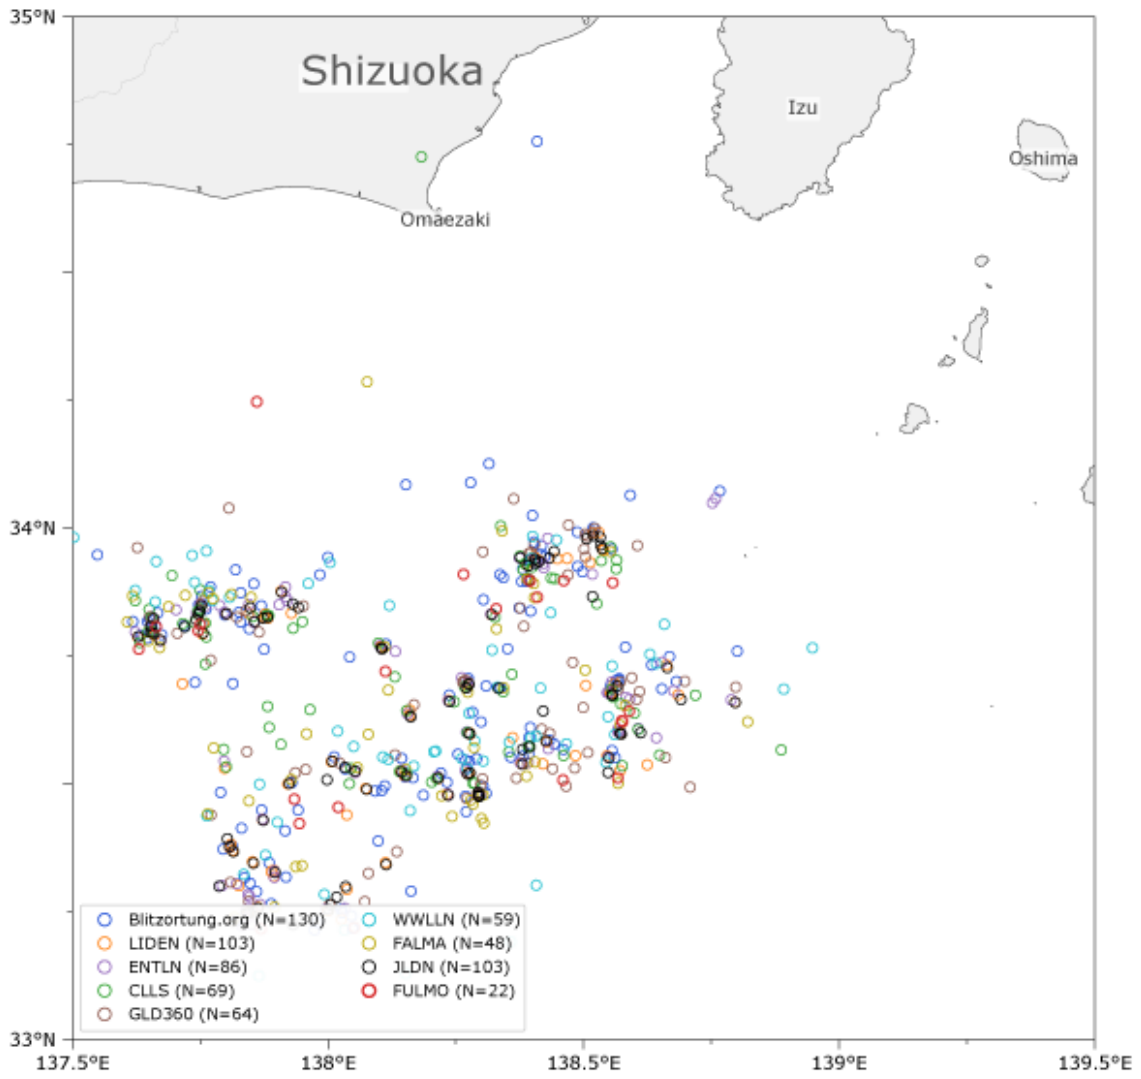
Figure 7.
Distribution of JLDN CG strokes (black) and FULMO locations (red) between 03:00 and 04:30 UTC (12:00–13:30 JST) on 13 May 2026. The analysis area is 35–38° N, 136–141° E. N in the legend is the number of locations in each catalog within this analysis area and period. Purple stars denote the six operational stations in this analysis, and the open star denotes the Tsukuba station, which did not contribute because of a fault in its receiving sensor. The black triangle marks Mt. Fuji. The name of each station is given in the figure. Coastlines and prefectural boundaries are as in Figure 3 and Figure 4.
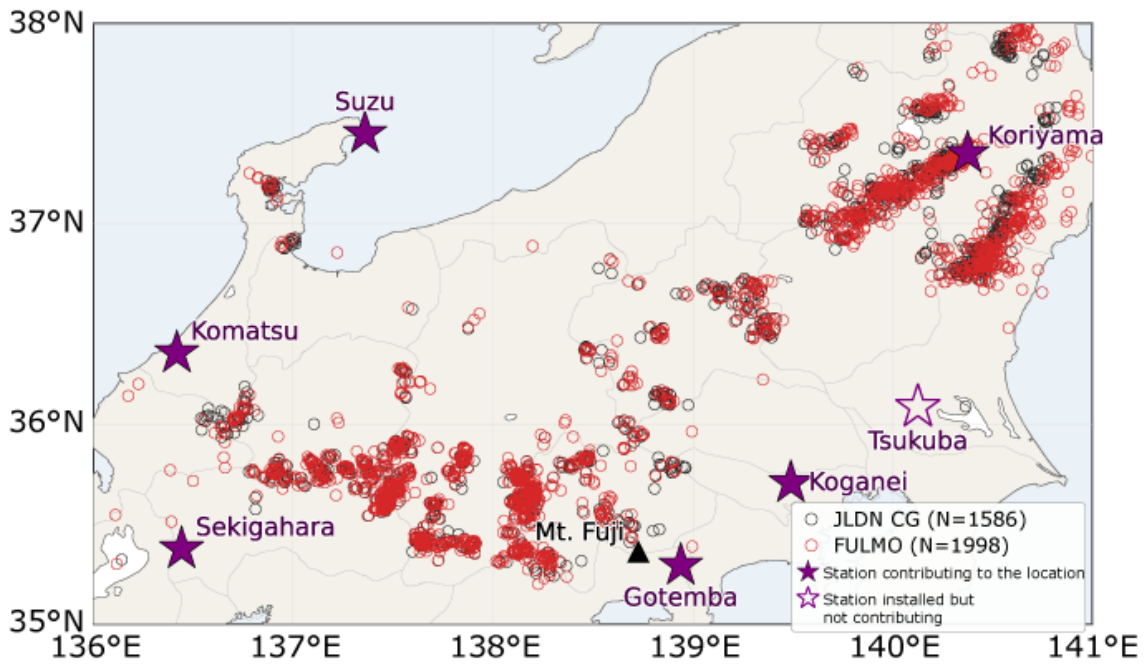
Figure 8.
Distribution of the location difference between FULMO and JLDN for the events matched in the analysis of 03:00–04:30 UTC on 13 May 2026. CG strokes (red) and IC discharges (blue) are shown. A pair was accepted when the time difference was within 1 ms and the horizontal distance was within 20 km, and pairs were formed one to one in order of increasing horizontal distance. The horizontal axis is the location difference in km, and the vertical axis is the number of matched events in each bin. N in the legend is the number of matched events, and mean and median are the mean and median of the location difference in km. The dashed lines mark the median of each distribution.
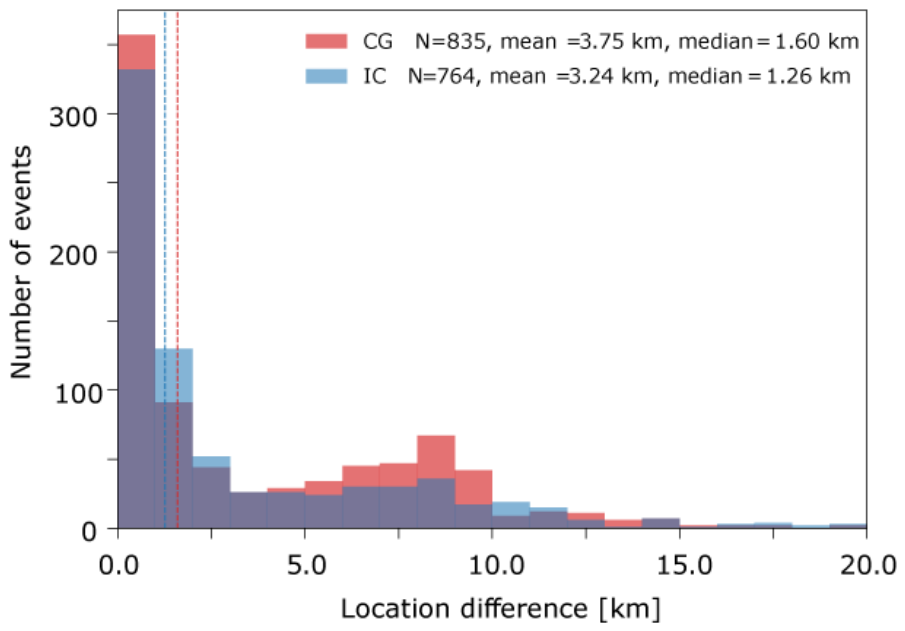
Figure 9.
Spatial distribution of the location difference between the two catalogs, for the CG strokes matched between FULMO and JLDN in the analysis of 13 May 2026. Each point is placed at the location given by JLDN, and its color gives the location difference in km, as indicated by the color bar. Purple stars denote the six operational stations in this analysis, and the open star denotes the Tsukuba station, which did not contribute because of a fault in its receiving sensor. The name of each station is given in the figure. N in the figure is the number of matched events and median is the median location difference. Coastlines and prefectural boundaries are as in Figure 7.
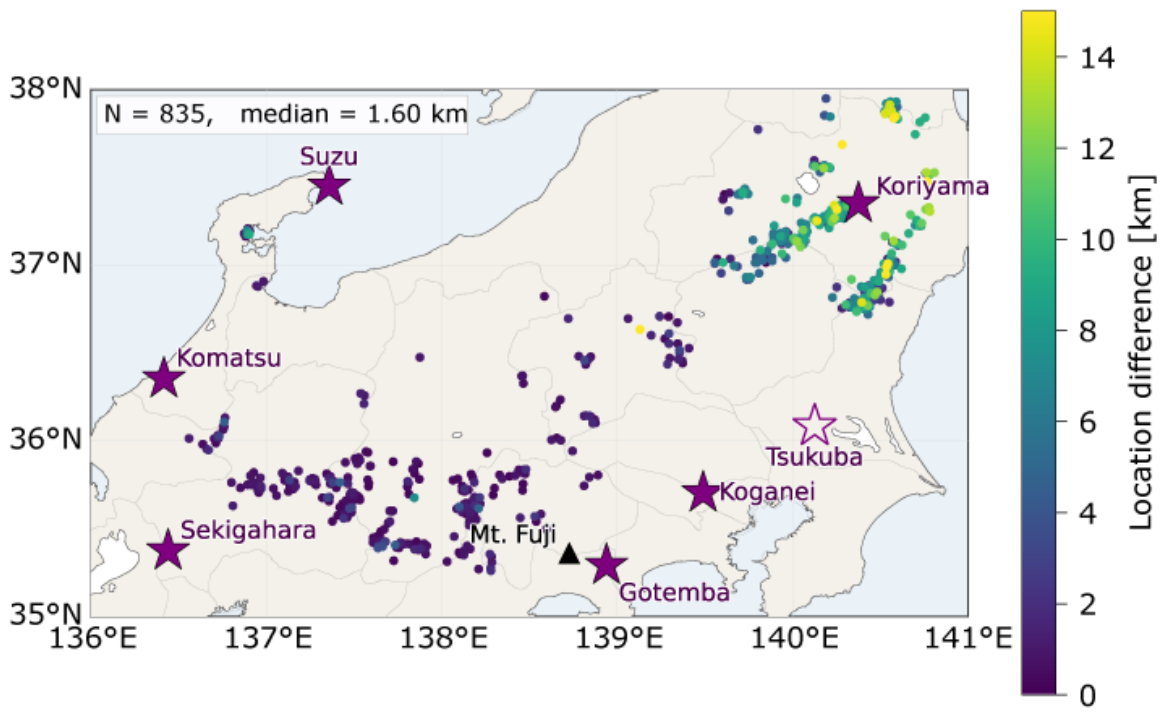
Figure 10.
Scatter plot comparing the peak currents of the two catalogs for the 606 pairs with a maximum azimuthal gap below 180° (Section 7), among the CG strokes matched between FULMO and JLDN in the analysis of 03:00–04:30 UTC on 13 May 2026. The horizontal axis is the peak current estimated by FULMO in kA, and the vertical axis is the absolute value of the peak current of JLDN in kA. The colors give the order of the corresponding JLDN stroke within its flash, and N in the legend is the number of pairs of each order. The stroke order was determined by the common criterion used in this study: a stroke lying 3 ms to 1 s after the latest stroke of a flash and within 10 km of it belongs to that flash. The solid line is the regression with the intercept fixed at zero, and the shading is the 95% confidence interval of the slope. The regression equation and coefficient of determination R² are given in the figure. R² is obtained as one minus the ratio of the residual sum of squares to the sum of squares of the deviations about the mean.
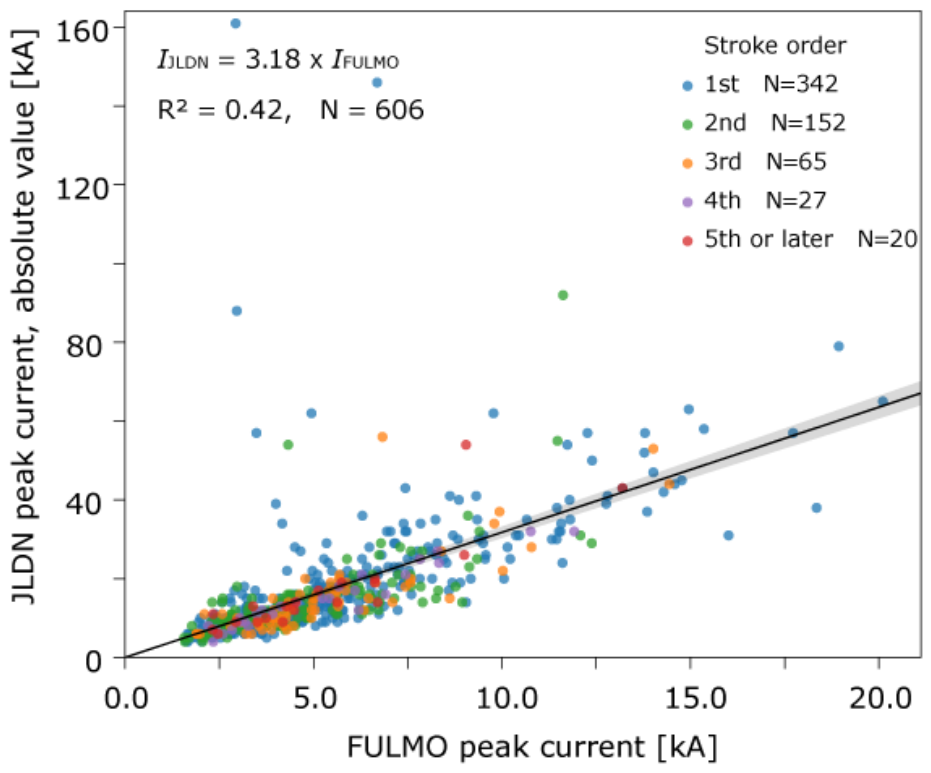
Figure 11.
Relation between the maximum azimuthal gap and the location difference relative to JLDN for the 835 CG strokes matched between FULMO and JLDN in the analysis of 03:00–04:30 UTC on 13 May 2026. The horizontal axis is the maximum azimuthal gap in degrees, and the vertical axis is the location difference relative to JLDN in km. Gray circles are the individual locations, the red line is the median in each 30° bin, and the red shading is the 25th–75th percentile range. The dotted line marks 180°; the median location difference and number of locations are given on either side of it. The maximum azimuthal gap is the largest of the differences between neighboring azimuths, including the difference from the last azimuth back to the first across 360°, among the azimuths of the six operational stations as seen from the JLDN position of each discharge.
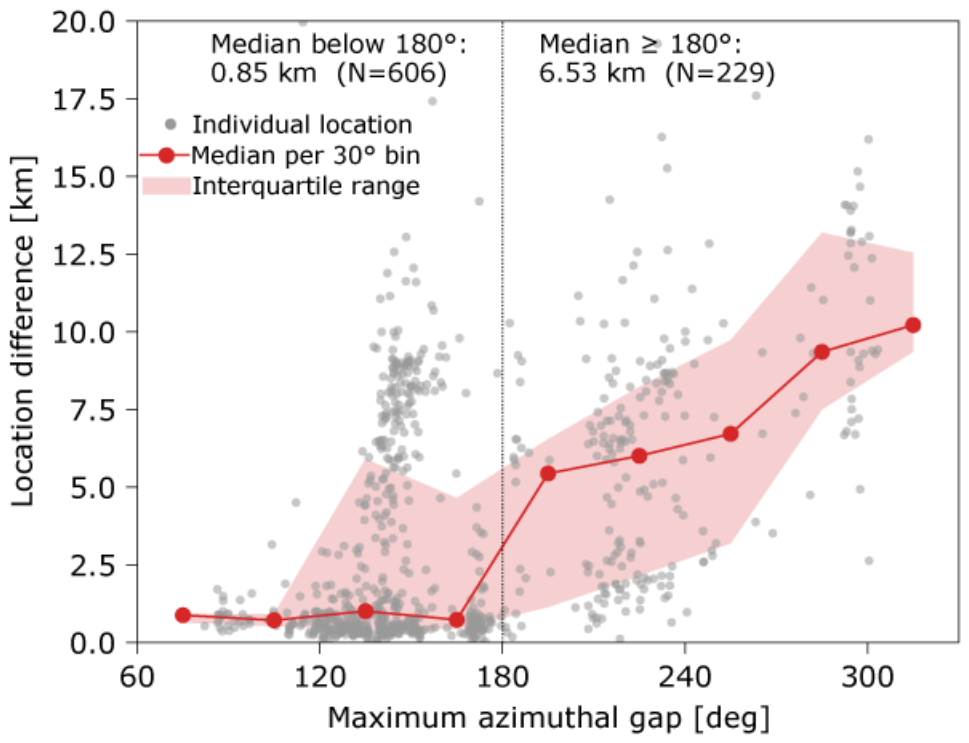

Table 1.
FULMO events detected between 15:30 and 16:30 UTC on 23 January 2025, within the analysis area of Section 5 and their counterparts in the JLDN CG catalog. Δt is defined as tFULMO − tJLDN. The 14 events in bold were used to determine the timing offset; for these the Remark column gives the order of the corresponding JLDN stroke within its flash, by the criterion of Section 5. For the others, it gives the reason for exclusion; “no CG within the time window” means that no JLDN CG stroke lies at −1 ± 0.01 s, although a JLDN IC discharge was present in each of those four cases.
| No. | FULMO time (UTC) | Δt [s] | Distance [km] | Remark |
| 1 | 15:30:06.557 | −0.99852 | 4.98 | first stroke |
| 2 | 15:38:22.975 | −0.99849 | 2.71 | second stroke |
| 3 | 15:40:04.640 | −0.99902 | 1.85 | first stroke |
| 4 | 15:45:46.593 | — | — | no CG within the time window |
| 5 | 15:45:50.311 | −0.99880 | 3.51 | first stroke |
| 6 | 15:47:30.445 | −0.99857 | 2.24 | second stroke |
| 7 | 15:49:05.715 | −0.99878 | 4.55 | second stroke |
| 8 | 15:49:06.514 | −0.99862 | 6.30 | first stroke |
| 9 | 15:52:05.865 | — | — | no CG within the time window |
| 10 | 15:52:58.330 | — | — | no CG within 10 km (nearest 10.1 km) |
| 11 | 15:54:37.022 | −0.99854 | 4.65 | first stroke |
| 12 | 15:56:34.570 | −0.99887 | 5.39 | first stroke |
| 13 | 15:56:34.721 | −0.99888 | 1.48 | first stroke |
| 14 | 15:56:35.630 | −0.99827 | 5.89 | first stroke |
| 15 | 16:00:34.058 | — | — | no CG within 10 km (nearest 46.4 km) |
| 16 | 16:00:39.422 | −0.99870 | 3.94 | first stroke |
| 17 | 16:09:22.130 | — | — | no CG within the time window |
| 18 | 16:12:53.809 | −0.99658 | 8.10 | outlier in dt |
| 19 | 16:12:54.805 | −0.99852 | 6.09 | third stroke |
| 20 | 16:12:54.833 | −0.99876 | 5.94 | fourth stroke |
| 21 | 16:12:54.882 | — | — | no CG within 10 km (nearest 24.7 km) |
| 22 | 16:16:39.659 | — | — | no CG within the time window |
Table 2.
Relative detection efficiency and location difference with respect to JLDN, and average multiplicity, for each lightning catalog during the lightning activity of 23 January 2025, 15:30–16:30 UTC. The matching criterion (1 ms and 20 km) and the flash-grouping criterion used for the multiplicity are those of Section 5. ENTLN, LIDEN, and GLD360 classify their own events into CG and IC and are given in two rows each, as indicated in the second column. The other catalogs provide no such classification, so all of their located points are used; the exceptions are CLLS, which provides CG discharges only, and FALMA, for which points with a return-stroke probability of 50% or more were taken as CG discharges. For LIDEN, the CG rows comprise CG flashes and return strokes and the IC rows comprise isolated discharges and the onset of IC discharges, so each IC discharge is counted once. A dash indicates a quantity that is not given: the relative detection efficiency and the location difference for JLDN, which serves as the reference, and the average multiplicity in rows other than the CG row of each catalog. N/A indicates that the catalog does not provide a comparable discharge category.
| Catalog | Relative detection efficiency to JLDN (CG: 103; IC: 114) |
Relative location difference to JLDN Mean/Median [km] |
Average multiplicity | |||
|---|---|---|---|---|---|---|
| CG for JLDN | IC for JLDN | CG for JLDN | IC for JLDN | |||
| JLDN | - | - | - | - | 1.47 | |
| Blitzortung.org | 61.2% | 15.8% | 3.41/2.01 | 5.22/3.73 | 1.21 | |
| CLLS | 49.5% | N/A | 3.57/2.36 | N/A | 1.19 | |
| FALMA | 42.7% | N/A | 4.65/4.69 | N/A | 1.14 | |
| ENTLN | CG | 62.1% | 7.0% | 0.89/0.54 | 0.47/0.40 | 1.59 |
| IC | 9.7% | 28.9% | 1.55/1.42 | 2.34/0.57 | - | |
| LIDEN | CG | 84.5% | 6.1% | 0.76/0.31 | 2.30/1.90 | 1.54 |
| IC | 15.5% | 34.2% | 3.33/0.79 | 1.42/0.65 | - | |
| GLD360 | CG | 40.8% | 7.9% | 4.29/3.37 | 6.85/4.97 | 1.25 |
| IC | 7.8% | 14.9% | 2.39/1.41 | 4.35/2.41 | - | |
| WWLLN | 33.0% | 3.5% | 6.82/6.43 | 10.65/9.48 | 1.18 | |
| FULMO | 14.6% | 5.3% | 4.64/4.65 | 3.49/3.27 | 1.10 | |
Disclaimer/Publisher’s Note: The statements, opinions and data contained in all publications are solely those of the individual author(s) and contributor(s) and not of MDPI and/or the editor(s). MDPI and/or the editor(s) disclaim responsibility for any injury to people or property resulting from any ideas, methods, instructions or products referred to in the content. |
© 2026 by the authors. Licensee MDPI, Basel, Switzerland. This article is an open access article distributed under the terms and conditions of the Creative Commons Attribution (CC BY) license (http://creativecommons.org/licenses/by/4.0/).
Copyright: This open access article is published under a Creative Commons CC BY 4.0 license, which permit the free download, distribution, and reuse, provided that the author and preprint are cited in any reuse.