

Submitted:
22 October 2026
Posted:
26 October 2026
You are already at the latest version
Abstract
Copper mining in southern Peru needs firm, low-carbon electricity but relies on a hydro-dominated grid whose marginal cost rose from about 30 to 200 USD/MWh during the 2022–2023 drought; no study has linked the region’s geothermal resources to this demand. We assessed how much, at what cost and by when eight fields of the Southern Volcanic Axis could supply the incremental mining demand of the Arequipa–Moquegua–Tacna corridor in 2026–2040. We combined a Monte Carlo simulation of correlated exploration success and development schedules, a system levelized cost of electricity (LCOE) delivered to the mine, and an AHP–TOPSIS multi-criteria analysis. The deployable resource averages 691 MWe (P90: 343 MWe). Installable capacity is zero before 2033 and reaches a median of 673 MW in 2040, covering base-case demand with 76% probability (56–62% with schedule delays). The median LCOE of the reference field, 111 USD/MWh, is lower than diesel backup and, in 71% of cases, than solar–wind with storage, but higher than natural gas and the grid. Geothermal energy ranks first while the economic weight stays below 37% and its supply security is rated at least 4.02 out of 5. Exploration risk and development time, not resource size, constrain this medium-term firm supply option.
Keywords:
mining decarbonization
; exploration risk
; Monte Carlo simulation
; levelized cost of electricity
; analytic hierarchy process
; TOPSIS
; Central Volcanic Zone
; Andes
1. Introduction
The energy transition increases copper demand while requiring its production to be decarbonized [1,2]. The core processes of copper mining (crushing, grinding, flotation, leaching and electrowinning) operate continuously and therefore require firm, round-the-clock power. In southern Peru, the Arequipa–Moquegua–Tacna corridor hosts mining operations such as Cerro Verde, Toquepala, Cuajone and Quellaveco, with a combined demand of about 930 MW [3], and a portfolio of new projects that could add between 170 and 380 MW by 2031 [4].
The electricity supply of these operations depends on the National Interconnected Electric System (SEIN), in which hydropower accounts for about 55% of annual generation [5]. The 2022–2023 drought, with rainfall deficits of −60% to −100% in the central and southern highlands and some of the driest months in 58 years at Andean stations [6], reduced hydropower generation by up to 29% year-on-year in December 2022 [7] and raised the system marginal cost from about 30 to 200 USD/MWh through forced dispatch of diesel-fired plants [5]. As climate projections for South America anticipate more intense and frequent climate extremes [8], this exposure represents an operational and financial risk for mining.
Solar photovoltaic and wind power are already being incorporated into the supply of mining operations [2], but their variability requires storage or backup to deliver firm power. Geothermal energy, in contrast, provides weather-independent baseload power, with average capacity factors close to 88% [9], and can operate flexibly in decarbonized systems [10,11]. Southern Peru lies within the Central Volcanic Zone of the Andes, characterized by high heat flow along the volcanic arc [12,13,14], and the national master plan estimates a potential of 2,860 MWe, concentrated in the Southern Volcanic Axis (Eje Volcánico Sur, EVS) [15]. Recent studies have characterized fault-controlled, high-temperature hydrothermal systems in the forearc and arc of southern Peru [16,17].
The literature on Andean geothermal development follows three lines of research. The first characterizes the resource through inventories and potential assessments [15,18], geochemical [16] and geophysical studies [17], and play fairway analyses such as the one conducted in the Argentine Puna [19]. These works delineate the potential and its spatial distribution but neither identify specific consumers nor estimate the cost of supplying them. The second addresses the economic viability of and barriers to geothermal development at the national scale: Sánchez-Alfaro et al. [20] identify, among the barriers in Chile, the absence of mechanisms to mitigate exploration risk, and De la Cruz Torres et al. [21] model the share of geothermal energy in Peru's energy mix to 2050. Both studies treat demand in aggregate, without identifying anchor consumers. The third examines mining decarbonization with an emphasis on solar, wind and storage [2], whereas geothermal energy appears in general reviews [22] or in connection with the extraction of critical metals from geothermal brines [23].
Cerro Pabellón, located at about 4,500 m a.s.l. in northern Chile within the same Central Volcanic Zone, is a precedent for the commercial development of high-altitude Andean geothermal energy [24]. However, this precedent does not resolve the uncertainty about the capacity, timing and cost of developing fields not yet confirmed by drilling to supply specific mining operations. Likewise, Ricks et al. [11] show that next-generation flexible geothermal power can reduce the cost of decarbonized electricity systems, but their analysis does not address supply to specific industrial consumers or pre-drilling exploration risk.
Although Peru has substantial geothermal potential, concentrated in the south of the country and not yet used for power generation, to our knowledge no study has linked the inferred resource to the firm demand of specific mining operations. Nor has it been established, in an integrated manner, how exploration risk and development timelines condition the coverage of incremental mining demand, the cost of electricity delivered to the mine and the preference for geothermal energy over alternatives of equivalent firmness, under both economic and non-monetary criteria.
The general objective is to assess, through an integrated uncertainty analysis, to what extent, at what cost and within what timeframe the geothermal resources of the EVS can supply the incremental electricity demand of mining in the Arequipa–Moquegua–Tacna corridor between 2026 and 2040, considering the coverage and timeliness of supply, its economic competitiveness and the robustness of its position against alternatives of equivalent firmness. The specific objectives (SO) are:
SO1. To estimate the deployable resource and the installable capacity over time of eight EVS fields during 2026–2040, using probability distributions that incorporate exploration success or failure, inter-field correlation and development timelines.
SO2. To quantify the probability that installable geothermal capacity covers at least 50% and 100% of the base-case incremental mining demand in each year, using installed capacity and average available capacity, and to assess the sensitivity of this coverage to the development schedule.
SO3. To evaluate the economic competitiveness of geothermal supply delivered to the mine by estimating the distribution of its levelized cost of electricity for the reference field and for each field (including transmission, drilling risk, interest during construction and make-up wells) and the probability that it is lower than that of alternatives of equivalent firmness.
SO4. To determine the robustness of the ranking of firm supply alternatives through a multi-criteria analysis with AHP weights and scores derived from quantitative indicators and a qualitative rubric, identifying the changes in weights and in supply-security judgments that alter the order of preference.
To our knowledge, this is the first study to link the inferred geothermal resource of southern Peru to the firm demand of specific mining operations. Its contribution is an integrated and reproducible probabilistic framework that combines exploration risk, development timelines, the cost of electricity delivered to the mine and multi-criteria preference, and that identifies the conditions under which geothermal energy becomes the preferred firm supply option for the corridor.
2. Material/Data
2.1. Study Area
The study area comprises the Peruvian segment of the Central Volcanic Zone (≈15°–18° S), known as the Southern Volcanic Axis or Region V in the geothermal zoning of the Geological, Mining and Metallurgical Institute of Peru (Instituto Geológico, Minero y Metalúrgico, INGEMMET) [18]. Subduction of the Nazca plate beneath the South American plate sustains a Quaternary volcanic arc with surface heat flows of 80 to more than 100 mW/m² and geothermal gradients that locally exceed 100 °C/km [12,13,14]. The NW–SE Incapuquio and Cincha-Lluta fault systems control permeability and fluid circulation [16,18].
The availability of the geothermal resource depends on depth (Figure 1). At 2,000 m, high-temperature anomalies are restricted to the Andean volcanic arc, including southern Peru; at 4,000 m and 7,000 m, the resource extends towards intraplate basins and the craton, but its use requires enhanced geothermal systems (EGS), whose technological maturity and costs do not yet allow commercial deployment within the horizon of this study [10]. Consequently, firm supply for mining before 2040 depends on conventional hydrothermal resources in the volcanic arc, accessible at standard drilling depths, which justifies focusing the analysis on the EVS.
The mining operations assessed are located at roughly 2,300–3,800 m a.s.l., whereas the geothermal fields lie on the arc, generally above 4,000 m a.s.l. Figure 2 shows the national geothermal zoning, the geothermal zones with estimated potential and the location of the main large-scale copper mining operations; the coordinates of the eight fields assessed and of the connected mining operations are given in Appendix A.
2.2. Data
The study relies exclusively on publicly available secondary data (Table 1). The potential and reservoir temperature of each field (Table 2) come from the Master Plan for the Development of Geothermal Energy [15], at an 80% confidence level, and from subsequent INGEMMET assessments [26,27,28]. Because, according to the available information, no field has been deep-drilled (>1,500 m), they are treated as resources not confirmed by drilling, of low geological confidence in the sense of the United Nations Framework Classification for Resources (UNFC) [29]. Of the national potential of 2,860 MWe [15], the analysis is restricted to eight fields that meet three criteria: (i) they are located in the EVS, within the Arequipa, Moquegua and Tacna regions, at a distance that allows a dedicated connection to the corridor's mining operations; (ii) they have published estimates of potential (MWe) and reservoir temperature based on field-specific studies; and (iii) their estimated reservoir temperatures, of at least 130 °C, allow flash or binary generation.
The Yura thermal area, near the city of Arequipa, and the La Calera area, in Chivay, were excluded. The Master Plan treats them as secondary fields, with potentials of 15 and 9 MWe estimated only from general assumptions on reservoir temperature and volume [15], so they do not meet criterion (ii); in addition, geothermometry at La Calera indicates 110–120 °C [30], below the threshold of criterion (iii). The remaining national potential corresponds to zones far from the demand assessed or to thermal manifestations without quantitative estimates. The ≈912 MWe considered are therefore a subset of the national resource defined by proximity to demand, not a conservative estimate of the corridor's resource. The coordinates of the fields and mining operations are given in Appendix A.
3. Methodology
Figure 3 summarizes the methodological workflow. The four phases correspond to the four specific objectives. All simulations were implemented in Python 3 (NumPy, SciPy) with N = 100,000 iterations and fixed seeds; the code structure, seeds and reproduction procedure are described in Appendix C.
4.1. Deployable Resource and Installable Capacity (SO1)
The deployable capacity of each field i was modelled as the product of its nominal potential, a capacity uncertainty factor and an exploration success variable:
Cᵢ = Pᵢ · Tᵢ · Sᵢ
Where:
Pᵢ is the potential in Table 2;
Tᵢ follows a triangular distribution (0.55; 1.00; 1.30), reflecting the asymmetry of pre-drilling volumetric estimates; and
Sᵢ is the exploration success variable of the field, with mean success probability p = 0.8 in the base case.
Three schemes were evaluated:
(A) Sᵢ continuous with a Beta (8,2) distribution (mean 0.8), independent across fields;
(B) Sᵢ Bernoulli (p = 0.8), independent across fields; and
(C) Sᵢ Bernoulli (p = 0.8) and Tᵢ correlated across fields through one-factor Gaussian copulas with coefficient ρ. Scheme C is the base case, with ρ = 0.5, because the fields share tectonic setting, data type and level of knowledge; sensitivity was assessed for ρ = 0.2 and 0.7.
Sᵢ represents the confirmation of a commercially exploitable reservoir and differs from the success probability of an individual well, pₛ, used in the LCOE calculation (Section 4.3). The value p = 0.8 is a modelling assumption: the drilling success rates reported by Sanyal and Morrow [36] and by the International Finance Corporation [41] refer to wells and are used only as an order-of-magnitude reference, without transferring them directly to field success probability. To assess the sensitivity to this assumption, two scenarios differentiated by maturity category were adopted: intermediate (A = 0.90; B = 0.80; C = 0.70) and conservative (A = 0.85; B = 0.75; C = 0.60).
Installable capacity in year t was obtained by summing the capacity of successful fields whose commercial operation date (COD) is earlier than or equal to t. The COD was assigned by category based on typical geothermal development timelines of 5 to 10 years from exploration to operation [10,42]: 2033 for category A, 2035 for B and 2038 for C, plus a random integer delay, uniform and independent across fields, of 0 to 3 years, representing contingencies in environmental permitting, prior consultation and financial close. In the base case, each field enters operation with its full capacity at its COD.
These dates are modelling assumptions based on the technical maturity of each category:
Category A (2033): fields ready for confirmation drilling (Calientes, in Tacna), with magnetotelluric surveys delineating a conductive layer (<10 Ω·m) interpreted as the cap rock and geothermometry above 200 °C. Deep drilling is assumed to start around 2026–2027, followed by a confirmation, financing and construction cycle of about seven years.
Category B (2035): prospects with pre-feasibility studies or completed surface exploration (Achumani–Chivay, Casiri–Kallapuma, Tutupaca and Calacoa–Putina), which require detailed geophysics and environmental licensing before deep confirmation drilling (>1,500 m); two additional years relative to category A are assumed.
Category C (2038): inferred fields with limited direct evidence (Paucarani–Kovire, Ancocollo and Ccollo–Titire), which must complete surface exploration, rights granting, environmental impact assessment and exploratory drilling (about 12 years in total).
Because timing directly conditions coverage, four schedule variants were evaluated: (i) random delay of 0 to 6 years; (ii) shift of all CODs by +2 years; (iii) phased development, with 50% of each field's capacity at its COD and the remaining 50% three years later; and (iv) the combination of (i) and (ii). These variants were simulated with the same random numbers as the base case, so that differences reflect only the change in assumption.
4.2. Incremental Mining Demand and Coverage (SO2)
The demand considered is the incremental mining electricity demand relative to 2026, arising from new projects (Zafranal, San Gabriel, Tía María, Los Calatos and Pampa de Pongo) and from the progressive electrification of mining fleets [4]. Urban demand growth is excluded because it is not part of the research question. The trajectory of the full portfolio (0 MW in 2026, 380 MW in 2031, 550 MW in 2036 and 750 MW in 2041; linear interpolation) defines the high scenario; the base and low scenarios apply realization factors of 0.70 and 0.45, respectively. Demand is expressed in MW of power and, given the continuous nature of mining processes, is treated as a baseload.
The realization factors are scenario assumptions, not calibrated empirical rates. The base scenario (0.70) represents the delayed materialization of most of the portfolio, and the low scenario (0.45) an environment of postponements associated with permitting, socio-environmental conflict or market conditions. The range between the low and high scenarios bounds demand uncertainty.
Coverage is expressed as the probability that installable geothermal capacity equals or exceeds 50% and 100% of the base-case incremental demand in each year. New generation projected for the SEIN is not deducted, because the objective is to quantify the direct potential contribution of geothermal energy rather than dispatch or the national power balance.
Coverage was calculated with nominal installable capacity (capacity coverage) and, as a sensitivity, with average available capacity, obtained by multiplying installed capacity by the modal capacity factor (0.88), which is equivalent to coverage in energy terms. In addition, a 5% parasitic load associated with high-altitude operation was applied.
4.3. System Levelized Cost of Electricity (SO3)
The LCOE of a 100 MW reference double-flash plant was calculated using the capital recovery factor (CRF):
Where:
capital costs are expressed in USD/kW, OPEX and
Cm in USD/kW-year, and the
LCOE in USD/MWh;
r is the weighted average cost of capital (WACC);
n = 30 years;
CF is the capacity factor;
Ct is the cost of dedicated transmission, calculated as the Euclidean distance multiplied by a tortuosity factor and by USD 0.6 million/km for a 220 kV line in high-mountain terrain [3,5], and allocated over the capacity of the field;
Cd is the cost overrun due to non-productive wells,
Cd = 0.5 · CAPEX · (1/ps − 1),
Where ps is the drilling success rate and 0.5 is the share of wells in CAPEX (modelling assumption);
IDC is the interest during construction; and
Cm is the annual cost of make-up wells due to reservoir decline.
The reference case is the Calientes field (category A) connected to the Toquepala–Cuajone–Quellaveco cluster. Table 3 presents the triangular input distributions; sensitivity was quantified with Spearman's coefficient and a tornado analysis.
To assess the representativeness of the reference case, the system LCOE was also estimated for each of the eight fields, connecting each field to the nearest mining operation: Toquepala, Cuajone or Quellaveco for the fields in Moquegua and Tacna, and Cerro Verde for those in Arequipa. Euclidean distances were calculated with the Haversine formula from the coordinates of each field and the centre of each open pit, and were modelled with a ±10% triangular distribution; for Calientes and Achumani–Chivay, distributions of 30–60–110 km and 90–100–110 km, respectively, were used, which contain the calculated distances. The cost of the dedicated line is allocated over the nominal capacity of each field.
For lower-temperature reservoirs (Casiri–Kallapuma, Calacoa–Putina and Ccollo–Titire), a binary cycle with 15% higher CAPEX was assumed according to NREL's Annual Technology Baseline [33], and for category C a drilling success rate of 0.50–0.70–0.85. The results are summarized as a supply curve and as the capacity-weighted average LCOE (Table 9). The coordinates of the fields and mining operations, as well as the calculated distances, are detailed in Appendix A (Table A1 and Table A2).
For the Calientes reference case (100 MWe, category A) connected to the Toquepala–Cuajone–Quellaveco cluster (d = 60 km; tortuosity factor of 1.4, equivalent to an effective distance of 84 km), the transmission investment was estimated at Cₜ = 504 USD/kW. With a modal drilling success rate pₛ = 0.80, the overrun from non-productive wells adds Cd = 600 USD/kW, giving a base CAPEX including IDC (16.6%) of 6,884 USD/kW. Applying CRF = 0.088827 (r = 8%, n = 30 years), annual fixed operation and make-up costs (OPEX + Cm = 160 USD/kW-year) and a capacity factor CF = 0.88 yields a total annual cost of 771.5 USD/kW-year, which sets a modal reference system LCOE of 100.1 USD/MWh (its cumulative cascade is presented in Table 8).
The comparison alternatives have equivalent firmness:
- Natural gas combined cycle, whose availability in the south depends on the Integrated Gas Transport System (SIT Gas, formerly the Southern Peruvian Gas Pipeline), a project without award or firm commercial operation date [4];
- Solar photovoltaic and wind with battery energy storage (BESS) oversized for continuous 24-hour firm supply;
- A bilateral supply contract as a free (unregulated) customer of the SEIN; and
- Diesel-fired backup generation. Their levelized costs were modelled with triangular distributions of 60–75–100 USD/MWh [38], 90–120–160 USD/MWh [37,38] and 45–58–80 USD/MWh [3] for the first three, respectively. The cost of diesel backup was estimated from its components: specific consumption of 0.25–0.26–0.28 L/kWh, fuel price excluding VAT of 0.85–0.95–1.15 USD/L, O&M of 15–20–30 USD/MWh and capital recovery of 10–15–25 USD/MWh.
The costs of the alternatives are levelized generation costs or contract prices taken 10000000from the literature and do not include system components equivalent to those of the geothermal LCOE: natural gas excludes the cost of the pipeline; solar-wind with storage, its dedicated connection; and the SEIN contract, transmission tolls. This asymmetry favours the alternatives, so comparisons in which geothermal energy is competitive are conservative, and the cost gaps relative to gas and the SEIN are upper bounds. To bound the effect of the dedicated-connection assumption, the geothermal LCOE was also estimated without a dedicated line, which corresponds to injection into the SEIN near the field and excludes the tolls that would be paid in that case.
For the SEIN contract, the hydrological risk that motivates this study was also assessed. In each year of a 30-year lifetime, a severe drought occurs with probability pd, during which a fraction α of the energy is settled at the marginal cost observed in 2022–2023 (≈200 USD/MWh) [5]. Three illustrative scenarios were analysed: (pd; α) = (0.10; 0.30), (0.15; 0.50) and (0.20; 0.50). Because the supply-security score of the SEIN already reflects its hydrological exposure (Section 4.4), these scenarios are interpreted as an upper bound of the effect of hydrological risk in the multi-criteria analysis.
4.4. Multi-Criteria Analysis (SO4)
Five criteria (Supply Security (SS), Economic Viability (EV), Infrastructure and Logistics (IL), Environmental Performance (EP) and Social License (SL)) were weighted using the Analytic Hierarchy Process [43]. The weights are the normalized principal eigenvector of the pairwise comparison matrix A, and their consistency was verified with:
with n = 5 and RI = 1.12.
CI = (λₘₐₓ − n) / (n − 1); CR = CI / RI
The weighting matrix adopted as the base case (Table 4) yields λₘₐₓ = 5.033 and CR = 0.0074, comfortably meeting the internal consistency criterion (CR < 0.10). To mitigate the uncertainty inherent in deterministic weight assignment and to verify the stability of the ranking under alternative preferences, these weights were subjected to a robustness test with 20,000 stochastic simulations using Dirichlet distributions and a critical-weight sensitivity analysis (results are presented in Section 5.4, Table 11 and Figure 8).
Scores (1–5 scale) were derived from quantitative indicators and a qualitative rubric (Table 10 and Appendix B).
EV is a linear function of the LCOE:
Bounded to the interval [1, 5].
Similarly, EP is a linear decreasing function of emission intensity:
With E in gCO₂eq/kWh and EP bounded to the interval [1, 5]. The life-cycle intensities correspond to the technology medians of the IPCC Fifth Assessment Report [39]: 38 gCO₂eq/kWh for geothermal energy, 490 gCO₂eq/kWh for gas combined cycle and 48 gCO₂eq/kWh for utility-scale photovoltaics, a value adopted for solar-wind with storage as the larger of its two components (onshore wind: 11 gCO₂eq/kWh), without including the footprint of the batteries. For the SEIN contract, the hydropower median (24 gCO₂eq/kWh) was weighted by the system's hydropower share (55%) [5] and the gas combined-cycle median was assigned to the remaining 45%, giving 234 gCO₂eq/kWh; this figure is an upper bound, because part of the non-hydro generation is solar and wind, and halving it is evaluated as a sensitivity (Table 11).
The SS, IL and SL criteria were assigned using the qualitative rubric in Appendix B: SS assesses firmness and hydrological and fuel exposure; IL, the requirements and extent of new transport or transmission infrastructure; and SL, the socio-environmental conflict associated with each technology. EP is restricted to emissions to avoid overlap with SL. Diesel backup is not included in the multi-criteria analysis because it is not a baseload supply alternative; its cost (Section 5.3) and emissions would place it at the minimum of the EV and EP scales.
The robustness of the results was evaluated through 20,000 Monte Carlo simulations combining weights sampled from Dirichlet distributions (α = 50·w, centred on the reference AHP weights, and α = 1, non-informative), LCOE values sampled from their probability distributions and uniform uncertainty of ±0.5 in the qualitative scores, bounded to the interval [1, 5]. In addition, the critical EV weight above which geothermal energy loses first place was determined (redistributing the remaining weights proportionally), and the ranking was cross-checked with the TOPSIS method [44], with vector normalization, the same AHP weights and ideal and anti-ideal solutions defined by the maximum and minimum values of each criterion; all criteria were treated as benefit criteria, since EV and EP are constructed as decreasing functions of cost and emissions.
3. Results
3.1. Deployable Resource and Installable Capacity
The three schemes produce the same mean (≈691 MWe) but differ in dispersion (Table 5; Figure 4). With binary, independent exploration success, the P90 falls from 619 to 510 MWe; with inter-field correlation (ρ = 0.5), it falls to 343 MWe. Correlation also shifts the median (741 MWe) above the mean, because simultaneous failures generate a longer lower tail. The probability of exceeding 380 MW, the incremental demand of the high scenario in 2031, is 88.2% in the base case, and that of exceeding 497 MW, the base-scenario demand in 2040, is 80.7%.
With success probabilities differentiated by category, the mean deployable resource falls to 673 MWe and the P90 to 318 MWe in the intermediate scenario, and to 615 MWe and 230 MWe in the conservative scenario. The probability of fully covering base demand in 2040 changes from 75.9% to 74.3% and 66.0%, respectively; the result is robust in the intermediate scenario but sensitive to a lower success probability in category C fields.
Installable capacity is zero until 2032 in all simulations and only exceeds zero at the 10th percentile from 2033 onwards (Figure 5). In 2035 it reaches a median of 123 MW (P90–P10: 0–319 MW); in 2037, 382 MW (131–580 MW); and in 2040, 673 MW (304–899 MW).
5.2. Coverage of Incremental Mining Demand
Base-scenario incremental mining demand grows from 266 MW in 2031 to 497 MW in 2040 (low scenario: 171–320 MW; high: 380–710 MW). The probability that geothermal energy covers base demand is zero until 2034 and increases rapidly from 2035 (Table 6). In 2040, installable capacity covers 100% of base demand with 75.9% probability and at least 50% with 92.6%. In the high scenario, the median installable capacity (673 MW) roughly matches 2040 demand (710 MW).
When coverage is evaluated with average available capacity (capacity factor of 0.88), the probability of fully covering base demand falls from 71.5% to 61.3% in 2038 and from 75.9% to 67.8% in 2040; with an additional 5% parasitic load, it falls to 63.5% in 2040. The probability of covering at least half of the demand in 2040 hardly changes (91.0%).
Coverage is more sensitive to the development schedule than to resource assumptions (Table 7). A delay of up to six years, a two-year shift of all CODs or phased development reduces the probability of fully covering base demand in 2040 from 75.9% to 56–62%, and in 2038 from 71.5% to 14–24%. If the shift and delays of up to six years are combined, this probability falls to 16% in 2040. The probability of covering at least half of the demand in 2040 remains between 88% and 90% in the three individual variants.
5.3. System Levelized Cost of Electricity
With the modal values in Table 3, the LCOE increases from 65.7 USD/MWh (wellhead plant with 95% CF) to 100.1 USD/MWh when all system components are included (Table 8). Interest during construction (+11.3 USD/MWh) and drilling risk (+6.9 USD/MWh) are the largest additional components.

Table 8.
Geothermal LCOE cascade with modal values (USD/MWh).
| Cumulative component | LCOE (USD/MWh) |
| Wellhead plant, 95% CF (theoretical reference) | 65.7 |
| Plant with 88% CF | 70.9 |
| + Transmission (60 km × 1.4 tortuosity) | 76.7 |
| + Drilling risk (80% success) | 83.6 |
| + Interest during construction (16.6%) | 94.9 |
| + Make-up wells (40 USD/kW-year) | 100.1 |
The multivariate simulation yields a median of 111.3 USD/MWh (P10–P90: 96.5–129.2), above the modal value owing to the positive skewness of the input distributions. The LCOE exceeds 85 USD/MWh in 99.5% of simulations and 115 USD/MWh in 39.0%. The most influential variables are CAPEX (Spearman's ρ = 0.64) and WACC (0.54), followed by the capacity factor (−0.30) and drilling success (−0.30) (Figure 6).
Compared with the firm alternatives (Figure 7), the geothermal LCOE is lower than that of diesel backup in all simulations (diesel median: 296 USD/MWh; P10–P90: 274–322) and lower than that of solar-wind with 24-hour storage in 71.5% of cases. It is higher than that of the gas combined cycle (median 78 USD/MWh) and the SEIN contract (60 USD/MWh) in virtually all simulations. Because the costs of the alternatives exclude system components (Section 4.3), these gaps are upper bounds. Without a dedicated transmission line, the median geothermal LCOE falls from 111.3 to 103.3 USD/MWh, excluding the SEIN tolls that would replace that cost.
Two policy instruments substantially change the result. With modal values, reducing the WACC from 8% to 6% lowers the LCOE from 100.1 to 85.6 USD/MWh; eliminating the cost overrun from non-productive wells (e.g., through a drilling-risk guarantee fund) reduces it to 92.0 USD/MWh; and both combined, to 79.0 USD/MWh. In these calculations, IDC was held at 16.6%; since IDC also decreases with the WACC, the estimated reductions are conservative.
Table 9 presents the system LCOE of the eight fields, each connected to the nearest mining operation and with the line cost allocated over its capacity. The median ranges from 106 USD/MWh at Tutupaca, located 29 km from Quellaveco, to 134 USD/MWh at Ccollo–Titire, and the capacity-weighted average is 115.7 USD/MWh, about 4 USD/MWh above the reference case. Ccollo–Titire, the smallest binary-cycle field, lies at the upper end of the curve because the line cost is spread over few megawatts, whereas Achumani–Chivay, despite its distance, lies close to the reference case owing to its larger capacity.
Table 9.
Supply curve: system LCOE by field, connected to the nearest mining operation (USD/MWh; N = 100,000).
Table 9.
Supply curve: system LCOE by field, connected to the nearest mining operation (USD/MWh; N = 100,000).
| Field | Cat. | MWe | Connection | Dist. (km) | Cycle | LCOE P50 | P10–P90 | Cum. MWe |
| Tutupaca | B | 113.8 | Quellaveco | 28.7 | Flash | 106.3 | 92.0–123.6 | 113.8 |
| Achumani–Chivay | B | 162.9 | Cerro Verde | 100.0 | Flash | 110.7 | 96.1–128.3 | 276.7 |
| Calientes | A | 100 | Toquepala–Cuajone–Quellaveco | 60.0 | Flash | 111.3 | 96.5–129.2 | 376.7 |
| Ancocollo | C | 120 | Toquepala | 56.7 | Flash | 114.8 | 98.8–134.3 | 496.7 |
| Paucarani–Kovire | C | 132 | Toquepala | 96.7 | Flash | 117.9 | 101.7–137.7 | 628.7 |
| Calacoa–Putina | B | 108.2 | Cuajone | 34.9 | Binary | 119.4 | 103.1–139.2 | 736.9 |
| Casiri–Kallapuma0+ | B | 135 | Toquepala | 89.6 | Binary | 123.5 | 106.9–143.7 | 871.9 |
| Ccollo–Titire | C | 39.7 | Quellaveco | 39.5 | Binary | 134.2 | 115.5–157.0 | 911.6 |
| Weighted average | 911.6 | 115.7 |
Note: Euclidean (Haversine) distance used as the mode of a ±10% triangular distribution; for Calientes and Achumani–Chivay, the base-case distributions were used (30–60–110 km and 90–100–110 km). The cost of the dedicated line is allocated over the nominal capacity of each field. Binary cycle: CAPEX +15%; category C: drilling success 0.50–0.70–0.85. Coordinates and connection distances are given in Appendix A.
5.4. Multi-Criteria Analysis
Table 10 presents the performance matrix and weighted scores. With the AHP weights, geothermal energy obtains the highest score (3.96), followed by the SEIN contract (3.57), solar-wind with storage (3.21) and natural gas (3.01). TOPSIS reproduces geothermal energy's first place (closeness coefficient 0.657 versus 0.439 for the SEIN), keeps the SEIN in second place and reverses the order of natural gas and solar-wind with storage in third and fourth place.
Table 10.
Performance matrix (1–5) and multi-criteria results.
| Alternative | SS | EV | IL | EP | SL | AHP | TOPSIS |
| Geothermal (EVS) | 5.0 | 2.55 | 3.0 | 4.66 | 3.5 | 3.96 | 0.657 |
| Natural gas CC | 3.5 | 3.89 | 2.0 | 1.00 | 3.0 | 3.01 | 0.403 |
| Solar-wind + 24 h BESS | 3.0 | 2.10 | 4.0 | 4.57 | 4.0 | 3.21 | 0.366 |
| SEIN contract | 2.5 | 4.58 | 5.0 | 2.92 | 4.5 | 3.57 | 0.439 |
| AHP weight | 0.403 | 0.244 | 0.137 | 0.137 | 0.079 |
With weights perturbed around the AHP values, geothermal energy ranks first in 84.5% of simulations and the SEIN contract in 15.3% (Figure 8). With non-informative weights, the order is reversed: the SEIN ranks first in 55.2% and geothermal energy in 36.3%. The critical-weight analysis shows that geothermal energy loses first place to the SEIN when the EV weight exceeds 37% (current: 24.4%) and retains it only if the SS weight is at least 29% (current: 40.3%) (Figure 9).
Table 11 summarizes the sensitivity of the multi-criteria ranking to four additional assumptions. First, with the reference weights, geothermal energy retains first place as long as its SS score is at least 4.02: with SS = 4.5 it ranks first in 72.2% of simulations, and with SS = 4.0 the SEIN contract moves to first place. Second, with the weighted LCOE of the eight fields (115.7 USD/MWh), geothermal energy remains first, although the critical EV weight falls to 35%. Third, if the emission intensity of the SEIN is halved, geothermal energy remains first, with a critical EV weight of 33%. Fourth, internalizing hydrological risk in the cost of the SEIN contract raises its expected cost to 65–74 USD/MWh and the critical EV weight to 39–44%; because the SS score of the SEIN already reflects this exposure, this result is an upper bound.
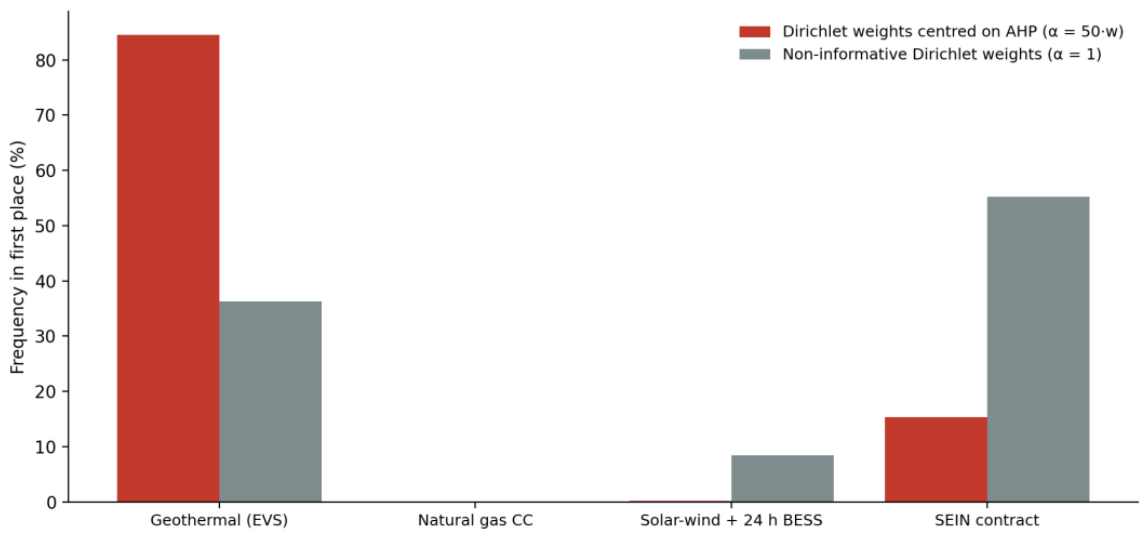
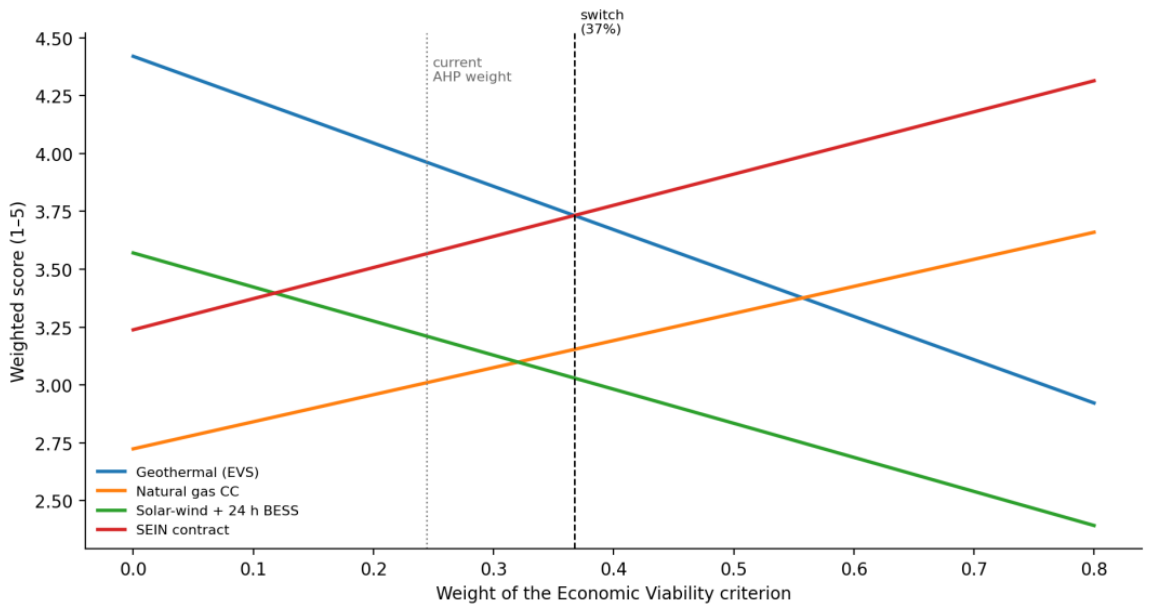
Table 11.
Sensitivity of the multi-criteria analysis to geothermal supply security, field-level LCOE and SEIN hydrological risk.
Table 11.
Sensitivity of the multi-criteria analysis to geothermal supply security, field-level LCOE and SEIN hydrological risk.
| Scenario | AHP score geothermal | AHP score SEIN | Geothermal 1st (AHP weights) | Geothermal 1st (non-informative weights) | Critical EV weight |
| Base (SS = 5.0; LCOE 111.3; SEIN without risk) | 3.96 | 3.57 | 84.5% | 36.3% | 36.7% |
| SS geothermal = 4.5 | 3.76 | 3.57 | 72.2% | 31.8% | 31.0% |
| SS geothermal = 4.25 | 3.66 | 3.57 | 61.9% | 28.2% | 27.7% |
| SS geothermal = 4.0 | 3.56 | 3.57 | 49.4% | 24.2% | 24.2%* |
| SS geothermal = 3.5 | 3.36 | 3.57 | 24.1% | 15.4% | 15.8%* |
| Weighted LCOE of 8 fields (115.7) | 3.92 | 3.57 | 80.5% | 34.8% | 34.8% |
| SEIN: drought 10%/year, 30% exposed (64.6) | 3.96 | 3.53 | 87.2% | 37.5% | 38.7% |
| SEIN: drought 15%/year, 50% exposed (70.9) | 3.96 | 3.46 | 90.9% | 39.2% | 42.2% |
| SEIN: drought 20%/year, 50% exposed (74.4) | 3.96 | 3.43 | 92.4% | 40.4% | 44.4% |
| SEIN: emission intensity halved (117) | 3.96 | 3.71 | 73.8% | 28.6% | 32.8% |
* Critical weight below the reference AHP weight of EV (24.4%): with the reference weights, the SEIN contract ranks first. In parentheses, LCOE (USD/MWh) or emission intensity (gCO₂eq/kWh). Frequencies calculated with 20,000 simulations and qualitative scores bounded to [1, 5]. The hydrological-risk scenarios are an upper bound, because the SS score of the SEIN already reflects its hydrological exposure.
Figure 8.
Frequency with which each alternative ranks first in 20,000 simulations combining Dirichlet weights, sampled LCOEs and ±0.5 uncertainty in the qualitative scores. Source: own elaboration.
Figure 8.
Frequency with which each alternative ranks first in 20,000 simulations combining Dirichlet weights, sampled LCOEs and ±0.5 uncertainty in the qualitative scores. Source: own elaboration.
Figure 9.
Weighted score of each alternative as a function of the weight assigned to Economic Viability (the other weights are rescaled proportionally). The dashed line marks the threshold at which first place changes (37%). Source: own elaboration.
Figure 9.
Weighted score of each alternative as a function of the weight assigned to Economic Viability (the other weights are rescaled proportionally). The dashed line marks the threshold at which first place changes (37%). Source: own elaboration.
6. Discussion
6.1. The Resource is not the Constraint; Exploration Risk and Time Are
The mean deployable resource is stable (≈691 MWe) across all schemes, indicating that the size of the inferred resource is not, in itself, the constraint for the projected incremental mining demand, although this size can only be confirmed by drilling. What changes with the risk formulation is the lower tail: modelling exploration success as a continuous multiplier averages the risk of eight fields and produces an optimistic P90 (619 MWe), whereas the binary nature of success and inter-field correlation reduce it to 343 MWe. This result agrees with the experience of Sánchez-Alfaro et al. [20] in Chile, where decades of exploration produced a single plant, and with the play fairway analysis of Lindsey et al. [19] in the Argentine Puna, which identifies favourable zones but does not by itself reduce drilling uncertainty. For supply decisions, the correlated P90 is the relevant figure, not the mean.
Time is the second and most influential constraint. Under the base-case assumptions, no field enters operation before 2033, so geothermal energy cannot respond to the demand arising between 2027 and 2032. Furthermore, additional delays, a schedule shift or phased development reduce the probability of full coverage in 2040 by 14 to 20 percentage points (Table 7), an effect larger than that of the conservative category-based success scenario (10 points) or of inter-field correlation. Comparing the total resource with the demand gap of a given year, without considering the development schedule, would lead to a different conclusion. In the corridor studied, geothermal energy is a firm supply option for the 2035–2045 decade, complementary to solutions covering the immediate period.
The Achumani case illustrates both constraints. The exploration authorization was granted in 2012 and, eight years later, EDC Energía Verde Perú submitted the preliminary environmental assessment of a 110 MW, two-unit plant with an estimated investment of about USD 560 million and commercial operation planned for 2027 [31,45]. This investment is equivalent to about 5,100 USD/kW, within the CAPEX range adopted in Table 3. However, the company did not maintain the guarantee for exploration phase II, which comprises exploratory drilling; the Ministry of Energy and Mines (MINEM) executed the performance bond in 2024 and declared the authorization void in June 2025 [46]. Thirteen years after the authorization was granted, the resource remains unconfirmed, which is consistent with the modelled timelines and exploration risk, under which no category B field would enter operation before 2035.
6.2. Cost Mechanisms of Electricity Delivered to the Mine
The wellhead LCOE estimated for the Calientes reference field (70.9 USD/MWh with 88% CF; 65.7 USD/MWh with 95% CF) falls within the cost range of international hydrothermal generation [9,47]. However, the cost of firm electricity delivered to the mine is 41% higher in the modal case (100.1 USD/MWh) and 57% higher at the stochastic median (111.3 USD/MWh; P10–P90: 96.5–129.2 USD/MWh). This increase reflects three factors: (i) high capital intensity, which amplifies financing costs during construction (IDC adds 11.3 USD/MWh); (ii) drilling risk, which imposes cost overruns from non-commercial wells (6.9 USD/MWh), an effect of risk on geothermal LCOE also documented by Park et al. [48]; and (iii) the distance between reservoirs and mining operations, which requires dedicated 220 kV lines in rugged terrain (5.8 USD/MWh for the 84 effective km between Calientes and the Toquepala–Cuajone–Quellaveco cluster).
Cerro Pabellón, in the same Central Volcanic Zone and at a similar altitude, demonstrates the technical feasibility of high-altitude Andean geothermal generation [24]. However, its investment costs and sales prices are not publicly available in sufficient detail, so the estimated LCOE could not be compared with them; this comparison remains a pending validation task.
The supply curve in Table 9 makes it possible to assess the representativeness of the reference case. The median system LCOE ranges from 106 USD/MWh (Tutupaca, 29 km from Quellaveco) to 134 USD/MWh (Ccollo–Titire), with a capacity-weighted average of 116 USD/MWh. Smaller binary-cycle fields lie at the upper end because the cost of the dedicated line is spread over few megawatts, which suggests that their joint connection with neighbouring fields or injection into the SEIN would be preferable to a dedicated line. Although Tutupaca and Achumani–Chivay show similar or lower costs than Calientes, the latter is kept as the reference case because it is the only field ready for confirmation drilling and with the earliest operation date (2033). Consequently, the cost of the aggregate capacity that would cover 2040 demand is about 4 USD/MWh higher than that of the reference case.
Nevertheless, at elevations above 4,000 m a.s.l., lower barometric pressure reduces the efficiency of atmospheric cooling and can degrade net output, while non-condensable gases tend to increase the parasitic load of gas extraction and operating costs. Because these factors were not modelled explicitly, except approximately in the coverage sensitivity, they are additional sources of uncertainty that would shift the LCOE towards the upper end of its distribution.
6.3. When Geothermal Energy is Preferable
Geothermal energy is not the least-cost alternative: the SEIN contract and, if gas supply were available in the south, the combined cycle is cheaper. Its multi-criteria preference rests on supply security and environmental performance. The 37% threshold for the economic weight provides an operational rule: for a decision-maker who values direct cost above that level (for example, an operation with long-term contracts and low perceived drought exposure), the grid is preferable; for one who prioritizes firmness and hydrological independence, geothermal energy is. This reading is consistent with Kizielewicz and Sałabun [49], who show that the robustness of a multi-criteria ranking should be assessed against broad changes in weights and not only small perturbations. With non-informative weights, geothermal energy does not dominate, so its advantage is not universal but conditional on decision-makers' preferences. Three additional considerations qualify this reading (Table 11). First, the preference for geothermal energy depends on its supply security being rated at least 4.02 out of 5, a value that can only be sustained after confirmation drilling. Second, internalizing hydrological risk in the cost of the SEIN contract shifts the economic threshold to 39–44%; because the SS score already penalizes this exposure, this shift should be read as an upper bound. Third, the multi-criteria comparison treats the alternatives as simultaneously available, although the SEIN contract is available immediately and geothermal energy only from 2033; the result therefore expresses a preference for supply in the 2035–2045 decade and not for the immediate period.
6.4. Implications for Energy Policy and Industry
The levers with the greatest effect on cost are financial, not geological. Concessional finance that lowers the WACC by two points and a drilling-risk coverage mechanism would reduce the system LCOE from ≈100 to ≈79 USD/MWh, close to that of a gas combined cycle. These instruments (exploration risk mitigation funds and blended finance schemes) have been recommended for emerging markets [10,42], and their absence was identified as the main barrier in Chile [20]. For industry, the logical sequence is confirmation drilling at the category A field (Calientes), which would reduce the main source of uncertainty before committing to power purchase agreements.
Cascade use of residual heat for leaching, concentrate drying or camp heating, documented at Lihir [50] and supported by leaching kinetics [51], could add value, but only if the thermal load is located near the field: transporting low-temperature heat is not economical over distances of 30–110 km. Likewise, the recovery of lithium, boron or potassium from brines [23] requires composition data that do not exist for the EVS. Both benefits were excluded from the LCOE and should be treated as hypotheses.
6.5. Limitations
The results should be interpreted in light of five groups of limitations.
First, the resource: the potentials correspond to inferred resources (UNFC), estimated with heterogeneous methods and without deep drilling to confirm them. The correlation between reservoirs (ρ) cannot be calibrated without producing fields, which conditions the P90 and motivated its sensitivity analysis. The development schedule is based on category-specific assumptions; although its sensitivity was assessed (Table 7), constraints on drilling-rig availability or on capital for the simultaneous development of several fields were not modelled. Nor were the effects of high altitude on cooling efficiency or the parasitic load of non-condensable gases modelled, except approximately in the coverage based on average available capacity.
Second, costs: the LCOEs of the alternatives come from literature ranges, not from SEIN dispatch simulations, and exclude system components equivalent to those of the geothermal LCOE (pipeline, connections and tolls). Interest during construction was sampled independently of the WACC, and pre-drilling exploration costs, taxes and royalties were not included. The drought scenarios are illustrative, and the field-level supply curve uses Euclidean distances and technological assumptions (binary cycle and lower drilling success in category C) that require route-specific and reservoir-specific studies.
Third, demand: the mining portfolio was modelled in aggregate, without distinguishing the contractual or permitting progress of each project owner.
Fourth, multi-criteria judgment: although the AHP matrix is consistent (CR = 0.007), the weights reflect the author's judgment contrasted with the literature rather than a formal consultation with decision-makers; the SS, IL and SL scores come from a qualitative rubric; and the comparison assumes the simultaneous availability of the alternatives.
Fifth, the socio-environmental dimension: prior consultation, easements and social conflict are represented only indirectly, through the random schedule delay and the social license score.
7. Conclusions
This study assessed, with explicit uncertainty, whether the geothermal resources of the Southern Volcanic Axis can supply firm power to the incremental mining demand of the Arequipa–Moquegua–Tacna corridor. The conclusions address the four specific objectives.
(SO1) The eight fields assessed contain a deployable inferred resource with a mean of 691 MWe and a P90 of 343 MWe when exploration success is modelled as binary and correlated across fields. Under the base-case timelines, installable capacity is zero before 2033 and reaches a median of 673 MW in 2040. If the success probability is differentiated by maturity category, the P90 falls to 230–318 MWe.
(SO2) Geothermal energy cannot cover incremental mining demand before 2035. From that year, its probability of covering at least half of the base-scenario demand increases from 39% to 93% in 2040, and that of covering it fully reaches 76% in 2040 (68% with capacity adjusted by capacity factor). This probability is more sensitive to the schedule than to the resource: delays of up to six years, a two-year shift or phased development reduce it to 56–62%. Exploration uncertainty and time, rather than resource size, limit its contribution, which corresponds to that of a structural, medium-term firm supply.
(SO3) The median cost of geothermal electricity delivered to the mine from the reference field (Calientes) is 111 USD/MWh (P10–P90: 96–129), lower than diesel backup and, in 71% of cases, lower than solar-wind with 24-hour storage, but higher than natural gas and the grid contract; because the costs of these alternatives exclude system components, these gaps are upper bounds. CAPEX and the cost of capital explain most of the variability; reducing the WACC by two points and covering drilling risk would lower the modal cost from ≈100 to ≈79 USD/MWh. Considering the eight fields connected to the nearest mine, the weighted cost rises to ≈116 USD/MWh (106–134 USD/MWh by field).
(SO4) Geothermal energy ranks first in the multi-criteria analysis in 85% of simulations with weights close to the AHP values, because it dominates in supply security and environmental performance; it loses this position to the grid when the weight of economic viability exceeds 37%. This preference requires the supply security of geothermal energy to be rated at least 4.02 out of 5, which depends on confirming the resource by drilling, and refers to supply after 2033.
Overall, geothermal energy from the Southern Volcanic Axis is a technically plausible firm, low-carbon option for mining in southern Peru, but it is neither immediate nor the least-cost option. Its viability depends on reducing exploration risk, the cost of capital and development time. The decisive step is confirmation drilling at the Calientes field; future work should develop a play fairway analysis with primary data, model cost-distance transmission routes, evaluate the co-location of thermal loads and compare the estimated costs with data from operating projects in the Central Andes.
Author Contributions
Conceptualization, E.G.; methodology, E.G.; software, S.G.; formal analysis, E.G.; data curation, E.G and S.G..; writing, original draft preparation, E.G.; writing, review and editing, E.G. and S.G.; visualization, S.G. The author has read and agreed to the published version of the manuscript.
Funding
This research received no external funding.
Institutional Review Board Statement
Not applicable.
Informed Consent Statement
Not applicable.
Data Availability Statement
Geothermal resource data are publicly available on INGEMMET’s GEOCATMIN portal (https://geocatmin.ingemmet.gob.pe). All input parameters are reported in Table 2 and Table 3 and Appendix A and Appendix B. The simulation code that generates all numerical results, Table 5, Table 6, Table 7, Table 8, Table 9, Table 10 and Table 11 and Figure 4, Figure 5, Figure 6, Figure 7, Figure 8 and Figure 9 is described in Appendix C and is openly available in Zenodo at https://doi.org/10.5281/zenodo.23463646.
Acknowledgments
During the preparation of this manuscript, the author used Claude Opus 5.5 (Anthropic) for the purposes of translation, verification of calculations and programming of the simulation (Appendix C). The author has reviewed and edited the output and takes full responsibility for the content of this publication.
Conflicts of Interest
The author declares no conflicts of interest.
Abbreviations
The following abbreviations are used in this manuscript:
AHP Analytic Hierarchy Process
BESS Battery energy storage system
CAPEX Capital expenditure
CC Combined cycle
CF Capacity factor
CI Consistency index
COD Commercial operation date
COES Comité de Operación Económica del Sistema Interconectado Nacional (system operator of the SEIN)
CR Consistency ratio
CRF Capital recovery factor
EGS Enhanced geothermal system
EP Environmental Performance
EV Economic Viability
EVS Eje Volcánico Sur (Southern Volcanic Axis)
IDC Interest during construction
IEA International Energy Agency
IL Infrastructure and Logistics
INGEMMET Instituto Geológico, Minero y Metalúrgico (Geological, Mining and Metallurgical Institute of Peru)
IPCC Intergovernmental Panel on Climate Change
IRENA International Renewable Energy Agency
JICA Japan International Cooperation Agency
LCOE Levelized cost of electricity
MINEM Ministerio de Energía y Minas (Ministry of Energy and Mines of Peru)
MT Magnetotelluric
NREL National Renewable Energy Laboratory
OPEX Operation and maintenance expenditure
OSINERGMIN Organismo Supervisor de la Inversión en Energía y Minería (energy and mining regulator of Peru)
RI Random index
SEIN Sistema Eléctrico Interconectado Nacional (National Interconnected Electric System)
SIT Gas Sistema Integrado de Transporte de Gas (Integrated Gas Transport System)
SL Social License
SO Specific objective
SS Supply Security
TOPSIS Technique for Order of Preference by Similarity to Ideal Solution
UNFC United Nations Framework Classification for Resources
WACC Weighted average cost of capital
Appendix A
Coordinates of the geothermal fields and mining operations
Table A1 and Table A2 document the coordinates used to calculate the connection distances of the supply curve (Table 9). Each field was connected to the nearest mining operation in its region: Toquepala, Cuajone or Quellaveco for the fields in Moquegua and Tacna, and Cerro Verde for those in Arequipa. Euclidean distances were calculated with the Haversine formula (Earth radius of 6,371 km); the effective distance applies the modal tortuosity factor of 1.4 (Table 3).
Table A1.
Coordinates of the EVS geothermal fields and distance to the connected mining operation.
| Field | Region | Cat. | Latitude (°) | Longitude (°) | Connected mine | Euclidean distance (km) | Effective distance (km) |
| Calientes | Tacna | A | −17.2181 | −70.1425 | Toquepala | 50.4† | 70.6 |
| Achumani–Chivay | Arequipa | B | −15.6080 | −71.8170 | Cerro Verde | 105.4† | 147.6 |
| Casiri–Kallapuma | Tacna | B | −17.4700 | −69.8100 | Toquepala | 89.6 | 125.5 |
| Tutupaca | Tacna | B | −17.0300 | −70.3600 | Quellaveco | 28.7 | 40.2 |
| Calacoa–Putina | Moquegua | B | −16.7300 | −70.6800 | Cuajone | 34.9 | 48.9 |
| Paucarani–Kovire | Tacna | C | −17.5000 | −69.7500 | Toquepala | 96.7 | 135.4 |
| Ancocollo | Tacna | C | −17.2500 | −70.0833 | Toquepala | 56.7 | 79.4 |
| Ccollo–Titire | Moquegua | C | −16.8900 | −70.3200 | Quellaveco | 39.5 | 55.3 |
Note: coordinates in decimal degrees (WGS 84), according to INGEMMET [18]. Effective distance = Euclidean distance × 1.4. † In the base-case simulation (Section 4.3), triangular distributions of 30–60–110 km were used for Calientes (Toquepala–Cuajone–Quellaveco cluster; 50.4 km to Toquepala, 52.4 km to Quellaveco and 63.2 km to Cuajone) and of 90–100–110 km for Achumani–Chivay, whose ranges contain the calculated distances.
Table A2.
Coordinates of the connected mining operations.
| Mine | Region | Owner | Latitude (°) | Longitude (°) | Source |
| Toquepala | Tacna | Southern Peru Copper Corporation | −17.233 | −70.617 | Approximate (±2–3 km) |
| Cuajone | Moquegua | Southern Peru Copper Corporation | −17.043 | −70.708 | Southern Copper Corporation [40] |
| Quellaveco | Moquegua | Anglo American Quellaveco S.A. | −17.100 | −70.620 | Approximate (±2–3 km) |
| Cerro Verde | Arequipa | Sociedad Minera Cerro Verde S.A.A. | −16.533 | −71.600 | Approximate (±2–3 km) |
Note: approximate centre of the open pit. The Cuajone coordinate corresponds to 17° 2.601' S and 70° 42.481' W. An error of ±3 km in the location of a mine changes the LCOE of the connected field by less than 0.5 USD/MWh.
Appendix B
Scoring rubric for the multi-criteria analysis
The qualitative scores in Table 10 were assigned using the rubric in Table B1, and Table B2 summarizes the justification of each score. SS evaluates the firmness of each technology once in operation; for geothermal energy, exploration risk is treated separately in the capacity simulation (Section 4.1) and in the sensitivity of the ranking to the SS score (Table 11). When an alternative combines features of two adjacent levels, it is assigned the intermediate value (e.g., 3.5). The quantitative criteria were calculated with Equations (5) and (6): EV from the median LCOE of each alternative (geothermal, 111.3; natural gas CC, 77.7; solar–wind + 24 h BESS, 122.5; SEIN contract, 60.4 USD/MWh) and EP from the emission intensities described in Section 4.4.
Table B1.
Rubric for the qualitative criteria (1–5 scale).
| Score | Supply Security (SS) | Infrastructure and logistics (IL) | Social License (SL) |
|---|---|---|---|
| 5 | Baseload generation independent of weather and of transported fuels. | No new infrastructure required (existing connection). | No associated socio-environmental conflict. |
| 4 | Firm generation with moderate dependence on an external input. | Low-complexity new infrastructure in accessible areas. | Low, localized conflict (e.g., extensive land use). |
| 3 | Firmness conditional on storage or on fuel infrastructure yet to be built. | Significant new infrastructure in difficult terrain (e.g. high mountains). | Moderate conflict associated with extractive or linear projects in high Andean areas. |
| 2 | Supply exposed to a documented systemic hydrological risk. | Depends on new regional infrastructure not yet awarded. | History of conflicts that have halted projects of the same technology. |
| 1 | Non-firm supply. | Depends on infrastructure without identified feasibility. | Widespread opposition. |
Note: The rubric is a constructed scale with verbal descriptors for each level, the type of attribute recommended when an objective lacks a natural quantifiable measure [52]; qualitative assessment of technical and social criteria is common in multi-criteria analysis applied to energy systems [53]. SS corresponds to availability and SL to acceptability, two of the four dimensions of energy security identified by Kruyt et al. [54]; IL is a technical criterion [53] that reflects the magnitude of the new infrastructure required. The SL descriptors follow the community acceptance dimension of Wüstenhagen et al. [55] and take into account that, in Peru, socio-environmental conflicts are concentrated in extractive activities [56]. The placement of each alternative on the scale (Table B2) is the author’s judgment; its uncertainty is represented by the ±0.5 perturbation described in Section 4.4.
Table B2.
Qualitative scores assigned and their justification.
| Alternative | SS | IL | SL | Justification |
|---|---|---|---|---|
| Geothermal (EVS) | 5.0 | 3.0 | 3.5 | Weather-independent baseload generation; requires wells, a plant above 4,000 m a.s.l. and a 30–110 km dedicated line; intervention in high Andean areas subject to prior consultation, with no record of geothermal power projects in the country. |
| Natural gas CC | 3.5 | 2.0 | 3.0 | Firm generation whose fuel supply in the south depends on SIT Gas, not awarded [4]; requires regional trunk infrastructure; long linear project in high Andean areas. |
| Solar-wind + 24 h BESS | 3.0 | 4.0 | 4.0 | Firmness conditional on 24 h storage; low-complexity plants and connections; conflict mainly associated with extensive land use. |
| SEIN contract | 2.5 | 5.0 | 4.5 | Firm contract, but with about 55% hydropower generation exposed to droughts such as that of 2022–2023 [5]; requires no new infrastructure or facilities in the territory. |
Appendix C
Simulation code and reproducibility
All results reported in Section 5, the derived values discussed in Section 6, Table 5, Table 6, Table 7, Table 8, Table 9, Table 10 and Table 11 and Figure 4, Figure 5, Figure 6, Figure 7, Figure 8 and Figure 9 are generated with the Python package geomin (version 15), which is openly available in Zenodo (geomin_code_v15.zip; https://doi.org/10.5281/zenodo.23463646) under the MIT License. The full calculation is run with the command python run_all.py, which writes the following files to the outputs folder: results.json, containing all values cited in the text; the tables in CSV format; and the figures in PNG format. Fixed random seeds ensure that repeated runs reproduce the reported values exactly. The code requires Python 3.10 or later, NumPy, SciPy and Matplotlib (tested with Python 3.12, NumPy 2.4, SciPy 1.17 and Matplotlib 3.10), and the full run takes less than one minute on a personal computer. Table C1 links each module to the corresponding results of the manuscript.
Table C1.
Code structure and correspondence with the results of the manuscript.
| Module | Content | Results |
|---|---|---|
| params.py | Input parameters (Table 2, Table 3 and Table 4; Appendix A and Appendix B) and random seeds | — |
| resource.py | Equation 1, schemes A–C, Gaussian copula and category-based success | Table 5; Figure 4 |
| schedule.py | Operation dates, delays, schedule variants, demand and coverage | Table 6 and Table 7; Figure 5 |
| lcoe.py | Equations (2) and (3), LCOE cascade, Monte Carlo simulation, supply curve, LCOE distributions of the alternatives and tornado analysis | Table 8 and Table 9; Figure 6 and Figure 7 |
| mcda.py | AHP and consistency check (Equation (4)), Equations (5) and (6), TOPSIS, critical weights and Monte Carlo robustness analysis with Dirichlet weights | Table 10 and Table 11; Figure 8 and Figure 9 |
| Stats.py | Inverse of the triangular distribution used for sampling | — |
| Figures.ph | Plotting functions | Figure 4, Figure 5, Figure 6, Figure 7, Figure 8 and Figure 9 |
| run_all.py | Full run and writing of results | results.json; CSV tables; PNG figures |
References
- International Energy Agency (IEA). The Role of Critical Minerals in Clean Energy Transitions; IEA: Paris, France, 2021. [Google Scholar]
- Pouresmaieli, M.; Ataei, M.; Pouresmaeili, E.; Nouri Qarahasanlou, A.; Barabadi, A. Renewable energy in the mining industry: Status, opportunities and challenges. Energy Strategy Rev. 2024, 52, 101311. [Google Scholar] [CrossRef]
- Organismo Supervisor de la Inversión en Energía y Minería (OSINERGMIN). Reporte de Análisis del Mercado Eléctrico y Clientes Libres en el SEIN—2024 [Analysis Report of the Electricity Market and Free Customers in the SEIN—2024]; OSINERGMIN: Lima, Peru, 2024; Available online: https://www.gob.pe/osinergmin.
- Ministerio de Energía y Minas (MINEM). Cartera de Proyectos de Inversión Minera 2025 [Mining Investment Project Portfolio 2025]; Dirección General de Promoción y Sostenibilidad Minera, MINEM: Lima, Peru, 2025; Available online: https://www.gob.pe/minem.
- Comité de Operación Económica del Sistema Interconectado Nacional (COES). Propuesta Definitiva de Actualización del Plan de Transmisión 2025–2034: Volumen I—Informe del Plan de Transmisión [Final Proposal for the Update of the 2025–2034 Transmission Plan: Volume I]; Technical Report COES/DP-01-2024; COES: Lima, Peru, 2024. [Google Scholar]
- Servicio Nacional de Meteorología e Hidrología del Perú (SENAMHI). Boletín de Monitoreo de Condiciones Secas y Húmedas N.° 05: Índice Estandarizado de Precipitación (SPI), Octubre 2022 [Monitoring Bulletin of Dry and Wet Conditions No. 05: Standardized Precipitation Index (SPI), October 2022]; SENAMHI: Lima, Peru, 2022; Available online: https://www.senamhi.gob.pe/load/file/02243SENA-51.pdf.
- Ministerio de Energía y Minas (MINEM). Estadística del Sector Eléctrico: Efectos de la Sequía en la Generación Hidroeléctrica 2022–2023 [Electricity Sector Statistics: Effects of the Drought on Hydropower Generation 2022–2023]; MINEM: Lima, Peru, 2023. [Google Scholar]
- Avila-Diaz, A.; Torres, R.R.; Zuluaga, C.F.; Cerón, W.L.; Oliveira, L.; Benezoli, V.; Rivera, I.A.; Marengo, J.A.; Wilson, A.B.; Medeiros, F. Current and future climate extremes over Latin America and Caribbean: Assessing Earth system models from High Resolution Model Intercomparison Project (HighResMIP). Earth Syst. Environ. 2023, 7, 99–130. [Google Scholar] [CrossRef] [PubMed]
- International Renewable Energy Agency (IRENA). Renewable Power Generation Costs in 2024; IRENA: Abu Dhabi, United Arab Emirates, 2025. [Google Scholar]
- International Energy Agency (IEA). The Future of Geothermal Energy; IEA: Paris, France, 2024. [Google Scholar]
- Ricks, W.; Voller, K.; Galban, G.; Norbeck, J.H.; Jenkins, J.D. The role of flexible geothermal power in decarbonized electricity systems. Nat. Energy 2025, 10, 28–40. [Google Scholar] [CrossRef]
- Henry, S.G.; Pollack, H.N. Terrestrial heat flow above the Andean subduction zone in Bolivia and Peru. J. Geophys. Res. Solid Earth 1988, 93, 15153–15162. [Google Scholar] [CrossRef]
- Springer, M.; Förster, A. Heat-flow density across the Central Andean subduction zone. Tectonophysics 1998, 291, 123–139. [Google Scholar] [CrossRef]
- Hamza, V.M.; Silva Dias, F.J.S.; Gomes, A.J.L.; Delgadilho Terceros, Z.G. Numerical and functional representations of regional heat flow in South America. Phys. Earth Planet. Inter. 2005, 152, 223–256. [Google Scholar] [CrossRef]
- Japan International Cooperation Agency (JICA). The Master Plan for Development of Geothermal Energy in Peru: Final Report; Ministry of Energy and Mines of Peru, JICA and West Japan Engineering Consultants: Lima, Peru, 2012. [Google Scholar]
- Taillefer, A.; Morata, D.; Valdenegro, P.; Cruz Pauccara, V.; Flores Jacobo, R.; Cuno, J.; Daniele, L. Characterization of Southern Peru hydrothermal systems: New perspectives for geothermal exploration along the Andean forearc. Geochem. Geophys. Geosyst. 2024, 25, e2023GC011344. [Google Scholar] [CrossRef]
- Alvarez Robles, Y.V.; Régis, C.; Branco, R.M.G.C.; Cruz Pauccara, V. Inversion of magnetotelluric data for the characterization of geothermal structures in the Paucarani zone, Tacna, Peru. J. S. Am. Earth Sci. 2025, 164, 105651. [Google Scholar] [CrossRef]
- Instituto Geológico; Minero y Metalúrgico (INGEMMET). Evaluación del Potencial Geotérmico en el Sur del Perú: Zona Geotermal Ancocollo–Vilacota, Región Tacna [Assessment of Geothermal Potential in Southern Peru: Ancocollo–Vilacota Geothermal Zone, Tacna Region]; Technical Report on Geothermal Resources, Activity GE38; INGEMMET: Lima, Peru, 2021; Available online: https://geocatmin.ingemmet.gob.pe.
- Lindsey, C.R.; Ayling, B.F.; Asato, G.; Seggiaro, R.; Carrizo, N.; Larcher, N.; Marquetti, C.; Naón, V.; Conde-Serra, A.; Faulds, J.E.; et al. Play fairway analysis for geothermal exploration in north-western Argentina. Geothermics 2021, 95, 102128. [Google Scholar] [CrossRef]
- Sánchez-Alfaro, P.; Sielfeld, G.; Van Campen, B.; Dobson, P.; Fuentes, V.; Reed, A.; Palma-Behnke, R.; Morata, D. Geothermal barriers, policies and economics in Chile—Lessons for the Andes. Renew. Sustain. Energy Rev. 2015, 51, 1390–1401. [Google Scholar] [CrossRef]
- De la Cruz Torres, D.G.; Mazadiego, L.F.; Bolonio, D.; Rodríguez Pons-Esparver, R. Long-term forecast of energy demand towards a sustainable future in renewable energies focused on geothermal energy in Peru (2020–2050): A LEAP model application. Sustainability 2024, 16, 4964. [Google Scholar] [CrossRef]
- Kassem, M.A.; Moscariello, A. Geothermal energy: A sustainable and cost-effective alternative for clean energy production and climate change mitigation. Sustain. Futur. 2025, 10, 101247. [Google Scholar] [CrossRef]
- Szanyi, J.; Rybach, L.; Abdulhaq, H.A. Geothermal energy and its potential for critical metal extraction—A review. Energies 2023, 16, 7168. [Google Scholar] [CrossRef]
- Cappetti, G.; Giorgi, N.; Arias, A.; Volpi, G.; Rivera, G.; Cei, M.; Fedeli, M.; Di Marzio, G.; Pasti, M.; Massei, S.; et al. The Cerro Pabellón geothermal project (Chile): From surface exploration to energy production. In Proceedings of the World Geothermal Congress 2020+1, Reykjavik, Iceland, 2021. [Google Scholar]
- Project InnerSpace. GeoMap™ South America [Interactive Geothermal Exploration Platform]. Available online: https://geomap.projectinnerspace.org/geomap/ (accessed on 15 July 2026).
- Cruz, V.; Guardia, X. Geothermal country update for Peru, 2015–2020. In Proceedings of the World Geothermal Congress 2020+1, Reykjavik, Iceland, 2021. [Google Scholar]
- Instituto Geológico; Minero y Metalúrgico (INGEMMET). Caracterización y Evaluación del Potencial Geotérmico de las Zonas Geotermales de Kovire, Ancocollo y Vilacota, Región Tacna [Characterization and Assessment of the Geothermal Potential of the Kovire, Ancocollo and Vilacota Geothermal Zones, Tacna Region]; Bulletin Series B: Economic Geology, No. 89; INGEMMET: Lima, Peru, 2024. [Google Scholar]
- Cruz Pauccara, V. Caracterización y Evaluación del Potencial Geotérmico de la Zona Geotermal de Tutupaca, Candarave, Región Tacna [Characterization and Assessment of the Geothermal Potential of the Tutupaca Geothermal Zone, Candarave, Tacna Region]; Bulletin Series B: Economic Geology, No. 93; INGEMMET: Lima, Peru, 2025; Available online: https://hdl.handle.net/20.500.12544/5122.
- United Nations Economic Commission for Europe (UNECE). United Nations Framework Classification for Resources—Update 2019; ECE Energy Series No. 61; United Nations: Geneva, Switzerland, 2019. [Google Scholar]
- Instituto Geológico; Minero y Metalúrgico (INGEMMET). Hidrotermalismo en el Sur del Perú [Hydrothermalism in Southern Peru]; Bulletin Series D: Regional Studies, No. 18; INGEMMET: Lima, Peru, 1997; Available online: https://hdl.handle.net/20.500.12544/335.
- EDC Energía Verde Perú S.A. Evaluación Preliminar del Proyecto “Geotérmico Achumani” [Preliminary Environmental Assessment of the Achumani Geothermal Project]; Environmental Classification Request, File E-CLS-00100-2020; Servicio Nacional de Certificación Ambiental para las Inversiones Sostenibles (SENACE): Lima, Peru, 2020. [Google Scholar]
- International Renewable Energy Agency (IRENA). Geothermal Power: Technology Brief; IRENA: Abu Dhabi, United Arab Emirates, 2023. [Google Scholar]
- National Renewable Energy Laboratory (NREL). 2020 Annual Technology Baseline (ATB); U.S. Department of Energy: Golden, CO, USA, 2020; Available online: https://atb.nrel.gov/.
- National Renewable Energy Laboratory (NREL). 2025 Annual Technology Baseline: Geothermal; U.S. Department of Energy: Golden, CO, USA, 2025; Available online: https://atb.nrel.gov/electricity/2025/geothermal.
- Sanyal, S.K. Cost of geothermal power and how sensitive it is to various parameters. Trans. Geotherm. Resour. Counc. 2005, 29, 697–704. [Google Scholar]
- Sanyal, S.K.; Morrow, J.W. Success and the cost of geothermal drilling: A comprehensive global review. In Proceedings of the 37th Workshop on Geothermal Reservoir Engineering, Stanford, CA, USA, 2012; SGP-TR-194, pp. 1297–1306. [Google Scholar]
- International Renewable Energy Agency (IRENA). Renewable Power Generation Costs in 2023; IRENA: Abu Dhabi, United Arab Emirates, 2024; ISBN 978-92-9260-621-3. [Google Scholar]
- Lazard. Lazard’s Levelized Cost of Energy+ (LCOE+): Version 17.0; Lazard Ltd.: New York, NY, USA, 2024; Available online: https://www.lazard.com/media/xemfey0k/lazards-lcoeplus-june-2024-_vf.pdf.
- Schlömer, S.; Bruckner, T.; Fulton, L.; Hertwich, E.; McKinnon, A.; Perczyk, D.; Roy, J.; Schaeffer, R.; Sims, R.; Smith, P.; et al. Annex III: Technology-specific cost and performance parameters. In Climate Change 2014: Mitigation of Climate Change. Contribution of Working Group III to the Fifth Assessment Report of the Intergovernmental Panel on Climate Change; Edenhofer, O., et al., Eds.; Cambridge University Press: Cambridge, UK, 2014; pp. 1329–1356. [Google Scholar]
- Southern Copper Corporation. Annual Report on Form 10-K for the Fiscal Year Ended December 31, 2023; U.S. Securities and Exchange Commission: Washington, DC, USA, 2024; Available online: https://www.sec.gov/Archives/edgar/data/1001838/000155837024002119/scco-20231231x10k.htm.
- International Finance Corporation (IFC). Success of Geothermal Wells: A Global Study; Report No. 78230; World Bank Group: Washington, DC, USA, 2013; Available online: https://documents.banquemondiale.org/fr/publication/documents-reports/documentdetail/305681468168834775.
- Gehringer, M.; Loksha, V. Geothermal Handbook: Planning and Financing Power Generation; ESMAP Technical Report 002/12; World Bank: Washington, DC, USA, 2012. [Google Scholar]
- Saaty, T.L. The Analytic Hierarchy Process; McGraw-Hill: New York, NY, USA, 1980. [Google Scholar]
- Hwang, C.L.; Yoon, K. Multiple Attribute Decision Making: Methods and Applications; Springer: Berlin/Heidelberg, Germany, 1981. [Google Scholar]
- Richter, A. EDC Submits Early Environmental Evaluation for Achumani Geothermal Project in Peru. ThinkGeoEnergy. 20 July 2020. Available online: https://www.thinkgeoenergy.com/edc-submits-early-environmental-evaluation-for-achumani-geothermal-project-in-peru/.
- Dirección General de Electricidad (DGE). Resolución Directoral N.° 0106-2025-MINEM/DGE: Caducidad de la Autorización para la Exploración de Recursos Geotérmicos en la Zona Denominada Achumani [Directorial Resolution No. 0106-2025-MINEM/DGE: Expiry of the Geothermal Exploration Authorization for the Achumani Zone]; Ministerio de Energía y Minas: Lima, Peru, 2025; Available online: https://cdn.www.gob.pe/uploads/document/file/8203498/6857930-rd-0106-2025-minem-dge.pdf.
- van der Zwaan, B.C.C.; Dalla Longa, F. Integrated assessment projections for global geothermal energy use. Geothermics 2019, 82, 203–211. [Google Scholar] [CrossRef]
- Park, S.; Langat, A.; Lee, K.; Yoon, Y. Measuring the impact of risk on LCOE (levelized cost of energy) in geothermal technology. Geotherm. Energy 2021, 9, 27. [Google Scholar] [CrossRef]
- Kizielewicz, B.; Sałabun, W. Multi-criteria decision analysis methods for energy sector’s sustainability assessment: Robustness analysis through criteria weight change. Sustain. Energy Technol. Assess. 2021, 47, 101380. [Google Scholar] [CrossRef]
- Melaku, M.; Finlayson, W.L.; Biddle, G. Geothermal heat recovery at Lihir Gold Mine. In Proceedings of the World Geothermal Congress 1995, Florence, Italy, 1995; Volume 3, pp. 2225–2228. [Google Scholar]
- Trexler, D.T.; Flynn, T.; Hendrix, J.L. Heap leaching. Geo-Heat Center Bull. 1990, Summer issue. Oregon Institute of Technology: Klamath Falls, OR, USA, 1990. [Google Scholar]
- Keeney, R.L.; Gregory, R.S. Selecting attributes to measure the achievement of objectives. Oper. Res. 2005, 53, 1–11. [Google Scholar] [CrossRef]
- Wang, J.-J.; Jing, Y.-Y.; Zhang, C.-F.; Zhao, J.-H. Review on multi-criteria decision analysis aid in sustainable energy decision-making. Renew. Sustain. Energy Rev. 2009, 13, 2263–2278. [Google Scholar] [CrossRef]
- Kruyt, B.; van Vuuren, D.P.; de Vries, H.J.M.; Groenenberg, H. Indicators for energy security. Energy Policy 2009, 37, 2166–2181. [Google Scholar] [CrossRef]
- Wüstenhagen, R.; Wolsink, M.; Bürer, M.J. Social acceptance of renewable energy innovation: An introduction to the concept. Energy Policy 2007, 35, 2683–2691. [Google Scholar] [CrossRef]
- del Pueblo, Defensoría. 2024. Reporte de Conflictos Sociales N.° 242 (Abril de 2024) [Social Conflicts Report No. 242 (April 2024)]. Defensoría del Pueblo: Lima, Peru.
Figure 1.
Geothermal energy potential (heat in place) of South America at depths of a) 2,000 m, b) 4,000 m and c) 7,000 m, expressed in PJ/km² above a reference temperature of 150 °C. Adapted from Project InnerSpace [25].
Figure 1.
Geothermal energy potential (heat in place) of South America at depths of a) 2,000 m, b) 4,000 m and c) 7,000 m, expressed in PJ/km² above a reference temperature of 150 °C. Adapted from Project InnerSpace [25].
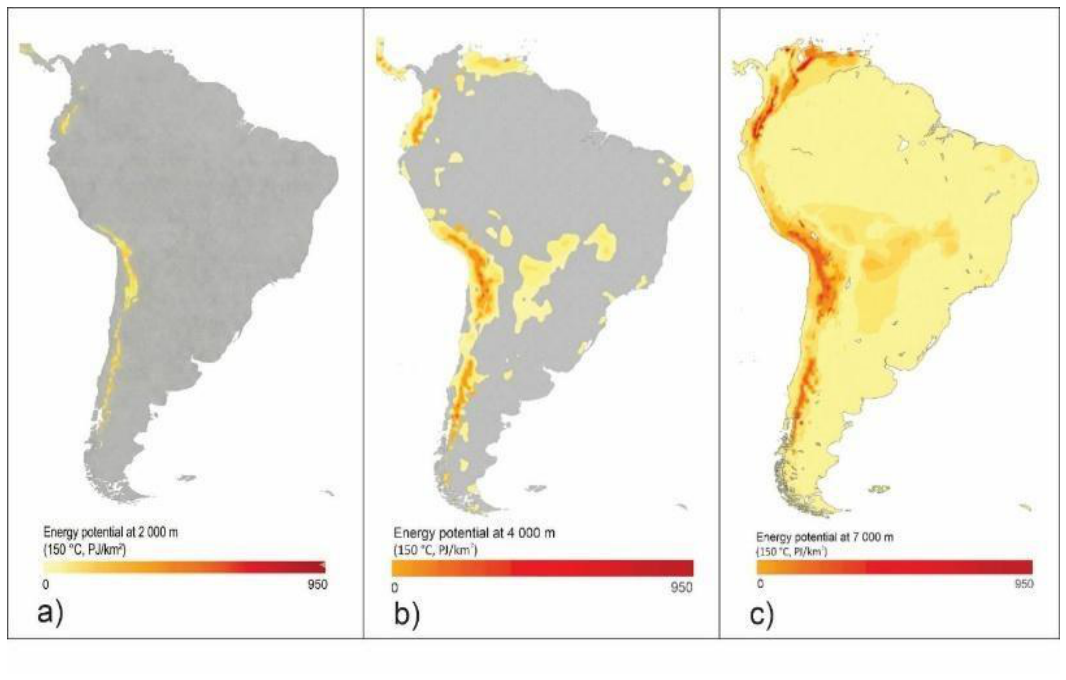
Figure 2.
Study area: a) national geothermal zoning and delineation of Region V (Southern Volcanic Axis); b) geothermal zones with estimated potential (MWe) and main large-scale copper mining operations in Peru, including those of the Arequipa–Moquegua–Tacna corridor. Prepared from INGEMMET [18] and the coordinates in Appendix A.
Figure 2.
Study area: a) national geothermal zoning and delineation of Region V (Southern Volcanic Axis); b) geothermal zones with estimated potential (MWe) and main large-scale copper mining operations in Peru, including those of the Arequipa–Moquegua–Tacna corridor. Prepared from INGEMMET [18] and the coordinates in Appendix A.
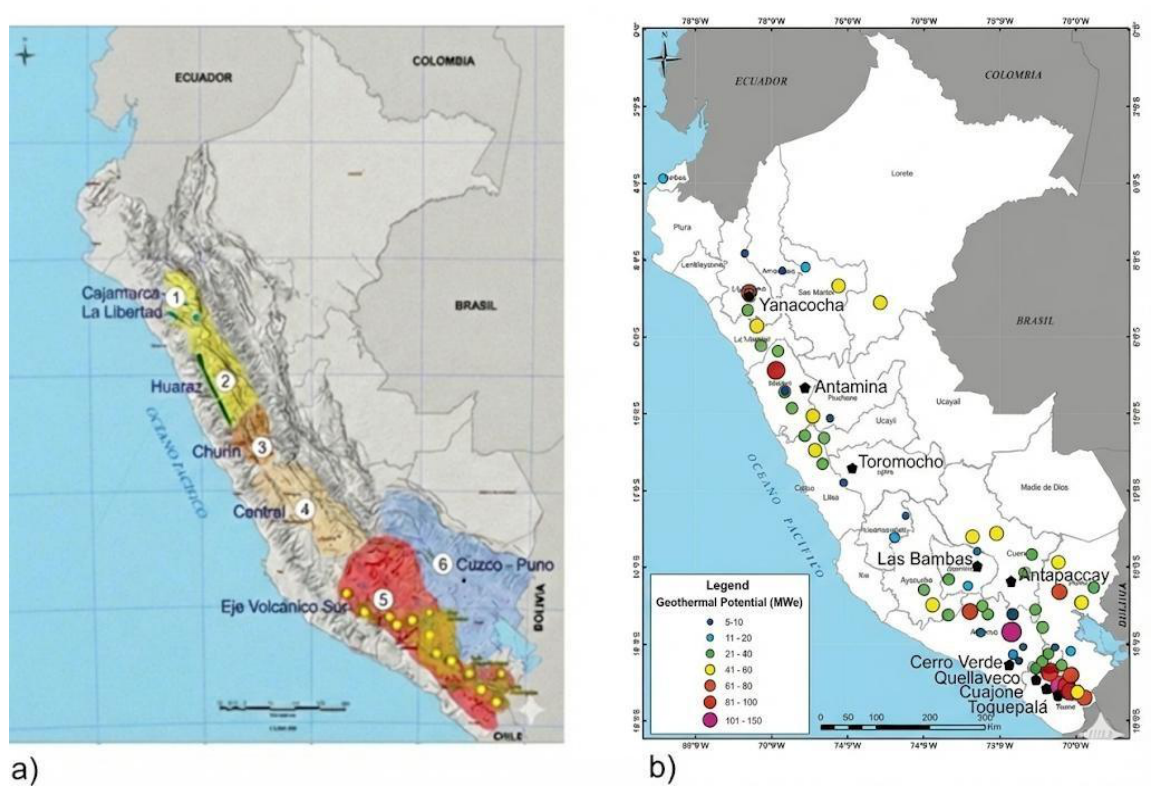
Figure 3.
Methodological workflow and correspondence with the specific objectives (SO1–SO4). Source: own elaboration.
Figure 3.
Methodological workflow and correspondence with the specific objectives (SO1–SO4). Source: own elaboration.
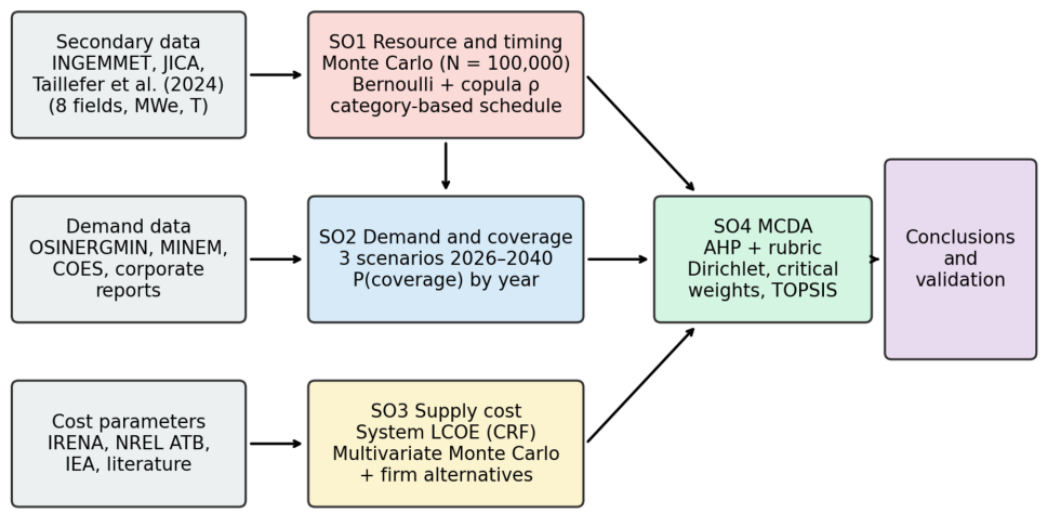
Figure 4.
Exceedance curves of the deployable geothermal capacity of the eight EVS fields under three exploration-risk schemes (N = 100,000). The vertical lines indicate the incremental mining demand of the high scenario in 2031 (380 MW) and of the base scenario in 2040 (497 MW). Source: own elaboration.
Figure 4.
Exceedance curves of the deployable geothermal capacity of the eight EVS fields under three exploration-risk schemes (N = 100,000). The vertical lines indicate the incremental mining demand of the high scenario in 2031 (380 MW) and of the base scenario in 2040 (497 MW). Source: own elaboration.
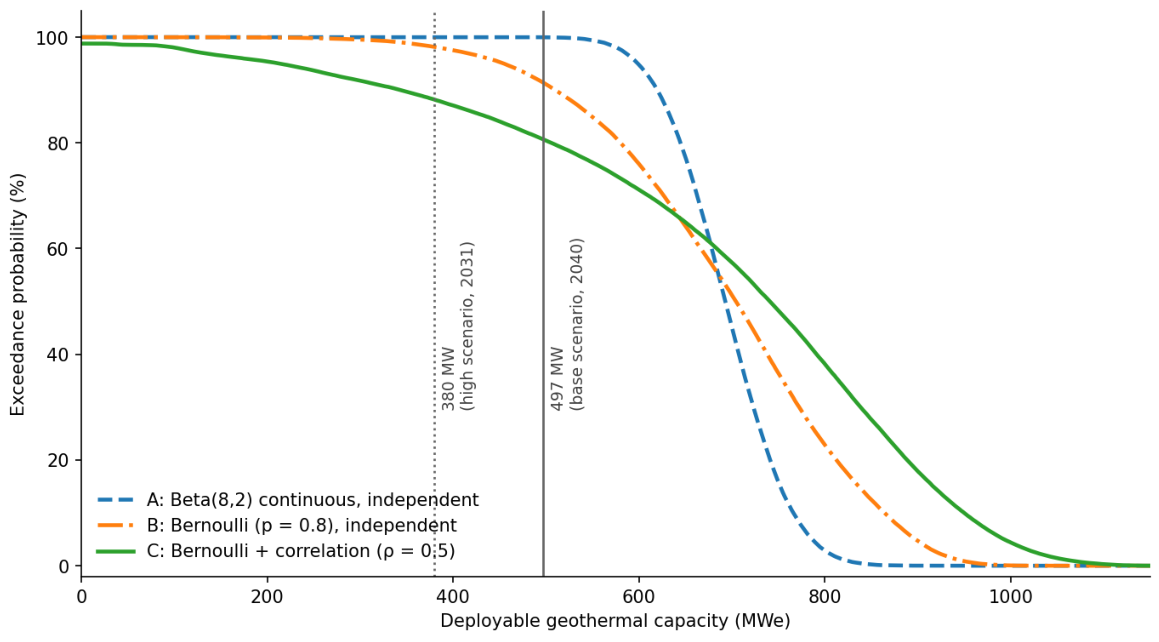
Figure 5.
Cumulative installable geothermal capacity (median and P90–P10 band, scheme C with ρ = 0.5) versus incremental mining demand in the high, base and low scenarios, 2026–2040. Source: own elaboration.
Figure 5.
Cumulative installable geothermal capacity (median and P90–P10 band, scheme C with ρ = 0.5) versus incremental mining demand in the high, base and low scenarios, 2026–2040. Source: own elaboration.
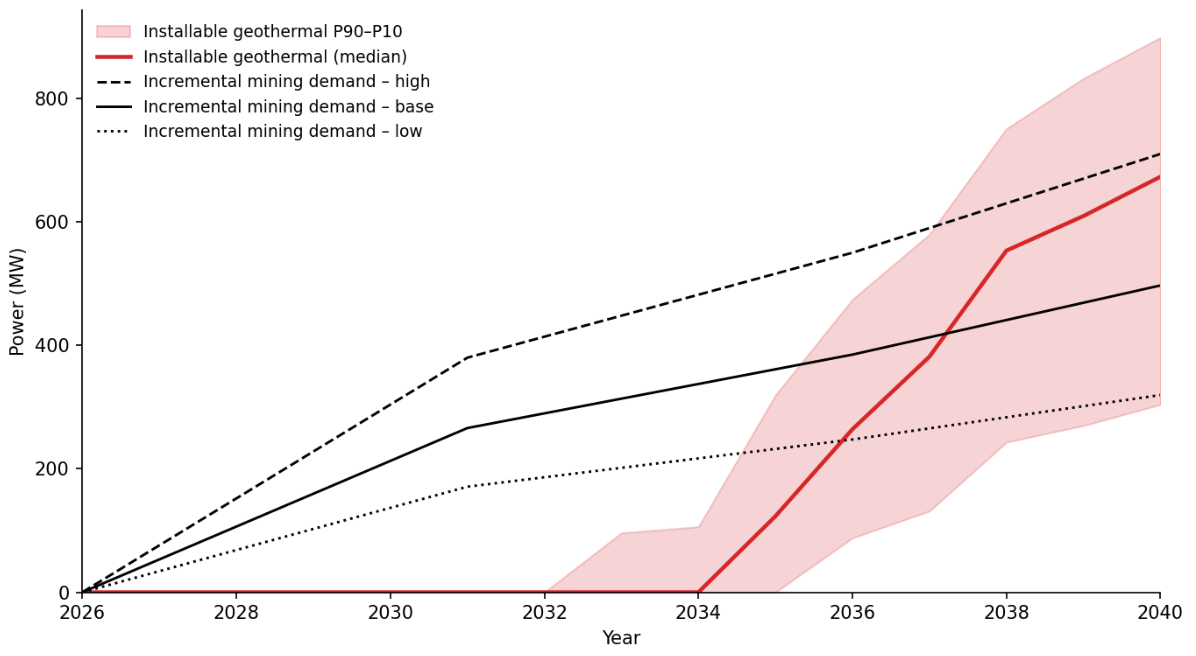
Figure 6.
Tornado analysis of the geothermal system LCOE: variation of each parameter between its minimum and maximum (Table 3), with the others at their mode. Central case: 100.1 USD/MWh. Source: own elaboration.
Figure 6.
Tornado analysis of the geothermal system LCOE: variation of each parameter between its minimum and maximum (Table 3), with the others at their mode. Central case: 100.1 USD/MWh. Source: own elaboration.
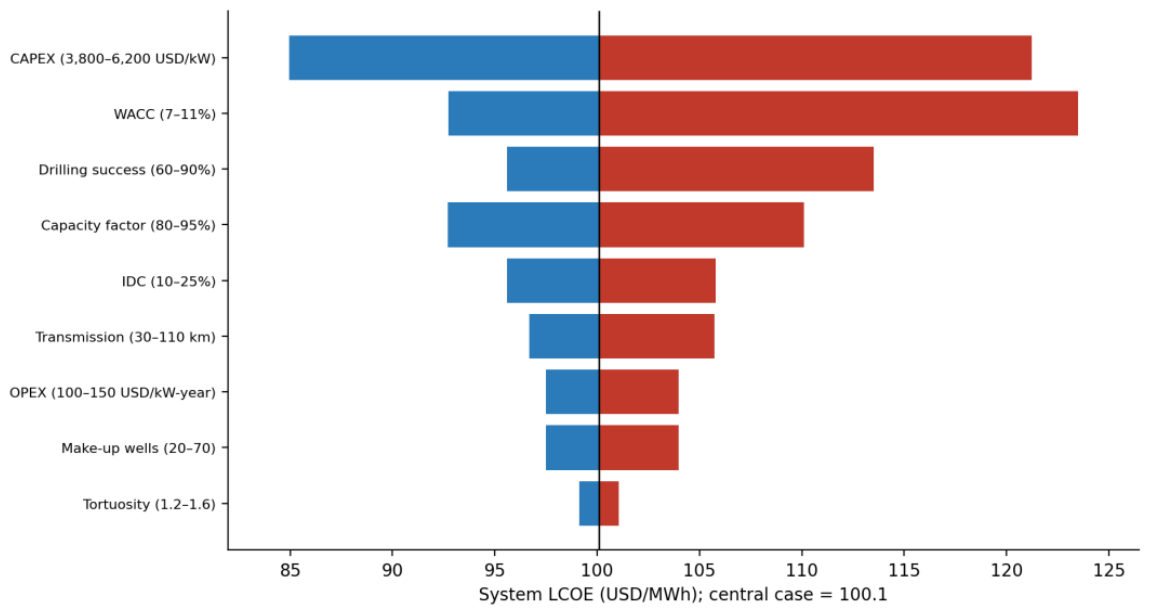
Figure 7.
Distribution of the levelized cost of firm electricity by alternative (box: P25–P75; whiskers: P5–P95). Geothermal energy includes system components delivered to the mine; the alternatives marked with * were modelled with parametric triangular distributions without equivalent system components (Section 4.3): natural gas CC [38], solar-wind + 24 h BESS [37,38], SEIN contract [3] and diesel backup (component-based estimate). Source: own elaboration.
Figure 7.
Distribution of the levelized cost of firm electricity by alternative (box: P25–P75; whiskers: P5–P95). Geothermal energy includes system components delivered to the mine; the alternatives marked with * were modelled with parametric triangular distributions without equivalent system components (Section 4.3): natural gas CC [38], solar-wind + 24 h BESS [37,38], SEIN contract [3] and diesel backup (component-based estimate). Source: own elaboration.
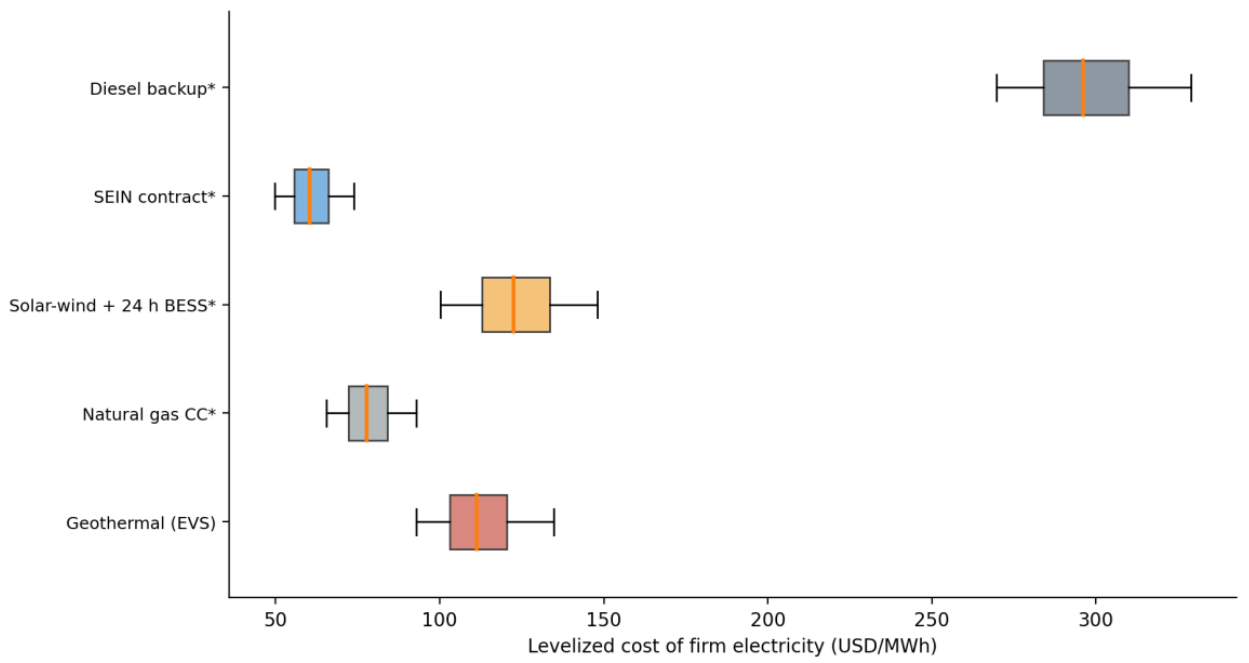
Table 1.
Input data, sources and use by objective.
| Dataset | Source | Date | Use |
| Potential, reservoir temperature and category by field | JICA [15]; INGEMMET [18,27,30]; EDC Energía Verde Perú [31]; Cruz and Guardia [26]; Cruz Pauccara [28]; Alvarez Robles et al. [17] | 1997–2025 | SO1 |
| Geothermometry (SiO₂, Na-K-Ca) | INGEMMET [18,30]; Taillefer et al. [16] | 1997–2024 | SO1 |
| Current demand of the corridor | OSINERGMIN [3] | 2024 | Context |
| Portfolio of new projects and loads | MINEM [4]; COES [5] | 2024–2025 | SO2 |
| CAPEX, OPEX, capacity factor, drilling success and make-up wells | IRENA [9,32]; NREL [33,34]; Sanyal [35]; Sanyal and Morrow [36] | 2005–2025 | SO3 |
| Cost of 220 kV transmission | COES [5]; OSINERGMIN [3] | 2024 | SO3 |
| Costs of firm alternatives | IRENA [37]; Lazard [38]; OSINERGMIN [3] | 2024 | SO3, SO4 |
| Hydropower share and marginal cost during drought | COES [5] | 2024 | SO3, SO4 |
| Life-cycle emission intensities | Schlömer et al. [39]; COES [5] | 2014–2024 | SO4 |
| Coordinates of fields and mining operations | INGEMMET [18]; Southern Copper Corporation [40] | 2021–2024 | SO3 |
Note: CAPEX, capital expenditure; OPEX, operation and maintenance costs; NREL, National Renewable Energy Laboratory.
Table 2.
Inventory of EVS geothermal fields and development category.
| Field | Potential (MWe) | Reservoir T (°C) | Cycle | Category | Criterion / reference |
| Calientes | 100.0 | 240 | Flash | A | MT anomaly <10 Ω·m and geothermometry >200 °C; potential: JICA [15]; temperature and MT: INGEMMET [18] |
| Achumani–Chivay | 162.9 | 250–300 | Flash | B | Pre-feasibility; potential: JICA [15]; temperature: EDC Energía Verde Perú [31] |
| Casiri–Kallapuma | 135 | >150 | Binary | B | Pre-feasibility; Cruz & Guardia [26] |
| Tutupaca | 113.8 | >200 | Flash | B | Pre-feasibility with MT; potential: JICA [15]; temperature and 59–181 MWe range: Cruz Pauccara [28] |
| Calacoa–Putina | 108.2 | 150–180 | Binary | B | Pre-feasibility; potential: JICA [15]; temperature: INGEMMET [30] |
| Paucarani–Kovire | 132.0 | 180–210 | Flash | C | Inferred; Paucarani, 72 MWe [26]; Kovire, 60 MWe [27]; Alvarez Robles et al. [17] |
| Ancocollo | 120.0 | 180–230 | Flash | C | Inferred; INGEMMET [27] |
| Ccollo–Titire | 39.7 | 130–160 | Binary | C | Inferred; JICA [15] |
| Total | 911.6 |
Note: Potentials at 80% confidence according to the Master Plan [15] (Table III-1.1.1), except Casiri–Kallapuma and Paucarani [26] and Kovire and Ancocollo [27]. Temperature of Achumani–Chivay according to the project's preliminary environmental assessment [31]. Categories: A = published magnetotelluric (MT) anomaly and geothermometry above 200 °C (ready for confirmation drilling); B = pre-feasibility study or completed surface exploration; C = resource with limited direct evidence. The Yura and La Calera (Chivay) thermal areas are excluded; see text.
Table 3.
Parameters of the geothermal LCOE simulation (triangular distributions: minimum – mode – maximum).
Table 3.
Parameters of the geothermal LCOE simulation (triangular distributions: minimum – mode – maximum).
| Parameter | Values | Source / justification |
| Plant CAPEX (USD/kW) | 3.800 – 4.800 – 6.200 | IRENA [32]: 4,589 USD/kW + altitude premium (assumption) |
| Euclidean distance (km) | 30 – 60 – 110 | Spatial analysis |
| Tortuosity factor | 1.2 – 1.4 – 1.6 | Routing assumption in Andean terrain |
| Drilling success pₛ | 0.60 – 0.80 – 0.90 | NREL [34]; Sanyal & Morrow [36] |
| WACC r | 7% – 8% – 11% | OSINERGMIN [3]; IEA [10] for emerging markets |
| Capacity factor CF | 0.80 – 0.88 – 0.95 | IRENA [9]: global average ≈88% |
| IDC | 10% – 16.6% – 25% | 3–6-year construction at the WACC |
| Make-up wells (USD/kW-year) | 20 – 40 – 70 | NREL [34]; Sanyal [35]: reservoir decline of 2–4% per year |
| OPEX (USD/kW-year) | 100 – 120 – 150 | IRENA [32] |
Table 4.
Pairwise comparison matrix and AHP weights.
| Criterion | SS | EV | IL | EP | SL | Weight |
| Supply Security (SS) | 1 | 2 | 3 | 3 | 4 | 0.403 |
| Economic Viability (EV) | 1/2 | 1 | 2 | 2 | 3 | 0.244 |
| Infrastructure and Logistics (IL) | 1/3 | 1/2 | 1 | 1 | 2 | 0.137 |
| Environmental Performance (EP) | 1/3 | 1/2 | 1 | 1 | 2 | 0.137 |
| Social License (SL) | 1/4 | 1/3 | 1/2 | 1/2 | 1 | 0.079 |
Table 5.
Deployable geothermal capacity by risk scheme (MWe). P90 is the value exceeded with 90% probability. The mean is ≈691 MWe in all schemes.
Table 5.
Deployable geothermal capacity by risk scheme (MWe). P90 is the value exceeded with 90% probability. The mean is ≈691 MWe in all schemes.
| Scheme | P90 | P50 | P10 | P (>380 MW) | P (>497 MW) |
| A. Beta (8,2) continuous, independent | 619 | 693 | 766 | 100.0% | 100.0% |
| B. Bernoulli, independent | 510 | 704 | 864 | 98.2% | 91.4% |
| C. Bernoulli + copula, ρ = 0.2 | 446 | 716 | 902 | 94.0% | 85.5% |
| C. Bernoulli + copula, ρ = 0.5 (base) | 343 | 741 | 950 | 88.2% | 80.7% |
| C. Bernoulli + copula, ρ = 0.7 | 248 | 760 | 979 | 84.9% | 79.1% |
Table 6.
Installable geothermal capacity and coverage of incremental mining demand (base scenario).
| Year | P50 capacity (MW) | P90–P10 range (MW) | Base demand (MW) | P (covers ≥50%) | P (covers 100%) |
| 2031 | 0 | 0–0 | 266 | 0.0% | 0.0% |
| 2033 | 0 | 0–96 | 314 | 0.0% | 0.0% |
| 2035 | 123 | 0–319 | 361 | 39.3% | 6.3% |
| 2036 | 264 | 88–474 | 385 | 70.2% | 22.8% |
| 2037 | 382 | 131–580 | 413 | 83.3% | 42.6% |
| 2038 | 553 | 243–751 | 441 | 91.4% | 71.5% |
| 2040 | 673 | 304–899 | 497 | 92.6% | 75.9% |
Table 7.
Sensitivity of installable capacity and base-demand coverage to the development schedule (scheme C, ρ = 0.5).
Table 7.
Sensitivity of installable capacity and base-demand coverage to the development schedule (scheme C, ρ = 0.5).
| Schedule scenario | P50 capacity 2038 (MW) | P (covers 100%) 2038 | P50 capacity 2040 (MW) | P (covers ≥50%) 2040 | P (covers 100%) 2040 |
| Base case (0–3-year delay) | 553 | 71.5% | 673 | 92.6% | 75.9% |
| 0–6-year delay | 320 | 24.3% | 525 | 88.0% | 55.5% |
| COD +2 years | 264 | 13.7% | 553 | 89.6% | 62.1% |
| Phased development | 352 | 22.7% | 532 | 89.3% | 57.8% |
| COD +2 years and 0–6-year delay | 128 | 2.1% | 320 | 64.8% | 15.9% |
Note: COD, commercial operation date. All variants were simulated with the same random numbers as the base case. Phased development: 50% of each field's capacity at its COD and 50% three years later.
Disclaimer/Publisher’s Note: The statements, opinions and data contained in all publications are solely those of the individual author(s) and contributor(s) and not of MDPI and/or the editor(s). MDPI and/or the editor(s) disclaim responsibility for any injury to people or property resulting from any ideas, methods, instructions or products referred to in the content. |
© 2026 by the authors. Licensee MDPI, Basel, Switzerland. This article is an open access article distributed under the terms and conditions of the Creative Commons Attribution (CC BY) license.
Copyright: This open access article is published under a Creative Commons CC BY 4.0 license, which permit the free download, distribution, and reuse, provided that the author and preprint are cited in any reuse.