

Submitted:
22 October 2026
Posted:
23 October 2026
You are already at the latest version
Abstract
Background and Objectives: Although the diagnosis of chronic spontaneous urticaria (CSU) is primarily clinical, detailed history taking and selected laboratory findings are important for patient evaluation and management. Materials and Methods: This explorative prospective study included 41 CSU patients who were followed for 3 months during antihistamine treatment. Saliva and blood samples were collected, and disease-related questionnaires were completed at baseline (T1) and at follow-up (T2). Salivary IL-6 and amylase, serum IL-6, and standard laboratory parameters, including differential blood count, erythrocyte sedimentation rate and/or C-reactive protein (CRP), total IgE, TSH, T4, and anti-TPO antibodies, were measured and compared with disease activity (UAS7), disease control (UCT), and quality of life (DLQI and CU-Q2oL). Results: Salivary IL-6 showed a weak correlation with serum CRP. Neither salivary nor serum IL-6 showed a consistent association with CSU severity, disease control, or quality-of-life scores. Serum IL-6 showed significant correlations with selected inflammatory and thyroid-related parameters. Salivary IL-6 values at baseline (T1) were more frequently increased in patients experiencing a major disease impact on quality of life (CU-Q2oL-measured) than in those with a moderate impact on CU-specific quality of life. Also, higher salivary IL-6 values were expressed in patients with uncontrolled CSU than in well-controlled CSU, as measured by the UCT questionnaire, although without significant difference between these parameters. Conclusions: Salivary IL-6 showed a weak correlation with CRP, but no consistent association with CSU clinical features. Salivary IL-6 is of exploratory interest, but larger controlled studies are needed before any clinical utility can be inferred.
Keywords:
chronic urticaria
; diagnostics
; saliva
; IL-6
; biomarkers
1. Introduction
Although the diagnosis of chronic urticaria (CU) is primarily clinical, detailed history taking and selected laboratory findings are important for patient evaluation and management. According to the latest guidelines for the diagnosis/treatment of the most frequent CU form (chronic spontaneous urticaria/CSU, of unknown etiology), a few diagnostic procedures should be routinely conducted: complete blood count (CBC), erythrocyte sedimentation rate (ESR) and/or C-reactive protein (CRP), IgG antibodies to thyroid peroxidase (IgG anti-TPO) and total IgE. An extended workup may include other tests such as the Helicobacter pylori antigen test, thyroid hormone findings, the antinuclear antibody test (ANA), basophil activation test (BAT), etc. [1,2]. IL-6 has been investigated as a potential biomarker of systemic inflammation and disease activity in CSU, but its clinical utility remains uncertain [3,4]. According to literature data, IL-6 concentration correlates with CSU activity (UAS7) and patient quality of life, and thus has a promising diagnostic role.
Given that saliva sampling is non-invasive and easy to repeat, further research is needed to explore whether salivary biomarkers may provide clinically relevant information in CSU. To date, data on salivary biomarkers in CSU are limited, and studies specifically evaluating salivary IL-6 in CSU are lacking, even though serum biomarkers have been widely studied. In previously published articles, which explored using saliva samples as a non-invasive diagnostic alternative to blood tests, salivary and serum IL-6 values have only been compared in some inflammatory and oncological conditions [5,6,7,8]. One study on healthy subjects showed a significant moderate correlation between IL-6 in saliva and serum, which indicated that saliva can also be used to estimate IL-6 [9,10]. So far, the strongest correlations have been recorded in oral conditions/cancers and oral lichen planus/OLP, in which significantly higher salivary and serum IL-6 levels were recorded than in healthy persons, with correlations to OLP severity; and periodontitis/periodontal conditions—in chronic periodontitis salivary IL-6 levels positively correlated with disease severity—and infectious diseases [11]. Salivary IL-6 mostly exhibits high sensitivity in distinguishing between healthy persons and those with oral pre-malignant lesions/cancers in which both serum and salivary IL-6 are usually elevated. (Some studies indicate that salivary IL-6 concentrations can be 2 to 3 times higher than serum values in certain oral diseases). Thus, for many conditions, saliva sampling is another potential method, in addition to routine serum and whole blood tests, by which a diagnosis can be determined [12].
In a previous article, we presented our research results from a study that prospectively monitored CSU patients' various clinical and serum factors/molecules. Here, we wanted to additionally examine the relationship between concentrations of IL-6 in saliva and serum, in comparison with salivary amylase and clinical indicators of CSU [13]. Thus, the aims of this study were to examine the relationship between salivary and serum IL-6 concentrations and CSU severity, to assess the association of IL-6 with standard laboratory CSU biomarkers, and to evaluate changes in clinical scores and biomarker levels after 3 months of treatment.
2. Material and Methods
Adult patients (≥18 years) with CSU lasting at least 6 weeks were included in this explorative prospective study. Patients with urticarial vasculitis, isolated inducible urticaria or angioedema, systemic diseases, or recent use of immunosuppressants, psychoactive therapy, biologics, or systemic corticosteroids, were excluded. The examinees were collected from November 2021 to March 2023 at the Department of Dermatovenereology, Sestre Milosrdnice University Hospital Center, Zagreb, and each participant signed an informed consent form. The Ethics Committee of Sestre Milosrdnice University Hospital Center, Zagreb, granted approval for the conduct of the study at the 116th regular meeting, held on 11 November 2021 (class: 003-06/21-03/036, protocol/document number: 251-29-11-21-01-9).
This study involved 41 CSU patients, including 32 females (78%) and 9 males (22%), aged 23 to 79 years, that were prospectively monitored for 3 months. During the study, the patients were administered antihistamine therapy twice daily (bilastine 20 mg, and in case of exacerbation up to 4 tablets daily). We also recorded CSU clinical features/indicators: CSU activity (the Urticaria Activity Score, UAS7), CSU control as measured by the Urticaria Control Test (UCT), and patient quality of life as measured by the Dermatology Life Quality Index (DLQI) and Chronic Urticaria Quality of Life Questionnaire (CU-Q2oL) [14,15,16,17,18,19,20].
At both the initial timepoint (T1) and the control follow-up timepoint (T2), patients filled out the questionnaires and samples of their blood and saliva were collected. Values for all analytes and tests in our study (salivary IL-6 and amylase, serum IL-6, CBC, ESR, CRP, anti-TPO IgG, total IgE, TSH and T4) were measured in CSU patients.
2.1. Oral Mucosal Examination
Because inflammatory changes in the oral cavity may affect salivary inflammatory biomarkers, each patient underwent an oral mucosal and periodontal examination performed by an oral medicine specialist. Patients with oral mucosal lesions or periodontitis were excluded. Periodontitis was ruled out by a rapid periodontal test (Periodontal Screening and Imaging – PSR index).
2.2. Saliva Sampling Procedure
Saliva samples were collected following manufacturer' instructions for the IL-6 assay reagent (Salimetrics®, PA, USA). Each participant received instructions during their examination for providing a saliva sample at the next dermatologist visit. The saliva sampling instructions included the following suggestions to patients: rinse mouth thoroughly with water for 10 minutes before sampling (to remove food residues and avoid sample dilution); perform saliva collection in a vertical position; collect saliva using the unstimulated passive drooling method (participants use no materials to stimulate saliva secretion to maintain sample consistency); accumulate saliva in the oral cavity for 60 seconds, then gently tilt the head, allowing the saliva to pool, expectorate into a 15-ml graduated polypropylene centrifuge tube with cap (Falcon®, Corning, NY, USA) and close securely.
At the subsequent dermatologist visit, in the morning hours between 7:30 and 8:00, a saliva sample was collected from each patient in two 15-ml graduated polypropylene centrifuge tubes with caps (Falcon®, Corning, NY, USA) at a 5-minute interval (intraindividual variability). The procedure was repeated every 5 minutes until approximately 2–2.5 mL of saliva was collected—the expected sample level is marked on the capped tube with a waterproof black marker—requiring two tubes per sample. After collection, the time, the date, and the patient code were recorded on both tubes.
2.3. Determination of Salivary IL-6 and Amylase
Saliva samples were stored at −80 °C immediately after collection until analysis. Subsequently, salivary biomarkers (IL-6 and amylase) were analyzed for each CSU patient from all the samples collected at the first sampling (T1) and second sampling (T2) at the Department of Clinical Chemistry, Sestre Milosrdnice University Hospital Center, Zagreb.
Salivary IL-6 was measured using the Salimetrics Salivary IL-6 ELISA Kit (Salimetrics®, PA, USA), according to the manufacturer’s instructions. Salivary α-amylase was measured using the Salimetrics Salivary Alpha-Amylase Kinetic Enzyme Assay Kit (Salimetrics®, PA, USA), also according to the manufacturer’s instructions. Both assays were performed on a VirClia® analyzer (Vircell Microbiologists, Granada, Spain). According to the manufacturer, the assay range for salivary IL-6 is 1.56–100 pg/mL, whereas the assay range for salivary α-amylase is 2–400 U/mL. Because assay format, dilution protocol, and reported units may differ across studies, no external reference interval for salivary α-amylase was applied in this study. Salivary α-amylase was used as an additional salivary parameter and for exploratory calculation of the IL-6/α-amylase ratio.
The manufacturer-provided salivary IL-6 range was used only as an exploratory reference and not as a validated diagnostic cutoff.
For the determination of salivary amylase activity, saliva samples were left for up to 30 minutes at room temperature until fully dissolved. Samples were centrifuged at 3,500 rpm for 20 minutes in a Rotixa 50 RS centrifuge (Hettich, Germany). Salivary amylase was measured using the resulting supernatant. Saliva samples were visually inspected for blood contamination; no visibly blood-contaminated samples were identified, and therefore no samples were excluded on this basis.
Interindividual variability was quantified as the standard deviation (SD) of salivary IL-6 across all participants at the initial T1 timepoint. Intraindividual variability was assessed using the intraclass correlation coefficient and t-test, with two saliva samples collected from participants during T1 (time of first sampling) for IL-6 determination.
2.4. Blood Sampling Procedure and Determination of Blood Parameters
Peripheral blood samples were collected after an overnight fast by antecubital venipuncture between 7:30 and 8:00 a.m. Blood for serum analyses (serum IL-6, CRP, total IgE, TSH, T4, anti-TPO IgG, and ANA) was collected into serum separator tubes. Blood for CBC was collected into EDTA tubes, and blood for ESR measurement was collected into sodium citrate tubes. Serum samples were allowed to clot and were then centrifuged before biochemical and immunochemical analyses. Accordingly, CBC and ESR were determined from whole-blood samples, whereas CRP, total IgE, TSH, T4, anti-TPO IgG, ANA, and serum IL-6 were analyzed in serum. All laboratory analyses were performed at the Department of Clinical Chemistry, Sestre Milosrdnice University Hospital Center, Zagreb, Croatia.
Serum IL-6 concentration was measured using an electrochemiluminescence immunoassay (ECLIA) on a Cobas e601 analyzer (Roche Diagnostics, Basel, Switzerland) with the Elecsys® IL-6 reagent kit, according to the manufacturer’s recommendations. CBC was determined using the DxH 900 automated hematology analyzer (Beckman Coulter Inc., Brea, CA, USA). ESR was measured using the modified Westergren method. CRP was measured by immunoturbidimetry on an Abbott Architect 8000c analyzer (Abbott Laboratories, Abbott Park, IL, USA), total IgE by fluorescence enzyme immunoassay (FEIA) on a Phadia 200 analyzer (Phadia AB, Thermo Fisher Scientific, Waltham, MA, USA), and TSH, T4, and anti-TPO by chemiluminescent microparticle immunoassay (CMIA) on an Abbott Architect i2000 analyzer (Abbott Laboratories, Abbott Park, IL, USA).
2.5. Statistical Methods
The Kolmogorov–Smirnov and Shapiro–Wilk tests determined data distribution normality. Spearman’s correlation was used to analyze the association between variables, with Cohen’s criteria applied for interpretation: r=0,25–0,3=weak correlation; 0,3–0,5=moderate; 0,5–0,7=strong; and >0,7=very strong. Comparison of serum and salivary biomarkers between disease categories was performed using the Kruskal–Wallis and Mann–Whitney tests, with effect size quantified for the Mann–Whitney test by the formula and by . The Fisher and χ² tests were used to compare frequencies, and Cramér’s V and τb quantified effect size. Cohen’s criteria interpreted magnitude of effect. Salivary IL-6 interindividual variability was calculated by taking the standard deviations of each subject at the first measurement.
To determine intraindividual variability duplicate samples were taken from each subject within the same period, and the mean difference was calculated, expressed as the standard deviation and 95% CI. Intraindividual variability was also calculated using the intraclass correlation coefficient as well as the Wilcoxon test. A comparison of baseline findings (T1) and follow-up findings (T2) was performed with the Wilcoxon test, where effect size was quantified in the same way as the Mann–Whitney test. The IBM SPSS v.22.0 commercial software (IBM Corp., Armonk, USA) was used for all analyses; the statistical significance was set at .
3. Results
The initial sample at baseline measurement T1 (time of first measurement) comprised 41 CSU patients (Table 1). During this prospective follow-up of CSU patients, 32% of participants dropped out after 3 months, leaving a total of 28 CSU patients at T2 (time of second measurement). Thus, in some subjects, not all parameters were recorded, mainly because some patients could not attend the scheduled examination within 3 months, or due to some technical reasons during sample processing.
3.1. Salivary and Serum IL-6 Values in Correlation with Clinical Factors
At the T1 timepoint, no significant linear association was recorded between salivary and serum IL-6, nor between serum IL-6 and the salivary IL-6 to amylase ratio, or between these IL-6 measures and disease duration (Figure 1 and Figure 2, Table 2). However, the majority of CSU patients with normal serum IL-6 values had elevated salivary IL-6 (92%).
Figure 3 and Figure 4 present the comparisons of salivary IL-6 concentration (expressed in pg/mL) at initial (T1) and control (T2) timepoint measurements in CSU patients, as well as the comparison of salivary IL-6 to salivary amylase concentration ratio at the T1 and (T2) measurements in CSU patients (N=28; p=0.412).
Figure 3.
Comparison of salivary IL-6 concentration (expressed in pg/mL) at initial/T1 and control/T2 timepoint measurements in CSU patients (N=28; p=0.682).
Figure 3.
Comparison of salivary IL-6 concentration (expressed in pg/mL) at initial/T1 and control/T2 timepoint measurements in CSU patients (N=28; p=0.682).
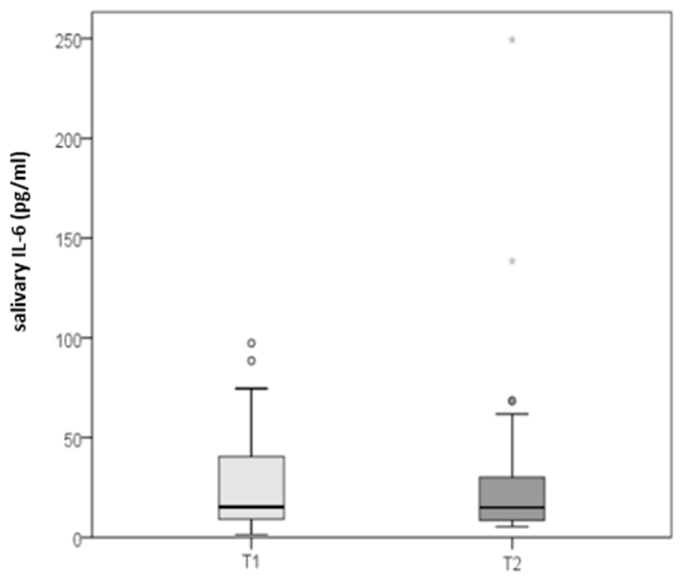
N–number of CSU patients; p–level of statistical significance
Figure 4.
Comparison of salivary IL-6 to salivary amylase concentration ratio at initial/T1 and control/T2 timepoint measurements in CSU patients (N=28; p=0.412).
Figure 4.
Comparison of salivary IL-6 to salivary amylase concentration ratio at initial/T1 and control/T2 timepoint measurements in CSU patients (N=28; p=0.412).
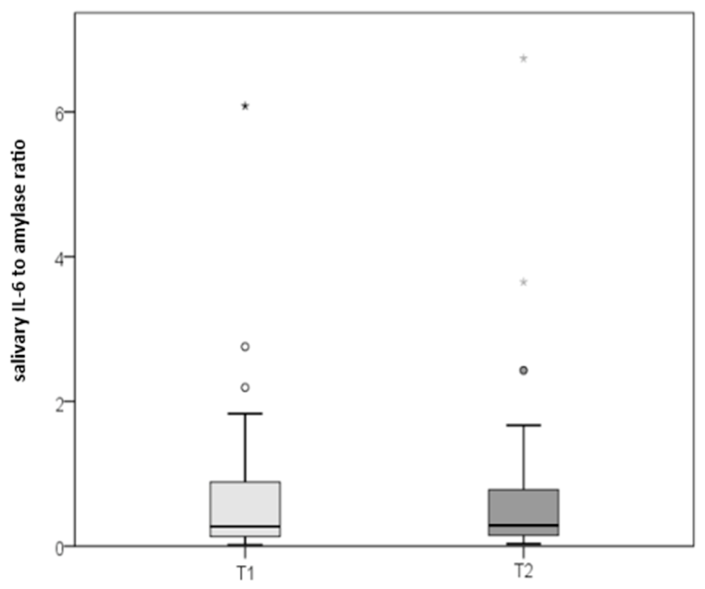
N–number of CSU patients; p–level of statistical significance
Table 3 presents Spearman correlations assessing the association between changes in CSU clinical severity, disease control, and quality of life with salivary and selected serum factors in CSU patients.
3.2. Analysis of Salivary IL-6 Variability
Interindividual variability was substantial (29.2 and 29.5 pg/mL for the first/T1 and second/T2 measurements). Mean intraindividual variability was low, although slightly greater dispersion was observed (mean difference between readings −1.3±11.9 pg/mL; 95% confidence interval (CI) −5.1 to 2.5). The Wilcoxon test did not reveal any differences between measurements, initial or subsequent (Table 4). The intraclass correlation coefficient was high at r=0.918 (95% CI 0.852–0.955; p<0.001), confirming good reproducibility.
3.3. Relationship Between IL-6 Levels in Saliva/Serum and CSU Severity
Initially, at the T1 timepoint, salivary IL-6 was mostly elevated (≥5.37 pg/mL), with only 3 patients within the reference range. For serum IL-6 values, however, only 4 patients showed elevated levels, while the others were within the range of reference. Levels of salivary IL-6 and serum IL-6 did not correlate linearly with CSU severity (Table 5). Salivary and serum levels for IL-6, as well as the salivary IL-6 to amylase ratio, did not significantly differ between CSU groups (no urticaria; mild, moderate, or severe disease), even when groups were dichotomized.
When salivary and serum IL-6 levels were dichotomized, comparing reference range and elevated values against dichotomized disease categories, differences remained statistically nonsignificant. Serum IL-6 was more frequently elevated in moderate or severe CSU than in absent or mild CSU, as assessed by UAS7 (15% vs. 5%), and more often elevated in cases of moderate or large dermatological quality of life impairment impact, as measured by the DLQI, compared to no or small impact (16% vs. 5%). Serum IL-6 levels were never elevated in well-controlled CSU versus uncontrolled disease per the UCT (0% vs. 11%). CU-Q2oL assessment similarly showed no IL-6 difference between controlled and uncontrolled CSU.
Salivary IL-6 values at baseline (T1) were more frequently elevated in patients where a large impact on CU-specific quality of life impairment (CU-Q2oL) was recorded, than in those with a moderate impact (94% vs. 88%), and higher values of salivary IL-6 were observed in uncontrolled versus well-controlled CSU as measured by the UCT (95% vs. 75%). Differences were not statistically significant; only a small number of participants had salivary IL-6 values within the reference range (N=3).
3.4. Salivary and Serum IL-6 Values Following Three-Month Standard CSU Therapy and the Relationship with CSU Severity and Serum Factor Levels
After the three-month standard therapy of antihistamines in CSU patients, at control measurement T2, values for the UAS7 and DLQI significantly decreased, while UCT values increased. Also, after three months of CSU treatment, only CRP values correlated with CSU control as measured by the UCT questionnaire (r=-0.459; p=0.014; Table 8).
Higher CRP levels were associated with reduced CSU control according to UCT assessment.
4. Discussion
Published data on CSU-related factors measured in saliva are scarce [21,22,23]. Although in our cohort salivary IL-6 did not correlate with CSU clinical features (severity, disease control, or quality of life scores), a weak correlation with serum CRP was observed and should be interpreted cautiously given the exploratory nature of the study. According to our results, in CSU patients, salivary IL-6 levels were mostly increased (≥5.37 pg/mL), while only 3 subjects were within the reference range. Also, the majority of CSU patients who had normal serum IL-6 had increased salivary IL-6 (92%). In addition, the analysis of the variability of salivary IL-6 showed a large interindividual variability, with a standard deviation of 29.2 and 29.5 pg/mL for the first and second timepoint, respectively. The average intra-individual variability of IL-6 was small, but a somewhat larger dispersion was observed (mean difference between the two readings: −1.3±11.9 pg/mL; 95% confidence interval −5.1–2.5). Also, no significant differences between the first and repeated measurements was confirmed (the Wilcoxon test), but a significantly high intraclass correlation coefficient was recorded [r=0.918 (95% CI 0.852–0.955; p<0.001)], confirming good repeatability. This indicates consistency, or agreement, of the measurements performed on multiple samples on the same number of subjects, thus reducing the inconsistency of saliva as a diagnostic sample. This supports the analytical feasibility of salivary IL-6 measurement, whereas its clinical utility requires further evaluation in larger controlled studies. Because saliva sampling is non-invasive, easy to repeat, and well accepted by patients, its potential role in CSU deserves further investigation.
Given the expected variability of salivary IL-6, salivary α-amylase was measured as an additional salivary parameter, and the IL-6/amylase ratio was explored descriptively as a normalization approach. Thus, in our study, the relative ratio between salivary IL-6 and amylase was analyzed and the results were interpreted accordingly. Furthermore, serum and salivary IL-6 values and the ratio between salivary IL-6 and amylase did not differ significantly between groups according to CSU severity, even when the groups were dichotomized. A possible reason for the lack of a significant difference in serum and salivary IL-6 between the CSU severity groups is the smaller number of severe and moderate CSU forms compared to the mild form (N=7/41 for well controlled CSU, N=11/41 for mild CSU, N=16/41 for moderate CSU, N=5/41 for severe CSU). In addition, higher IL-6 values were seen in saliva for uncontrolled CSU than for well-controlled CSU, as measured by the UCT questionnaire (95% vs. 75%). However, the difference between these parameters was not significant, and a small number of subjects had a value within the reference range (N=3). Although salivary IL-6 values were above the predefined cutoff in nearly all CSU patients, this finding may indicate that the selected threshold has limited discriminatory capacity within this study population. This may reduce the ability to distinguish between different clinical states or levels of CSU severity. When comparing salivary IL-6 with other serum biomarkers for CSU, a significant linear correlation was observed between salivary IL-6 and serum CRP, without an association between serum and salivary IL-6 with other biomarkers; furthermore, none of them were associated with the salivary IL-6 to amylase ratio. However, research into factors associated with CU, and biomarkers suitable for CU patient follow-up, is still ongoing, with the aim of obtaining scientific information useful for patient management [24,25,26,27].
To our knowledge, this is among the first prospective studies evaluating salivary IL-6 in patients with CSU, comparing the severity of CSU clinical presentation with the values of CSU factors/biomarkers determined in both saliva and serum and through CSU severity questionnaires. CSU controllability and impaired patient quality of life, were determined at the initial/T1 timepoint and control/T2 timepoint after 3 months of follow-up and standard CSU treatment. Among previous studies on CSU patients, there is a limited number of prospective studies, and of those, they predominantly monitored therapeutic response to treatment with biologics/omalizumab. It should also be mentioned that the high intraclass correlation coefficient in our study suggests good short-term reproducibility of salivary IL-6 measurement under the applied sampling conditions.
On the other hand, there are a few limitations to this study, its main limitations being the small sample size and that there was no control group, as well as patient attrition during follow-up, and the exploratory nature of the multiple statistical comparisons. Also, a relatively large number of comparisons and correlation analyses were performed in this study, which increases the risk of type I error due to multiple testing and the analyses were primarily based on univariate statistical approaches and no formal correction for multiple comparisons was applied. Therefore, the reported associations should be interpreted with caution, particularly those with borderline statistical significance. Our findings are not definitive and should only be used to generate hypotheses. However, based on this and other findings from previous studies indicating IL-6 as an important molecule for CSU, further research is welcome, as well as data obtained from various diagnostic analyses, including methods using saliva [28,29,30,31].
5. Conclusion
Salivary IL-6 can be measured reproducibly in patients with CSU; however, its clinical relevance remains uncertain. In this exploratory study, salivary IL-6 showed a weak association with serum CRP but no consistent association with disease severity, disease control, or short-term longitudinal change. Although a small number of respondents were included, and there was a high dropout rate, we consider that IL-6 is a candidate for further investigation. However, this still needs to be investigated further in additional studies. Larger controlled studies are needed before CSU clinical work can use salivary IL-6 as a useful biomarker. As this study is the first to examine a CSU biomarker in saliva, we hope to collect more data, and widen the scope of our research, in future studies and gain more experience in this topic.
Author Contributions
Conceptualization, L.L.-M.; methodology, software, validation, M. K.-M., T.S., D.V., and M.Š.; formal analysis, investigation, M. K.-M., T.S., D.V., and M.Š.; resources, L.L.-M.; data curation, L.L.-M. , M. K.-M., T.S., and M.Š.; writing—original draft preparation, L.L.-M. , M. K.-M., and L.Z..; writing—review and editing,, L.L.-M., M. K.-M., T.S., D.V., and M.Š. ; supervision, L.L.-M.; project administration, M. K.-M..; funding acquisition, L.L.-M. All authors have read and agreed to the published version of the manuscript.
Funding
This research received no external funding.
Institutional Review Board Statement
This study was conducted in accordance with the Declaration of Helsinki (1964) and its subsequent amendments, with approval from the Ethics Committee of the School of Dental Medicine, University of Zagreb, Zagreb, Croatia (approval date 11 November 2021 - class: 003-06/21-03/036, protocol/document number: 251-29-11-21-01-9).
Informed Consent Statement
Informed consent was obtained from all subjects involved in the study.
Data Availability Statement
The data analysed in this study are available upon reasonable request by email to the corresponding author.
Conflicts of Interest
The authors declare no conflicts of interest.
References
- Zuberbier, T.; Abdul Latiff, A.H.; Abuzakouk, M.; Aquilina, S.; Asero, R.; Baker, D.; et al. The international EAACI/GA²LEN/EuroGuiDerm/APAAACI guideline for the definition. classification. diagnosis. and management of urticaria. Allergy 2022, 77, 734–766. [Google Scholar] [CrossRef] [PubMed]
- Kolkhir, P.; Bonnekoh, H.; Metz, M.; Maurer, M. Chronic spontaneous urticaria: a review. JAMA 2024, 332, 1464–1477. [Google Scholar] [CrossRef] [PubMed]
- Suresha, N.R.J.; Yadalla, H.K.K.; Shivappa, N. Serum interleukin-6 as a biomarker of disease activity and severity in chronic spontaneous urticaria: a case control study in urban south Indian population. Int. J. Res. Dermatol. 2025, 11, 414–417. Available online: https://www.ijord.com/index.php/ijord/article/view/2067 (accessed on 2026 Jun. 9). [CrossRef]
- Kuna, M.; Štefanović, M.; Ladika Davidović, B.; Mandušić, N.; Birkić Belanović, I.; Lugović-Mihić, L. Chronic urticaria biomarkers IL-6. ESR and CRP in correlation with disease severity and patient quality of life-a pilot study. Biomedicines 2023, 11, 2232. [Google Scholar] [CrossRef] [PubMed]
- Hama, P.N.; Ahmed, K.M. Evaluation of salivary interleukin 6 interleukin 1 beta and interferon gamma in oral and mucocutaneous lichen planus patients. Sci. Rep. 2026, 16, 5678. [Google Scholar] [CrossRef] [PubMed]
- Dineshkumar, T.; Ashwini, B.K.; Rameshkumar, A.; Rajashree, P.; Ramya, R.; Rajkumar, K. Salivary and serum interleukin-6 levels in oral premalignant disorders and squamous cell carcinoma: diagnostic value and clinicopathologic correlations. Asian Pac. J. Cancer Prev. 2016, 17, 4899–4906. [Google Scholar] [CrossRef] [PubMed]
- Oshin, M.; Kulkarni, P.G.; D, S.P.R.; Deepthi, G.; S, K.S.; S, J.K. Salivary and serum interleukin-6: a credible marker for predicting oral leukoplakia and oral squamous cell carcinoma by enzyme-linked immunosorbent assay (ELISA). Cureus 2024, 16, e59113. [Google Scholar] [CrossRef] [PubMed]
- Ali, A.A.A.; Ramadan, A.M.; Mukhtar, M.M.; Awadelkarim, M.O.A.; Ali, D.A.A. Salivary IL-6 levels in chronic periodontitis patients with and without oral squamous cell carcinoma: A comparative cross-sectional study at Khartoum dental teaching hospital. 2016-2017. Saudi Dent. J. 2025, 37, 65. [Google Scholar] [CrossRef] [PubMed]
- Pfaffe, T.; Cooper-White, J.; Beyerlein, P.; Kostner, K.; Punyadeera, C. Diagnostic potential of saliva: current state and future applications. Clin. Chem. 2011, 57, 675–687. [Google Scholar] [CrossRef] [PubMed]
- Granger, D.A.; Johnson, S.B.; Szanton, S.L.; Out, D.; Schumann, L.L. Incorporating salivary biomarkers into nursing research: an overview and review of best practices. Biol. Res. Nurs. 2012, 14, 347–356. [Google Scholar] [PubMed]
- Zhang, Y.; Lin, M.; Zhang, S.; Wang, Z.; Jiang, L.; Shen, J.; et al. NF-κB-dependent cytokines in saliva and serum from patients with oral lichen planus: A study in an ethnic Chinese population. Cytokine 2008, 41, 144–149. [Google Scholar] [CrossRef] [PubMed]
- Dzobo, W.; Eren, E.; Robson, S.; Shute, J.K. Salivary IL-8 and sTREM-1 in chronic urticaria: A diagnostic test accuracy study. Clin. Exp. Allergy 2024, 54, 356–358. [Google Scholar] [CrossRef] [PubMed]
- Kuna, M.; Štefanović, M.; Barac, E.; Madunić, F.I.; Hanžek, M.; Lugović-Mihić, L. Prospective monitoring of serum values of CBC, total IgE, thyroid findings. D-Dimer, vitamin D, and inflammatory molecules CRP, ESR. and IL-6 and clinical features of chronic spontaneous urticaria patients during antihistamine treatment. Int. J. Mol. Sci. 2026, 27, 2503. [Google Scholar] [CrossRef] [PubMed]
- Xue, X.; Wang, Q.; Yang, X.; Tu, H.; Deng, Z.; Kong, D.; et al. Effect of bilastine on chronic urticaria: a systematic review and meta-analysis. Int. Arch. Allergy Immunol. 2023, 184, 176–185. [Google Scholar] [CrossRef] [PubMed]
- Maurer, M.; Costa, C.; Gimenez Arnau, A.; Guillet, G.; Labrador-Horrillo, M.; Lapeere, H.; et al. Antihistamine-resistant chronic spontaneous urticaria remains undertreated: 2-year data from the AWARE study. Clin. Exp. Allergy 2020, 50, 1166–1175. [Google Scholar] [CrossRef] [PubMed]
- Weller, K.; Groffik, A.; Church, M.K.; Hawro, T.; Krause, K.; Metz, M.; et al. Development and validation of the Urticaria Control Test: a patient-reported outcome instrument for assessing urticaria control. J. Allergy Clin. Immunol. 2014, 133, 1365–1372.e6. [Google Scholar] [CrossRef] [PubMed]
- Finlay, A.Y.; Khan, G.K. Dermatology Life Quality Index (DLQI)-a simple practical measure for routine clinical use. Clin. Exp. Dermatol. 1994, 19, 210–216. [Google Scholar] [CrossRef] [PubMed]
- Brzoza, Z.; Badura-Brzoza, K.; Maurer, M.; Hawro, T.; Weller, K. Chronic spontaneous urticaria activity. impact and control as well as their changes are strongly linked. and these links are not affected by angioedema or comorbid inducible urticaria - Results from the validation of the Polish Urticaria Control Test. World Allergy Organ J. 2022, 15, 100635. [Google Scholar]
- Metz, M.; Altrichter, S.; Buttgereit, T.; Fluhr, J.W.; Fok, J.S.; Hawro, T.; et al. The diagnostic workup in chronic spontaneous urticaria - what to test and why? J. Allergy Clin. Immunol. Pract. 2021, 9, 2274–2283. [Google Scholar] [CrossRef] [PubMed]
- Kocatürk, E.; Kızıltaç, U.; Can, P.; Öztaş Kara, R.; Erdem, T.; Kızıltaç, K.; et al. Validation of the Turkish version of the Urticaria Control Test: Correlation with other tools and comparison between spontaneous and inducible chronic urticaria. World Allergy Organ J. 2019, 12, 100009. [Google Scholar]
- Lee, J.H.; Bae, Y.J.; Lee, S.H.; Kim, S.C.; Lee, H.Y.; Ban, G.Y.; Shin, Y.S.; Park, H.S.; Kratzsch, J.; Ye, Y.M. Adaptation and Validation of the Korean Version of the Urticaria Control Test and Its Correlation With Salivary Cortisone. Allergy Asthma Immunol. Res. 2019, 11, 55–67. [Google Scholar] [CrossRef] [PubMed]
- Bešlić, I.; Vrtarić, A.; Škrinjar, I.; Barac, E.; Vodanović, A.K.; Lugović-Mihić, L. An Assessment of melatonin levels in the saliva of patients with chronic urticaria in comparison with their sleep quality and dermatologic quality of life. Clin. Pract. 2026, 16, 36. [Google Scholar] [CrossRef] [PubMed]
- Lugović-Mihić, L.; Novak-Hlebar, I.; Smoljan, D.; Vukasović, I.; Barac, E.; Vilibić, M. Determination of perceived stress. salivary cortisol and interleukin-1β levels and clinical features of chronic urticaria in patients with dermographic urticaria in comparison to patients with chronic spontaneous urticaria and healthy individuals. Front Immunol. 2026, 17, 1741412. [Google Scholar] [CrossRef] [PubMed]
- Zhang, Y.; Zhang, H.; Du, S.; Yan, S.; Zeng, J. Advanced biomarkers: therapeutic and diagnostic targets in urticaria. Int. Arch. Allergy Immunol. 2021, 182, 917–931. [Google Scholar] [CrossRef] [PubMed]
- Türk, M.; Bizjak-Suran, M.; Can, P.K.; Criado, P.R.; Fluhr, J.W.; Özceker, D.; et al. Clinical phenotypes and molecular endotypes of chronic urticaria: Linking clinical expression to underlying immune mechanisms. Asia Pac. Allergy 2026, 16, 107–122. [Google Scholar] [CrossRef] [PubMed]
- Kaplan, A.; Lebwohl, M.; Giménez-Arnau, A.M.; Hide, M.; Armstrong, A.W.; Maurer, M. Chronic spontaneous urticaria: Focus on pathophysiology to unlock treatment advances. Allergy 2023, 78, 389–401. [Google Scholar] [CrossRef] [PubMed]
- Li, B.; Peng, L.; Li, R.; Shi, M.; Li, Y.; Sun, C.; Zhang, Z.; Xue, J.; Zhao, Y. Is it possible to use complete blood collection based systemic inflammatory indices as potential biomarkers for chronic spontaneous urticaria? Front Immunol. 2026, 17, 1760879. [Google Scholar] [CrossRef] [PubMed]
- Di Benedetto, G.; Sorice, C.; Cantiello, I.; Savarese, M.; Leone, O.; Capozza, M.A.; Alfieri, M. Interleukin-6: a central biomarker in adult and pediatric cancer and infectious disease. Biologics 2026, 6, 5. [Google Scholar] [CrossRef]
- Aitella, E.; Azzellino, G.; Cammisuli, B.A.; De Benedictis, C.; Di Mattia, D.; Romano, C.; Ginaldi, L.; De Martinis, M. Immunosenescence and allergy: molecular and cellular links between inflammaging, neuro-immune aging, and response to biologic therapies. Int. J. Mol. Sci. 2026, 27, 1206. [Google Scholar] [CrossRef] [PubMed]
- Orzan, O.A.; Popa, L.G.; Mihai, M.M.; Cojocaru, A.; Giurcăneanu, C.; Dorobanțu, A.M. Current and future approaches in management of chronic spontaneous urticaria using anti-IgE antibodies. Medicina 2022, 58, 816. [Google Scholar] [CrossRef] [PubMed]
- Jonna Suresha, N.R.; Yadalla, H.K.K.; Shivappa, N. Serum interleukin-6 as a biomarker of disease activity and severity in chronic spontaneous urticaria: a case control study in urban south Indian population. Int. J. Res. Dermatol. 2025, 11. [Google Scholar] [CrossRef]
Figure 1.
Relationship between serum and salivary IL-6 concentrations (expressed in pg/mL) in CSU patients (T1 timepoint).
Figure 1.
Relationship between serum and salivary IL-6 concentrations (expressed in pg/mL) in CSU patients (T1 timepoint).
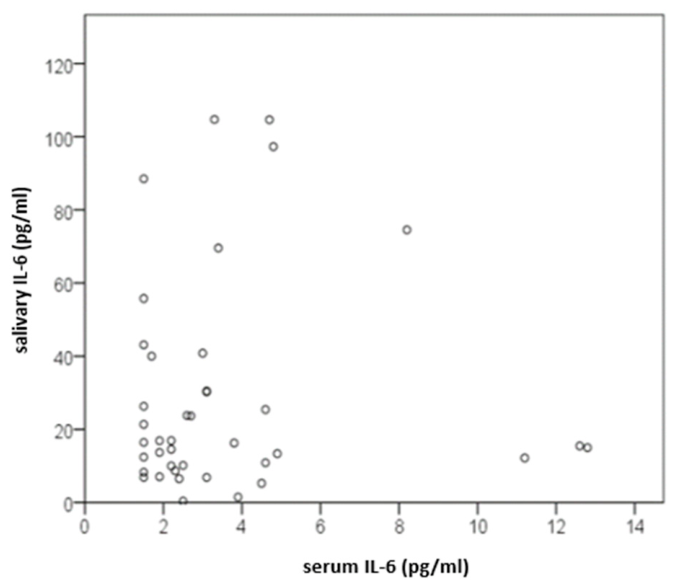
Figure 2.
Relationship between serum IL-6 concentration (expressed in pg/mL) and salivary IL-6 to amylase ratio in CSU patients (T1 timepoint).
Figure 2.
Relationship between serum IL-6 concentration (expressed in pg/mL) and salivary IL-6 to amylase ratio in CSU patients (T1 timepoint).
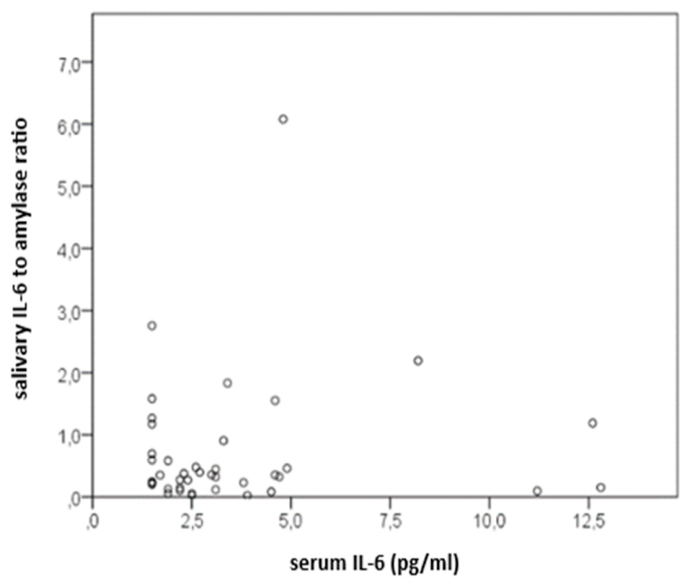

Table 1.
Description of CSU patients at T1 timepoint.
| variable | N | mean ± SD | median | IQR | min | max |
|---|---|---|---|---|---|---|
| disease duration (mo.) | 41 | 12.2 ± 12.8 | 7 | 5 – 11.5 | 2 | 64 |
| UAS7 | 41 | 15.7 ± 10.0 | 16 | 7.5 – 23.5 | 0 | 39 |
| DLQI | 41 | 6.6 ± 5.5 | 5 | 2.5 – 9 | 0 | 24 |
| CU-Q2oL | 35 | 29.9 ± 20.3 | 23 | 15 – 47 | 0 | 85 |
| UCT | 41 | 8.2 ± 2.6 | 9 | 6 – 10 | 3 | 14 |
| serum IL-6 (pg/mL) | 40 | 3.6 ± 2.9 | 2.6 | 1.8 – 4.4 | 1.5 | 12.8 |
| salivary IL-6 (pg/mL) | 41 | 28.4 ± 28.7 | 16.4 | 10.1 – 35.2 | 0.4 | 104.7 |
| salivary IL-6 to amylase ratio | 41 | 0.71 ± 1.07 | 0.35 | 0.15 – 0.80 | 0.02 | 6.08 |
| CRP (mg/L) | 41 | 3.0 ± 3.5 | 1.5 | 0.7 – 3.7 | 0.2 | 14.0 |
Abbreviations: N–number of CSU patients; SD–standard deviation; IQR–interquartile range (25th–75th percentile); min–minimum value; max–maximum value in the sample; mo.–months; UAS7-weekly urticaria activity score; DLQI–Dermatology Life Quality Index; CU-Q2oL-chronic urticaria quality of life questionnaire; UCT–urticaria control test; IL-6–interleukin 6; CRP–C-reactive protein.
Table 2.
Association of disease duration and serum and salivary IL-6 assessed by Spearman correlation (T1 timepoint).
Table 2.
Association of disease duration and serum and salivary IL-6 assessed by Spearman correlation (T1 timepoint).
| variable | disease duration (mo.) | serum IL-6 | salivary IL-6 | salivary IL-6 to amylase ratio | |
|---|---|---|---|---|---|
| disease duration (mo.) | r | −0.037 | 0.009 | 0.071 | |
| p | 0.82 | 0.957 | 0.659 | ||
| N | 40 | 41 | 41 | ||
| serum IL-6 (pg/mL) | r | −0.037 | 0.047 | −0.022 | |
| p | 0.82 | 0.773 | 0.891 | ||
| N | 40 | 40 | 40 | ||
| salivary IL-6 (pg/mL) | r | 0.009 | 0.047 | 0.597 | |
| p | 0.957 | 0.773 | < 0.001 | ||
| N | 41 | 40 | 41 | ||
| salivary IL-6 to amylase ratio | r | 0.071 | −0.022 | 0.597 | |
| p | 0.659 | 0.891 | < 0.001 | ||
| N | 41 | 40 | 41 |
Abbreviations: p–level of statistical significance; r–Spearman correlation coefficient; N–number of CSU patients; mo.–months; IL-6–interleukin 6.
Table 3.
Spearman correlations assessing the association between changes in CSU clinical severity, disease control, and quality of life with salivary and selected serum factors in CSU patients (T1 and T2 timepoints).
Table 3.
Spearman correlations assessing the association between changes in CSU clinical severity, disease control, and quality of life with salivary and selected serum factors in CSU patients (T1 and T2 timepoints).
| variable | Δ UAS7 T2 – T1 | Δ DLQI T2 – T1 | Δ CU-Q2oL T2 – T1 | Δ UCT T2 – T1 | |
|---|---|---|---|---|---|
| Δ salivary IL-6 T2 – T1 |
r | 0.018 | 0 | 0.362 | −0.169 |
| p | 0.928 | 0.999 | 0.098 | 0.391 | |
| N | 28 | 28 | 22 | 28 | |
| Δ salivary IL-6 to amylase ratio T2 – T1 |
r | −0.16 | −0.071 | 0.224 | −0.149 |
| p | 0.416 | 0.72 | 0.316 | 0.449 | |
| N | 28 | 28 | 22 | 28 | |
| Δ serum IL-6 T2 – T1 |
r | −0.084 | 0.208 | −0.134 | −0.003 |
| p | 0.683 | 0.307 | 0.573 | 0.99 | |
| N | 26 | 26 | 20 | 26 | |
| Δ CRP T2 – T1 |
r | 0.283 | 0.229 | −0.05 | −0.091 |
| p | 0.145 | 0.242 | 0.825 | 0.645 | |
| N | 28 | 28 | 22 | 28 | |
| absolute basophil counts in blood T2 – T1 |
r | 0.002 | −0.385 | −0.276 | 0.112 |
| p | 0.993 | 0.043 | 0.214 | 0.57 | |
| N | 28 | 28 | 22 | 28 |
Abbreviations: p – level of statistical significance; r – Spearman correlation coefficient; N – number of CSU patients; Δ – change in values from T2 (time of second measurement) minus T1 (time of first measurement); UAS7–weekly urticaria activity score; DLQI–Dermatology Life Quality Index; CU-Q2oL–chronic urticaria quality of life questionnaire; UCT–urticaria control test; IL-6–interleukin 6; CRP–C-reactive protein.
Table 4.
Results of salivary IL-6 concentration variability assessment in CSU patients.
| variable | mean ± SD | median (IQR) | min – max | p* |
|---|---|---|---|---|
| salivary IL-6 (pg/mL) sample 1 | 27.7 ± 29.2 | 17.4 (9.2 – 34.1) | 0.4 – 106.1 | |
| salivary IL-6 (pg/mL) sample 2 | 29.0 ± 29.5 | 18.2 (10.7 – 35.0) | 0.4 – 109.5 | |
| difference (sample 1 – sample 2) |
1.3 ± 11.9 | −1.0 (−6.1 – 5.3) | −42.5 – 21.0 | 0.633 |
*Wilcoxon test for paired samples. Abbreviations: IL-6–interleukin 6; SD-standard deviation; IQR–interquartile range; min–minimum value; max–maximum value in the same sample; sample 1–salivary IL-6 measured at first assessment (T1); sample 2–salivary IL-6 measured in the second saliva sample collected at T1.
Table 5.
Spearman correlations between salivary and serum IL-6 and CSU clinical severity at T1 (time of first measurement).
Table 5.
Spearman correlations between salivary and serum IL-6 and CSU clinical severity at T1 (time of first measurement).
| variable | UAS7 | DLQI | CU-Q2oL | UCT | serum IL-6 | salivary IL-6 | salivary IL-6 to amylase ratio | |
|---|---|---|---|---|---|---|---|---|
| UAS7 | r | 1 | 0.776 | 0.608 | −0.673 | 0.087 | −0.16 | −0.112 |
| p | / | < 0.001 | < 0.001 | < 0.001 | 0.594 | 0.316 | 0.484 | |
| N | 41 | 41 | 35 | 41 | 40 | 41 | 41 | |
| DLQI | r | 0.776 | 1 | 0.838 | −0.669 | 0.135 | −0.166 | −0.033 |
| p | < 0.001 | / | < 0.001 | < 0.001 | 0.405 | 0.3 | 0.84 | |
| N | 41 | 41 | 35 | 41 | 40 | 41 | 41 | |
| CU-Q2oL | r | 0.608 | 0.838 | 1 | −0.558 | 0.16 | −0.179 | 0.108 |
| p | < 0.001 | < 0.001 | / | < 0.001 | 0.366 | 0.304 | 0.538 | |
| N | 35 | 35 | 35 | 35 | 34 | 35 | 35 | |
| UCT | r | −0.673 | −0.669 | −0.558 | 1 | −0.068 | 0.068 | −0.057 |
| p | < 0.001 | < 0.001 | < 0.001 | / | 0.678 | 0.673 | 0.724 | |
| N | 41 | 41 | 35 | 41 | 40 | 41 | 41 | |
| serum IL-6 | r | 0.087 | 0.135 | 0.16 | −0.068 | 1 | 0.047 | −0.022 |
| p | 0.594 | 0.405 | 0.366 | 0.678 | / | 0.773 | 0.891 | |
| N | 40 | 40 | 34 | 40 | 40 | 40 | 40 | |
| salivary IL-6 | r | −0.16 | −0.166 | −0.179 | 0.068 | 0.047 | 1 | 0.597 |
| p | 0.316 | 0.3 | 0.304 | 0.673 | 0.773 | / | < 0.001 | |
| N | 41 | 41 | 35 | 41 | 40 | 41 | 41 | |
| salivary IL-6 to amylase ratio | r | −0.112 | −0.033 | 0.108 | −0.057 | −0.022 | 0.597 | 1 |
| p | 0.484 | 0.84 | 0.538 | 0.724 | 0.891 | < 0.001 | / | |
| N | 41 | 41 | 35 | 41 | 40 | 41 | 41 |
p–level of statistical significance; r–Spearman correlation coefficient; N–number of CSU patients.
Table 6.
Comparison of salivary IL-6 and the salivary IL-6 to amylase ratio in patient groups according to CSU severity.
Table 6.
Comparison of salivary IL-6 and the salivary IL-6 to amylase ratio in patient groups according to CSU severity.
| variable and category | salivary IL-6 median (IQR) |
salivary IL-6 to amylase ratio median (IQR) |
|---|---|---|
| no urticaria or mild CSU (≤ 2) | 21.4 (10.9 – 40.0) | 0.35 (0.20 – 0.69) |
| moderate or severe CSU (≥ 3) | 14.2 (9.7 – 32.3) | 0.35 (0.10 – 1.28) |
| p (r) | 0.458 (-0.116) | 0.934 (-0.013) |
| UAS7 | ||
| no urticaria or mild CSU (≤ 15) | 19.1 (9.3 – 94.5) | 0.38 (0.23 – 0.83) |
| moderate or severe CSU (≥ 16) | 15.0 (10.1 – 28.4) | 0.32 (0.12 – 0.93) |
| p (r) | 0.514 (0.080) | 0.481 (0.075) |
| DLQI | ||
| no or small impact (≤ 5) | 19.8 (11.4 – 40.2) | 0.38 (0.23 – 0.67) |
| moderate to severe impact (≥ 6) | 13.7 (10.0 – 26.3) | 0.32 (0.10 – 1.17) |
| p (r) | 0.296 (0.046) | 0.403 (0.063) |
| UCT | ||
| uncontrolled CSU (≤ 11) | 16.4 (10.5 – 35.2) | 0.36 (0.15 – 0.80) |
| well-controlled CSU (≥ 12) | 16.0 (5.6 – 58.5) | 0.31 (0.13 – 1.46) |
| p (r) | 0.568 (0.089) | 0.860 (0.134) |
| CU-Q2oL | ||
| no or small impact (≤ 14) | 19.8 (12.0 – 40.2) | 0.36 (0.15 – 0.62) |
| moderate to severe impact (≥ 25) | 13.4 (9.3 – 52.4) | 0.45 (0.16 – 1.36) |
| p (r) | 0.509 (0.086) | 0.717 (0.121) |
p–level of statistical significance based on Mann-Whitney test; r–effect size; IQR–interquartile range.
Table 7.
Association of salivary and serum IL-6 levels with other serum factors in CSU patients at T1.
Table 7.
Association of salivary and serum IL-6 levels with other serum factors in CSU patients at T1.
| variable | serum IL-6 (pg/mL) | salivary IL-6 (pg/mL) | salivary IL-6 to amylase ratio | |
|---|---|---|---|---|
| total IgE (kIU/L) | r | 0.207 | −0.246 | −0.151 |
| p | 0.199 | 0.121 | 0.345 | |
| N | 40 | 41 | 41 | |
| TSH (mIU/L) | r | 0.275 | 0.011 | −0.054 |
| p | 0.09 | 0.949 | 0.739 | |
| N | 39 | 40 | 40 | |
| T4 (nmol/L) | r | 0.321 | −0.132 | −0.276 |
| p | 0.043 | 0.411 | 0.08 | |
| N | 40 | 41 | 41 | |
| anti-TPO (kIU/L) | r | −0.143 | -0.121 | −0.112 |
| p | 0.384 | 0.459 | 0.493 | |
| N | 39 | 40 | 40 |
Abbreviations: p–level of statistical significance; r–Spearman correlation coefficient. N–number of CSU patients; IL-6–interleukin 6; IgE–immunoglobulin E; TSH–thyroid-stimulating hormone; T4–thyroxine; anti-TPO–anti-thyroid peroxidase antibodies.
Table 8.
Association between CSU severity and examined factors after three-month standard therapy (at control measurement T2).
Table 8.
Association between CSU severity and examined factors after three-month standard therapy (at control measurement T2).
| variable | UAS7 T2 |
DLQI T2 | CU-Q2oL T2 | UCT T2 | |
|---|---|---|---|---|---|
| salivary IL-6 (pg/mL) | r | 0.061 | −0.072 | −0.32 | 0.021 |
| p | 0.756 | 0.717 | 0.111 | 0.914 | |
| N | 28 | 28 | 26 | 28 | |
| salivary IL-6 to amylase ratio | r | 0.16 | 0.136 | 0.034 | −0.08 |
| p | 0.415 | 0.492 | 0.868 | 0.685 | |
| N | 28 | 28 | 26 | 28 | |
| serum IL-6 (pg/mL) | r | −0.014 | −0.183 | −0.346 | −0.022 |
| p | 0.945 | 0.372 | 0.098 | 0.914 | |
| N | 26 | 26 | 24 | 26 | |
| CRP (mg/L) | r | 0.28 | 0.119 | −0.092 | −0.459 |
| p | 0.149 | 0.545 | 0.656 | 0.014 | |
| N | 28 | 28 | 26 | 28 | |
| concentration of basophils in blood (x 109/L) | r | −0.018 | −0.084 | −0.037 | 0.208 |
| p | 0.926 | 0.669 | 0.856 | 0.287 | |
| N | 28 | 28 | 26 | 28 | |
| ESR (mm/3.6 ks) | r | −0.041 | −0.16 | 0.042 | 0.051 |
| p | 0.836 | 0.415 | 0.839 | 0.796 | |
| N | 28 | 28 | 26 | 28 | |
| total IgE (kIU/L) | r | 0.162 | 0.109 | −0.051 | −0.293 |
| p | 0.418 | 0.587 | 0.808 | 0.137 | |
| N | 27 | 27 | 25 | 27 | |
| TSH (mIU/L) | r | 0.146 | 0.083 | 0.163 | 0.033 |
| p | 0.468 | 0.679 | 0.435 | 0.872 | |
| N | 27 | 27 | 25 | 27 | |
| T4 (nmol/L) | r | 0.015 | −0.218 | −0.207 | 0.152 |
| p | 0.942 | 0.274 | 0.322 | 0.449 | |
| N | 27 | 27 | 25 | 27 | |
| anti-TPO (kIU/L) | r | 0.133 | 0.096 | −0.133 | −0.071 |
| p | 0.499 | 0.626 | 0.517 | 0.72 | |
| N | 28 | 28 | 26 | 28 |
Abbreviations: p–level of statistical significance; r–Spearman correlation coefficient; N–number of CSU patients; T2–time of control measurement.
Disclaimer/Publisher’s Note: The statements, opinions and data contained in all publications are solely those of the individual author(s) and contributor(s) and not of MDPI and/or the editor(s). MDPI and/or the editor(s) disclaim responsibility for any injury to people or property resulting from any ideas, methods, instructions or products referred to in the content. |
© 2026 by the authors. Licensee MDPI, Basel, Switzerland. This article is an open access article distributed under the terms and conditions of the Creative Commons Attribution (CC BY) license (http://creativecommons.org/licenses/by/4.0/).
Copyright: This open access article is published under a Creative Commons CC BY 4.0 license, which permit the free download, distribution, and reuse, provided that the author and preprint are cited in any reuse.