

Submitted:
23 October 2026
Posted:
23 October 2026
You are already at the latest version
Abstract
Background and Objective: Neutrophil extracellular trap (NET) formation has been proposed as a potential component of the inflammatory response associated with hemodialysis (HD). However, direct assessment of NET formation by neutrophils during HD has been limited. This study evaluated NET-associated signals in neutrophils during HD using flow cytometry and compared these findings with circulating NET-associated biomarkers. Methods: Ten clinically stable outpatients receiving regular HD with H2-enriched dialysate (H2-HD) participated in a prospective within-subject repeated-measures exploratory study. Patients underwent H2-HD for 1 week (phase 1), standard HD (SHD) for 1 week (phase 2), and H2-HD again for 1 week (phase 3). Blood samples were obtained immediately before and after the third HD session in each phase. NET-associated signals were assessed in isolated polymorphonuclear leukocyte preparations by flow cytometry using SYTOX Green and anti-myeloperoxidase (MPO) staining. Plasma cell-free DNA (cfDNA) and MPO-DNA complexes were also measured. Results: The proportion of SYTOX Green/MPO double-positive events in the predefined extracellular fraction increased significantly after HD during phase 2 (SHD), whereas no significant increase was observed during phases 1 or 3 (H2-HD). Changes in the NET-associated signal did not differ significantly among the three phases. The change in the NET-associated signal was strongly correlated with the change in MPO-positive events (r=0.966, P<0.001), but not with changes in cfDNA or MPO-DNA complexes. Plasma cfDNA increased after HD before correction for hemoconcentration but not after correction. MPO-DNA levels decreased after HD after correction for hemoconcentration. Conclusions: Flow cytometry detected a neutrophil-associated NET signal that increased during SHD, providing evidence consistent with NET-associated extracellular DNA formation during HD. The discordant responses of flow cytometric and circulating NET-associated biomarkers suggest that these assays may reflect different aspects or temporal phases of the dialysis-associated neutrophil response. The effect of H2-HD on NET formation remains uncertain.
Keywords:
biocompatibility
; hemodialysis
; NETosis
; neutrophil
; H2
; electrolyzed water
1. Introduction
Neutrophil extracellular trap (NET) formation is an important host-defense mechanism in which neutrophils release chromatin and associated antimicrobial proteins into the extracellular space. However, excessive or dysregulated NET formation has also been implicated in non-infectious conditions, including autoimmune disease, vascular disorders, and malignancy [1,2].
NET formation has recently been proposed as a potential component of the inflammatory response associated with hemodialysis (HD) and dialysis membrane biocompatibility [3,4]. Complement activation is involved in neutrophil activation and may contribute to NET formation [5,6]. Consistent with this concept, circulating NET-associated markers, including nucleosomes, cell-free DNA (cfDNA), and myeloperoxidase (MPO)-DNA complexes, have been reported to be elevated in patients receiving dialysis compared with healthy individuals [7,8]. Post-dialysis cfDNA has also been associated with clinical outcomes [9,10,11].
However, circulating NET-associated biomarkers are not specific to NET formation by neutrophils. cfDNA, for example, may originate from multiple cell types and may be influenced by vascular injury and other systemic processes, while uremic toxins and pre-existing cardiovascular disease may also affect NET-associated biomarkers [12,13,14]. Thus, an increase in a circulating marker does not necessarily establish that NET formation occurs during an individual HD session. Direct assessment of neutrophil-associated NET formation during HD has therefore remained an important unmet methodological issue.
The present study investigated NET-associated signals in isolated neutrophil preparations obtained immediately before and after HD using flow cytometry. We also compared these findings with circulating cfDNA and MPO-DNA complexes. As an exploratory secondary objective, we examined whether HD using H2-enriched dialysate (H2-HD) was associated with a different NET-associated response from standard HD.
2. Patients and Methods
2. ,1 Study Population and Design
Patients receiving regular HD at the outpatient clinic of St Luke’s International Hospital (Tokyo, Japan), between January and February 2024 were considered for participation. The hospital had introduced an HD system using H2-enriched dialysate in October 2020, and outpatients were routinely treated with this modality three times weekly for 4-5 h per session. Dialysis was performed using high-performance membrane dialyzers composed of polysulfone, polyethersulfone, polymethyl methacrylate, or cellulose triacetate.
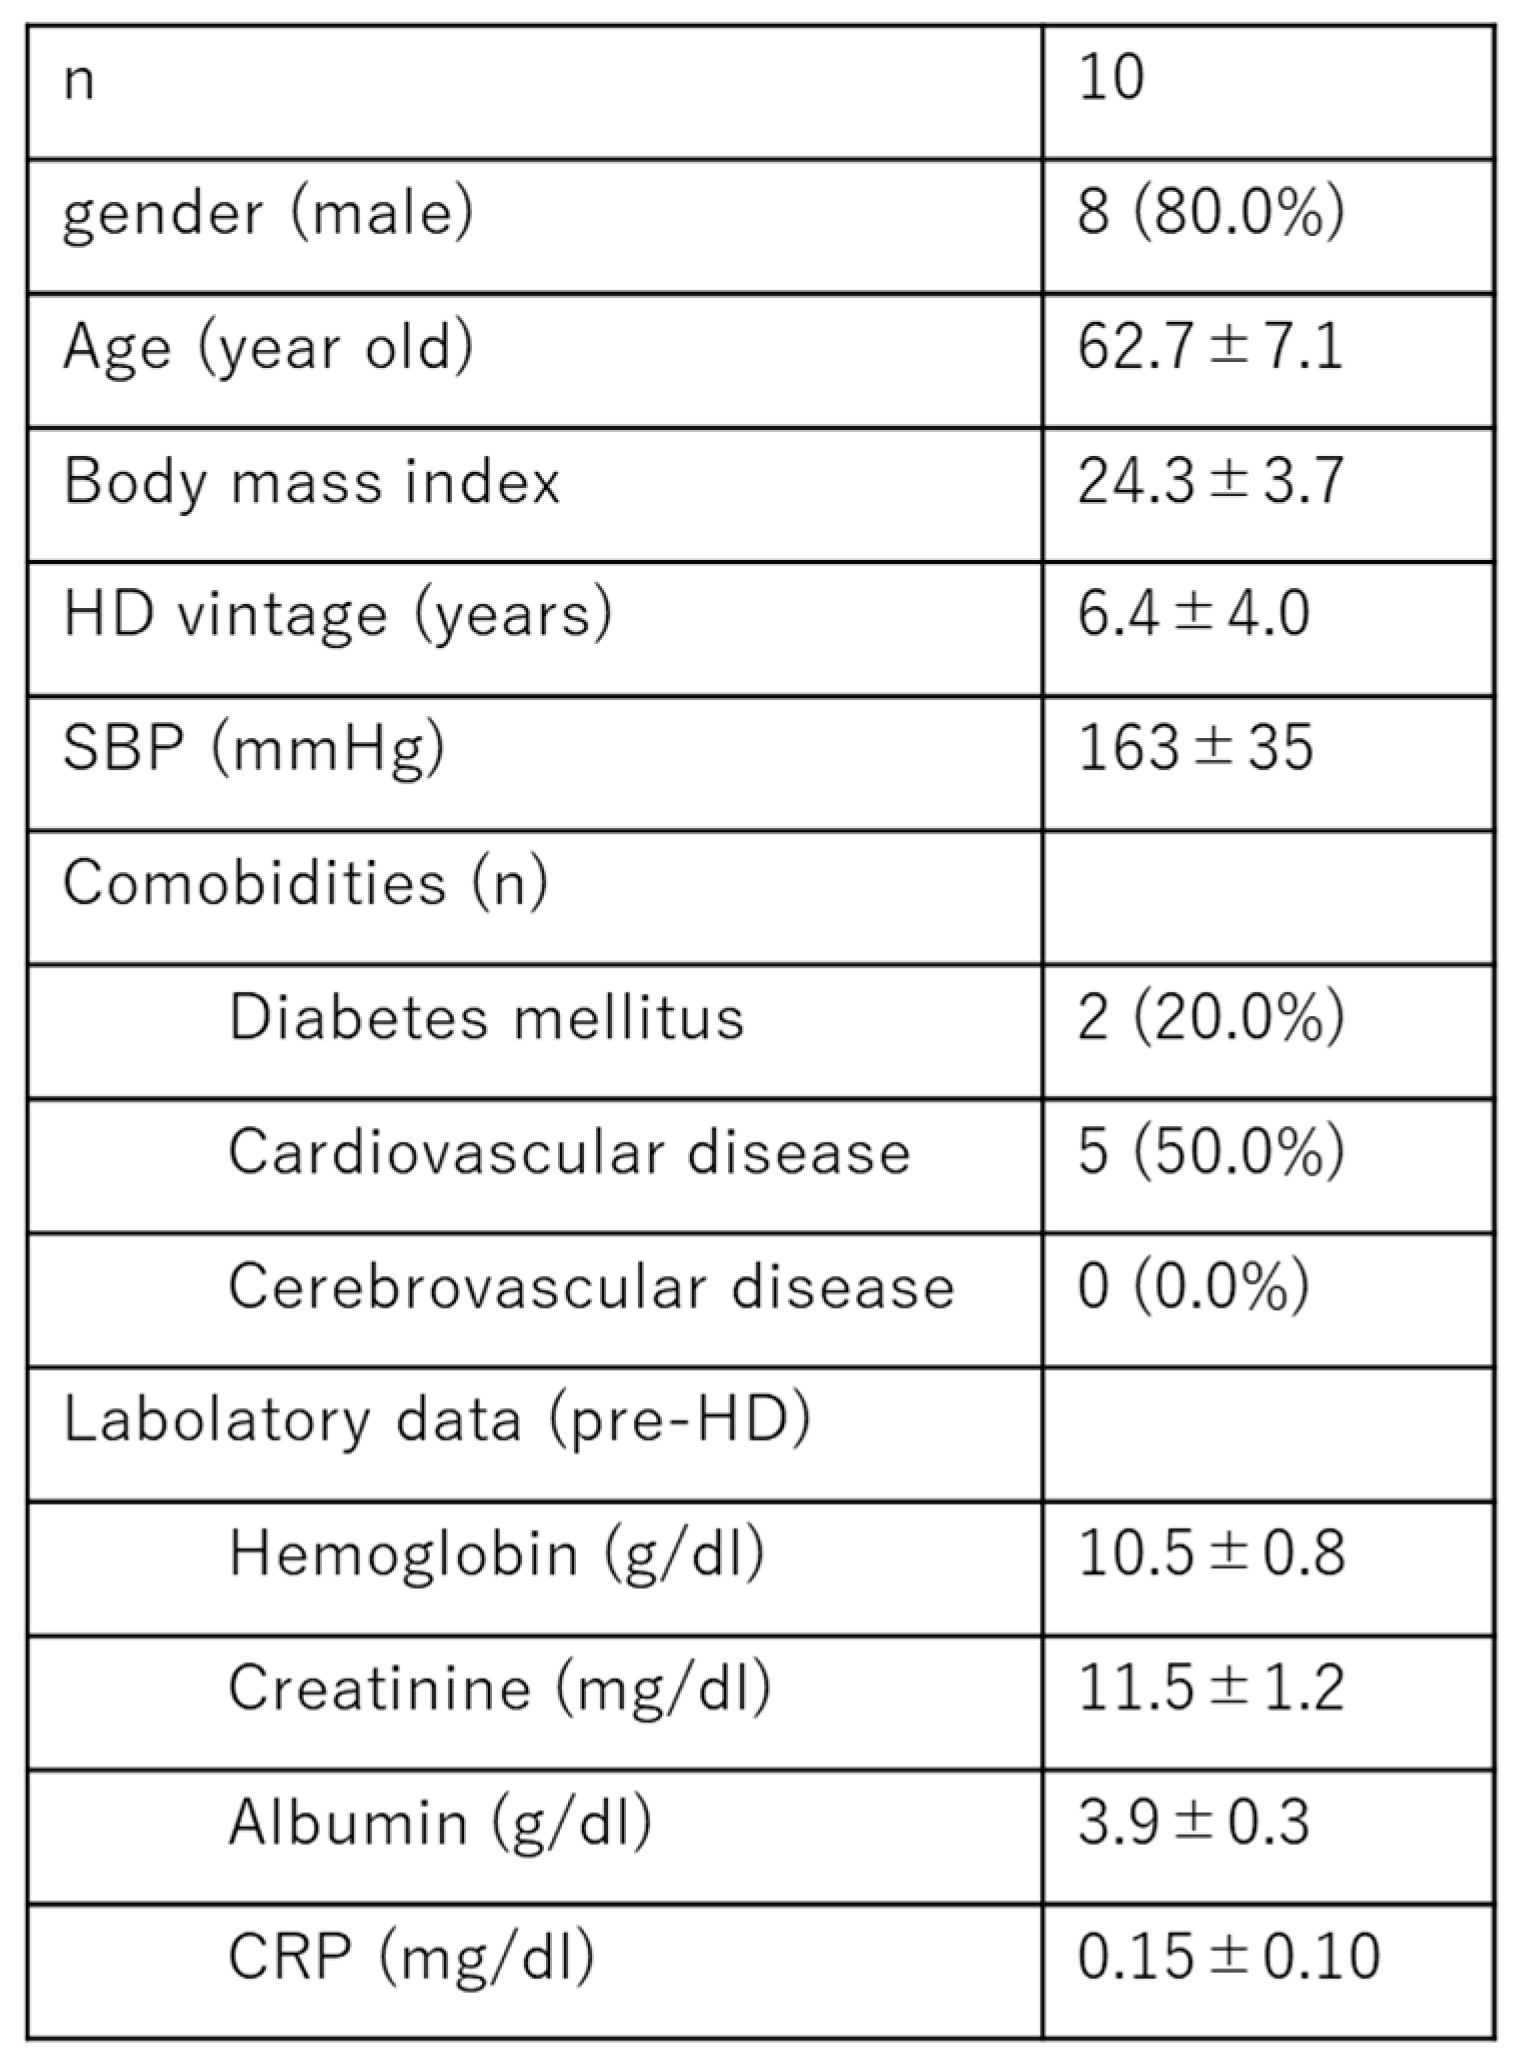
Ten patients among the 96 outpatients who met the prespecified eligibility criteria including pre-defined specific days when flow cytometric measurements were available at the institution, participated in the study. Eligibility criteria included a morning HD schedule, preserved activities of daily living, absence of active infection or cancer, and no use of immunosuppressive medication.
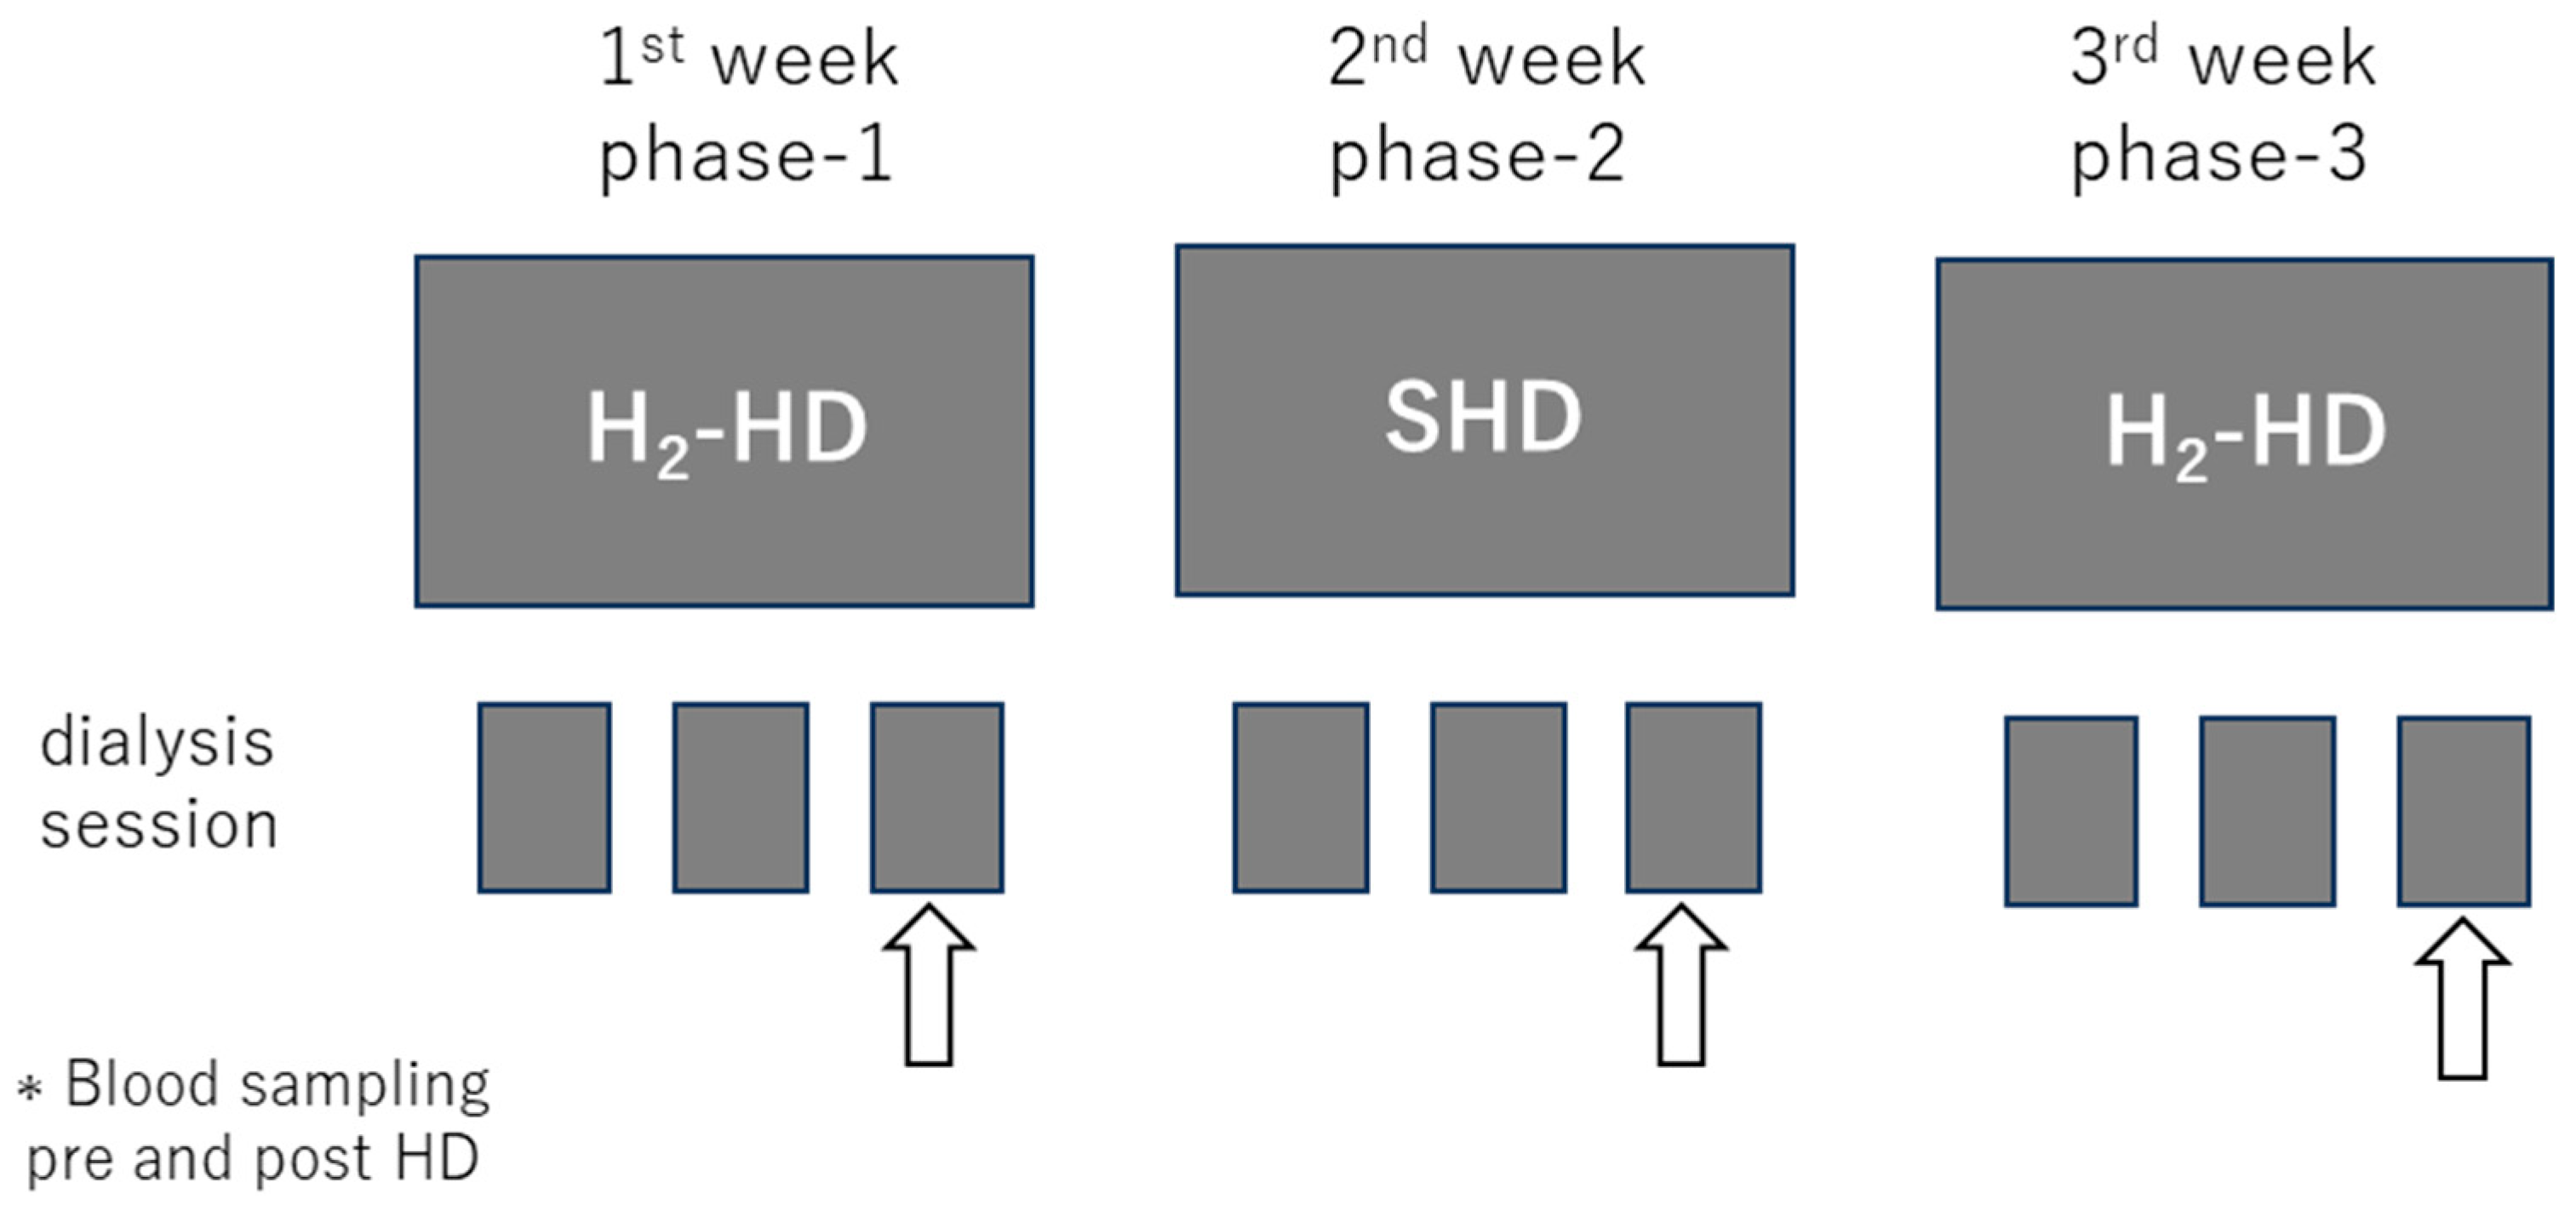
The study used a prospective within-subject repeated-measures design. During phase 1 (week 1), patients underwent H2-HD three times. During phase 2 (week 2), they underwent standard HD (SHD) three times. During phase 3 (week 3), they returned to H2-HD for three sessions. Blood was collected immediately before and after the third HD session in each phase. Because the treatment sequence was fixed rather than randomized, the comparison between H2-HD and SHD was considered exploratory and may be influenced by period or carryover effects.
The study protocol was approved by the Ethics Review Committee of St Luke’s International Hospital on August 28, 2023 (research number 23-RCK094). All procedures were conducted in accordance with relevant guidelines and regulations.

Table 1.
Patient demographics.
2.2. Blood Sampling
Blood samples (10 mL) were obtained immediately before and after the designated HD session in each phase. Patients were not required to fast before blood sampling. Blood was collected into EDTA-containing tubes. Five milliliters were used for neutrophil isolation and flow cytometric analysis. The remaining blood was immediately centrifuged, and plasma was stored at −80°C until analysis.
Figure 1.
Study design and timing of blood sampling During week 1 (phase 1), patients underwent HD using H2-enriched dialysate (H2-HD); during week 2 (phase 2), they underwent standard HD (SHD); and during week 3 (phase 3), they returned to H2-HD. HD was performed three times weekly during each phase. Blood samples were collected immediately before and after the third dialysis session in each phase. H2-HD, hemodialysis using H2-enriched dialysate; SHD, standard hemodialysis.
Figure 1.
Study design and timing of blood sampling During week 1 (phase 1), patients underwent HD using H2-enriched dialysate (H2-HD); during week 2 (phase 2), they underwent standard HD (SHD); and during week 3 (phase 3), they returned to H2-HD. HD was performed three times weekly during each phase. Blood samples were collected immediately before and after the third dialysis session in each phase. H2-HD, hemodialysis using H2-enriched dialysate; SHD, standard hemodialysis.
2.3. Isolation of Polymorphonuclear Leukocytes and Flow Cytometric Assessment
NET-associated signals were assessed with reference to the flow cytometric approach described by Masuda et al. [16]. Briefly, 5.0 mL of Polymorphprep™ (Serumwerk Bernburg AG, Bernburg, Germany) was placed in a 15-mL conical tube, and 5.0 mL of EDTA-treated whole blood was carefully layered on top. Samples were centrifuged at 500 × g for 35 min at room temperature, and the polymorphonuclear leukocyte (PMN) layer was collected.
An equal volume of PBS was added to the PMN suspension, followed by an additional equal volume of PBS, and the suspension was centrifuged at 400 × g for 10 min at room temperature. This washing procedure was performed twice. PMNs were resuspended in 2-5 mL of PBS. Cell numbers were assessed by trypan blue exclusion. The remaining cells were centrifuged at 400 × g for 10 min and resuspended in 3% BSA-PBS at 1 × 10⁶ cells/100 μL, followed by incubation for 30 min.
For staining, 100 μL of the cell suspension was dispensed into two tubes. One tube received mouse anti-human MPO antibody (Bio-Rad Laboratories, Hercules, CA, USA), and the other received purified mouse IgG2b, κ isotype control antibody (BioLegend, San Diego, CA, USA). Samples were incubated at room temperature for 30 min, washed, and incubated with PE goat anti-mouse IgG secondary antibody (BioLegend) for 30 min in the dark. After washing, cells were incubated with SYTOX Green Dead Cell Stain for flow cytometry (Invitrogen, Thermo Fisher Scientific) for 15 min in the dark and analyzed by flow cytometry.
Two populations were evaluated: the granulocyte/neutrophil region and a predefined extracellular or reticular fraction that was distinguishable from intact neutrophils and small debris. The latter region was selected in a preliminary assessment (n=3) as the candidate population containing extracellular chromatin structures. The NET-associated signal (%NET) was defined as the proportion of SYTOX Green/MPO double-positive events within this predefined extracellular fraction after subtraction of the corresponding double-positive signal obtained with the isotype-control staining. Because the assay does not provide direct microscopic visualization of NET structures, %NET is referred to throughout this manuscript as a NET-associated flow cytometric signal rather than definitive morphological proof of NET formation.
Figure 2.
Flow cytometric profiles of isolated polymorphonuclear leukocytes from patients receiving hemodialysis In a preliminary assessment (n=3), the target population for flow cytometric evaluation was defined. The circle and square indicate the granulocyte/neutrophil region and the predefined extracellular/reticular fraction, respectively. No clear double-positive signal was observed in the intact granulocyte region, whereas SYTOX Green/MPO double-positive events were detected in the extracellular fraction. This fraction was selected as the candidate population containing extracellular chromatin-associated material for subsequent analysis.
Figure 2.
Flow cytometric profiles of isolated polymorphonuclear leukocytes from patients receiving hemodialysis In a preliminary assessment (n=3), the target population for flow cytometric evaluation was defined. The circle and square indicate the granulocyte/neutrophil region and the predefined extracellular/reticular fraction, respectively. No clear double-positive signal was observed in the intact granulocyte region, whereas SYTOX Green/MPO double-positive events were detected in the extracellular fraction. This fraction was selected as the candidate population containing extracellular chromatin-associated material for subsequent analysis.
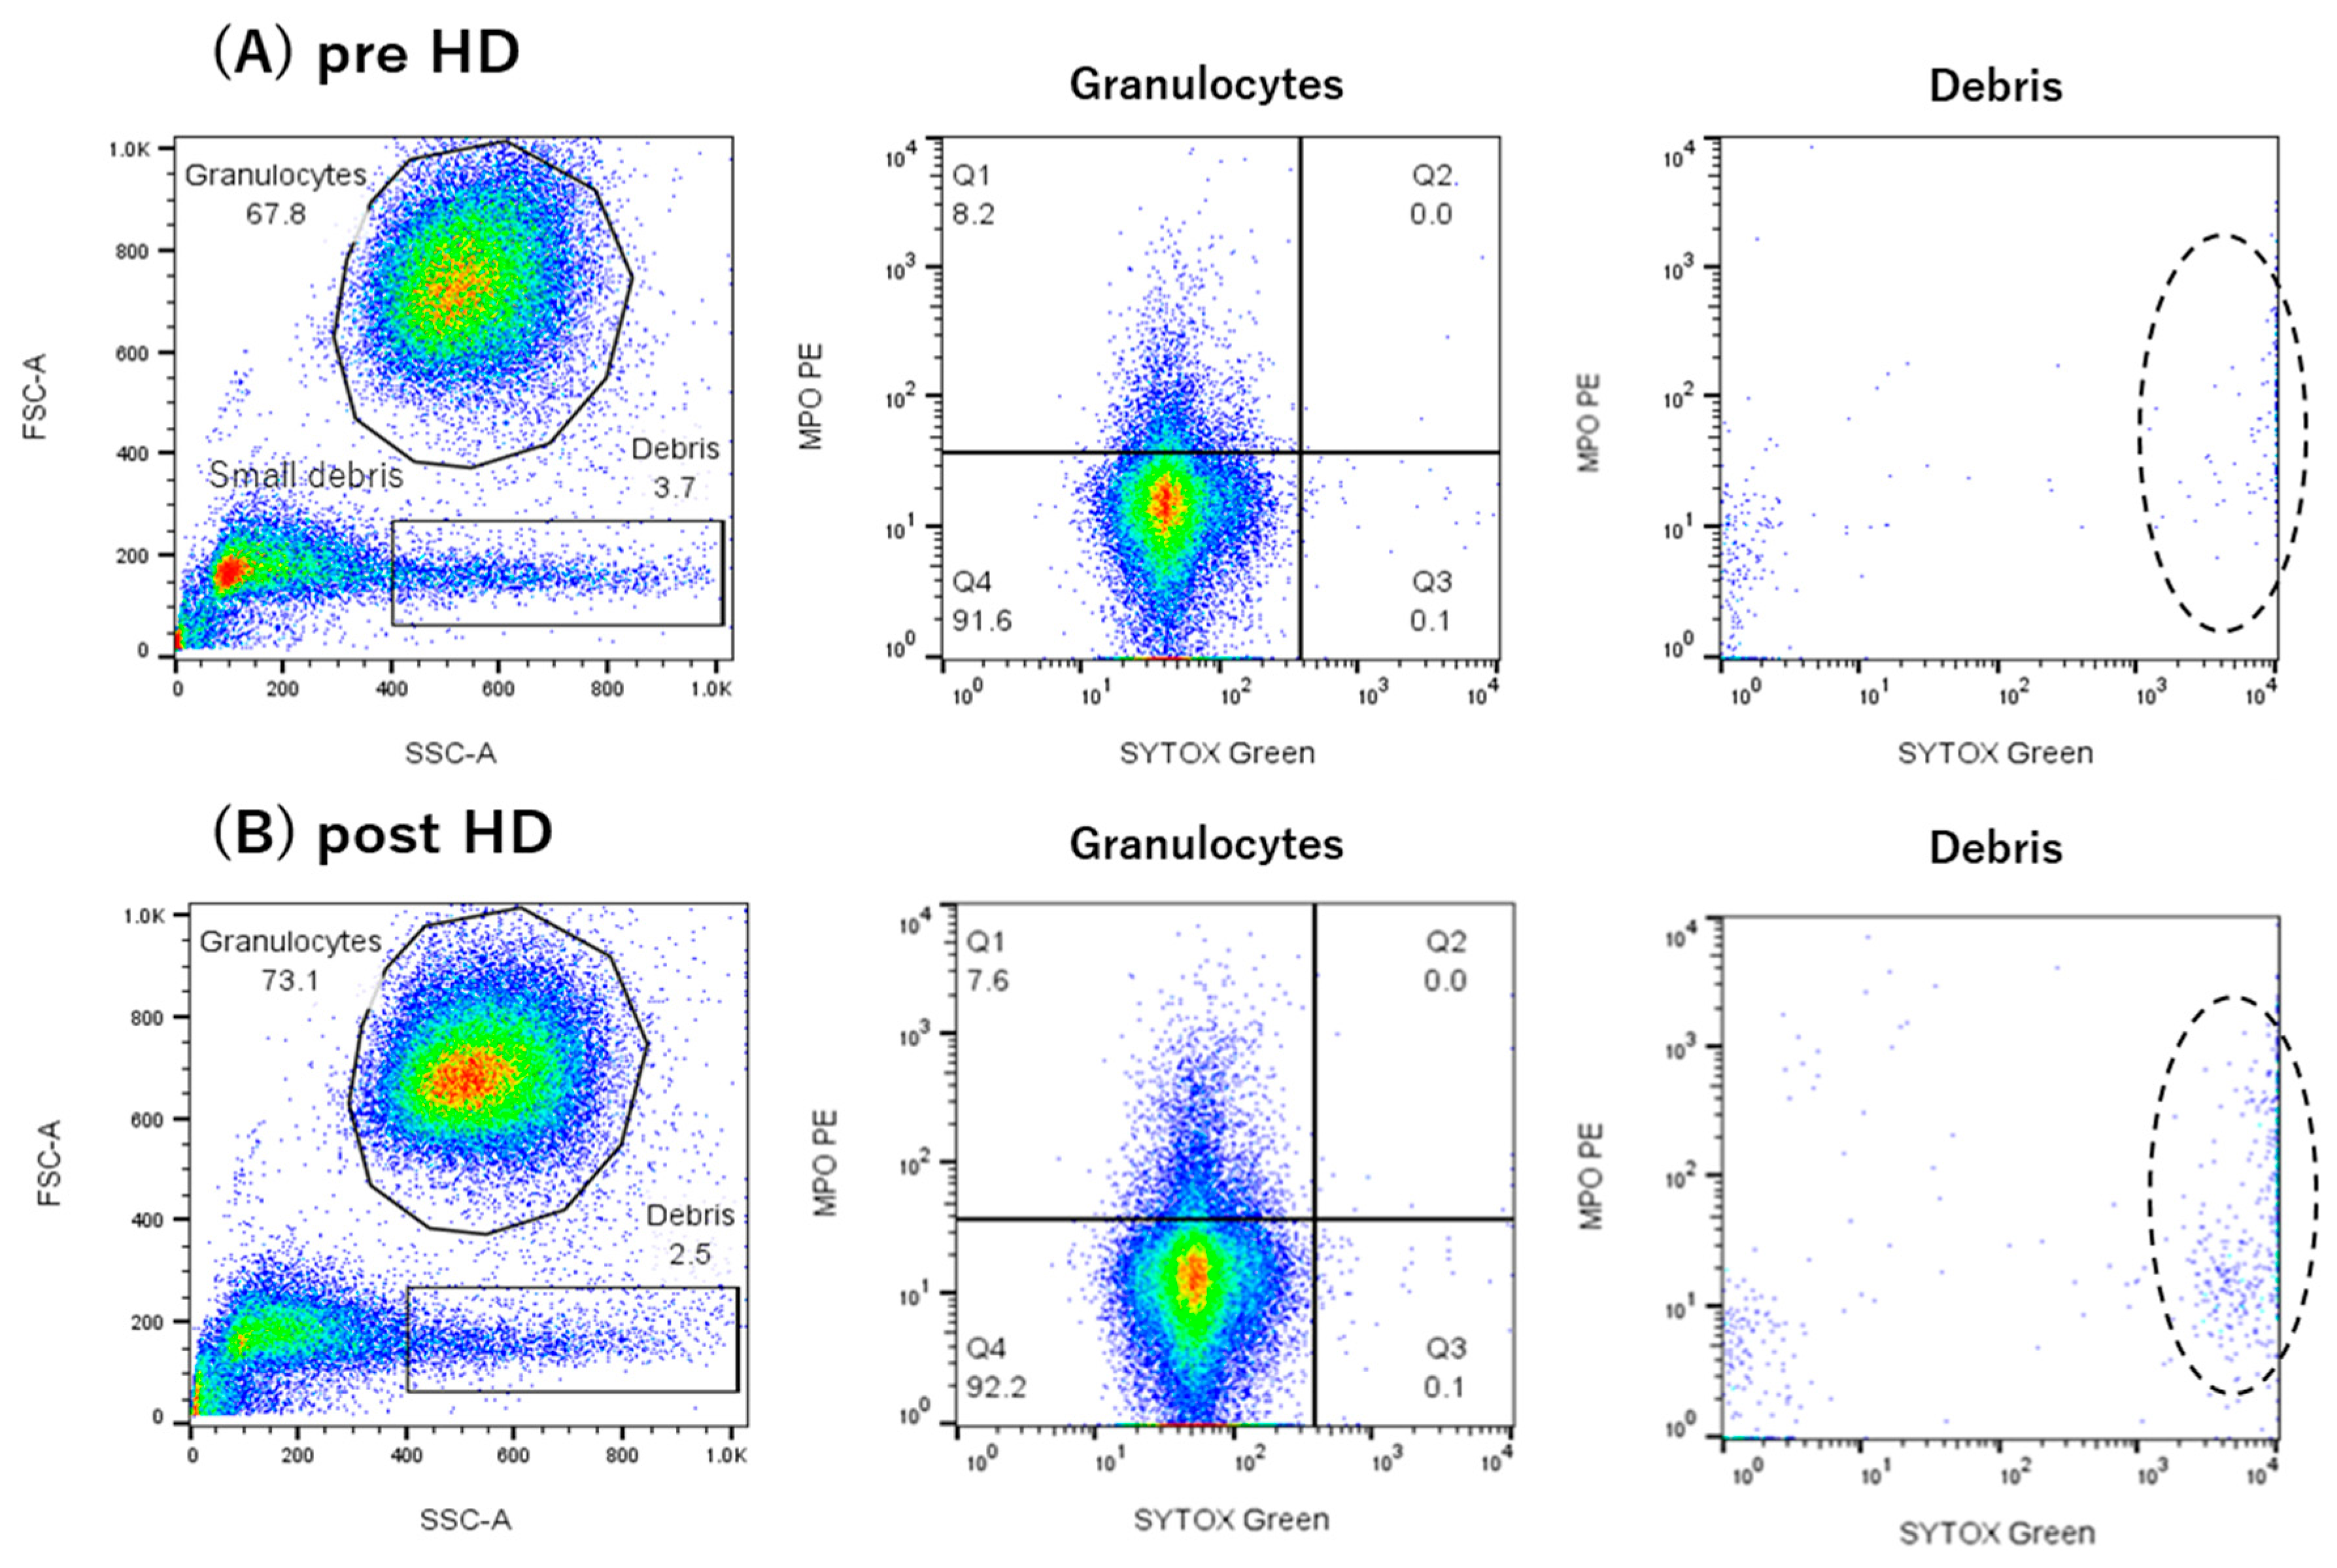
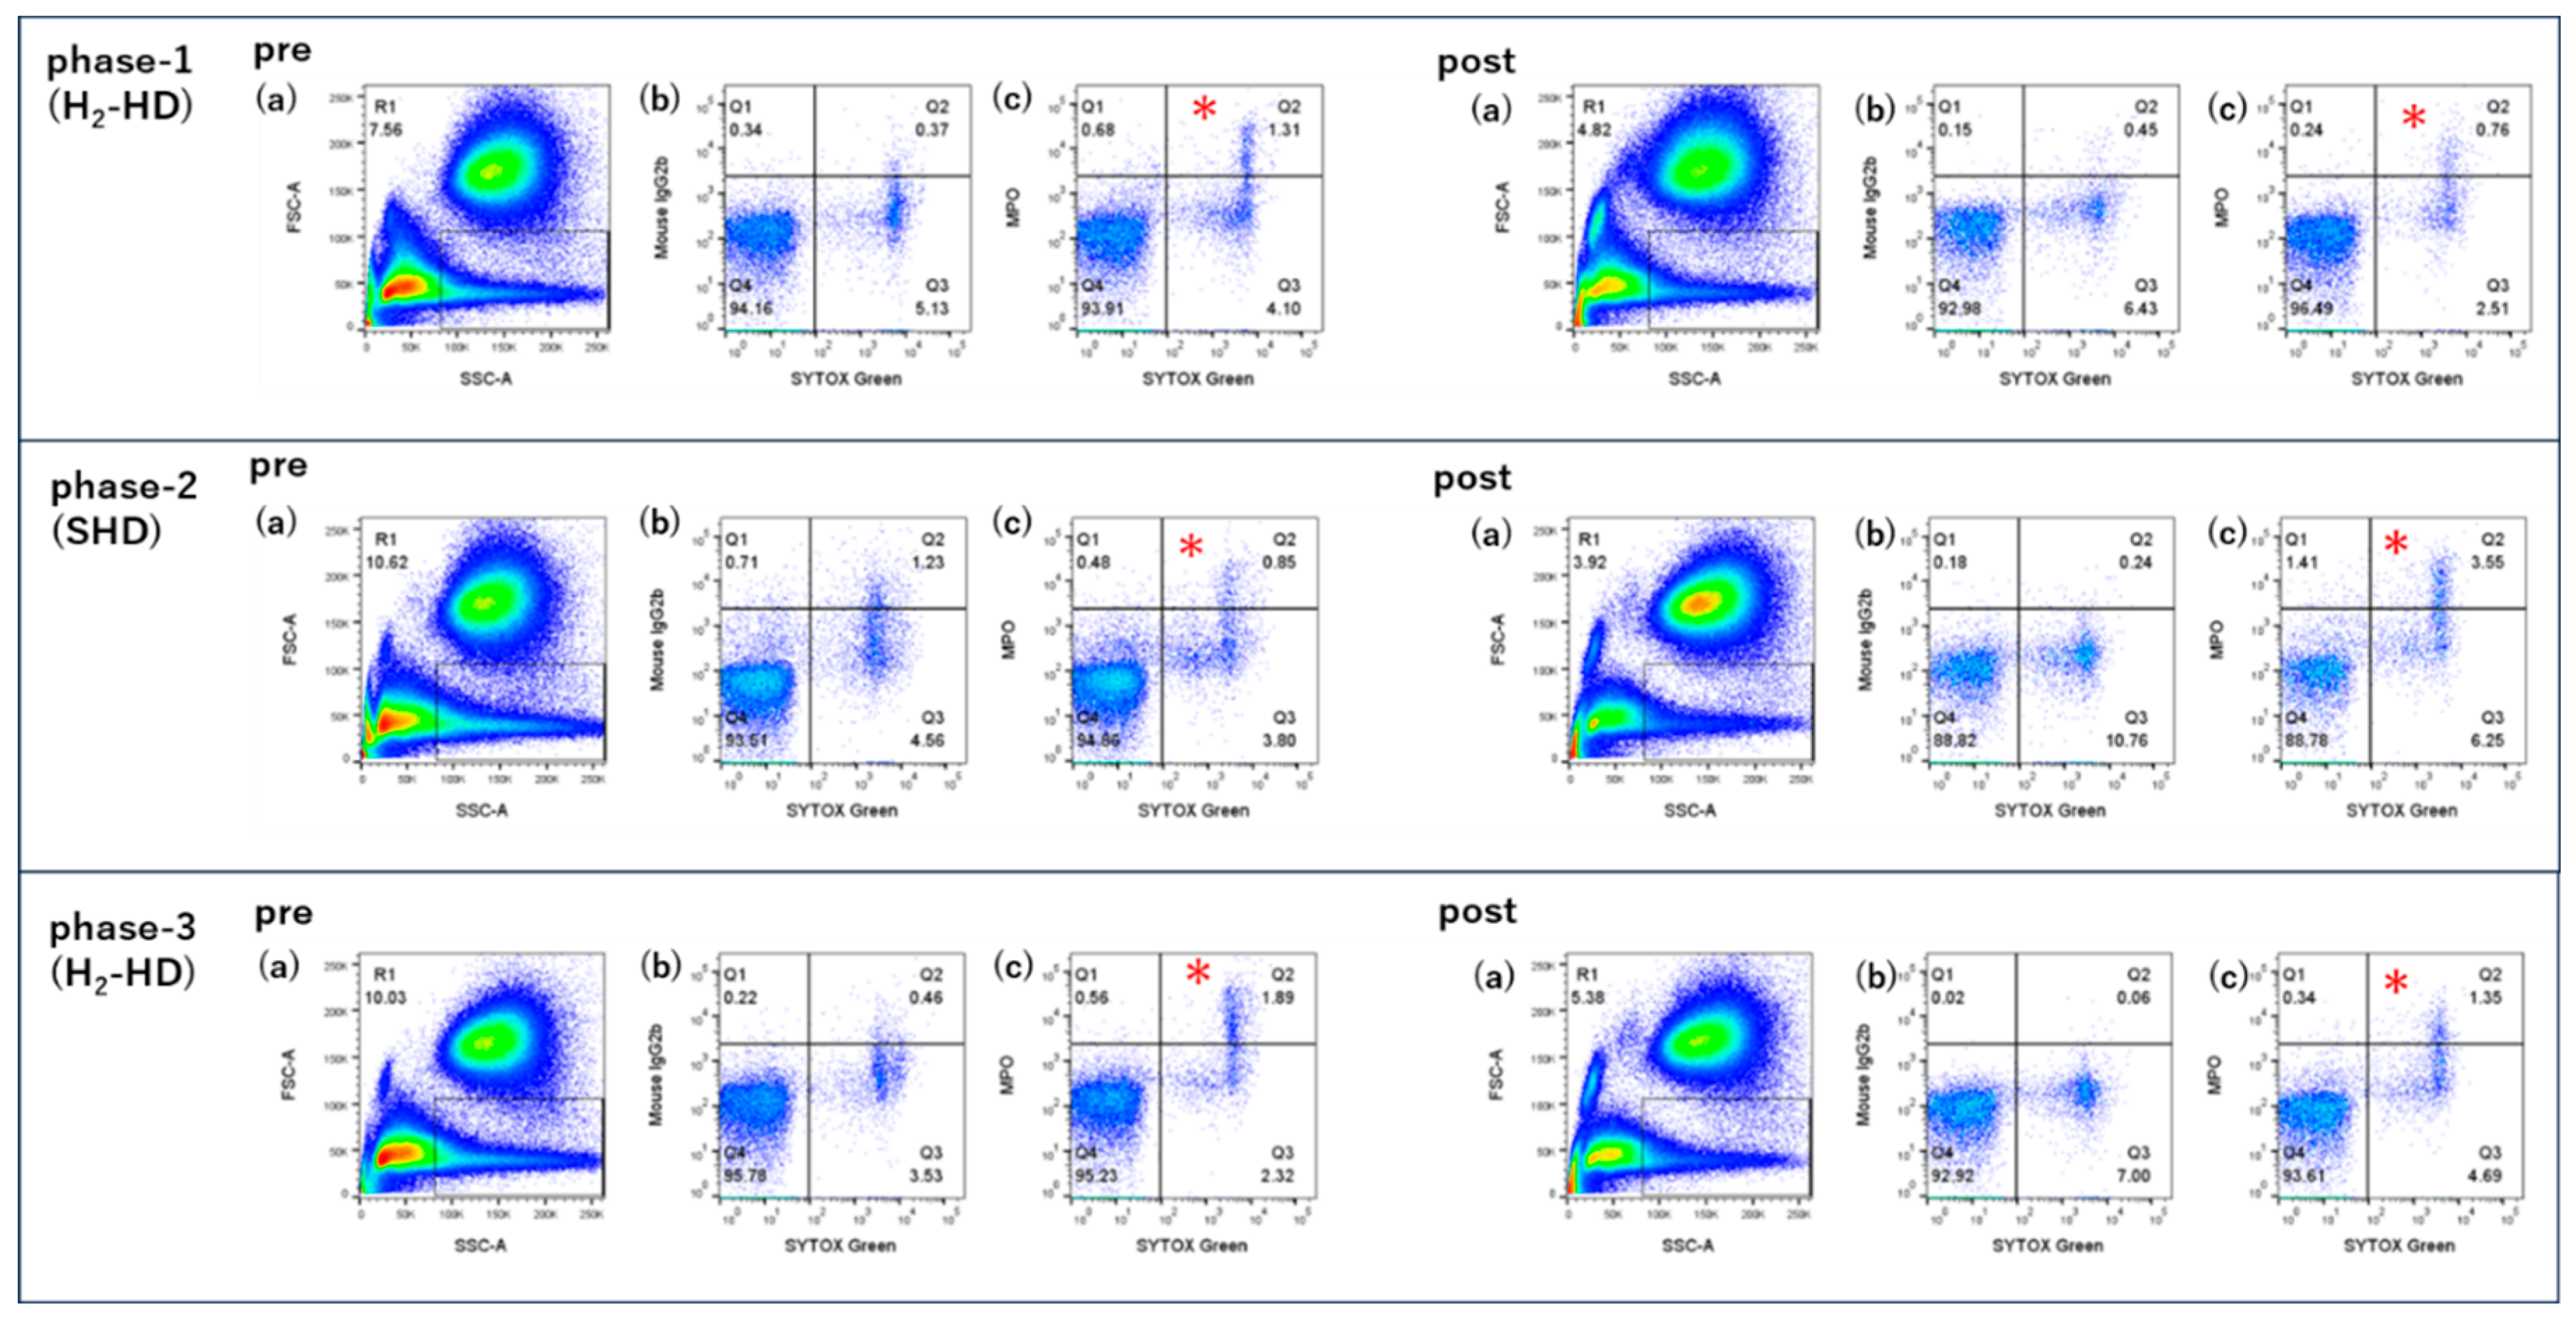
Figure 3.
Representative flow cytometric analysis of SYTOX Green and MPO staining The predefined extracellular fraction was used for analysis. Panel (b) shows the isotype-control/MPO-control condition with SYTOX Green, whereas panel (c) shows anti-MPO and SYTOX Green staining. The NET-associated signal was defined as the SYTOX Green/MPO double-positive signal after subtraction of the corresponding double-positive signal in the isotype-control condition. Note: phase 1 (week 1), patients underwent H2-HD three times, phase 2 (week 2), patients underwent standard HD three times, phase 3 (week 3), patients returned to H2-HD for three sessions.
Figure 3.
Representative flow cytometric analysis of SYTOX Green and MPO staining The predefined extracellular fraction was used for analysis. Panel (b) shows the isotype-control/MPO-control condition with SYTOX Green, whereas panel (c) shows anti-MPO and SYTOX Green staining. The NET-associated signal was defined as the SYTOX Green/MPO double-positive signal after subtraction of the corresponding double-positive signal in the isotype-control condition. Note: phase 1 (week 1), patients underwent H2-HD three times, phase 2 (week 2), patients underwent standard HD three times, phase 3 (week 3), patients returned to H2-HD for three sessions.
2.4. Circulating NET-Associated Markers
Plasma cfDNA was measured using SYBR Gold Nucleic Acid Gel Stain according to previously described methods [11,17]. SYBR Gold was diluted 1:1,000 in dimethyl sulfoxide and subsequently 1:8 in PBS. Twenty microliters of DNA standard or test sample were added to black 96-well plates, followed by 40 μL of the prepared SYBR Gold solution. Fluorescence was measured using a 96-well fluorometer at an excitation wavelength of 485 nm and an emission wavelength of 535 nm.
Plasma MPO-DNA complexes were measured by ELISA according to a previously described method [11]. A 96-well microtiter plate was coated overnight at 4°C with mouse monoclonal anti-MPO antibody (clone 4A4; Bio-Rad Laboratories), followed by blocking with 1% bovine serum albumin in PBS. Plasma samples were added and incubated overnight at 4°C. MPO-DNA complexes were detected with horseradish peroxidase (HRP)-conjugated anti-dsDNA antibody, followed by development with 3,3′,5,5′-Tetramethylbenzidine (TMB). Absorbance was measured at 450 nm. Isolated NETs were used to generate the standard curve, with 1 U/mL corresponding to NETs released from 10,000 neutrophils.
Table 2.
Changes in circulating NET-associated marker levels; cell-free DNA (a) and MPO-DNA (b) during hemodialysis in each phase.
Table 2.
Changes in circulating NET-associated marker levels; cell-free DNA (a) and MPO-DNA (b) during hemodialysis in each phase.
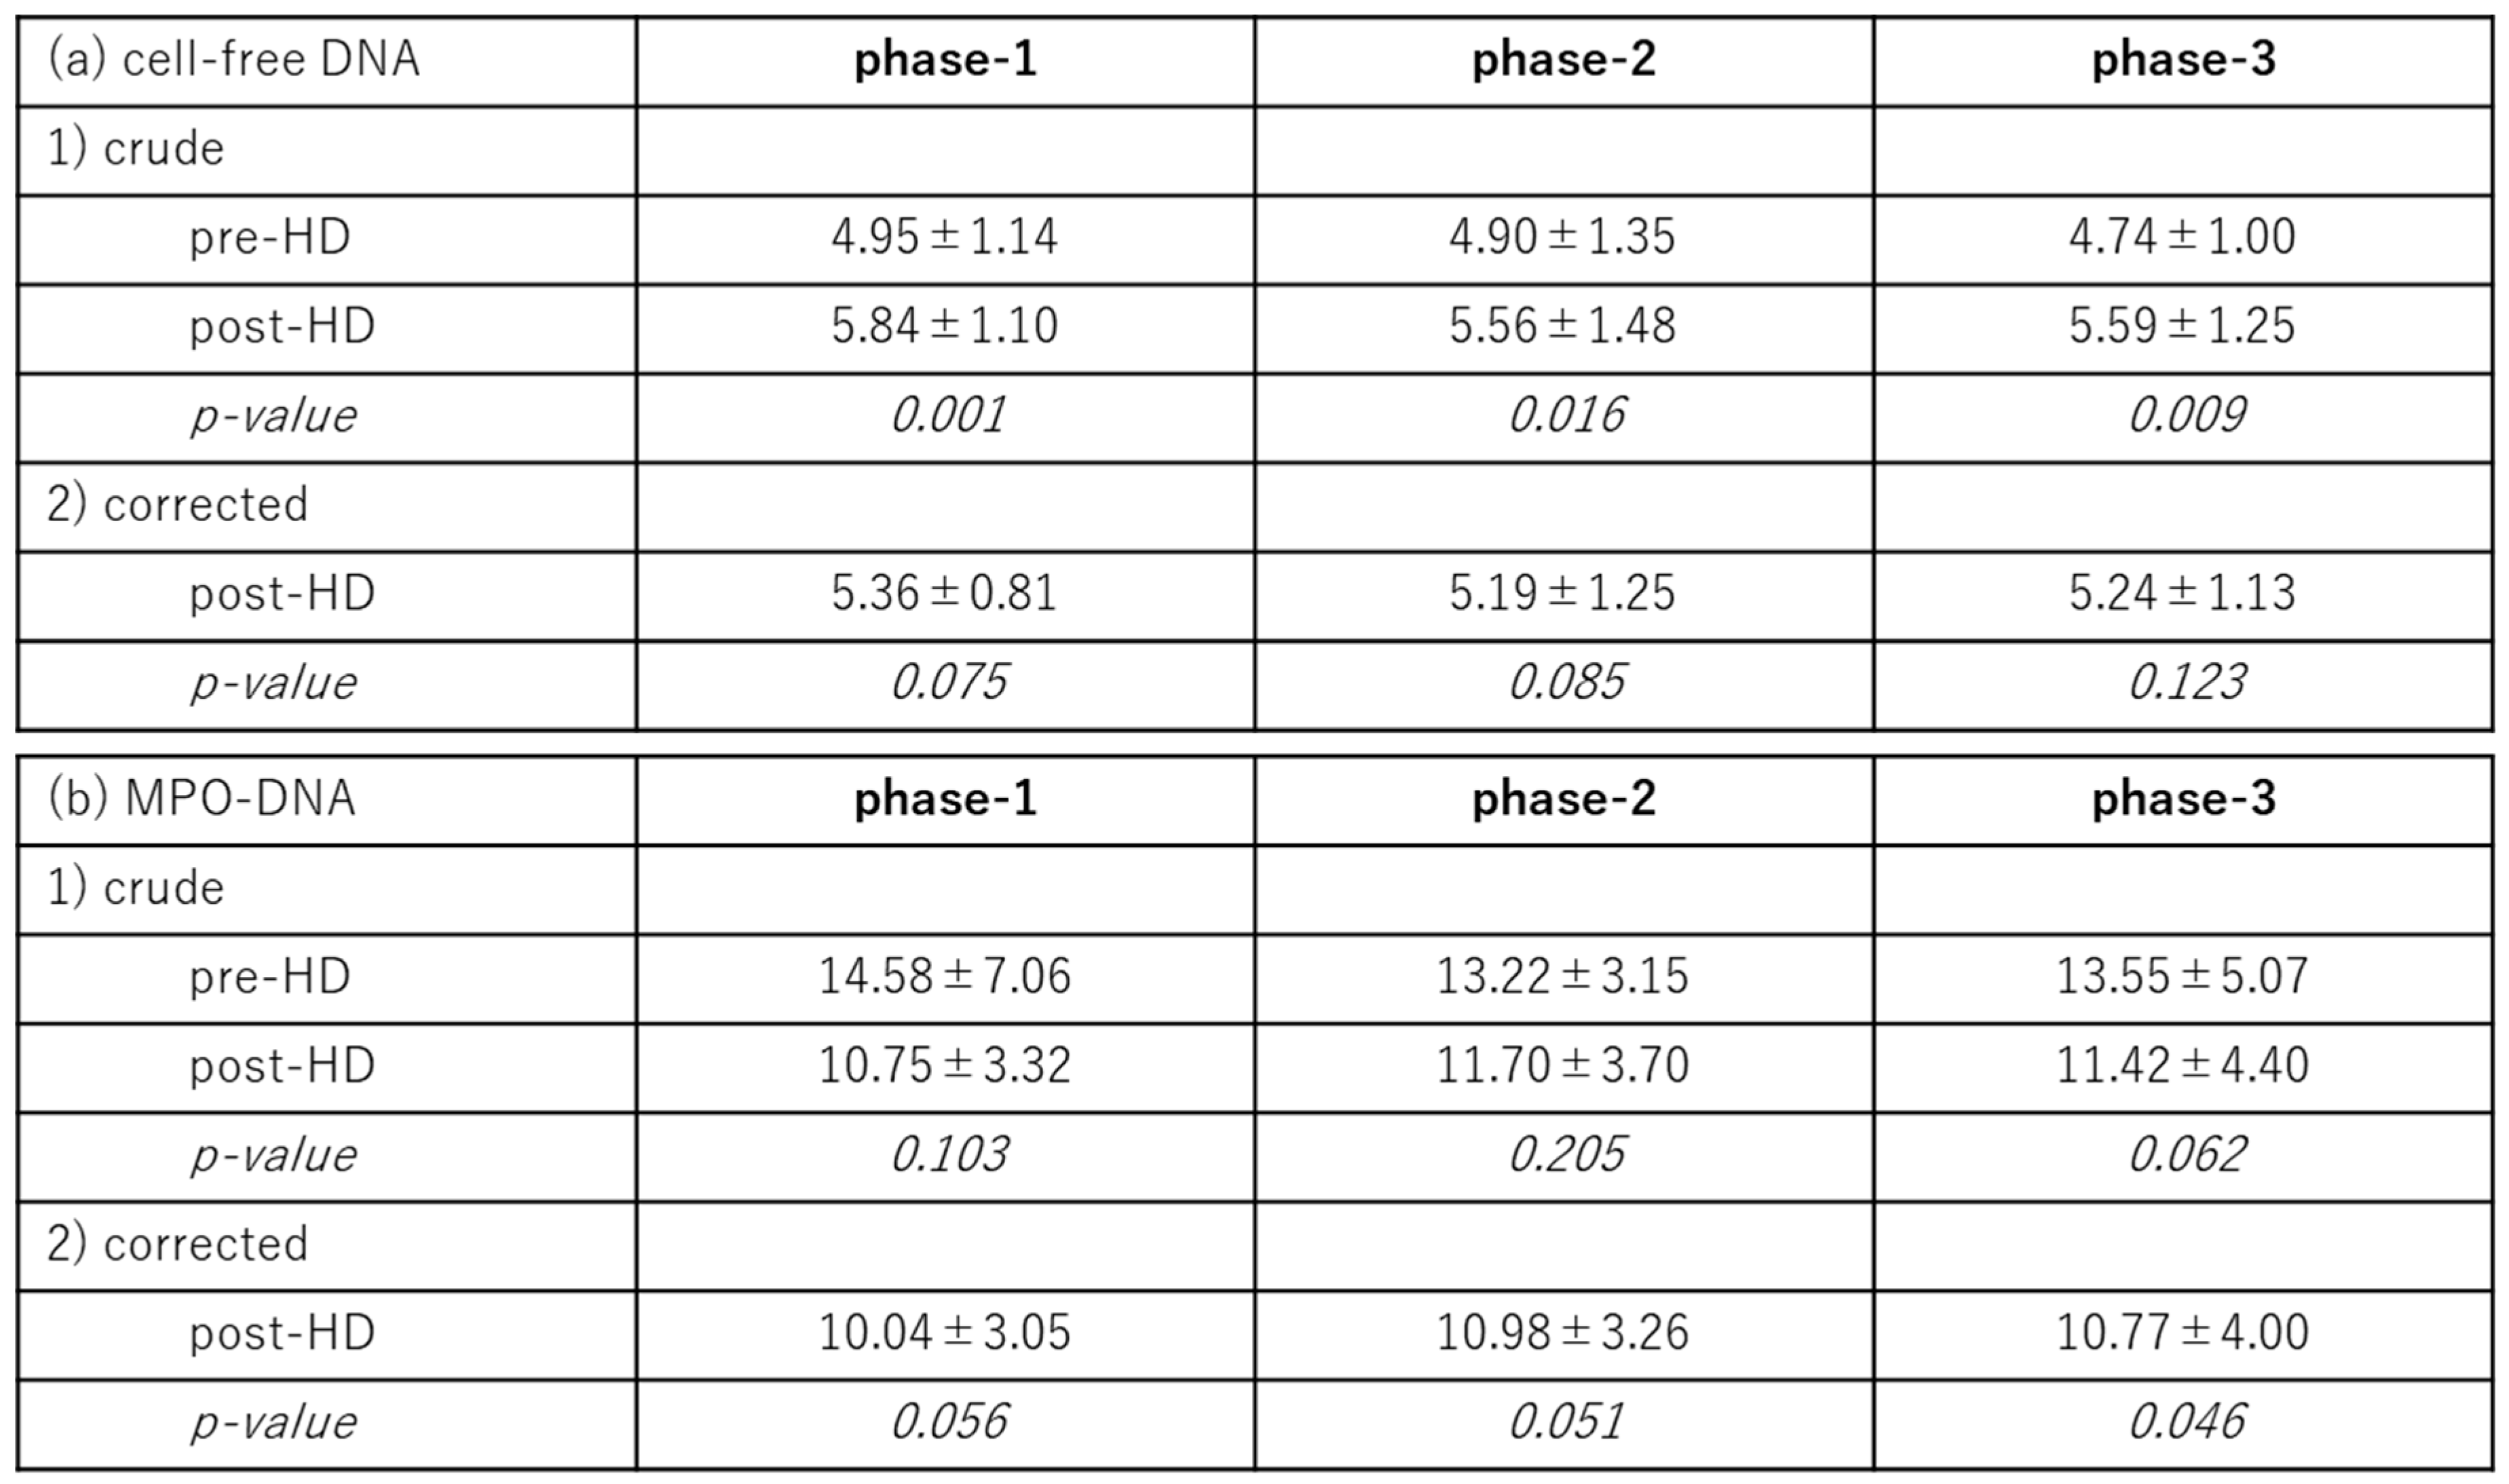
Data are presented as mean ± SD. Corrected post-HD values represent post-HD concentrations adjusted for hemoconcentration using plasma albumin. Note: phase 1 (week 1), patients underwent H2-HD three times, phase 2 (week 2), patients underwent standard HD three times, phase 3 (week 3), patients returned to H2-HD for three sessions.
2.5. Correction for Hemoconcentration
HD-associated changes in plasma concentrations were evaluated after correction for hemoconcentration using total plasma albumin (Alb) as an indicator of concentration change. The hemoconcentration correction corrected levels were calculated by the following formula; corrected post-HD level = uncorrected post-HD level x pre-HD Alb/post-HD Alb.
2.6. Measurement of Uremic Toxins
Indoxyl sulfate and hippuric acid were measured by LC-MS/MS as previously described [18]. Briefly, 75 μL of 0.1% formate in methanol containing internal standards was added to 25 μL of plasma. Samples were vortexed, sonicated for 5 min, and centrifuged at 16,400 × g for 20 min at 4°C. Supernatants were filtered through 0.2-μm membranes and analyzed by LC-MS/MS. Chromatographic separation was performed using a C18 analytical column with ammonium acetate and acetonitrile as mobile phases. Quantification was performed in selected-reaction-monitoring mode.
2.7. H2-Enriched Dialysis System
H2-enriched dialysis solution was prepared using an electrolyzed water-hemodialysis system (Trim Medical Institute Co., Osaka, Japan). Tap water underwent activated charcoal filtration and water softening and was then electrolyzed by direct current. Water from the cathode side was collected and supplied to the reverse-osmosis system. Reverse-osmosis water containing molecular H2 was subsequently used to prepare the dialysis solution. The H2 concentration in the dialysate was maintained within approximately 70-130 ppb and measured using a DH Meter (DH-35A; DKK-TOA, Tokyo, Japan).
2.8. Statistical Analysis
Continuous variables are presented as mean ± standard deviation (SD), and categorical variables as counts and percentages. Within-phase pre- and post-HD comparisons were performed using the paired t test or Wilcoxon signed-rank test, as appropriate. Differences among the three phases were assessed using the Friedman test. When an overall difference was statistically significant, post hoc pairwise comparisons were performed using Wilcoxon signed-rank tests with Bonferroni adjustment. Changes in NET, MPO, cfDNA, and MPO-DNA levels across the three time points were assessed using the Friedman test because the measurements were repeatedly obtained from the same patients. A two-sided P value <0.05 was considered statistically significant. All tests were two-sided. Because of the exploratory nature and small sample size, effect estimates and individual-level changes should be considered alongside P values. Associations between changes in flow cytometric and circulating NET-associated parameters were evaluated using correlation analysis (Pearson correlation coefficient) were performed using EZR (Jichi Medical University Saitama Medical Center, Japan) [20].
3. Results
3.1. NET-Associated Flow Cytometric Signals in Isolated Neutrophil Preparations
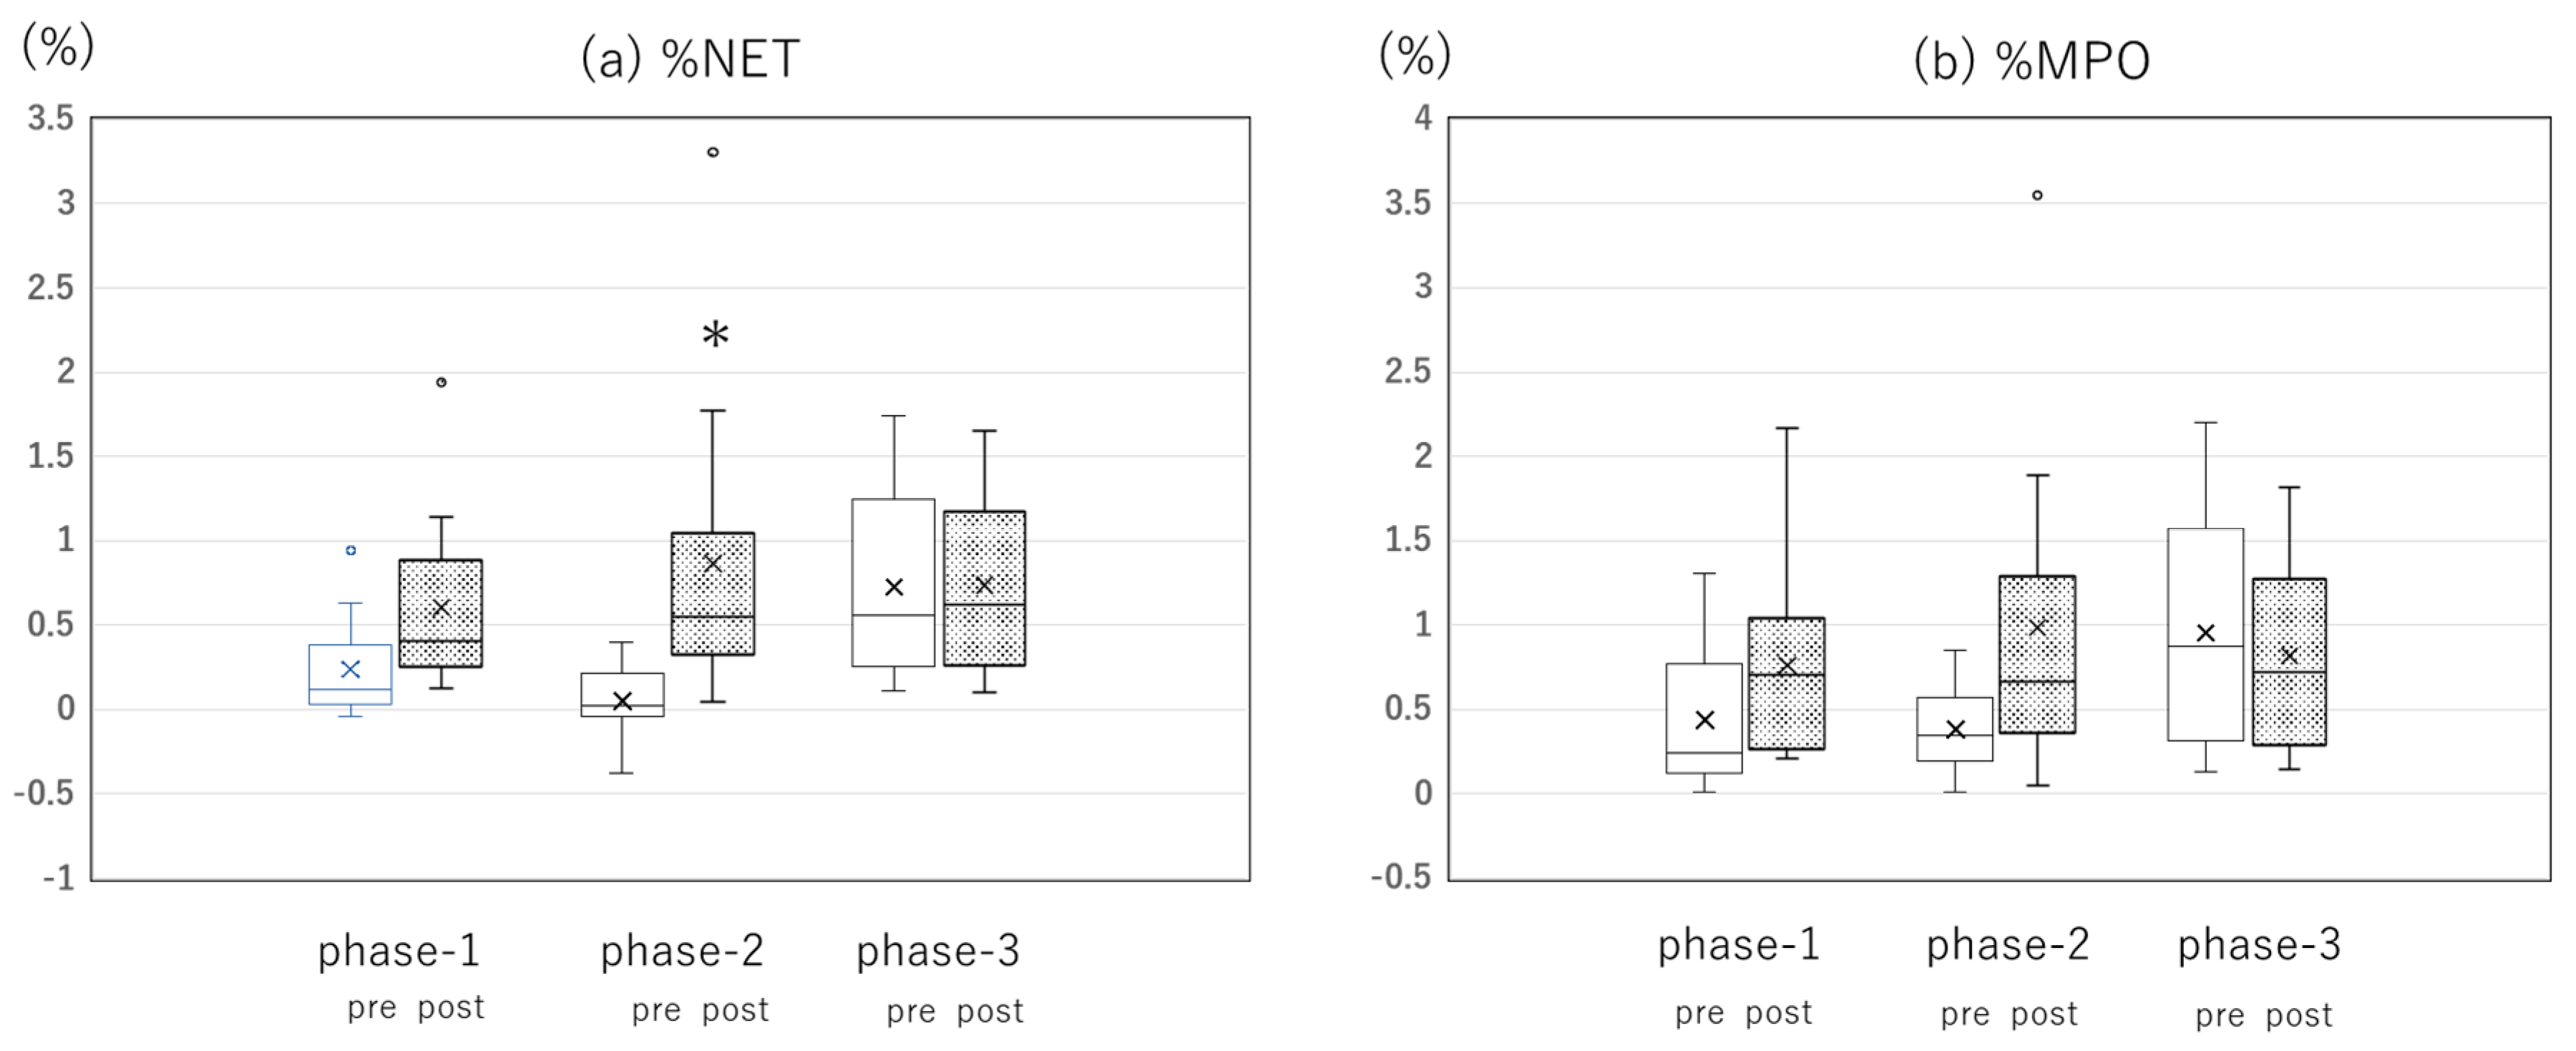
The NET-associated flow cytometric signal (%NET) increased significantly after dialysis in phase 2 (SHD), whereas no significant within-session changes were observed in phases 1 and 3 (H2-HD) (Figure 4a). The numbers of patients showing an increase in %NET after HD were 8 (80.0%) in phase 1, 10 (100.0%) in phase 2, and 4 (40.0%) in phase 3. The mean changes (post-HD minus pre-HD) were 0.37 ± 0.65 in phase 1, 0.82 ± 1.10 in phase 2, and 0.01 ± 0.54 in phase 3; the overall comparison was not statistically significant (Friedman χ²=2.60, P=0.273).
The MPO-positive fraction (%MPO) showed a borderline increase during phase 2, whereas no significant changes were observed during phases 1 or 3 (Figure 4b). The numbers of patients showing an increase in %MPO after HD were 8 (80.0%) in phase 1, 8 (80.0%) in phase 2, and 4 (40.0%) in phase 3. Mean changes were 0.32 ± 0.61, 0.60 ± 0.86, and −0.13 ± 0.65 in phases 1, 2, and 3, respectively; the overall comparison was not statistically significant (Friedman χ²=5.40, P=0.067).
Figure 4.
Changes in flow cytometric NET-associated (a) and MPO-positive (b) signals during hemodialysis - (a) %NET denotes the proportion of SYTOX Green/MPO double-positive events in the predefined extracellular fraction after subtraction of the corresponding isotype-control signal. Values were 0.23 ± 0.31% versus 0.60 ± 0.56% in phase 1 (P=0.104), 0.05 ± 0.21% versus 0.86 ± 0.97% in phase 2 (P=0.044), and 0.72 ± 0.55% versus 0.74 ± 0.52% in phase 3 (P=0.945), before versus after HD, respectively. (b) %MPO denotes the MPO-positive fraction. Values were 0.43 ± 0.43% versus 0.76 ± 0.61% in phase 1 (P=0.130), 0.38 ± 0.26% versus 0.98 ± 1.03% in phase 2 (P=0.055), and 0.95 ± 0.71% versus 0.82 ± 0.56% in phase 3 (P=0.534), before versus after HD, respectively. Note: 1. (week 1), patients underwent H2-HD three times, phase 2 (week 2), patients underwent standard HD three times, phase 3 (week 3), patients returned to H2-HD for three sessions.
Figure 4.
Changes in flow cytometric NET-associated (a) and MPO-positive (b) signals during hemodialysis - (a) %NET denotes the proportion of SYTOX Green/MPO double-positive events in the predefined extracellular fraction after subtraction of the corresponding isotype-control signal. Values were 0.23 ± 0.31% versus 0.60 ± 0.56% in phase 1 (P=0.104), 0.05 ± 0.21% versus 0.86 ± 0.97% in phase 2 (P=0.044), and 0.72 ± 0.55% versus 0.74 ± 0.52% in phase 3 (P=0.945), before versus after HD, respectively. (b) %MPO denotes the MPO-positive fraction. Values were 0.43 ± 0.43% versus 0.76 ± 0.61% in phase 1 (P=0.130), 0.38 ± 0.26% versus 0.98 ± 1.03% in phase 2 (P=0.055), and 0.95 ± 0.71% versus 0.82 ± 0.56% in phase 3 (P=0.534), before versus after HD, respectively. Note: 1. (week 1), patients underwent H2-HD three times, phase 2 (week 2), patients underwent standard HD three times, phase 3 (week 3), patients returned to H2-HD for three sessions.
3.2. Circulating NET-Associated Markers (Table 3)
Uncorrected plasma cfDNA levels increased significantly after HD. However, the currently reported corrected values showed no significant within-session changes. Uncorrected MPO-DNA levels decreased after HD, and the currently reported corrected values also showed significant decreases.
There were no statistically significant differences among the three phases in the changes (post-HD minus pre-HD) of the circulating NET-associated parameters. There were no statistically significant differences across the three time points in cfDNA (Friedman χ²=0.22, P=0.895), or MPO-DNA (Friedman χ²=2.40, P=0.301) levels.
Table 3.
Changes in uremic toxin levels during hemodialysis.
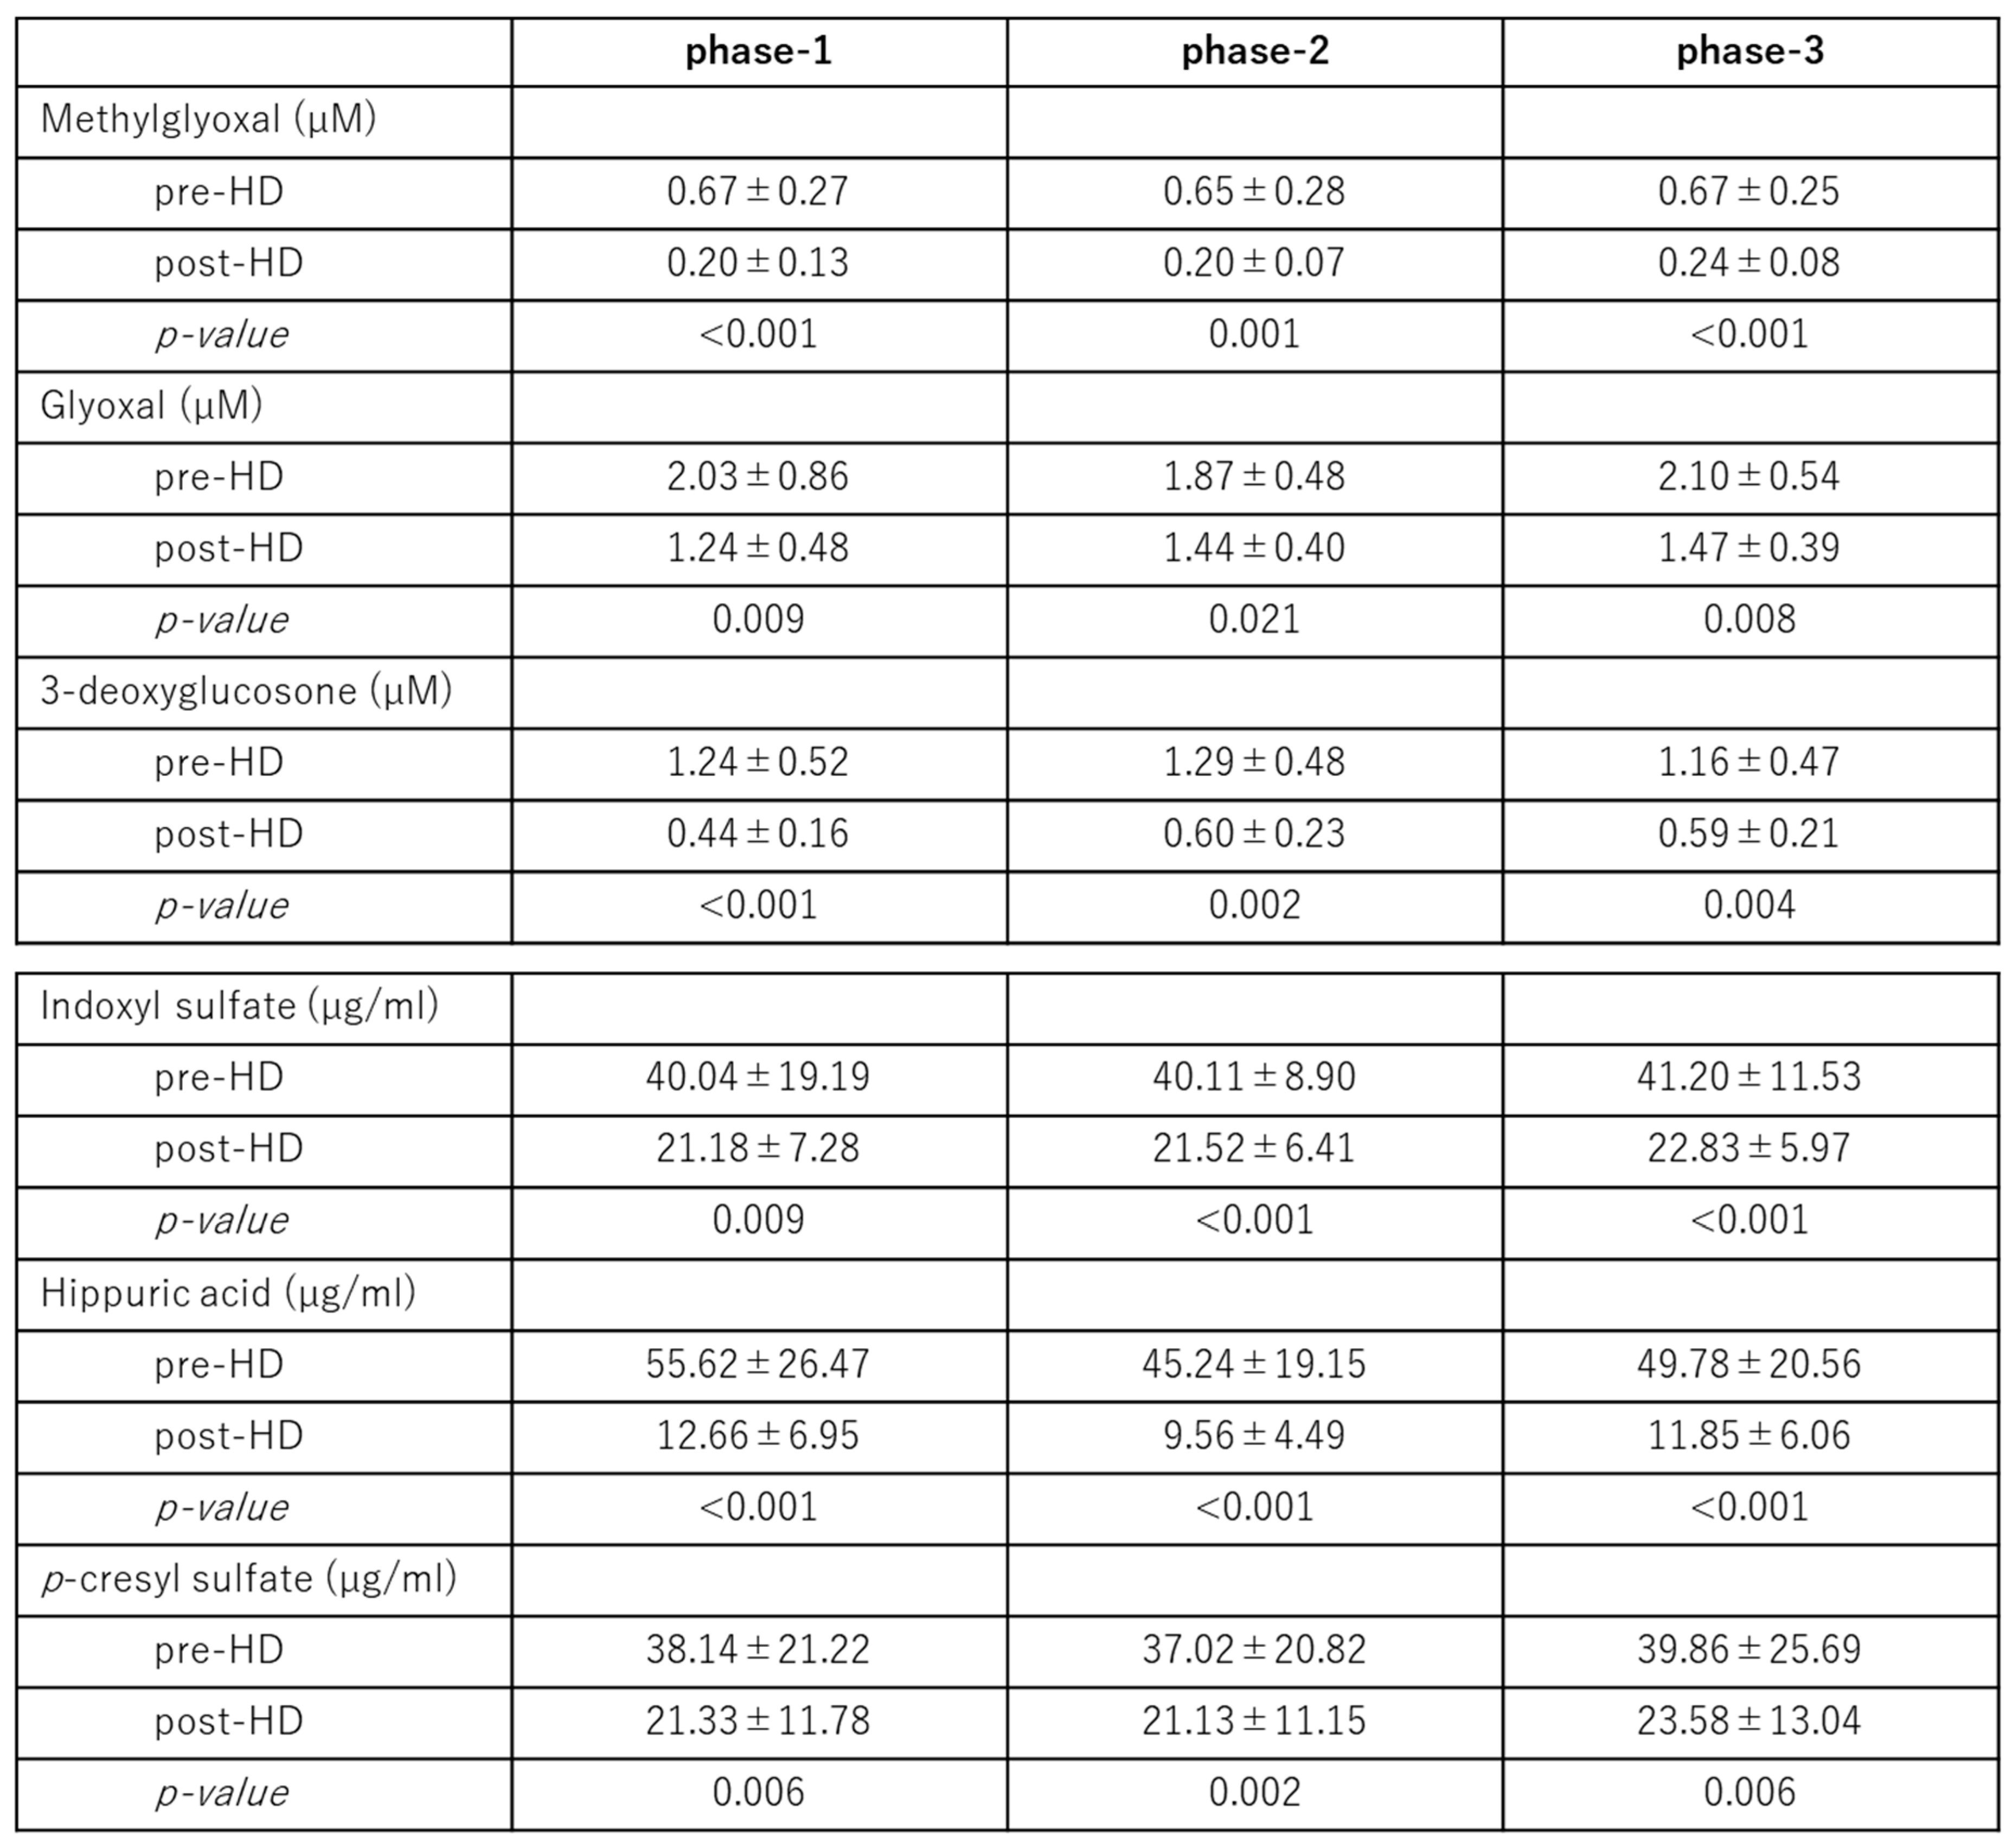
Data are presented as mean ± SD (n=10). Note: phase 1 (week 1), patients underwent H2-HD three times, phase 2 (week 2), patients underwent standard HD three times, phase 3 (week 3), patients returned to H2-HD for three sessions.
3.3. Associations Between Flow Cytometric and Circulating Markers
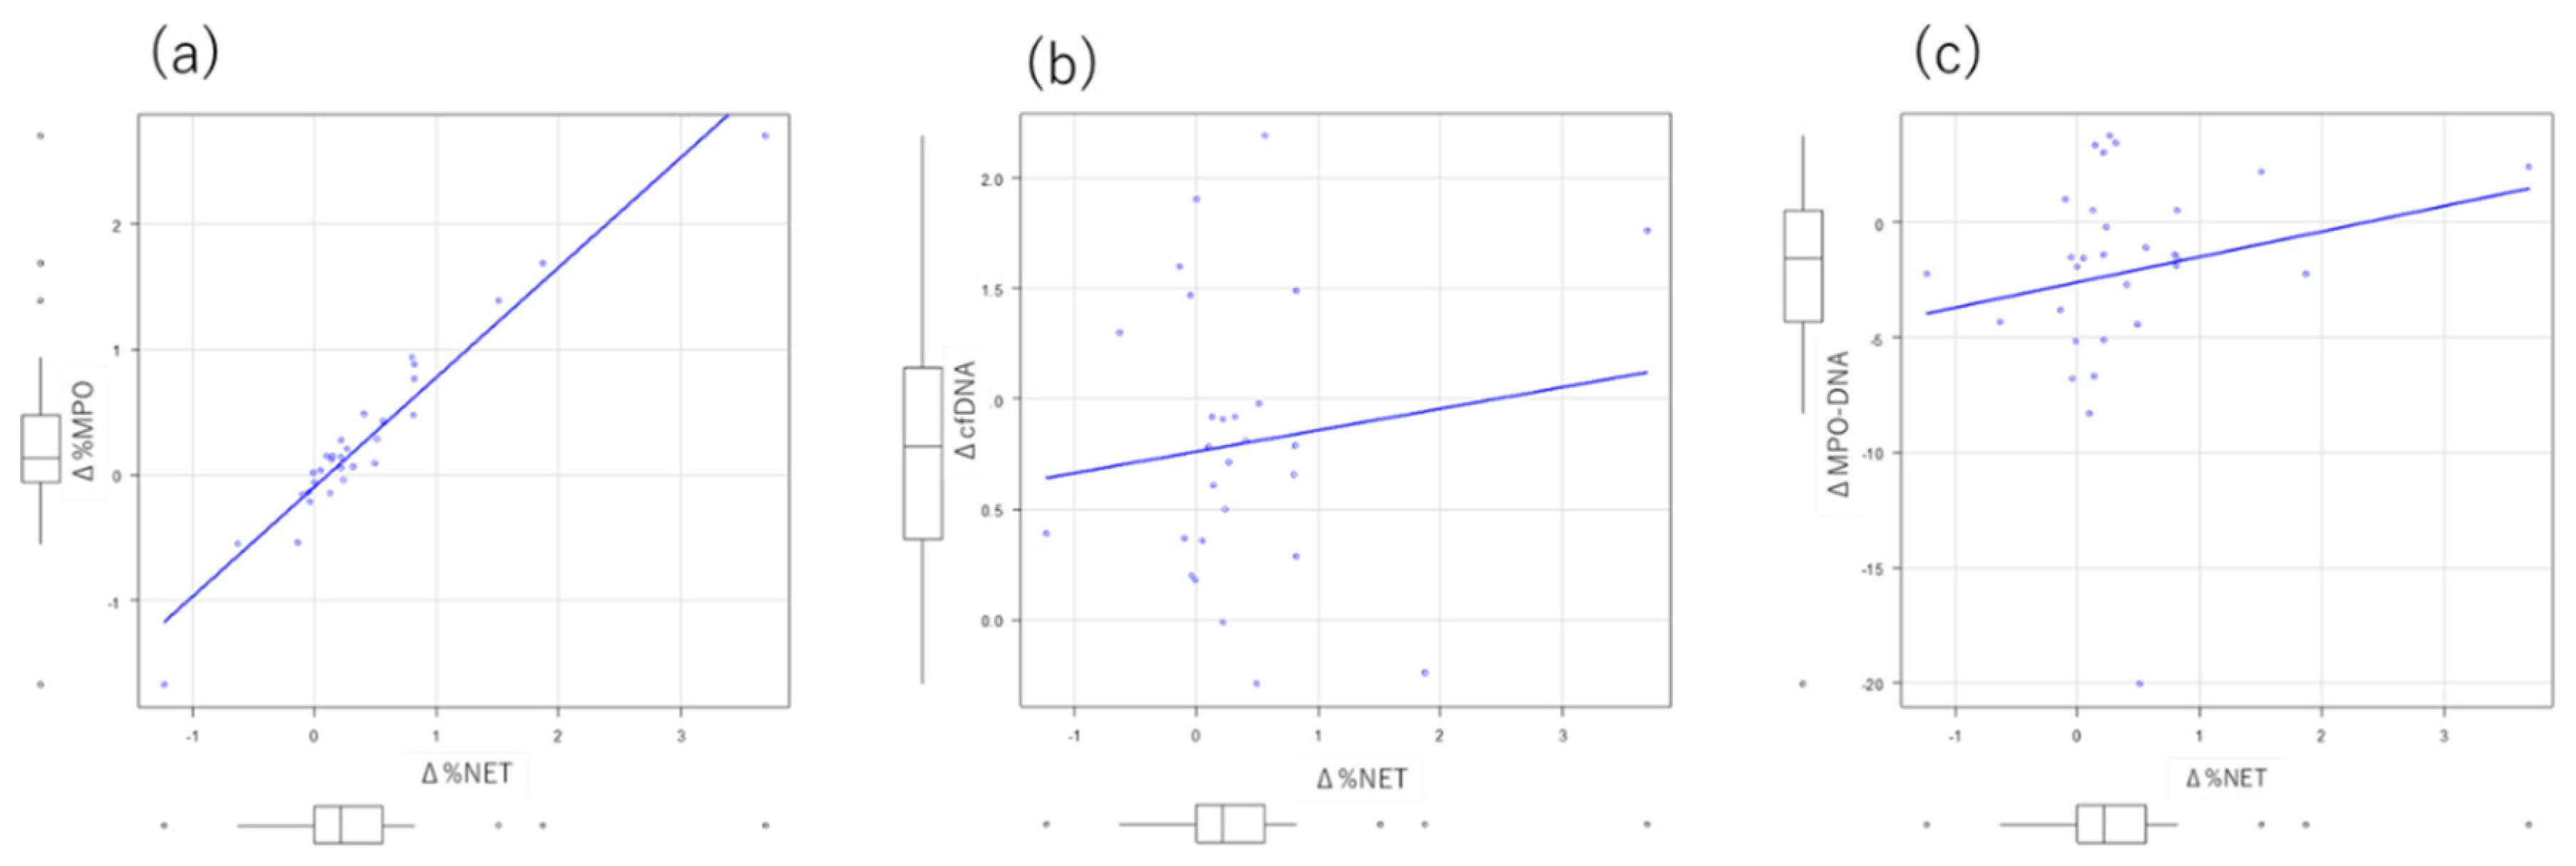
No significant correlations were observed between Δ%NET and ΔcfDNA (r=-0.131, P=0.514) or ΔMPO-DNA (r=0.199, P=0.292) (Figure 5b,c). In contrast, Δ%NET was strongly correlated with Δ%MPO (r=0.966, P<0.001) (Figure 5a). These findings indicate that the flow cytometric NET-associated signal did not parallel changes in the circulating NET-associated markers measured at the end of the HD session.
3.4. Changes in Uremic Toxins (Table 4)
Plasma concentrations of the measured uremic toxins decreased significantly after HD. No statistically significant differences were observed among the three phases in pre-HD or post-HD levels.
4. Discussion
The principal finding of this exploratory study was that a flow cytometric NET-associated signal in a predefined extracellular fraction of isolated neutrophil preparations increased during SHD. In contrast, the circulating NET-associated markers measured at the end of the HD session showed discordant responses. In particular, Δ%NET was not correlated with ΔcfDNA or ΔMPO-DNA, whereas Δ%NET was strongly correlated with Δ%MPO. These findings suggest that flow cytometric assessment and circulating NET-associated biomarkers may capture different biological compartments or temporal phases of the dialysis-associated neutrophil response.
In the present flow cytometric approach, the granulocyte region contained predominantly intact neutrophils, whereas the predefined extracellular fraction contained SYTOX Green/MPO double-positive events that were distinguishable from intact cells and small debris. The increase in this double-positive signal during SHD is consistent with extracellular chromatin-associated material containing MPO. However, because the neutrophils were isolated before staining and the extracellular structures were not directly visualized by microscopy, the finding should be interpreted as flow cytometric evidence consistent with NET-associated extracellular DNA formation rather than definitive morphological proof of NETosis.
The strong correlation between Δ%NET and Δ%MPO provides internal support for the flow cytometric signal. Nevertheless, this correlation does not independently establish NET formation because both measurements derive from related flow cytometric signals. Confirmation using complementary approaches, such as fluorescence microscopy demonstrating extracellular DNA colocalized with MPO or citrullinated histone H3, would strengthen the biological interpretation in future studies.
The discordance between the flow cytometric signal and circulating cfDNA/MPO-DNA is biologically plausible. cfDNA is not specific to NETs and can originate from multiple sources, including injured or dying cells [21,22]. In addition, plasma concentrations during HD are affected by changes in plasma volume and by removal or adsorption across the dialysis circuit. Thus, a marker measured only before and at the end of a 4-h dialysis session may not reflect transient NET formation occurring earlier during treatment.
Previous studies have reported increases in circulating MPO-DNA during dialysis when blood was sampled relatively early after dialysis initiation [8]. In contrast, the present study assessed circulating markers at the end of the HD session. Complement activation and neutrophil responses may occur early during HD and subsequently decline, while NET-associated products may be removed or otherwise altered during continued dialysis. Therefore, the timing of sampling is likely to be an important determinant of whether circulating NET-associated biomarkers detect an acute dialysis-associated response.
The present findings therefore highlight an important methodological distinction: a circulating NET-associated biomarker should not necessarily be regarded as a direct surrogate for NET formation occurring within neutrophils during an individual HD session. Serial sampling during HD, together with simultaneous cellular and plasma measurements, will be needed to clarify the temporal relationship between neutrophil activation, NET formation, and circulating NET-associated products.
An exploratory objective was to examine the response during H2-HD. The NET-associated signal increased significantly during SHD but not during either H2-HD phase. However, the changes in %NET did not differ significantly among the three phases. Moreover, the treatment sequence was fixed, with H2-HD preceding and following SHD, rather than randomized or counterbalanced. Accordingly, period, sequence, and carryover effects cannot be excluded. The present study therefore does not establish that H2-HD suppresses NET formation. The observed pattern may provide a rationale for a future randomized crossover study specifically designed to test the effect of H2-enriched dialysate.
Several limitations should be acknowledged. First, the sample size was very small, and the participants were clinically stable patients selected from a single center, limiting generalizability and statistical power. Second, only a single pre-HD and post-HD time point was assessed in each phase; transient changes during the first hours of dialysis could therefore have been missed. Third, the positive flow cytometric events were not confirmed by direct microscopic visualization of NET structures. Fourth, the isolation procedure itself may influence neutrophil activation or extracellular chromatin release, and an ex vivo contribution cannot be completely excluded. Fifth, the fixed H2-HD/SHD/ H2-HD sequence prevents a definitive causal comparison between dialysis modalities. Finally, the clinical implications of the observed NET-associated signal remain uncertain.
Despite these limitations, the study provides a useful methodological observation: flow cytometry of isolated neutrophil preparations can detect a dialysis-associated NET-related signal that is not mirrored by circulating cfDNA or MPO-DNA measured at the end of dialysis. This distinction may be relevant when investigating dialysis biocompatibility and the relationship between neutrophil activation and chronic complications of HD. Future studies should combine flow cytometry with direct imaging and serial blood sampling to establish the temporal and biological relationship between neutrophil activation, NET formation, circulating NET products, and clinical outcomes.
Whether modulation of NET formation during HD could influence dialysis-related inflammation, vascular injury, or host-defense functions remains an important question for future research.
5. Conclusions
Flow cytometry detected an extracellular SYTOX Green/MPO double-positive signal in isolated neutrophil preparations that increased during SHD. The finding provides evidence consistent with NET-associated extracellular DNA formation during HD, although direct morphological confirmation of NET structures was not performed. The lack of correlation between this cellular signal and circulating cfDNA or MPO-DNA highlights the distinct information provided by cellular and circulating NET-associated assays and emphasizes the importance of sampling time and dialysis-related concentration and clearance effects. The effect of H2-enriched dialysate on NET formation remains uncertain.
Funding
This research was supported by funding from Nihon Trim Co., Ltd.
Author: Contributions
MN was the principal investigator and wrote the main manuscript text. MN and MS organized the study. NK, KK, CA, TF, YI, MN, and FT collected data. ES measured samples. MN and SK conceptualized the study.
Data: Availability Statement.
The data that support the findings of this study are not publicly available because of policies established by the institutional review board for this study. Individual patient-level data beyond those presented in the manuscript will not be made publicly available.
Acknowledgments
The authors appreciate the Kidney Center of St Luke’s International Hospital for supporting this research. We thank the St Luke’s SRL Laboratory, Tokyo, for technical assistance with flow cytometric analysis and measurement of circulating markers.
Conflict: of Interest Statement.
SK is an employee of Nihon Trim Co., Ltd., which manufactures the electrolyzed-water hemodialysis system to provide H2-enriched dialysate (Trim Medical Institute Co., Osaka, Japan). All other authors declare no competing interests.
References
- Brinkmann V, Zychlinsky A. Neutrophil extracellular traps: is immunity the second function of chromatin? J Cell Biol. 2012;198:773-783. [CrossRef]
- Jorch SK, Kubes P. An emerging role for neutrophil extracellular traps in noninfectious disease. Nat Med. 2017;23:279-287. [CrossRef]
- Cristol JP, Thierry AR, Bargnoux AS, Morena-Carrere M, Canaud B. What is the role of the neutrophil extracellular traps in the cardiovascular disease burden associated with hemodialysis bioincompatibility? Front Med (Lausanne). 2023;10:1268748. [CrossRef]
- Korabecna M, Tesar V. NETosis provides the link between activation of neutrophils on hemodialysis membrane and comorbidities in dialyzed patients. Inflamm Res. 2017;66:369-378. [CrossRef]
- Camous L, Roumenina L, Bigot S, et al. Complement alternative pathway acts as a positive feedback amplification of neutrophil activation. Blood. 2011;117:1340-1349. [CrossRef]
- Yuen J, Pluthero FG, Douda DN, et al. NETosing neutrophils activate complement both on their own NETs and bacteria via alternative and non-alternative pathways. Front Immunol. 2016;7:137. [CrossRef]
- Kim JK, Park MJ, Lee HW, et al. The relationship between autophagy, increased neutrophil extracellular traps formation and endothelial dysfunction in chronic kidney disease. Clin Immunol. 2018;197:189-197. [CrossRef]
- Bieber S, Muczynski KA, Lood C. Neutrophil Activation and Neutrophil Extracellular Trap Formation in Dialysis Patients. Kidney Med. 2020;2:692-698. [CrossRef]
- Coimbra S, Rocha S, Nascimento H, et al. Cell-free DNA as a marker for the outcome of end-stage renal disease patients on haemodialysis. Clin Kidney J. 2021;14:1371-1378. [CrossRef]
- Tovbin D, Novack V, Wiessman MP, et al. Circulating cell-free DNA in hemodialysis patients predicts mortality. Nephrol Dial Transplant. 2012;27:3929-3935. [CrossRef]
- Einbinder Y, Shnaider A, Ghanayem K, et al. Elevated circulating cell-free DNA in hemodialysis-treated patients is associated with increased mortality. Am J Nephrol. 2020;51:852-860. [CrossRef]
- Jeong DW, Moon JY, Choi YW, et al. Effect of blood pressure and glycemic control on the plasma cell-free DNA in hemodialysis patients. Kidney Res Clin Pract. 2015;34:201-206. [CrossRef]
- Kim JK, Hong CW, Park MJ, et al. Increased neutrophil extracellular trap formation in uremia is associated with chronic inflammation and prevalent coronary artery disease. J Immunol Res. 2017;2017:8415179. [CrossRef]
- Lee HW, Nizet V, An JN, et al. Uremic serum damages endothelium by provoking excessive neutrophil extracellular trap formation. Sci Rep. 2021;11:21439. [CrossRef]
- Nakayama M, Kabayama S, Miyazaki M. Application of Electrolyzed Hydrogen Water for Management of Chronic Kidney Disease and Dialysis Treatment—Perspective View. Antioxidants (Basel). 2024;13:90. [CrossRef]
- Masuda S, Shimizu S, Matsuo J, et al. Measurement of NET formation in vitro and in vivo by flow cytometry. Cytometry A. 2017;91:822-829. [CrossRef]
- Goldshtein H, Hausmann MJ, Douvdevani A. A rapid direct fluorescent assay for cell-free DNA quantification in biological fluids. Ann Clin Biochem. 2009;46:488-494. [CrossRef]
- Nakayama M, Watanabe K, Sato E, et al. Hemodialysis employing molecular hydrogen (H2) enriched dialysis solution may improve dialysis related fatigue through impact on energy metabolism. Sci Rep. 2025;15:5039. [CrossRef]
- Tsujimoto Y, et al. Amelioration of fatigue in chronic dialysis patients with dialysis solution employing electrolyzed water containing molecular hydrogen (H2) and its association with autonomic function balance. Ren Replace Ther. 2021;7:58. [CrossRef]
- Kanda Y. Investigation of the freely available easy-to-use software 'EZR' for medical statistics. Bone Marrow Transplant. 2012;48:452-458. [CrossRef]
- de Miranda FS, Barauna VG, Dos Santos L, et al. Properties and application of cell-free DNA as a clinical biomarker. Int J Mol Sci. 2021;22:9110. [CrossRef]
- Goligorsky MS. NET formation in dialysis: a valuable, albeit mysterious and enticing predictor of mortality. Am J Nephrol. 2020;51:849-851. [CrossRef]
- Lee HW, Nizet V, An JN, et al. Uremic serum damages endothelium by provoking excessive neutrophil extracellular trap formation. Sci Rep. 2021;11:21439. [CrossRef]
- Fukushi T, et al. Enhanced neutrophil apoptosis accompanying myeloperoxidase release during hemodialysis. Sci Rep. 2020;10:21747. [CrossRef]
- Talal S, Mona K, Karem A, et al. Neutrophil degranulation and severely impaired extracellular trap formation at the basis of susceptibility to infections of hemodialysis patients. BMC Med. 2022;20:364. [CrossRef]
Figure 5.
Associations between changes in flow cytometric and circulating NET-associated parameters. Δ denotes the post-HD minus pre-HD value. %NET, NET-associated flow cytometric signal; %MPO, MPO-positive flow cytometric fraction; cfDNA, cell-free DNA; MPO-DNA, MPO-DNA complex. (a) Δ%NET versus Δ%MPO: r=0.966, P<0.001. (b) Δ%NET versus ΔcfDNA: r=0.131, P=0.514. (c) Δ%NET versus ΔMPO-DNA: r=0.199, P=0.292.
Figure 5.
Associations between changes in flow cytometric and circulating NET-associated parameters. Δ denotes the post-HD minus pre-HD value. %NET, NET-associated flow cytometric signal; %MPO, MPO-positive flow cytometric fraction; cfDNA, cell-free DNA; MPO-DNA, MPO-DNA complex. (a) Δ%NET versus Δ%MPO: r=0.966, P<0.001. (b) Δ%NET versus ΔcfDNA: r=0.131, P=0.514. (c) Δ%NET versus ΔMPO-DNA: r=0.199, P=0.292.
Disclaimer/Publisher’s Note: The statements, opinions and data contained in all publications are solely those of the individual author(s) and contributor(s) and not of MDPI and/or the editor(s). MDPI and/or the editor(s) disclaim responsibility for any injury to people or property resulting from any ideas, methods, instructions or products referred to in the content. |
© 2026 by the authors. Licensee MDPI, Basel, Switzerland. This article is an open access article distributed under the terms and conditions of the Creative Commons Attribution (CC BY) license (http://creativecommons.org/licenses/by/4.0/).
Copyright: This open access article is published under a Creative Commons CC BY 4.0 license, which permit the free download, distribution, and reuse, provided that the author and preprint are cited in any reuse.