

Submitted:
22 October 2026
Posted:
23 October 2026
You are already at the latest version
Abstract
The Consumer Financial Protection Bureau (CFPB) publishes each complaint it forwards to a financial institution, the company's response category, and, until 2017, whether the consumer disputed it. The database records no company response date. We show that initial response timeliness is a compliance flag that varies for 2.4% of complaints, and that the only continuous timing field, the CFPB routing delay from receipt to transmission, is an administrative delay that precedes the company's involvement. In 737,010 complaints resolved by 4,092 institutions, with the dispute outcome recovered from an archived vintage, complaints closed with monetary relief are disputed 12.4 percentage points less often than similar complaints closed with an explanation (95% CI −13.4 to −11.4). The association survives fixed effects, narrative based severity controls, and sensitivity bounds, but the company chooses the response, so we report it as an association. Within firm, product, month, channel, and category cells, routing delay is associated with fewer disputes among complaints closed with an explanation (−1.1 points per log day, CI −1.4 to −0.8) or with no relief −1.8, CI −2.7 to −1.0), and with no change among complaints closed with monetary relief. Dispute indicators should be conditioned on routing delay, channel, and product.
Keywords:
consumer complaints
; service recovery
; consumer dispute behavior
; routing delay
; complaint handling
; conduct risk
; administrative data
; Consumer Financial Protection Bureau
1. Introduction
When a consumer complains about a financial product through the Consumer Financial Protection Bureau (CFPB), the public record shows which company received the complaint, how the company categorized its response, and, until April 2017, whether the consumer disputed that response. Researchers use the file to predict which complaints receive monetary relief (Wang et al., 2026) and to document disparities in timely responses (Sun et al., 2026), and supervisors and firms read dispute rates as a measure of complaint handling quality. Each use rests on a reading of the file’s timing fields, and we show in this paper that the common reading is wrong. The database records no company response date, so it cannot measure how quickly a firm resolved a complaint. Its timeliness flag records only whether an initial response met a regulatory window, and the one continuous timing variable it contains, the interval between the Bureau’s receipt of a complaint and its transmission to the company, is an administrative delay that occurs before the company has seen the case. We call this interval the CFPB routing delay, and we ask how the company’s response category and the routing delay are associated with the consumer’s observed decision to dispute.
Two literatures meet here. The service recovery literature holds that customers evaluate a firm’s response along the distributive, procedural, and interactional dimensions of justice (Homburg & Fürst, 2005; Smith et al., 1999; Tax et al., 1998) and that, in experiments, delay lowers the value of a remedy (Hogreve et al., 2017; Wirtz & Mattila, 2004); its predictions have rarely been tested on field data, because firms seldom release resolution records (Knox & van Oest, 2014). The empirical literature on the CFPB database in finance treats complaint volumes and outcomes as measures of service quality (Begley & Purnanandam, 2021; Hayes et al., 2021) or as prediction targets (Sun et al., 2026; Wang et al., 2026). Neither has asked what the database’s timing fields can support, and neither has used the consumer’s dispute decision, which the Bureau collected for its first six years and removed from the public export in June 2026.
The paper makes three contributions. First, we establish what the two timing fields measure: initial response timeliness is a compliance indicator with variation in 2.4% of complaints, and routing delay is a Bureau side interval, explained mainly by the submission channel and the calendar, that is not a measure of recovery speed. Second, on 737,010 complaints resolved by 4,092 financial institutions between June 2012 and April 2017, the complete population for which the Bureau recorded the dispute decision, which we recover from an archived vintage of the public file and validate against the current export, we estimate how the response category and the routing delay are associated with that decision. Complaints closed with monetary relief are disputed 12.4 percentage points less often than otherwise similar complaints closed with an explanation (95% confidence interval −13.4 to −11.4), and complaints closed with nonmonetary relief 9.0 points less often. We call these associations, because the company chooses the category after reviewing the complaint; we state the identification assumptions in a causal diagram, show that the associations survive severity controls built from complaint narratives, and report how strong selection on unobservables would have to be to remove them (Oster, 2019). Third, we show that routing delay is associated with fewer disputes among complaints closed with an explanation or with no relief, at 1.1 to 1.8 points per log day within firm by product by month by channel by category cells, and with no change among complaints closed with monetary relief. Because the delay precedes the company’s involvement, this gradient is a property of the dispute indicator rather than of the company’s handling, and dispute rates compared across firms without conditioning on routing delay, channel, and product partly reflect the agency’s queue.
The study speaks to the management of conduct and operational risk in financial institutions. Operational risk under the Basel definition includes losses from failed internal processes, and regulatory compliance risk is a priority for research in a setting where regulators show little tolerance for noncompliance (Jadwani et al., 2024). Trust in banks, which feeds through to satisfaction and loyalty, has made the behavioral supervision of retail banks increasingly relevant (Cardoso & Cardoso, 2024). Our results imply that initial response timeliness, routing conditions, and dispute rates are three different quantities, and that none should be read as an interchangeable measure of recovery quality.
Section 2 reviews the literature and states the research questions. Section 3 describes the complaint process, the data, and what the timing fields measure. Section 4 sets out the empirical strategy and its assumptions. Section 5 presents the estimates and their sensitivity. Section 6 draws implications and states the limitations, and Section 7 concludes.
2. Literature and Research Questions
2.1. Justice Theory and the Erosion Prediction
Service failures are among the most memorable of service encounters, and the firm’s response shapes the relationship that follows (Bitner et al., 1990; Hart et al., 1990; Kelley et al., 1993). In retail banking that response carries particular weight, because loyalty is explained by complaints as well as by satisfaction, and complaints are among the dimensions on which banks score worst (Cardoso & Cardoso, 2024). Justice theory is the dominant framework for how customers evaluate the response (Smith et al., 1999; Tax et al., 1998). It distinguishes the fairness of the outcome received, distributive justice, from the fairness of the process, procedural justice, and of the interpersonal treatment, interactional justice (Adams, 1965; Bies & Moag, 1986; Blodgett et al., 1997; Thibaut & Walker, 1975); timeliness belongs to the procedural dimension (Davidow, 2003; Homburg & Fürst, 2005; Smith et al., 1999). Two meta-analyses rank the dimensions. Satisfaction with complaint handling responds most to distributive justice, then to interactional justice, and only weakly to procedural justice, with standardized effects of .45, .25, and .09 (Orsingher et al., 2010); Gelbrich and Roschk (2011) confirm the ordering, and Van Vaerenbergh et al. (2014) show that the attributions customers form about a failure condition it.
Experimental research asks whether the dimensions interact. Wirtz and Mattila (2004) conclude that compensation is a poor substitute for a good recovery process; Boshoff (1997), Zhou et al. (2014), and Hogreve et al. (2017) show that customers tolerate delay only within a zone, beyond which compensation expectations rise and satisfaction falls; and the literature on waiting documents that waits lower evaluations of the service that follows them, that the response to waiting is anger rather than impatience, and that the perceived fairness of a queue matters independently of its length (Buell, 2021; Hui & Tse, 1996; Larson, 1987; Maister, 1985; Taylor, 1994), although firms can shape the experience of waiting through guarantees and transparency (Buell et al., 2017; Kumar et al., 1997). Together these findings predict that a remedy delivered after a long wait is worth less than the same remedy delivered promptly, so that delay erodes the effectiveness of relief; we call this the erosion prediction. The evidence for it comes from scenarios and reported intentions in samples of dozens to a few hundred respondents (Maxham & Netemeyer, 2002; McCollough et al., 2000; Smith & Bolton, 2002), and whether such findings generalize to the field is an open question (Camerer et al., 2016; Levitt & List, 2007; Open Science Collaboration, 2015). Testing the prediction in the field requires observing how long the customer waited for the remedy, which, as Section 3.3 shows, the CFPB database does not record.
2.2. Field Evidence, the Financial Services Setting, and Measurement
Field evidence on recovery is scarce. Knox and van Oest (2014) find in the records of one retailer that recovery counters the effect of a complaint but rarely offsets it, and Morgeson et al. (2020) show with 35,597 complaining customers that the return to recovery depends on economic, industry, and customer factors; neither observes the speed of recovery. Financial services add a regulatory dimension. Complaint handling in banking is a defensive marketing instrument (Fornell & Wernerfelt, 1987), retention in continuous service relationships depends on satisfaction and service quality (Anderson & Sullivan, 1993; Bolton, 1998; Zeithaml et al., 1996), and recovery fails often because customer, employee, and process perspectives diverge (Michel et al., 2009). The rationale for consumer financial protection rests on the difficulty consumers face in evaluating complex products and obtaining redress (Campbell et al., 2011), and the Consumer Financial Protection Bureau, created by the Dodd-Frank Act of 2010 (United States Congress, 2010), operates a centralized complaint process whose records it publishes. The database has become a research resource: Begley and Purnanandam (2021) use complaint volumes to measure the quality of financial services across neighborhoods, Hayes et al. (2021) relate complaining to local trust, Ayres et al. (2013) provide an early descriptive analysis, Wang et al. (2026) predict monetary relief from narrative text, and Sun et al. (2026) model which consumers receive a timely response. This literature treats the recorded outcome of a complaint as something to be predicted or as a proxy for service quality; it has not asked what the timing fields measure, and it has not used the dispute decision.
Measurement is the final strand. Complaining is a voluntary act, so who complains is selected (Hirschman, 1970): Raval (2020) shows that complaint rates fall sharply relative to victimization rates as the share of Black residents in an area rises, and that the selection reflects trust rather than information. Disputing a company’s response is also voluntary, and a consumer who does not dispute may be satisfied, may have disengaged, may lack information about the option, or may judge further action not worthwhile. Throughout this paper the outcome is therefore the observed decision to dispute the company’s response in the CFPB system, and we do not read it as satisfaction or as the quality of the recovery.
2.3. Research Questions
We pose three questions. First, what do the timing fields of the CFPB database measure, and is the routing delay related to the characteristics of the complaint or to the operation of the agency that routes it? Second, how is the company’s reported response category associated with the consumer’s decision to dispute, and how sensitive is that association to unobserved complaint merit, which the company observes when it chooses the response and the analyst does not? Third, is routing delay associated with the dispute decision, does the association differ across response categories, and what does it imply for dispute rates as supervisory and managerial indicators? The erosion prediction supplies the expected sign in the third question: if the administrative waiting that routing delay represents erodes relief, the association between delay and dispute should be most positive, or least negative, among complaints closed with relief.
3. Institutional Setting, Data, and What the Timing Fields Measure
3.1. The CFPB Complaint Process and Its Response Categories
The CFPB has operated a centralized complaint process since July 2011 (Consumer Financial Protection Bureau, 2017). A consumer submits a complaint through the Bureau’s website, by telephone, by mail, by fax, or by referral from another agency; the Bureau screens it, identifies the responsible company, and transmits it. The company is asked to respond within 15 calendar days, may report the complaint as in progress, and must provide a final response within 60 days (Consumer Financial Protection Bureau, 2017). Until 24 April 2017 the consumer could review the final response and, within 60 days of receiving it, indicate whether they disputed it; the Bureau then discontinued the option (Consumer Financial Protection Bureau, 2026b).
Three distinctions matter for everything that follows. The first is between the initial response, the final response, and the recovery: the database records whether the initial response met the 15 day window (the timeliness flag) and the category of the final response, but not the date of either, so it cannot measure how long the consumer waited for a resolution. The second is between the response category and the recovery itself. The category is chosen by the company from a fixed menu that the Bureau defines as follows (Consumer Financial Protection Bureau, 2017): closed with monetary relief means that the steps taken provided objective, measurable, and verifiable monetary relief; closed with nonmonetary relief means that they addressed some or all of the consumer’s nonmonetary requests, for example by correcting a credit record, stopping collection calls, or modifying the terms of an account; closed with explanation means that the response included an explanation tailored to the complaint and provided neither form of relief; and closed means that the company closed the complaint without relief or explanation. The amount of relief is not recorded, the categories are self reported, and the file does not show whether the consumer regarded the relief as adequate, so we refer to the category as the recovery substance reported by the company. The 15 day window and the four categories were in force in every year of the study period (by calendar year of receipt, the share closed with an explanation rose from 70.9% in 2012 to 81.7% in 2017 and monetary relief fell from 13.0% to 5.7%; Appendix A.1 documents the earlier scheme that we exclude), and revisions after closure are rare: the category agrees for 99.978% of complaints between the 2019 and 2026 vintages of the file (Appendix B). The third distinction, between the two timing fields, is the subject of Section 3.3.
Four further features of the process matter for the design. Complaints are published only after the company responds or 15 days elapse, so the composition of the public file depends on response behavior. Complaints about depository institutions with less than USD 10 billion in assets are referred to prudential regulators and are not published. The Bureau states that the database is not a statistical sample of consumer experiences (Consumer Financial Protection Bureau, 2017). Finally, the 60 day dispute window opens when the company’s response is sent, not when the Bureau receives the complaint, so routing delay does not shorten the time available to dispute; consumers who submitted online are notified through the Bureau’s portal and by email, whereas those who submitted by mail, telephone, or referral are notified by mail, which is why the submission channel enters every specification and why Appendix A.2 reports the delay gradient within channels.
3.2. Data, Outcome Recovery, and Sample
Our primary source is the full public export of the Consumer Complaint Database, downloaded on 2 September 2026, with 17,491,758 complaints received between 1 December 2011 and 2 September 2026 (Consumer Financial Protection Bureau, 2026a). Two fields the database carried for its first fourteen years, the dispute indicator and the consumer’s consent to publish a narrative, were removed from the export in June 2026 (Consumer Financial Protection Bureau, 2026b). We recover them from an archived vintage of the same federal file dated 5 November 2019, joined on the complaint identifier (Consumer Financial Protection Bureau, 2019); every other variable comes from the current export, because the Bureau relabels product and issue categories between vintages. Of the 767,875 complaints in the current export received before 24 April 2017, 767,874 match the archive, and the two sources agree on the date received, the date sent to the company, and the timeliness flag for every matched complaint and on the response category for 99.978% (Table A3 in Appendix B). The dispute outcome therefore exists for the complete and now closed population of complaints for which the Bureau offered the option, and the window of the study is fixed by that institutional fact rather than chosen. Appendix B documents both source files with sizes and checksums, the join, every exclusion rule and recoding, and a codebook.
The analysis sample drops the 28,821 complaints received before 1 June 2012, when companies still used two legacy categories, closed with relief and closed without relief, that cannot be mapped onto the later scheme (Appendix A.1), together with three later records that carry a legacy label, and the 2,040 complaints whose response is recorded as in progress or untimely response, which are not final categories and carry no information about what the company gave; it recodes 7,018 one day negative routing delays to zero; and it standardizes company names, mapping 4,110 raw strings to 4,092 firms. The result is 737,010 complaints resolved by 4,092 firms between 1 June 2012 and 22 April 2017, with a dispute rate of 19.22%. Table 1 describes it. Mortgages, debt collection, and credit reporting account for two thirds of complaints and web submissions for 69%; 78.0% of complaints are closed with an explanation only, 12.8% with nonmonetary relief, 6.9% with monetary relief, and 2.3% with no relief; and the raw dispute rate is 10.6% for monetary relief, 11.6% for nonmonetary relief, 21.2% for explanation, and 20.7% for no relief. Narratives, published with consumer consent from June 2015, are available for 22.1% of the sample.
3.3. What the Timing Fields Measure
The database records no company response date, so no measure of company response time can be constructed. Two timing fields are available, and they measure different things (Table 2).
The first is initial response timeliness, if the company’s initial response arrived within the Bureau’s 15 day window. The flag does not measure time to resolution, because a company may take up to 60 days to finalize a response it initiated within 15, and it does not measure how late an untimely response was. Untimeliness is also rare: 97.63% of complaints are timely, so the 17,436 untimely complaints carry all of the flag’s variation, and the cell that a test of substitution between speed and substance would most need, untimely initial responses closed with monetary relief, is thin (Table 5). We use the flag as the Bureau defines it, as an indicator of regulatory compliance in the initial response, and report every estimate that depends on it with its confidence interval.
The second is the CFPB routing delay, , the number of days between the Bureau’s receipt of the complaint and its transmission to the company. This is waiting on the Bureau’s side of the process, before the company has seen the case, and it is not a measure of the company’s recovery speed. Half of all complaints are routed on the day they are received, 38.6% within 1 to 6 days, 5.3% within 7 to 13 days, and 6.1% after 14 days or more; the mean is 4.1 days, the median one day, and the 99th percentile 48 days. What the delay reflects is an empirical question, and Panel B of Table 2 answers it as far as observables allow. The characteristics most plausibly related to the merit of a complaint (product, issue, state, and consumer tag) explain 2.9% of the variance of log delay; the submission channel explains 17.0%, because complaints that arrive on paper or by referral must be entered and classified before they can be routed; calendar month and day of week explain a further 4% to 6%; and everything observed, including the responding firm, explains 27.1%, or 36.5% with firm by product by month cells. The remaining within cell dispersion of the Bureau’s processing time is what our specifications use. We do not read these figures as evidence that delay is random: they show that delay is strongly related to one observable, the channel, which every specification controls, and weakly related to the observables that proxy for merit. Whether it is related to unobserved merit cannot be tested, and Section 4 states that assumption explicitly.
We do not instrument routing delay (Panel C of Table 2). The obvious instrument, the Bureau’s workload, produces no first stage above F = 8.1 in any specification, against a conventional threshold of 10 (Staiger & Stock, 1997; Stock & Yogo, 2005): intake rose from roughly 1,550 to 4,600 complaints per week over the window while mean delay fell from 5.3 to 2.7 days as web submissions displaced paper, so the pooled relationship is dominated by two secular trends, and within years the relationship is positive in five of the six but weak. The day of the week of receipt shifts delay strongly, from 2.5 days for Sunday arrivals to 4.9 for Friday arrivals, because the Bureau does not route over the weekend, but the dispute rate also varies by day of arrival, from 22.9% on Sundays to 18.5% on Thursdays, so the day changes who complains and fails the exclusion restriction. Day of week therefore enters every specification as a control.
4. Empirical Strategy and Identification Assumptions
We estimate linear probability models of the form
where is the observed decision to dispute, indicates the response category monetary relief, nonmonetary relief, no relief} with explanation as the omitted category, collects product, issue, submission channel, state, consumer tag, and day of week effects, is a company effect, and is a calendar month effect. We build the specification as a ladder that adds each set of controls in turn and adds the interactions last. Company effects are estimated for the 677 firms with at least 50 complaints, with the 3,415 smaller firms pooled; the monetary relief coefficient is −12.396 percentage points with the pooled effects and −12.394 with all 4,092. We use the linear probability model because interaction terms are directly interpretable as differences in percentage points and because it avoids the link function assumptions that complicate interactions in a logit (Angrist & Pischke, 2009; Wooldridge, 2010); its fitted values in column (6) of Table 4 range from −0.22 to 0.81, with 0.93% below zero and none above one, and logit average marginal effects preserve every ordering reported below (Appendix C.2). Table 3 defines the variables in Equation (1); Appendix B gives the source field and construction of each.

Table 3.
Variable definitions.
| Variable | Definition |
|---|---|
| Consumer dispute () | 1 if the consumer indicated in the CFPB system, within 60 days of the company’s response, that they disputed it; 0 otherwise. The observed decision to dispute, not a measure of satisfaction. |
| Response category () | The company’s final response as recorded from the Bureau’s menu: closed with monetary relief, closed with nonmonetary relief, closed with explanation (omitted category), or closed with no relief. The recovery substance reported by the company. |
| Initial response timeliness () | 1 if the company’s initial response reached the Bureau within 15 calendar days of transmission; 0 otherwise. A compliance indicator, not a measure of time to resolution. |
| CFPB routing delay () | Days between the date the Bureau received the complaint and the date it sent the complaint to the company; one day negative values recoded to zero. Entered as or as six bins (0, 1 to 2, 3 to 6, 7 to 13, 14 to 29, 30 or more days). |
| Product, issue | The Bureau’s product and issue categories as labeled in the current export. |
| Submission channel | Web, referral, telephone, postal mail, fax, or email. |
| State, consumer tag | State of the consumer’s address; tag for older American, servicemember, both, or none. |
| Day of week, calendar month | Day of the week and calendar month (59 months) in which the Bureau received the complaint. |
| Company effect () | Indicator for each of the 677 firms with at least 50 complaints; firms with fewer are pooled. |
| Receipt week, routing week, receipt day | Calendar week of receipt, calendar week of transmission, and calendar day of receipt; alternative time effects and clustering dimensions. |
| Severity index | Standardized out of fold prediction of monetary relief from the complaint narrative, residualized on company by product cells (Section 5.4); available for the 22.1% of complaints with a published narrative. |
Table 4.
Specification ladder: linear probability models of the consumer dispute decision (coefficients in percentage points).
Table 4.
Specification ladder: linear probability models of the consumer dispute decision (coefficients in percentage points).
| (1) | (2) | (3) | (4) | (5) | (6) | |
|---|---|---|---|---|---|---|
| Monetary relief | −10.806*** | −12.003*** | −12.109*** | −12.442*** | −12.396*** | −7.272*** |
| (0.575) | (0.542) | (0.547) | (0.513) | (0.492) | (1.033) | |
| Nonmonetary relief | −9.794*** | −8.465*** | −8.567*** | −9.026*** | −8.967*** | −4.622*** |
| (0.889) | (0.729) | (0.768) | (0.753) | (0.895) | (1.262) | |
| No relief | 0.244 | 0.163 | 0.076 | −0.274 | −0.697 | 2.298* |
| (0.905) | (0.826) | (0.804) | (0.729) | (0.660) | (1.061) | |
| Timely initial response | 6.322*** | 6.089*** | 6.453*** | 6.224*** | 6.684*** | 7.641*** |
| (0.586) | (0.446) | (0.487) | (0.509) | (0.526) | (0.483) | |
| log(1 + routing delay) | −1.677*** | −1.583*** | −0.537*** | −0.973*** | −0.976*** | −1.237*** |
| (0.203) | (0.175) | (0.130) | (0.120) | (0.117) | (0.156) | |
| Monetary × timely | −6.457*** | |||||
| (0.948) | ||||||
| Nonmonetary × timely | −5.590*** | |||||
| (1.128) | ||||||
| No relief × timely | −2.683* | |||||
| (1.092) | ||||||
| Monetary × log delay | 1.595*** | |||||
| (0.265) | ||||||
| Nonmonetary × log delay | 1.489*** | |||||
| (0.313) | ||||||
| No relief × log delay | −0.422 | |||||
| (0.388) | ||||||
| Product, issue effects | ✓ | ✓ | ✓ | ✓ | ✓ | |
| Channel, state, tag, weekday effects | ✓ | ✓ | ✓ | ✓ | ||
| Calendar month effects | ✓ | ✓ | ✓ | |||
| Company effects | ✓ | ✓ | ||||
| Observations | 737,010 | 737,009 | 731,254 | 731,254 | 731,254 | 731,254 |
Notes: The dependent variable is an indicator for the consumer disputing the company’s response in the CFPB system, scaled so that coefficients are percentage points. The omitted response category is closed with explanation. Standard errors clustered by company in parentheses; two way standard errors clustered by company and receipt week differ from these by at most 13% (Table A5). Company effects pool firms with fewer than 50 complaints into one category. One complaint in a singleton issue cell is dropped in column (2); the 5,754 complaints with no recorded state and one further singleton are dropped when state effects enter in column (3). *** , ** , * , two tailed.
Figure 1 states the assumed causal structure as a directed acyclic graph, which encodes subject matter assumptions that the data cannot verify (Hernán & Robins, 2020). The company’s response category S and its timeliness T are chosen after the company has seen the complaint, so they depend on the observed characteristics and on the unobserved merit, severity, documentation, and legal exposure of the complaint, U, which also affects the consumer’s decision to dispute D. There is therefore an open backdoor path from S to D through U that no set of observed covariates can block (Hernán & Robins, 2020), and we do not claim that identifies the causal effect of relief. We report as an association conditional on , firm, and month, and ask how large selection on unobservables would have to be, relative to selection on observables, to account for it (Oster, 2019). The routing delay R is determined before the company sees the case; it depends on , in particular on the channel and the day of the week, and on Bureau workload, staffing, and operational conditions W. Identification of the delay gradient rests on two assumptions that we state and examine but cannot test. Assumption 1 is that, conditional on , firm, and time effects, R is independent of U: the Bureau’s processing time does not respond to the merit of a complaint. Assumption 2 is that W affects D only through R once calendar effects are held fixed. We examine Assumption 1 with balance diagnostics on characteristics determined before routing and with the stability of the estimates within firm by product by month by channel by category cells, and Assumption 2 by replacing month effects with receipt week and receipt day effects, which absorb any common shock to the Bureau on a given day; placebo tests that reassign delay among complaints in the same cell show what each specification recovers when the within cell variation is removed. These checks make the assumptions more plausible; they do not establish them (Imbens & Rubin, 2015).
We cluster standard errors by company (Cameron & Miller, 2015). Because routing delay is generated by a common administrative process, errors may also be correlated among complaints received or routed in the same week, a nonnested second dimension of dependence, so we also compute two way cluster robust standard errors by firm and receipt week, by firm and routing week, and by firm and receipt day (Cameron et al., 2011). The two way standard errors differ from the company clustered standard errors by at most 13% and change no inference (Table A5 in Appendix C); the confidence intervals for the derived quantities below are clustered by company and receipt week except where a table’s notes state otherwise. To describe the timeliness interaction we convert the interaction model into predicted probabilities for each of the eight response category by timeliness cells, with other covariates at their sample means and delta method intervals. To describe the delay gradient we report the slope of dispute in log routing delay within each response category, for explanation and otherwise, and complement the log specification with six delay bins so that the shape of the relationship is not imposed.
5. Results
5.1. Descriptive Patterns
Figure 2 presents the raw dispute rates. Panel A crosses the four response categories with initial response timeliness. The dominant pattern is the gap between relief and its absence: among timely initial responses, complaints closed with monetary or nonmonetary relief are disputed about 11% of the time and complaints closed with an explanation or with no relief about 21% of the time. The second pattern is unexpected. Within every response category, untimely initial responses are disputed less often than timely ones, and the gap is largest where the response gave the consumer nothing: 13.8% against 21.4% for explanation and 14.2% against 21.3% for no relief. Panel B replaces the timeliness flag by routing delay in six bins. Over the first two weeks of waiting the two relief series are flat and the explanation series moves little after the first bin; beyond two weeks all four series fall, and they fall most where nothing was given.
5.2. Response Category and the Decision to Dispute
Table 4 reports the specification ladder. The response category coefficients stabilize from column (2) onward and are essentially unchanged by company effects: with product and issue effects, complaints closed with monetary relief are disputed 12.0 percentage points less often than complaints closed with an explanation (column 2); the gap is 12.4 points with calendar month effects (column 4) and 12.4 points with company effects (column 5; SE 0.49, 95% CI −13.4 to −11.4), so that within a firm, in the same month, for the same product and issue, a complaint closed with money is disputed 12.4 points less often than one closed with an explanation. Complaints closed with nonmonetary relief are disputed 9.0 points less often in the same specification (SE 0.90), and closing a complaint with no relief is indistinguishable from closing it with an explanation (−0.70, SE 0.66). We read these coefficients as associations (Section 4): complaints that receive relief may differ in merit, documentation, or exposure that the fixed effects do not capture, and Section 5.4 asks how much such selection could explain.
The two timing fields behave as the raw patterns suggested. The coefficient on initial response timeliness is positive in every column, at 6.7 points with company effects (SE 0.53), so an untimely initial response is associated with fewer disputes, not more. The coefficient on log routing delay is negative in every column and moves most when the submission channel and day of week enter, from −1.58 in column (2) to −0.54 in column (3), which shows that part of the raw gradient was composition: postal and referral complaints wait longer and are disputed less. Column (6) adds the interactions. The slope of log delay among complaints closed with an explanation is −1.24 points per log day (SE 0.16); the interactions with monetary and nonmonetary relief are positive and close to each other in magnitude, 1.60 (SE 0.27) and 1.49 (SE 0.31), and the interaction with no relief is small (−0.42, SE 0.39). The timeliness interactions show the same structure: the 7.6 point association between a timely initial response and dispute among explanation only complaints shrinks by 6.5 points for monetary relief (SE 0.95) and by 5.6 points for nonmonetary relief (SE 1.13). Whatever variation in dispute the two timing fields carry, they carry it among complaints that received no substantive remedy.
5.3. The Timeliness Cells and Their Support
Table 5 restates the column (6) estimates as predicted probabilities and documents the support behind each response category by timeliness cell. Panel A is the reason for caution: the untimely and monetary relief cell contains 757 complaints from 236 firms, six of which contribute ten or more, against 560,808 complaints in the timely explanation cell. Panel B gives the eight predicted probabilities. A timely explanation is disputed with probability 21.4% (95% CI 21.1 to 21.7) and monetary relief after an untimely initial response with probability 7.8% (5.9 to 9.7). The contrast, 13.6 points (11.4 to 15.7), is the one the experimental literature would examine, and we draw no conclusion about substitution from it, because the cell is thin and concentrated in few firms and because the flag records only whether an initial response met a 15 day window, not how slow the recovery was. What the table shows robustly is that the response category dominates the timing field within well populated cells: within timely responses, monetary relief is associated with 12.4 fewer disputes per hundred than an explanation (−13.3 to −11.5), and within untimely responses with 6.0 fewer (−7.9 to −4.0), the smaller difference arising because an untimely explanation is already disputed far less often than a timely one; within monetary relief, the timely and untimely cells do not differ (1.2 points, −0.8 to 3.2).
Table 5.
Support, predicted dispute probabilities, and contrasts for the response category by initial response timeliness cells.
Table 5.
Support, predicted dispute probabilities, and contrasts for the response category by initial response timeliness cells.
| Timely initial response | Untimely initial response | |
|---|---|---|
| Panel A. Complaints and firms in each cell (in parentheses: firms with 10 or more complaints in the cell) | ||
| Monetary relief | 50,021 complaints; 854 firms (148) | 757 complaints; 236 firms (6) |
| Nonmonetary relief | 93,077; 1,079 (273) | 1,311; 336 (14) |
| Explanation only | 560,808; 3,439 (1,367) | 13,721; 2,011 (233) |
| No relief | 15,668; 1,093 (180) | 1,647; 467 (24) |
| Panel B. Predicted dispute probability (%), 95% confidence interval in brackets | ||
| Monetary relief | 9.0 [8.2, 9.8] | 7.8 [5.9, 9.7] |
| Nonmonetary relief | 12.4 [11.0, 13.9] | 10.4 [7.8, 12.9] |
| Explanation only | 21.4 [21.1, 21.7] | 13.8 [12.9, 14.7] |
| No relief | 20.7 [19.2, 22.1] | 15.7 [14.1, 17.4] |
| Panel C. Contrasts (percentage points), 95% confidence interval in brackets | ||
| Timely explanation minus untimely monetary relief | 13.60 [11.44, 15.75] | |
| Monetary relief minus explanation, within timely | −12.41 [−13.34, −11.48] | |
| Monetary relief minus explanation, within untimely | −5.95 [−7.87, −4.04] | |
| Timely minus untimely, within monetary relief | 1.18 [−0.78, 3.15] | |
| Timely minus untimely, within explanation | 7.64 [6.68, 8.61] | |
Notes: Panel A counts complaints and distinct firms in the analysis sample. Panels B and C are computed from column (6) of Table 4 with every other covariate at its sample mean, using the delta method. Intervals in Panel B use the covariance matrix clustered by company and receipt week; intervals in Panel C use the wider of the company clustered and the two way clustered standard errors for each contrast.
5.4. Sensitivity of the Category Association to Unobserved Merit
The central threat to the response category associations is that companies grant relief on complaints they judge meritorious and that merit also drives dispute. Product, issue, and company effects absorb the systematic part of merit, but a complaint can be more or less compelling within a product, an issue, and a firm. The narratives that the Bureau publishes with consumer consent carry information about this residual merit, and we use them to build a severity index: a ridge regression of monetary relief on term frequency inverse document frequency features of the narrative text (Gentzkow et al., 2019), predicted out of fold so that no complaint’s prediction uses its own outcome (Chernozhukov et al., 2018). Every token that appears in a company name is removed and the target is residualized on company by product cells, so that the index does not recover which company the complaint concerns (Appendix B.4). The index has an out of fold area under the curve of 0.748, close to the 0.78 that Wang et al. (2026) report, and inspection validates its content: the highest scoring narratives describe unauthorized charges, overdraft fees levied on a bank’s own fees, and enrollment in paid services the consumer did not request, and the lowest scoring narratives concern rewards points and promotional bonuses. Consent is not random. The consenting subsample of 163,038 complaints, 22.1% of the sample, consists entirely of web submissions, is concentrated in the last two years of the window, is disputed more often (22.0% against 18.4%), and is weighted away from mortgages (20.1% against 31.1%), so we use it to ask whether the conclusions change, not as a substitute for the full sample.
Panel A of Table 6 shows that the index is not a proxy for what the fixed effects already hold fixed. Product explains 2.5% of its variance, product and issue 13.3%, product, issue, and firm 14.4%, and adding channel, state, tag, and month leaves 14.5%; 81% of the variance lies within fully interacted product by issue by firm cells. Eight proxies for writing style, among them the length of the narrative, the number of sentences, and the shares of digits and capital letters, explain 5.9% of its variance on their own, and the largest correlation with any of them, 0.22 with the number of dollar signs, reflects content rather than style. Within the full set of fixed effects, one standard deviation of the index is associated with a 5.3 point higher probability of monetary relief (SE 0.72) and 1.0 point fewer disputes (SE 0.15). Panel B reports the estimates. On the narrative subsample the monetary relief coefficient is −14.8 without the index and −14.4 with it, a change of half a standard error; the index itself is associated with 0.39 fewer disputes per standard deviation (SE 0.10); and allowing it to interact with delay changes nothing. The conclusion is limited. Conditioning on the best available text measure of merit does not move the estimates, but the index adds almost no explained variance to the dispute equation (the rises from 0.0485 to 0.0486), so a coefficient stability calculation built on it would be uninformative. The exercise shows that the association is not driven by the part of merit that text can measure, not that unobserved merit is unimportant.
We therefore ask how much selection on unobservables would be needed to change the conclusions, using the coefficient stability framework of Oster (2019). The framework compares the coefficient and without controls (, ) with those from the full specification (, ), assumes that unobservables are related to the treatment in proportion to the observables, and, given a bound on the that would be obtained if the unobservables were observed, yields the bias adjusted coefficient at and the value of at which the coefficient would be zero. We report , the cutoff Oster (2019) derives from randomized results, and as a conservative bound; is uninformative for a binary outcome whose variance is largely irreducible at the individual level. These are extrapolations under a proportionality assumption, not tests (Imbens & Rubin, 2015).
The upper panel of Table 7 shows that the monetary relief association is the most robust quantity in the paper: adding the fixed effects moves it away from zero, from −10.8 to −12.4, so proportional selection would move it further, to −13.4 at and −16.6 at , and selection on unobservables would have to be 23 times as strong as selection on observables, or nine times at the conservative bound, to set it to zero. The nonmonetary relief association moves toward zero with controls, from −9.8 to −9.0, with bounds of −8.5 and −6.6 and of 5.0 and 1.9. Both survive the conservative bound with the sign and most of the magnitude intact. The lower panel applies the same calculation to the delay slopes, to which Section 5.5 returns after presenting them.
5.5. Routing Delay and the Decision to Dispute
Table 8 reports the slope of dispute in log routing delay within each response category, the quantity on which the third research question turns. In the baseline specification the slope is 0.37 points per log day for monetary relief (95% CI −0.04 to 0.79) and 0.27 for nonmonetary relief (−0.15 to 0.68), neither distinguishable from zero, against −1.24 for explanation (−1.56 to −0.92) and −1.65 for no relief (−2.31 to −0.99). If the waiting that routing delay represents eroded the value of relief, the dispute rate of complaints closed with relief should rise fastest with delay; the data show the opposite ordering, with the gradient confined to complaints in which the consumer received nothing.
The remaining rows ask whether the gradient reflects common shocks to the Bureau or the composition of complaints. Replacing the calendar month effects by 1,787 receipt day effects, so that only complaints received on the same day are compared, leaves every slope within 0.05 points of the baseline. Replacing the company and calendar month effects by 20,859 firm by product by month cells moves the explanation slope to −1.20 and the no relief slope to −1.81. The last row interacts the cells with the submission channel and the response category and adds receipt day effects, so that only the dispersion of routing delay among complaints about the same product, at the same firm, in the same month, through the same channel, and closed under the same category identifies the slopes: explanation and no relief remain at −1.09 (−1.42 to −0.76) and −1.83 (−2.66 to −0.99), and the two relief slopes fall to −0.03 (−0.48 to 0.42) and −0.50 (−0.75 to −0.24). Placebo tests explain the difference (Table A8, Panel C). Reassigning routing delays at random among complaints received in the same month, on the same day, or in the same firm by product by month cell gives slopes between −0.42 and +0.40 for all four categories, so neither the calendar nor a firm’s monthly caseload produces the gradient; reassigning within firm by product by month by channel cells, or within receipt day by channel by product cells, gives slopes of about −0.3 to −0.4 for explanation and +0.5 to +0.7 for relief, because delay and dispute both differ by channel and the baseline holds channel fixed only additively; and under the fixed effects of the last row the placebo slopes are 0.02 for monetary relief, −0.10 for nonmonetary relief, 0.01 for explanation, and 0.22 for no relief. Composition across channels within a firm’s monthly caseload therefore accounts for about a third of the baseline slope for explanation and for all of the small positive slopes for relief, and the within cell estimates, which we regard as the cleanest in the paper, sharpen the statement: routing delay is associated with fewer disputes among complaints closed with an explanation or with no relief, unrelated to dispute among complaints closed with monetary relief, and associated with slightly fewer disputes among complaints closed with nonmonetary relief. The erosion prediction, applied to this administrative component of the consumer’s wait, receives no support in any specification.
The delay gradient is less robust to unobserved confounding than the category association. In the lower panel of Table 7, the slope for explanation only complaints moves from −1.94 to −1.24 when the fixed effects enter; extrapolating that movement gives −0.79 at , where selection on unobservables 2.2 times as strong as selection on observables would set the slope to zero, and crosses zero at , where = 0.7 suffices; the slope for no relief behaves the same way (−1.18 and −0.04). For the relief categories the controls move the slopes across zero, from about −0.5 to about +0.3, so the bounds extend upward, whereas the finer controls of Table 8 move these slopes back toward zero, the opposite of the direction the extrapolation assumes; we therefore read the bounds for the delay slopes as a range rather than a point. The caution they add is that, if the Bureau’s routing were related to unobserved merit with the strength that proportional selection implies, the gradient among explanation only complaints could be half the size we estimate or absent, and Section 6 treats this as the central limitation.
Figure 3 replaces the constant slope per log day by six delay bins. For monetary relief the predicted dispute probability is flat or rising from same day routing through 14 to 29 days, at 8.4%, 9.1%, 9.8%, 10.1%, and 10.0%, and falls to 5.8% only beyond 30 days, a bin that holds 2.75% of complaints; nonmonetary relief follows the same path, at 11.7%, 13.5%, 12.3%, 13.8%, 13.7%, and 11.1%. For explanation only complaints the decline begins after two weeks, from 21.0% at 7 to 13 days to 18.0% at 14 to 29 days and 15.0% beyond, and for no relief it begins earlier and runs further, from 21.9% to 14.2%. The contrast between the last bin and the first is −2.5 points for monetary relief (−4.8 to −0.3), −0.7 for nonmonetary relief (−2.5 to 1.1), −7.1 for explanation (−8.2 to −6.1), and −7.7 for no relief (−10.4 to −4.9), and a joint test of the fifteen category by bin interactions rejects equality ( = 76.5, p = 3.1 × 10⁻¹⁰). The dispute rate of complaints closed with relief does not vary with routing delay across the range that covers 97% of complaints and declines modestly only beyond a month, whereas the dispute rate of complaints closed without relief declines steadily from the second week onward.
5.6. Heterogeneity Across Products
Table 9 reports the delay slopes by product. In six of the seven largest products the pattern of the full sample recurs: the slope for explanation only complaints is negative, between −0.95 (bank accounts) and −1.96 (debt collection) points per log day, and the slopes for the two relief categories are positive or indistinguishable from zero. Mortgages, 28.6% of the sample, are the exception: the explanation slope is −0.13 (−0.68 to 0.41) and the monetary relief slope −1.00 (−1.94 to −0.07). A pooled model with mortgage interactions on every term shows that both differences are statistically distinguishable from zero, 1.87 points for explanation (p < 0.001) and −1.34 for monetary relief (p = 0.003), with a joint test of the four mortgage by delay terms rejecting equality (p < 0.001), whereas the monetary relief coefficient itself (−2.3, SE 3.0, p = 0.44) and the timeliness association among explanations (−0.8, SE 0.8) do not differ. Table A9 in Appendix C shows that the reversal is a feature of the product rather than of a period, an issue, a channel, or a firm: the explanation slope is within 0.6 points of zero in both halves of the window, in each of the three largest issues, in web and in other submissions, and when each of the five largest servicers is dropped in turn, and the monetary relief slope is negative in both periods, in web submissions, in two of the three issues, and after dropping each large servicer. The product taxonomy did not change within the window. We offer one reading as an interpretation rather than a finding: a mortgage complaint concerns a continuing relationship in which a payment rarely closes the matter, so the response category is a weaker summary of what the consumer received than in card or collection complaints, where money usually discharges the grievance.
5.7. Additional Checks
Appendix C reports the remaining checks. The delay slopes are stable under eight variations of sample and functional form: the full set of 4,092 company effects, the exclusion of the recoded negative delays, of the largest firm, of 2012, of complaints closed with no relief, and of all channels but the web, delay measured in days, and an indicator for a delay of 14 days or more (Table A8). Characteristics determined before routing are balanced between long and short delays once channel is held fixed within firm by product by month cells (Table A7), logit average marginal effects preserve every ordering (Table A6), and the unadjusted gradient has the same ordering within each day of the week, is present within each submission channel, and is steeper among consumers who consented to publish a narrative, a mark of engagement recorded before routing, than among those who did not (Appendix A.2).
6. Discussion
6.1. Research Implications
The first implication concerns measurement. The CFPB database is the largest public complaint file in any industry and a standard source in finance research, where its fields serve as outcomes to be predicted (Sun et al., 2026; Wang et al., 2026) or as measures of service quality (Begley & Purnanandam, 2021; Hayes et al., 2021). Two of those fields cannot bear the readings sometimes placed on them: research that treats the timeliness flag as a measure of recovery speed, or the routing interval as a measure of how well a firm handled a complaint, will misattribute to firms variation that belongs to the agency’s intake process. The validated reconstruction of the dispute outcome from an archived vintage (Appendix B) makes a now discontinued field available for further work on the phase of the complaint process that follows the recovery (Van Vaerenbergh et al., 2019).
The second concerns field evidence on recovery substance. The association between relief and dispute is large and stable in a population of 737,010 real complaints, and its ordering, monetary relief below nonmonetary relief below explanation, matches the ordering of distributive justice in the meta analytic evidence (Gelbrich & Roschk, 2011; Orsingher et al., 2010). Its causal status is a different matter, since the amount of relief is not recorded and the data cannot say whether a consumer who received relief would have disputed an explanation. The sensitivity analysis bounds the confounding that would be needed to remove the association; it does not remove the possibility. Further research could exploit variation in relief that firms do not choose, such as relief thresholds written into enforcement consent orders, or pair the public file with firm records of the amounts paid.
The third concerns the dispute decision itself. The data speak to one component of the consumer’s wait, the administrative component before the company has seen the case. The negative gradient among complaints that received nothing has two readings that the file cannot separate. It could reflect disengagement, since the consumer must learn of the company’s response and return within 60 days to register a dispute (Section 3), or the attenuation of a grievance with time (Grégoire et al., 2009). Appendix A.2 shows that the simplest disengagement account does not fit: the gradient is steeper among consumers who revealed engagement at submission by consenting to publish a narrative and among web submitters, who face the lowest cost of returning. We report the failed test and leave the mechanism open; data on whether the consumer returned to the portal at all, which the public file does not contain, would separate the accounts.
The fourth is a scope condition. The mortgage reversal of Section 5 is a feature of the product rather than of a firm or a year, and further research could ask whether the association between relief and dispute depends on whether the failure occurs inside a continuing contract or in a discrete transaction.
6.2. Supervisory and Managerial Implications
Three implications follow, each stated with the limits of the evidence in mind. First, initial response timeliness, routing conditions, and consumer dispute indicators are three different quantities and should not be interpreted as interchangeable measures of service recovery quality. The timeliness flag records regulatory compliance in the initial response, which more than 97% of responses meet, and its untimely category is associated with fewer disputes; routing delay records the agency’s processing time; and the dispute rate records a voluntary act whose measured frequency falls with routing delay for reasons that cannot involve the company’s response. A supervisor who compares firms on dispute rates should therefore condition on routing delay and submission channel, or compare within delay bins, before drawing conclusions about conduct. A difference of one log day in routing delay is associated with a difference of about one point in the measured dispute rate of explanation only complaints, which is of the same order as many differences between firms, and both conditioning variables are in the public file for every complaint. This is an instance of the systemic controls over regulatory compliance risk that Jadwani et al. (2024) identify as a priority for the management of operational risk.
Second, the response category is associated with the dispute decision far more strongly than either timing field. We cannot establish that granting relief causes fewer disputes, and we do not advise firms to grant relief on that basis. The evidence does suggest where a firm should look if it wants to understand its own dispute rate: in what it gave, not in whether its initial response met the regulatory window. A firm with access to its own case records, which include the response date and the amount of relief that the public file lacks, can test the causal question directly, for example by randomizing the order in which otherwise similar complaints are handled or by exploiting internal thresholds for relief. The dispute decision is the kind of objective behavioral indicator that Hermansson et al. (2026) recommend banks combine with survey measures of satisfaction, and in register data on retail bank customers the return to satisfaction lies in avoiding its low end, which is where complaint handling operates.
Third, dispute indicators should be benchmarked within product. The relationship between routing delay and dispute differs across products and in mortgage complaints runs opposite to the rest of the sample, so a dispute rate that pools products compares firms with different product mixes on a measure whose relationship to the agency’s processing time differs across those products. The heterogeneity does not support a product specific recommendation about the speed of remedies, because routing delay is not the company’s response time; the defensible implication is that comparisons of dispute indicators across firms are informative within a product and not across products.
6.3. Limitations
Four limitations bound these conclusions, and the first is central: the response category is chosen by the company after it has seen the complaint, and the Bureau’s routing of the complaint may be related to characteristics of the complaint that we do not observe. The fixed effects, the severity index, the balance diagnostics, the placebo tests, and the within cell estimates make confounding by observed and text measurable characteristics unlikely, and the sensitivity analysis shows that removing the response category associations would require selection on unobservables several times as strong as selection on observables. None of this establishes the absence of residual confounding, and the delay gradient is more exposed to it than the response category associations: under proportional selection with a conservative bound on explained variance, the gradient among explanation only complaints does not survive the conservative bound (Section 5.5). Every estimate in the paper should be read as a conditional association, and the causal diagram in Section 4 states which assumptions a causal reading would require.
Second, because no company response date is recorded, neither timing field is the time a consumer waited for a resolution. The paper therefore cannot test whether company response time erodes the value of relief, and we have not claimed to; it describes how an administrative delay that the consumer experiences before the company is involved is associated with the decision to dispute. Proprietary case records with response dates, or administrative shocks to routing that shift waiting without shifting who complains, would allow the question the experimental literature poses to be asked in the field.
Third, the outcome is the observed decision to dispute the company’s response in the CFPB system, an action rather than a rating. A consumer who did not dispute may have been satisfied or may have disengaged (Section 2). Our conclusions concern differences in this observed decision across response categories and across delays, not levels of satisfaction, and the mechanism behind the delay gradient remains open.
Fourth, the sample is the population of published complaints against large institutions in the United States between June 2012 and April 2017, when the dispute option existed. Complaints about depository institutions below USD 10 billion in assets are not published, complaining is itself selected (Raval, 2020), and the Bureau notes that the database is not a statistical sample of consumer experiences. The estimates describe that population, and their generalization to other complaint channels, to later years, and to the population of service failures is uncertain.
7. Conclusions
The public record of a consumer complaint contains the company’s response category, a flag for whether its initial response met a regulatory deadline, and the interval the agency took to route the complaint. This study asked what those fields measure and how they relate to the consumer’s decision to dispute the response, using the complete population of 737,010 complaints against 4,092 financial institutions for which the dispute decision was recorded.
Three conclusions follow. First, neither timing field measures recovery speed: one is a compliance flag that varies for 2.4% of complaints, and the other is an administrative interval that the agency’s intake channel and calendar largely determine. Second, the response category is strongly associated with the dispute decision. Within the same firm, product, issue, and month, complaints closed with monetary relief are disputed 12.4 percentage points less often than complaints closed with an explanation, and complaints closed with nonmonetary relief 9.0 points less often; the association survives severity controls built from complaint narratives and would require selection on unobservables many times stronger than selection on observables to disappear, but the company chooses the category, and we report the estimate as an association. Third, routing delay is associated with fewer disputes among complaints in which the consumer received nothing, and with no change among complaints closed with monetary relief, a pattern that holds within firm by product by month by channel by category cells and that reverses in mortgage complaints. Because the delay occurs before the company has seen the case, the gradient belongs to the indicator, not to the company’s handling.
For supervisors and firms the implication is one of measurement: dispute rates compared across firms without conditioning on routing delay, channel, and product may reward firms whose complaints waited longest in the agency’s queue. For researchers the paper offers a measurement account of the largest public complaint database and a validated reconstruction of a discontinued outcome.
Author Contributions
Conceptualization, A.B.; methodology, A.B.; software, A.B. and A.N.K.; validation, A.N.K.; formal analysis, A.B.; investigation, A.B.; data curation, A.B. and A.N.K.; writing (original draft preparation), A.B.; writing (review and editing), A.B. and A.N.K.; visualization, A.B.; project administration, A.B. All authors have read and agreed to the published version of the manuscript.
Funding
This research received no external funding.
Institutional Review Board Statement
Not applicable. The study analyzes publicly available, anonymized administrative records and involved no interaction with human subjects.
Informed Consent Statement
Not applicable.
Data Availability Statement
The original data analyzed in this study are openly available from the Consumer Financial Protection Bureau’s Consumer Complaint Database at https://www.consumerfinance.gov/data-research/consumer-complaints/ and from the archived November 2019 vintage of the same database, which is publicly redistributed at https://www.kaggle.com/datasets/selener/consumer-complaint-database. Both are United States federal open data without redistribution restrictions. The processed datasets presented in this article, namely the analysis sample, the reconstructed dispute crosswalk, and the severity index, are not shared by the authors; they are derived entirely from the two public sources and can be regenerated from them by following Appendix B, which records the size and SHA-256 checksum of every source file, the extraction and join procedure, every exclusion rule and recoding, and the construction of every variable. The code used for extraction, reconstruction, and estimation will be made publicly available upon acceptance of the manuscript.
Acknowledgments
During the preparation of this work, the authors used ChatGPT, developed by OpenAI, to assist with the organization, language, clarity, and presentation of the manuscript. After using this tool, the authors reviewed, verified, and edited the content as needed and take full responsibility for the content of the publication.
Conflicts of Interest
The authors declare no conflicts of interest.
Abbreviations
The following abbreviations are used in this manuscript:
| AME | Average marginal effect |
| AUC | Area under the receiver operating characteristic curve |
| CFPB | Consumer Financial Protection Bureau |
| CI | Confidence interval |
| LPM | Linear probability model |
| pp | Percentage points |
| SD | Standard deviation |
| SE | Standard error |
| USD | United States dollars |
Appendix A. Additional Figure and Table
Appendix A.1. The Response Category Break
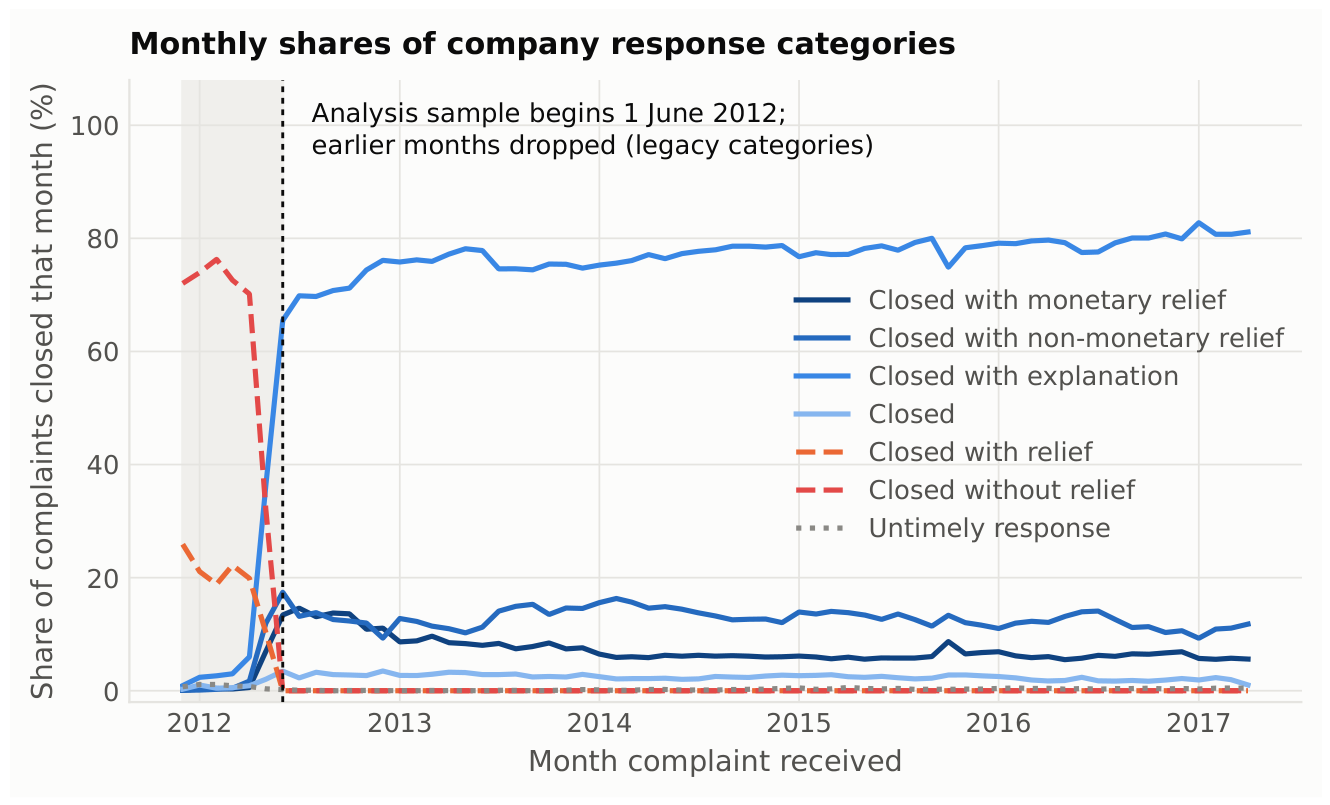
Figure A1 documents the change in the Bureau’s response categories that fixes the lower end of the analysis window. Through April 2012 companies classified almost every response under two legacy categories, closed without relief and closed with relief, which together account for between 90.1% and 97.9% of monthly closures; May 2012 is the transition month, and from June 2012 the legacy categories disappear, with only three complaints in the remaining 59 months carrying a legacy label. The legacy categories cannot be mapped onto the later scheme: closed with relief pools monetary and nonmonetary relief, and closed without relief pools closed with explanation and closed, so recoding the 28,821 complaints received before 1 June 2012 would assign each to a category the company never chose, and we drop them instead. The figure also shows that the mix of responses drifts over the harmonized period, with monetary relief falling from 13.0% of complaints in June to December 2012 to 6.1% in the final twelve months as credit reporting and debt collection complaints, which rarely end in monetary relief, grew from 4% to 44% of the file; calendar month effects enter every specification, so the estimates compare complaints received in the same month and are unaffected by this drift.
Figure A1.
Monthly shares of the company response categories among complaints received from December 2011 to April 2017. Solid lines are the four categories used from May 2012 onward; dashed lines are the two legacy categories; the dotted line is untimely response. The shaded region marks the months dropped from the analysis sample, which begins on 1 June 2012.
Figure A1.
Monthly shares of the company response categories among complaints received from December 2011 to April 2017. Solid lines are the four categories used from May 2012 onward; dashed lines are the two legacy categories; the dotted line is untimely response. The shaded region marks the months dropped from the analysis sample, which begins on 1 June 2012.
Appendix A.2. Unadjusted Delay Gradients by Engagement, Channel, and Day of Arrival
Table A1 reports three unadjusted contrasts that bear on the disengagement reading of the delay gradient discussed in Section 6 and on composition by day of arrival. In each panel the gradient is the dispute rate among complaints routed to the company after 14 days or more minus the dispute rate among complaints routed within 13 days, in percentage points; Panels A and B give the standard error of the difference between two proportions in parentheses. Panel A uses a variable determined before the delay is experienced. Since June 2015 the Bureau has asked consumers, at submission, whether they consent to publication of their narrative; consent is a costless act of engagement recorded before routing, so if long delays suppress disputes because consumers drop out, the gradient should be flatter among consumers who revealed engagement. Consumers who consented dispute more often at short delays, 22.07% against 17.54%, and their gradient is steeper, not flatter: −8.05 points against −4.77, a difference of 3.28 points (SE 0.66). Panel B uses the cost of returning to dispute. A consumer who submitted through the website is notified through the portal and can dispute from it, whereas a consumer who submitted by mail, telephone, fax, or referral is notified by mail and must take up a channel they did not use to complain; if disengagement drove the gradient it should be steepest where returning costs most, but the gradient is steepest for web submissions (−6.52 points on a base of 20.10%) and shallowest for postal mail and referral (−1.19 and −1.69).
Panel C recomputes the gradient inside each day of the week for the 508,194 web submissions, separately for the four response categories, because the day of arrival shifts routing delay mechanically and also shifts who complains. On every day of the week the steepest gradient belongs to complaints closed with an explanation or with no relief, and in six of the seven days at least one relief category shows a gradient less than half as large; Sunday is the exception only in precision, since its no relief and monetary relief cells hold 41 and 61 long delay complaints. The three panels reject the simplest disengagement account on its own terms and show that the gradient is not an artifact of composition by day. They do not establish an alternative: a grievance attenuation account, in which the intensity of a grievance decays with time and decays most where it was strongest, is consistent with all three panels, but the public file does not record whether a consumer returned to the portal, which is the observation that would separate the accounts.
Table A1.
Delay gradient by engagement proxy, submission channel, and day of the week (dispute rate at 14 or more days of routing delay minus rate below 14 days, percentage points; standard error in parentheses).
Table A1.
Delay gradient by engagement proxy, submission channel, and day of the week (dispute rate at 14 or more days of routing delay minus rate below 14 days, percentage points; standard error in parentheses).
| Panel A. Engagement revealed at submission: consent to publish a narrative (web complaints received from June 2015, n = 264,313) | ||||
| Dispute rate below 14 days | Gradient | |||
| Consent provided (n = 149,764) | 22.07% | −8.05 (0.43) | ||
| Consent not provided (n = 114,549) | 17.54% | −4.77 (0.50) | ||
| Panel B. Cost of returning to dispute: submission channel (all complaints received from June 2015, n = 363,326) | ||||
| Dispute rate below 14 days | Gradient | |||
| Web (n = 271,849) | 20.10% | −6.52 (0.32) | ||
| Fax (n = 4,638) | 14.45% | −5.60 (1.44) | ||
| Phone (n = 21,831) | 12.00% | −5.13 (0.73) | ||
| Referral (n = 43,982) | 13.13% | −1.69 (0.59) | ||
| Postal mail (n = 21,026) | 9.99% | −1.19 (0.65) | ||
| Panel C. Within a single day of arrival: web submissions, full window (n = 508,194), gradient only | ||||
| Monetary | Nonmonetary | Explanation | No relief | |
| Monday | −6.49 | −2.91 | −6.81 | −6.87 |
| Tuesday | −0.25 | −2.56 | −7.12 | −9.67 |
| Wednesday | −3.69 | −2.38 | −7.15 | −10.99 |
| Thursday | −4.04 | −1.63 | −8.71 | −8.58 |
| Friday | −4.15 | −3.96 | −6.45 | −10.28 |
| Saturday | 1.61 | −5.08 | −7.07 | −10.28 |
| Sunday | −3.60 | −6.80 | −6.85 | 0.30 |
| All days pooled | −3.07 | −3.13 | −7.26 | −9.15 |
Notes: Gradients are unadjusted differences in raw dispute rates. Panel A excludes 7,536 web complaints whose consent field records other, withdrawn, or missing. Panel B omits ten complaints submitted by email. In Panel C the number of long delay complaints in a cell ranges from 41 (Sunday, no relief) and 61 (Sunday, monetary relief) to 3,129 (Thursday, explanation); the pooled row has 1,121, 2,683, 16,857, and 1,032 long delay complaints in the four columns.
Appendix B. Data Construction and Codebook
Appendix B.1. Source Files, Extraction, and Validation
Table A2 lists the two source files with their sizes and SHA-256 checksums. The current export is the Bureau’s bulk download of the Consumer Complaint Database, obtained as a compressed comma separated file on 2 September 2026, with 17,491,758 complaint records and 16 fields: date received, product, sub-product, issue, sub-issue, consumer complaint narrative, company public response, company, state, ZIP code, tags, submitted via, date sent to company, company response to consumer, timely response, and complaint ID. In parsing, 125 records whose narrative text contained unbalanced quotation marks could not be read and were rejected. The archive is a complete vintage of the same file dated 5 November 2019, redistributed as a compressed archive containing a single file, rows.csv, with 18 fields, the 16 above plus consumer disputed and consumer consent provided; it was downloaded on 3 September 2026 and is used for those two fields only.
Table A2.
Source files.
| File | Details |
|---|---|
| complaints.csv | Current export, Consumer Complaint Database, Consumer Financial Protection Bureau. Downloaded 2 September 2026 from https://www.consumerfinance.gov/data-research/consumer-complaints/. 9,256,871,209 bytes; 17,491,758 records; 16 fields. SHA-256: 38e42a5f 1e48e357 63a0bd85 fba823c9 78d12370 4efb4b5c 95ac3843 13d32a83. |
| archive.zip | Compressed archive of the 5 November 2019 vintage of the same database, redistributed at https://www.kaggle.com/datasets/selener/consumer-complaint-database. Downloaded 3 September 2026. 184,119,866 bytes. SHA-256: a2ee5d14 aae1dba4 83e70ae9 4a96af7f 401a09fb 1011028f 44bc59a3 2138f453. |
| rows.csv (inside archive.zip) | 737,001,477 bytes; file date 5 November 2019; 18 fields. SHA-256: 70140497 35191295 2c36e3fd 80def521 0297df7a 0a49dbff c24e0bca 8abf6d71. |
Notes: Checksums are shown in groups of eight characters for legibility. The checksum of complaints.csv refers to the decompressed file.
From the current export we keep every record with a date received before 24 April 2017, the date on which the Bureau discontinued the dispute option (767,875 records), and from the archive we extract complaint ID, consumer disputed, and consumer consent provided for every record in the same window (768,501 records). We join the two on complaint ID. All but one of the export records find a match, giving 767,874 matched complaints; the 627 archive records without a match are complaints withdrawn by the Bureau after 2019 or among the 125 export records that could not be parsed. Panel A of Table A3 compares the two sources on the fields both carry, and Panel B logs the construction of the analysis sample.
Table A3.
Outcome recovery and sample construction.
| Panel A. Validation of the recovered dispute outcome against the current export | |
| Complaints in the current export received before 24 April 2017 | 767,875 |
| Complaints matched to the November 2019 archive on complaint identifier | 767,874 |
| Agreement on date received, date sent to company, and timely response flag | 100% (0 of 767,874 differ) |
| Agreement on company response category | 99.978% (168 differ) |
| Dispute indicator populated, by year of receipt | 100% in every year |
| Raw dispute rate among matched complaints | 19.32% |
| Panel B. Sample construction (complaints remaining after each step) | |
| Matched complaints received before 24 April 2017 | 767,874 |
| Drop complaints received before 1 June 2012 (legacy relief categories) and 3 residual legacy records | 739,050 |
| Drop responses recorded as in progress or untimely response | 737,010 |
| Drop missing dispute indicator, timeliness flag, company, or product | 737,010 |
| Recode 7,018 one day negative routing delays to zero (clerical artifact) | 737,010 |
| Analysis sample; firms after name standardization (from 4,110 raw strings) | 737,010; 4,092 |
Notes: Response category differences in Panel A are Bureau revisions made after 2019. Negative routing delays arise when the date sent to the company precedes the date received by one day; they overrepresent debt collection and credit reporting complaints, so dropping them would skew the product mix, and Table A8 drops them instead as a robustness check.
Appendix B.2. Exclusion Rules, Recodings, and Category Mapping
The rules are, in order: (1) drop complaints received before 1 June 2012, when companies used the legacy categories closed with relief and closed without relief, together with three later records that carry a legacy label (28,824 records; Appendix A.1); (2) drop complaints whose response is recorded as in progress or untimely response, which are not final response categories (2,040 records); (3) drop complaints with a missing dispute indicator, timeliness flag, company, or product (none); (4) recode the 7,018 complaints whose date sent to company precedes the date received by exactly one day to a routing delay of zero. Company names are standardized by converting to upper case, removing punctuation, and stripping trailing corporate designators (such as Inc., LLC, N.A., Corporation, Company, Holdings, and National Association) on word boundaries, after which every merge of two raw strings was inspected by hand; the procedure maps 4,110 raw company strings to 4,092 firms. Missing consumer tags are set to none, and complaints with a missing state (5,754) are retained and dropped by the estimator when state effects enter. In the harmonized window the Bureau’s labels and counts are closed with explanation (574,529 complaints, 77.74%), closed with non-monetary relief (94,388, 12.77%), closed with monetary relief (50,778, 6.87%), closed (17,315, 2.34%), and untimely response (2,040, 0.28%, excluded; no in progress records remain in the window); the first four map one to one onto the labels explanation only, nonmonetary relief, monetary relief, and no relief used in the analysis.
Appendix B.3. Codebook
Table A4 lists every variable used in the analysis with its source field and construction.
Table A4.
Codebook.
| Variable | Source field | Construction and values |
|---|---|---|
| Complaint identifier | Complaint ID (both files) | Join key. |
| Consumer dispute | Consumer disputed? (archive) | 1 if Yes, 0 if No. Populated for all matched records. |
| Response category | Company response to consumer (export) | Closed with monetary relief; closed with non-monetary relief; closed with explanation; closed. In progress and untimely response excluded. |
| Initial response timeliness | Timely response? (export) | 1 if Yes, 0 if No. |
| Date received, date sent | Date received; Date sent to company (export) | Calendar dates. |
| CFPB routing delay | Derived | Date sent minus date received, in days; one day negative values recoded to zero; range 0 to 1,754 days. Log form is . Bins: 0, 1 to 2, 3 to 6, 7 to 13, 14 to 29, 30 or more. |
| Product, issue | Product; Issue (export) | 13 product and 99 issue labels as recorded in the current export. |
| Submission channel | Submitted via (export) | Web, Referral, Phone, Postal mail, Fax, Email. |
| State | State (export) | 62 values including territories; missing for 5,754 complaints. |
| Consumer tag | Tags (export) | Older American; Servicemember; Older American, Servicemember; none (missing recoded). |
| Day of week | Derived from date received | Monday to Sunday. |
| Calendar month | Derived from date received | 59 months, June 2012 to April 2017. |
| Receipt week, routing week, receipt day | Derived from date received and date sent | Calendar weeks beginning on Monday (256 receipt weeks, 302 routing weeks) and calendar day of receipt (1,787 days). |
| Firm | Company (export) | Standardized firm name; 4,092 firms. Company effects for the 677 firms with at least 50 complaints; others pooled. |
| Consent to publish narrative | Consumer consent provided? (archive) | Consent provided; consent not provided; other; withdrawn; not applicable (asked from June 2015). |
| Narrative text | Consumer complaint narrative (export) | Text with Bureau redactions; present for 163,038 complaints. |
| Severity index | Derived from narrative text | See Appendix B.4. Standardized to unit variance. |
| Weekly intake | Derived | Complaints received Bureau wide in the calendar week, excluding the focal product (Table 2, Panel C). |
Appendix B.4. Severity Index and Software
The severity index is constructed on the 163,038 complaints with a published narrative. Narratives are converted to lower case and tokenized; tokens that appear in any standardized company name are removed from the vocabulary; and term frequency inverse document frequency features are formed over unigrams and bigrams. The target is an indicator for monetary relief, residualized on company by product cells so that the index captures within firm, within product variation. A ridge regression of the residualized target on the features is fitted in five folds, and each complaint’s index is the prediction from the four folds that exclude it; a first version without the vocabulary restriction reached an out of fold area under the curve of 0.91 but recovered firm and card program names, and the restricted index reaches 0.748. The index is standardized to unit variance before entering the regressions in Section 5.4. The eight writing style proxies used in the diagnostics are the log of the word count, the number of sentences, the mean word length, the share of upper case characters, the share of digits, the number of redaction markers, the number of exclamation marks, and the number of dollar signs.
All processing and estimation were carried out in Python 3.11 with pandas 3.0, NumPy 2.4, and SciPy 1.17. Linear models with high dimensional fixed effects were estimated with pyfixest 0.60, with the fixed effect tolerance set to and cluster robust standard errors of the CR1 type; two way clustered standard errors follow Cameron et al. (2011). Logit models with indicator variables were estimated with statsmodels 0.15, the fixed effects logit with pyfixest, and the severity index with scikit-learn 1.8. Figures were produced with Matplotlib 3.10.
Appendix C. Additional Estimates
Appendix C.1. Two Way Clustered Standard Errors
Table A5 reports the standard errors of every response category and timing coefficient in the main specifications under clustering by company and under two way clustering by company and receipt week, by company and routing week, and by company and receipt day (Cameron et al., 2011). The two way standard errors are larger than the company clustered standard errors for most of the delay terms and smaller for some of the response category terms; in no case do they differ by more than 13%, the largest change being the delay slope among complaints closed with monetary relief, from 0.190 to 0.213, and no inference in the paper depends on which is used.
Table A5.
Standard errors under company clustering and two way clustering by company and calendar unit (percentage points).
Table A5.
Standard errors under company clustering and two way clustering by company and calendar unit (percentage points).
| Standard error, clustered by | |||||
|---|---|---|---|---|---|
| Coefficient | Estimate | Company | Company and receipt week | Company and routing week | Company and receipt day |
| Column (5): main effects | |||||
| Monetary relief | −12.396 | 0.492 | 0.505 | 0.508 | 0.493 |
| Nonmonetary relief | −8.967 | 0.895 | 0.898 | 0.898 | 0.896 |
| No relief | −0.697 | 0.660 | 0.646 | 0.651 | 0.656 |
| Timely initial response | 6.684 | 0.526 | 0.529 | 0.527 | 0.528 |
| log(1 + routing delay) | −0.976 | 0.117 | 0.125 | 0.124 | 0.119 |
| Column (6): interactions | |||||
| Monetary relief | −7.272 | 1.033 | 1.003 | 0.998 | 1.001 |
| Nonmonetary relief | −4.622 | 1.262 | 1.259 | 1.266 | 1.264 |
| No relief | 2.298 | 1.061 | 0.957 | 1.002 | 1.047 |
| Timely initial response | 7.641 | 0.483 | 0.493 | 0.488 | 0.486 |
| log(1 + routing delay) | −1.237 | 0.156 | 0.162 | 0.161 | 0.158 |
| Monetary × timely | −6.457 | 0.948 | 0.916 | 0.893 | 0.919 |
| Nonmonetary × timely | −5.590 | 1.128 | 1.122 | 1.132 | 1.134 |
| No relief × timely | −2.683 | 1.092 | 1.050 | 1.024 | 1.086 |
| Monetary × log delay | 1.595 | 0.265 | 0.277 | 0.269 | 0.269 |
| Nonmonetary × log delay | 1.489 | 0.313 | 0.314 | 0.315 | 0.313 |
| No relief × log delay | −0.422 | 0.388 | 0.377 | 0.384 | 0.389 |
| Slope of dispute in log delay by response category (delay interaction specification) | |||||
| Explanation only | −1.241 | 0.156 | 0.163 | 0.161 | 0.158 |
| Monetary relief | 0.374 | 0.190 | 0.213 | 0.210 | 0.196 |
| Nonmonetary relief | 0.267 | 0.212 | 0.212 | 0.216 | 0.211 |
| No relief | −1.646 | 0.351 | 0.337 | 0.347 | 0.352 |
Notes: Two way standard errors follow Cameron et al. (2011). Receipt week and routing week are the calendar weeks in which the Bureau received (256 weeks) and transmitted (302 weeks) the complaint; receipt day has 1,787 values. Clusters by company number 4,092.
Appendix C.2. Logit Average Marginal Effects
The linear probability model of Section 4 explains 3.9% of the variance of dispute, 1.0% within the fixed effects. Table A6 compares its estimates with the average marginal effects of logit models. A logit with product, channel, tag, day of week, and calendar month indicators on the full sample gives −11.7 points for monetary relief and −9.5 for nonmonetary relief, against −13.8 and −10.4 from the linear model with the same controls, and a logit with the full set of fixed effects, estimated by iteratively reweighted least squares with the fixed effects projected out at each iteration, gives −15.0 and −11.1. The ordering of the delay slopes across response categories, and the finding that the slopes for the relief categories are not distinguishable from zero while the slopes for explanation and no relief are negative, do not depend on the link function.
Table A6.
Linear probability estimates and logit average marginal effects (percentage points).
| Product, channel, tag, weekday, | Full fixed effects | |||
|---|---|---|---|---|
| and month indicators | ||||
| Linear | Logit AME | Linear | Logit AME | |
| Monetary relief | −13.82 | −11.65 | −13.63 | −15.00 |
| Nonmonetary relief | −10.35 | −9.54 | −10.14 | −11.13 |
| No relief | 0.71 | 0.73 | −0.22 | −0.17 |
| Timely initial response | 6.14 | 6.08 | 6.68 | 7.38 |
| Delay slope, explanation only | −1.27 | −1.29 | −1.24 | −1.16 |
| Delay slope, monetary relief | 0.44 | 0.05 | 0.37 | 0.07 |
| Delay slope, nonmonetary relief | 0.22 | −0.07 | 0.27 | −0.01 |
| Delay slope, no relief | −2.14 | −2.27 | −1.65 | −1.64 |
| Observations | 737,010 | 737,010 | 731,254 | 731,243 |
Notes: All models use the delay interaction specification; the linear column of the second block is the full sample reference row of Table 6, Panel B. Logit average marginal effects in the first block are computed over the sample from a maximum likelihood logit with indicator variables. The full fixed effects logit adds issue, state, and company effects; its average marginal effects are the coefficients scaled by the mean of , and eleven observations in fixed effect groups without variation in the outcome are dropped. Response category coefficients in the interaction specification are evaluated at zero routing delay.
Appendix C.3. Balance of Characteristics Determined Before Routing
Assumption 1 cannot be tested, but characteristics determined before routing can be checked for balance. Table A7 compares complaints routed after 14 days or more with complaints routed sooner within firm by product by month cells. The submission channel is strongly imbalanced, as expected: within a cell, long delay complaints are 31.5 points less likely to have arrived through the web and 16.6 and 12.7 points more likely to have arrived by mail or referral, because paper must be entered before it can be routed. Every specification controls for channel, and within firm by product by month by channel cells the remaining characteristics are balanced: complaints from older consumers and from servicemembers differ by 0.1 and 0.2 points, consent to publish a narrative by 0.3 points, arrival on a weekend or a Friday by −0.4 and 0.6 points, and the three largest issue categories by between −1.1 and 1.0 points, of which only the share of mortgage servicing complaints (−1.05, SE 0.47) is distinguishable from zero; issue effects enter every specification. Balance on these characteristics is consistent with Assumption 1 and does not establish it.
Table A7.
Balance of characteristics determined before routing: complaints routed after 14 days or more minus complaints routed sooner (percentage points; SE clustered by company).
Table A7.
Balance of characteristics determined before routing: complaints routed after 14 days or more minus complaints routed sooner (percentage points; SE clustered by company).
| Characteristic | Sample mean | Within firm × product × month | Within firm × product × month × channel |
|---|---|---|---|
| Submitted through the web | 69.0 | −31.5 (8.5) | |
| Submitted by postal mail | 6.4 | 16.6 (5.4) | |
| Submitted by referral | 16.4 | 12.7 (3.2) | |
| Submitted by telephone | 6.7 | 0.8 (0.4) | |
| Older consumer tag | 9.2 | 0.1 (0.4) | 0.1 (0.5) |
| Servicemember tag | 6.2 | −0.7 (0.3) | 0.2 (0.2) |
| Received on a weekend | 10.3 | −4.5 (0.9) | −0.4 (0.3) |
| Received on a Friday | 16.6 | 1.7 (0.6) | 0.6 (0.3) |
| Consent to publish a narrative | 22.1 | −5.4 (0.3) | 0.3 (0.3) |
| Issue: loan modification, collection, foreclosure | 14.0 | 1.4 (0.8) | 1.0 (0.8) |
| Issue: incorrect information on credit report | 13.9 | 5.0 (2.0) | 0.5 (0.3) |
| Issue: loan servicing, payments, escrow account | 9.9 | −1.2 (0.6) | −1.1 (0.5) |
Notes: Each entry is the coefficient on an indicator for a routing delay of 14 days or more in a regression of the characteristic
on that indicator with the stated cell effects. Channel cannot be compared within channel cells. The sample contains 45,061
complaints with a delay of 14 days or more.
Appendix C.4. Fixed Effect, Sample, and Functional Form Variants and Placebo Tests
Table A8 collects the variants of the delay slopes summarized in Section 5. Panel A replaces the time or company effects of the baseline. Panel B varies the sample and the functional form. Panel C reports placebo tests: each draws one random permutation of log routing delay within a stated group, so that the group’s mean delay is preserved and the link between delay and the individual complaint is removed, and reestimates the delay interaction specification. A placebo slope near zero means that the composition the group preserves does not produce the gradient; a placebo slope different from zero means that the baseline fixed effects do not fully absorb that composition. The two finest reshuffles under the baseline fixed effects are not zero because delay and dispute both differ by channel within a firm’s monthly caseload, which the baseline holds fixed only additively; under the firm by product by month by channel by category cells of the last row of Panel A the placebo is zero, which is why Section 5.5 regards those estimates as the cleanest.
Table A8.
Delay slope by response category under alternative fixed effects, samples, functional forms, and placebo reshuffles (percentage points per log day; SE clustered by company).
Table A8.
Delay slope by response category under alternative fixed effects, samples, functional forms, and placebo reshuffles (percentage points per log day; SE clustered by company).
| Variant | n | Monetary | Nonmonetary | Explanation | No relief |
|---|---|---|---|---|---|
| Panel A. Fixed effects | |||||
| Baseline: product, issue, channel, state, tag, weekday, month, company | 731,254 | 0.37 (0.19) | 0.27 (0.21) | −1.24 (0.16) | −1.65 (0.35) |
| Receipt week effects instead of month | 731,254 | 0.36 (0.19) | 0.26 (0.21) | −1.25 (0.16) | −1.63 (0.35) |
| Receipt day effects instead of month | 731,254 | 0.37 (0.18) | 0.26 (0.21) | −1.24 (0.16) | −1.60 (0.36) |
| Firm × product × month cells | 715,333 | 0.56 (0.22) | 0.27 (0.21) | −1.20 (0.18) | −1.81 (0.34) |
| Firm × product × month cells, receipt day effects | 715,333 | 0.55 (0.22) | 0.26 (0.21) | −1.21 (0.18) | −1.78 (0.34) |
| Firm × product × month × channel cells | 690,760 | 0.25 (0.24) | 0.42 (0.28) | −1.23 (0.17) | −1.78 (0.34) |
| Firm × product × month × channel × category cells | 671,841 | −0.01 (0.23) | −0.49 (0.13) | −1.10 (0.16) | −1.84 (0.42) |
| Same, with receipt day effects | 671,841 | −0.03 (0.23) | −0.50 (0.13) | −1.09 (0.17) | −1.83 (0.43) |
| Panel B. Sample and functional form (baseline fixed effects) | |||||
| All 4,092 company effects (no pooling) | 730,313 | 0.43 (0.19) | 0.26 (0.21) | −1.21 (0.16) | −1.53 (0.36) |
| Drop the 7,018 negative delay complaints | 724,249 | 0.36 (0.20) | 0.26 (0.22) | −1.24 (0.15) | −1.62 (0.35) |
| Exclude the largest firm | 672,632 | 0.33 (0.21) | 0.14 (0.21) | −1.25 (0.17) | −1.68 (0.37) |
| Exclude 2012 | 685,627 | 0.74 (0.21) | 0.23 (0.18) | −1.25 (0.15) | −1.76 (0.35) |
| Web submissions only | 506,512 | −0.30 (0.26) | −0.38 (0.28) | −1.34 (0.16) | −1.82 (0.39) |
| Exclude complaints closed with no relief | 714,118 | 0.36 (0.19) | 0.27 (0.21) | −1.25 (0.15) | |
| Delay in raw days (slope per day) | 731,254 | −0.02 (0.01) | 0.00 (0.01) | −0.06 (0.01) | −0.07 (0.02) |
| Indicator for delay of 14 days or more | 731,254 | −0.70 (0.85) | 0.54 (0.86) | −4.82 (0.50) | −4.95 (1.04) |
| Panel C. Placebo: routing delay reshuffled at random within the stated group | |||||
| Within calendar month (baseline fixed effects) | 731,254 | −0.23 (0.12) | −0.02 (0.19) | 0.11 (0.05) | 0.40 (0.29) |
| Within receipt day (baseline fixed effects) | 731,254 | −0.04 (0.14) | 0.22 (0.27) | 0.07 (0.05) | −0.01 (0.29) |
| Within firm × product × month (baseline fixed effects) | 731,254 | −0.42 (0.17) | 0.26 (0.25) | −0.15 (0.08) | −0.34 (0.29) |
| Within firm × product × month × channel (baseline fixed effects) | 731,254 | 0.67 (0.18) | 0.62 (0.19) | −0.44 (0.10) | −0.41 (0.35) |
| Within receipt day × channel × product (baseline fixed effects) | 731,254 | 0.53 (0.18) | 0.57 (0.19) | −0.32 (0.08) | −0.60 (0.31) |
| Within firm × product × month × channel (cells × category and receipt day effects) | 671,841 | 0.02 (0.21) | −0.10 (0.22) | 0.01 (0.06) | 0.22 (0.47) |
Notes: Each row reestimates the delay interaction specification with the stated change and reports the slope of dispute in log(1 + routing delay) within each response category; the raw days row reports the slope per day, and the indicator row the coefficient on a delay of 14 days or more. In Panel A the cell rows replace the calendar month and company effects by the stated cells, with issue, channel, state, tag, and day of week effects retained (channel is absorbed where the cell includes it); cells that include the category absorb the response category main effects, and cells with a single complaint are dropped. The largest firm accounts for 8.0% of complaints. Placebo standard errors are conditional on the permutation.
Appendix C.5. Mortgage Complaints by Period, Issue, Channel, and Firm
Table A9 reestimates the delay interaction specification on subsamples of the 209,569 mortgage complaints; each row includes issue, channel, state, tag, day of week, calendar month, and company effects within the subsample.
Table A9.
Delay slope by response category in mortgage complaints, by subsample (percentage points; 95% confidence interval clustered by company).
Table A9.
Delay slope by response category in mortgage complaints, by subsample (percentage points; 95% confidence interval clustered by company).
| Subsample | n | Monetary | Nonmonetary | Explanation | No relief |
|---|---|---|---|---|---|
| All mortgage complaints | 209,569 | −1.00 [−1.94, −0.07] | 0.28 [−0.49, 1.05] | −0.13 [−0.68, 0.41] | −1.45 [−2.54, −0.36] |
| Received 2012 to 2014 | 115,211 | −1.10 [−2.34, 0.13] | 0.25 [−0.16, 0.66] | −0.19 [−0.88, 0.50] | −1.07 [−3.00, 0.87] |
| Received 2015 to 2017 | 94,332 | −0.47 [−1.92, 0.98] | 0.20 [−1.46, 1.86] | 0.13 [−0.24, 0.50] | −1.51 [−2.85, −0.17] |
| Issue: loan modification, collection, foreclosure | 102,587 | 0.55 [−1.49, 2.59] | 0.02 [−0.36, 0.40] | −0.39 [−0.95, 0.17] | −0.76 [−2.60, 1.08] |
| Issue: loan servicing, payments, escrow account | 72,450 | −0.80 [−2.35, 0.74] | 0.57 [−1.58, 2.71] | 0.59 [0.08, 1.10] | −0.94 [−2.20, 0.32] |
| Issue: application, originator, mortgage broker | 15,841 | −2.53 [−4.43, −0.63] | 3.14 [0.74, 5.54] | −0.31 [−1.40, 0.78] | −1.77 [−4.90, 1.37] |
| Web submissions | 123,674 | −1.76 [−2.88, −0.65] | 0.27 [−0.60, 1.14] | −0.19 [−0.99, 0.62] | −1.53 [−2.74, −0.32] |
| Other submission channels | 85,874 | −0.19 [−1.80, 1.41] | −0.58 [−1.52, 0.36] | 0.04 [−0.29, 0.37] | −0.25 [−2.51, 2.01] |
| Five largest servicers | 116,472 | −0.86 [−2.97, 1.26] | 0.78 [0.51, 1.05] | −0.09 [−1.04, 0.85] | −2.08 [−3.29, −0.88] |
| All other firms | 93,094 | −1.07 [−2.12, −0.02] | −1.03 [−2.12, 0.05] | −0.14 [−0.56, 0.28] | −0.86 [−2.45, 0.73] |
| Excluding Bank of America | 174,782 | −1.19 [−2.16, −0.21] | −0.81 [−1.72, 0.09] | 0.20 [−0.12, 0.52] | −1.42 [−2.64, −0.20] |
| Excluding Wells Fargo | 181,751 | −0.74 [−1.60, 0.12] | 0.26 [−0.51, 1.04] | −0.25 [−0.76, 0.26] | −1.46 [−2.57, −0.36] |
| Excluding Ocwen | 187,673 | −0.96 [−1.92, 0.00] | 0.21 [−0.58, 1.01] | −0.20 [−0.76, 0.35] | −1.29 [−2.64, 0.06] |
| Excluding JPMorgan Chase | 193,151 | −1.10 [−2.12, −0.08] | 0.34 [−0.39, 1.06] | −0.18 [−0.73, 0.37] | −1.17 [−2.20, −0.14] |
| Excluding Nationstar | 194,015 | −1.06 [−1.99, −0.12] | 0.27 [−0.52, 1.06] | −0.16 [−0.73, 0.40] | −1.52 [−2.67, −0.36] |
Notes: The five largest mortgage servicers by complaint volume in the sample are Bank of America, Wells Fargo, Ocwen Financial, JPMorgan Chase, and Nationstar Mortgage. The Bureau’s product and issue taxonomy for mortgages did not change within the window; it was revised in April 2017, after the dispute option was discontinued.
Appendix C.6. Support for the Routing Delay Bins
Table A10 reports the complaints, firms, unadjusted dispute rate, and predicted dispute probability in each response category by routing delay bin cell underlying Figure 3.
Table A10.
Complaints, firms, and unadjusted dispute rates by response category and routing delay bin.
Table A10.
Complaints, firms, and unadjusted dispute rates by response category and routing delay bin.
| Routing delay (days) | 0 | 1 to 2 | 3 to 6 | 7 to 13 | 14 to 29 | 30 or more |
|---|---|---|---|---|---|---|
| Panel A. Complaints (firms) | ||||||
| Monetary relief | 24,132 (561) | 11,415 (316) | 11,273 (395) | 2,226 (228) | 1,087 (193) | 645 (301) |
| Nonmonetary relief | 52,013 (784) | 14,376 (461) | 16,135 (555) | 4,761 (377) | 4,461 (333) | 2,642 (404) |
| Explanation only | 284,733 (2,579) | 105,154 (1,827) | 119,165 (2,169) | 30,847 (1,686) | 18,551 (1,747) | 16,079 (2,478) |
| No relief | 7,163 (787) | 3,281 (415) | 3,994 (552) | 1,281 (326) | 680 (297) | 916 (406) |
| Panel B. Unadjusted dispute rate (%) | ||||||
| Monetary relief | 10.94 | 10.25 | 10.41 | 11.05 | 7.82 | 7.75 |
| Nonmonetary relief | 11.52 | 13.05 | 11.55 | 12.41 | 8.43 | 8.02 |
| Explanation only | 22.81 | 20.63 | 20.19 | 19.95 | 15.09 | 13.57 |
| No relief | 23.64 | 20.94 | 18.95 | 16.47 | 16.18 | 12.88 |
| Panel C. Predicted dispute probability (%), binned specification (Figure 3) | ||||||
| Monetary relief | 8.4 | 9.1 | 9.8 | 10.1 | 10.0 | 5.8 |
| Nonmonetary relief | 11.7 | 13.5 | 12.3 | 13.8 | 13.7 | 11.1 |
| Explanation only | 22.1 | 20.9 | 20.9 | 21.0 | 18.0 | 15.0 |
| No relief | 21.9 | 20.5 | 19.9 | 18.3 | 17.8 | 14.2 |
Notes: Panel C reports the predictions plotted in Figure 3, from the column (6) specification with response category by delay bin interactions and the full set of fixed effects, at the sample means of the other covariates. The contrast between the last bin and the first is −2.53 [−4.80, −0.26] for monetary relief, −0.69 [−2.52, 1.14] for nonmonetary relief, −7.12 [−8.19, −6.05] for explanation only, and −7.65 [−10.40, −4.91] for no relief (95% intervals clustered by company and receipt week).
References
- Adams, J. S. 1965. Inequity in social exchange. In Advances in experimental social psychology. Edited by L. Berkowitz. New York: Academic Press, Vol. 2, pp. 267–299. [Google Scholar] [CrossRef]
- Anderson, E. W., and M. W. Sullivan. 1993. The antecedents and consequences of customer satisfaction for firms. Marketing Science 12, 2: 125–143. [Google Scholar] [CrossRef]
- Angrist, J. D., and J.-S. Pischke. 2009. Mostly harmless econometrics: An empiricist’s companion. Princeton, NJ: Princeton University Press. [Google Scholar]
- Ayres, I., J. Lingwall, and S. Steinway. 2013. Skeletons in the database: An early analysis of the CFPB’s consumer complaints. Fordham Journal of Corporate and Financial Law 19, 2: 343–382. [Google Scholar]
- Begley, T. A., and A. Purnanandam. 2021. Color and credit: Race, regulation, and the quality of financial services. Journal of Financial Economics 141, 1: 48–65. [Google Scholar] [CrossRef]
- Bies, R. J., and J. S. Moag. 1986. Interactional justice: Communication criteria of fairness. In Research on negotiation in organizations. Edited by R. J. Lewicki, B. H. Sheppard and M. H. Bazerman. Greenwich, CT: JAI Press, Vol. 1, pp. 43–55. [Google Scholar]
- Bitner, M. J., B. H. Booms, and M. S. Tetreault. 1990. The service encounter: Diagnosing favorable and unfavorable incidents. Journal of Marketing 54, 1: 71–84. [Google Scholar] [CrossRef]
- Blodgett, J. G., D. J. Hill, and S. S. Tax. 1997. The effects of distributive, procedural, and interactional justice on postcomplaint behavior. Journal of Retailing 73, 2: 185–210. [Google Scholar] [CrossRef]
- Bolton, R. N. 1998. A dynamic model of the duration of the customer’s relationship with a continuous service provider: The role of satisfaction. Marketing Science 17, 1: 45–65. [Google Scholar] [CrossRef]
- Boshoff, C. 1997. An experimental study of service recovery options. International Journal of Service Industry Management 8, 2: 110–130. [Google Scholar] [CrossRef]
- Buell, R. W. 2021. Last-place aversion in queues. Management Science 67, 3: 1430–1452. [Google Scholar] [CrossRef]
- Buell, R. W., T. Kim, and C.-J. Tsay. 2017. Creating reciprocal value through operational transparency. Management Science 63, 6: 1673–1695. [Google Scholar] [CrossRef]
- Camerer, C. F., A. Dreber, E. Forsell, T.-H. Ho, J. Huber, M. Johannesson, M. Kirchler, J. Almenberg, A. Altmejd, T. Chan, E. Heikensten, F. Holzmeister, T. Imai, S. Isaksson, G. Nave, T. Pfeiffer, M. Razen, and H. Wu. 2016. Evaluating replicability of laboratory experiments in economics. Science 351, 6280: 1433–1436. [Google Scholar] [CrossRef] [PubMed]
- Cameron, A. C., J. B. Gelbach, and D. L. Miller. 2011. Robust inference with multiway clustering. Journal of Business & Economic Statistics 29, 2: 238–249. [Google Scholar] [CrossRef]
- Cameron, A. C., and D. L. Miller. 2015. A practitioner’s guide to cluster-robust inference. Journal of Human Resources 50, 2: 317–372. [Google Scholar] [CrossRef]
- Campbell, J. Y., H. E. Jackson, B. C. Madrian, and P. Tufano. 2011. Consumer financial protection. Journal of Economic Perspectives 25, 1: 91–114. [Google Scholar] [CrossRef] [PubMed]
- Cardoso, A., and M. Cardoso. 2024. Bank reputation and trust: Impact on client satisfaction and loyalty for Portuguese clients. Journal of Risk and Financial Management 17, 7: 277. [Google Scholar] [CrossRef]
- Chernozhukov, V., D. Chetverikov, M. Demirer, E. Duflo, C. Hansen, W. Newey, and J. Robins. 2018. Double/debiased machine learning for treatment and structural parameters. The Econometrics Journal 21, 1: C1–C68. [Google Scholar] [CrossRef]
- Consumer Financial Protection Bureau. 2017. Consumer Response annual report: January 1 to December 31, 2016. Available online: https://www.consumerfinance.gov/data-research/research-reports/2016-consumer-response-annual-report/ (accessed on 5 September 2026).
- Consumer Financial Protection Bureau. 2019. Consumer complaint database, archived export of november 2019 (redistributed via catalog.data.gov and kaggle). Available online: https://www.kaggle.com/datasets/selener/consumer-complaint-database (accessed on 3 September 2026).
- Consumer Financial Protection Bureau. 2026a. Consumer complaint database. Available online: https://www.consumerfinance.gov/data-research/consumer-complaints/ (accessed on 2 September 2026).
- Consumer Financial Protection Bureau. 2026b. Consumer complaint database API documentation: Release notes. Available online: https://cfpb.github.io/api/ccdb/release-notes.html (accessed on 3 September 2026).
- Davidow, M. 2003. Organizational responses to customer complaints: What works and what doesn’t. Journal of Service Research 5, 3: 225–250. [Google Scholar] [CrossRef]
- Fornell, C., and B. Wernerfelt. 1987. Defensive marketing strategy by customer complaint management: A theoretical analysis. Journal of Marketing Research 24, 4: 337–346. [Google Scholar] [CrossRef]
- Gelbrich, K., and H. Roschk. 2011. A meta-analysis of organizational complaint handling and customer responses. Journal of Service Research 14, 1: 24–43. [Google Scholar] [CrossRef]
- Gentzkow, M., B. Kelly, and M. Taddy. 2019. Text as data. Journal of Economic Literature 57, 3: 535–574. [Google Scholar] [CrossRef]
- Grégoire, Y., T. M. Tripp, and R. Legoux. 2009. When customer love turns into lasting hate: The effects of relationship strength and time on customer revenge and avoidance. Journal of Marketing 73, 6: 18–32. [Google Scholar] [CrossRef]
- Hart, C. W. L., J. L. Heskett, and W. E. Sasser. 1990. The profitable art of service recovery. Harvard Business Review 68, 4: 148–156. [Google Scholar] [PubMed]
- Hayes, R. M., F. Jiang, and Y. Pan. 2021. Voice of the customers: Local trust culture and consumer complaints to the CFPB. Journal of Accounting Research 59, 3: 1077–1121. [Google Scholar] [CrossRef]
- Hermansson, C., K. Eriksson, and C. Segerlind. 2026. Exploring nonlinear relationships between individual-level bank customer satisfaction and revenue. Journal of Risk and Financial Management 19, 6: 397. [Google Scholar] [CrossRef]
- Hernán, M. A., and J. M. Robins. 2020. Causal inference: What if. Boca Raton, FL: Chapman & Hall/CRC. [Google Scholar]
- Hirschman, A. O. 1970. Exit, voice, and loyalty: Responses to decline in firms, organizations, and states. Cambridge, MA: Harvard University Press. [Google Scholar]
- Hogreve, J., N. Bilstein, and L. Mandl. 2017. Unveiling the recovery time zone of tolerance: When time matters in service recovery. Journal of the Academy of Marketing Science 45, 6: 866–883. [Google Scholar] [CrossRef]
- Homburg, C., and A. Fürst. 2005. How organizational complaint handling drives customer loyalty: An analysis of the mechanistic and the organic approach. Journal of Marketing 69, 3: 95–114. [Google Scholar] [CrossRef]
- Hui, M. K., and D. K. Tse. 1996. What to tell consumers in waits of different lengths: An integrative model of service evaluation. Journal of Marketing 60, 2: 81–90. [Google Scholar] [CrossRef]
- Imbens, G. W., and D. B. Rubin. 2015. Causal inference for statistics, social, and biomedical sciences: An introduction. New York, NY: Cambridge University Press. [Google Scholar]
- Jadwani, B., S. Parkhi, and P. K. Mitra. 2024. Operational risk management in banks: A bibliometric analysis and opportunities for future research. Journal of Risk and Financial Management 17, 3: 95. [Google Scholar] [CrossRef]
- Kelley, S. W., K. D. Hoffman, and M. A. Davis. 1993. A typology of retail failures and recoveries. Journal of Retailing 69, 4: 429–452. [Google Scholar] [CrossRef]
- Knox, G., and R. van Oest. 2014. Customer complaints and recovery effectiveness: A customer base approach. Journal of Marketing 78, 5: 42–57. [Google Scholar] [CrossRef]
- Kumar, P., M. U. Kalwani, and M. Dada. 1997. The impact of waiting time guarantees on customers’ waiting experiences. Marketing Science 16, 4: 295–314. [Google Scholar] [CrossRef]
- Larson, R. C. 1987. Perspectives on queues: Social justice and the psychology of queueing. Operations Research 35, 6: 895–905. [Google Scholar] [CrossRef]
- Levitt, S. D., and J. A. List. 2007. What do laboratory experiments measuring social preferences reveal about the real world? Journal of Economic Perspectives 21, 2: 153–174. [Google Scholar] [CrossRef]
- Maister, D. H. 1985. The psychology of waiting lines. In The service encounter: Managing employee/customer interaction in service businesses. Edited by J. A. Czepiel, M. R. Solomon and C. F. Surprenant. Lexington, MA: Lexington Books, pp. 113–123. [Google Scholar]
- Maxham, J. G., and R. G. Netemeyer. 2002. A longitudinal study of complaining customers’ evaluations of multiple service failures and recovery efforts. Journal of Marketing 66, 4: 57–71. [Google Scholar] [CrossRef]
- McCollough, M. A., L. L. Berry, and M. S. Yadav. 2000. An empirical investigation of customer satisfaction after service failure and recovery. Journal of Service Research 3, 2: 121–137. [Google Scholar] [CrossRef]
- Michel, S., D. Bowen, and R. Johnston. 2009. Why service recovery fails: Tensions among customer, employee, and process perspectives. Journal of Service Management 20, 3: 253–273. [Google Scholar] [CrossRef]
- Morgeson, F. V., G. T. M. Hult, S. Mithas, T. Keiningham, and C. Fornell. 2020. Turning complaining customers into loyal customers: Moderators of the complaint handling–customer loyalty relationship. Journal of Marketing 84, 5: 79–99. [Google Scholar] [CrossRef]
- Open Science Collaboration. 2015. Estimating the reproducibility of psychological science. Science 349, 6251: aac4716. [Google Scholar] [CrossRef] [PubMed]
- Orsingher, C., S. Valentini, and M. de Angelis. 2010. A meta-analysis of satisfaction with complaint handling in services. Journal of the Academy of Marketing Science 38, 2: 169–186. [Google Scholar] [CrossRef]
- Oster, E. 2019. Unobservable selection and coefficient stability: Theory and evidence. Journal of Business & Economic Statistics 37, 2: 187–204. [Google Scholar] [CrossRef]
- Raval, D. 2020. Whose voice do we hear in the marketplace? Evidence from consumer complaining behavior. Marketing Science 39, 1: 168–187. [Google Scholar] [CrossRef]
- Smith, A. K., and R. N. Bolton. 2002. The effect of customers’ emotional responses to service failures on their recovery effort evaluations and satisfaction judgments. Journal of the Academy of Marketing Science 30, 1: 5–23. [Google Scholar] [CrossRef]
- Smith, A. K., R. N. Bolton, and J. Wagner. 1999. A model of customer satisfaction with service encounters involving failure and recovery. Journal of Marketing Research 36, 3: 356–372. [Google Scholar] [CrossRef]
- Staiger, D., and J. H. Stock. 1997. Instrumental variables regression with weak instruments. Econometrica 65, 3: 557–586. [Google Scholar] [CrossRef]
- Stock, J. H., and M. Yogo. 2005. Testing for weak instruments in linear IV regression. In Identification and inference for econometric models: Essays in honor of thomas rothenberg. Edited by D. W. K. Andrews and J. H. Stock. New York, NY: Cambridge University Press, pp. 80–108. [Google Scholar]
- Sun, Y., D. He, and M. Kejriwal. 2026. Examining persistent inequities in financial complaint resolution for older Americans and veterans in the United States. PNAS Nexus 5, 4: pgag086. [Google Scholar] [CrossRef] [PubMed]
- Tax, S. S., S. W. Brown, and M. Chandrashekaran. 1998. Customer evaluations of service complaint experiences: Implications for relationship marketing. Journal of Marketing 62, 2: 60–76. [Google Scholar] [CrossRef]
- Taylor, S. 1994. Waiting for service: The relationship between delays and evaluations of service. Journal of Marketing 58, 2: 56–69. [Google Scholar] [CrossRef]
- Thibaut, J. W., and L. Walker. 1975. Procedural justice: A psychological analysis. Hillsdale, NJ: Lawrence Erlbaum. [Google Scholar]
- United States Congress. 2010. Dodd-frank Wall Street reform and consumer protection act, public law 111-203, 124 stat. 1376. Available online: https://www.congress.gov/bill/111th-congress/house-bill/4173 (accessed on 5 September 2026).
- Van Vaerenbergh, Y., C. Orsingher, I. Vermeir, and B. Larivière. 2014. A meta-analysis of relationships linking service failure attributions to customer outcomes. Journal of Service Research 17, 4: 381–398. [Google Scholar] [CrossRef]
- Van Vaerenbergh, Y., D. Varga, A. De Keyser, and C. Orsingher. 2019. The service recovery journey: Conceptualization, integration, and directions for future research. Journal of Service Research 22, 2: 103–119. [Google Scholar] [CrossRef]
- Wang, Z., S. Zhu, and X. Chen. 2026. From complaint narratives to monetary relief: A hybrid machine learning framework for CFPB consumer complaints. arXiv: Available online: https://arxiv.org/abs/2606.22664 (accessed on 5 September 2026).
- Wilson, E. B. 1927. Probable inference, the law of succession, and statistical inference. Journal of the American Statistical Association 22, 158: 209–212. [Google Scholar] [CrossRef]
- Wirtz, J., and A. S. Mattila. 2004. Consumer responses to compensation, speed of recovery and apology after a service failure. International Journal of Service Industry Management 15, 2: 150–166. [Google Scholar] [CrossRef]
- Wooldridge, J. M. 2010. Econometric analysis of cross section and panel data, 2nd ed. Cambridge, MA: MIT Press. [Google Scholar]
- Zeithaml, V. A., L. L. Berry, and A. Parasuraman. 1996. The behavioral consequences of service quality. Journal of Marketing 60, 2: 31–46. [Google Scholar] [CrossRef]
- Zhou, Y., A. S. L. Tsang, M. Huang, and N. Zhou. 2014. Does delaying service-failure resolution ever make sense? Journal of Business Research 67, 2: 159–166. [Google Scholar] [CrossRef]
Figure 1.
Assumed causal structure. Solid arrows are relationships allowed by the design; dashed red arrows are the paths assumed absent. The path from S to D through U cannot be blocked, so the response category coefficients are associations. The delay gradient is identified only under Assumptions 1 and 2, which Section 5 and Appendix C examine but cannot test.
Figure 1.
Assumed causal structure. Solid arrows are relationships allowed by the design; dashed red arrows are the paths assumed absent. The path from S to D through U cannot be blocked, so the response category coefficients are associations. The delay gradient is identified only under Assumptions 1 and 2, which Section 5 and Appendix C examine but cannot test.
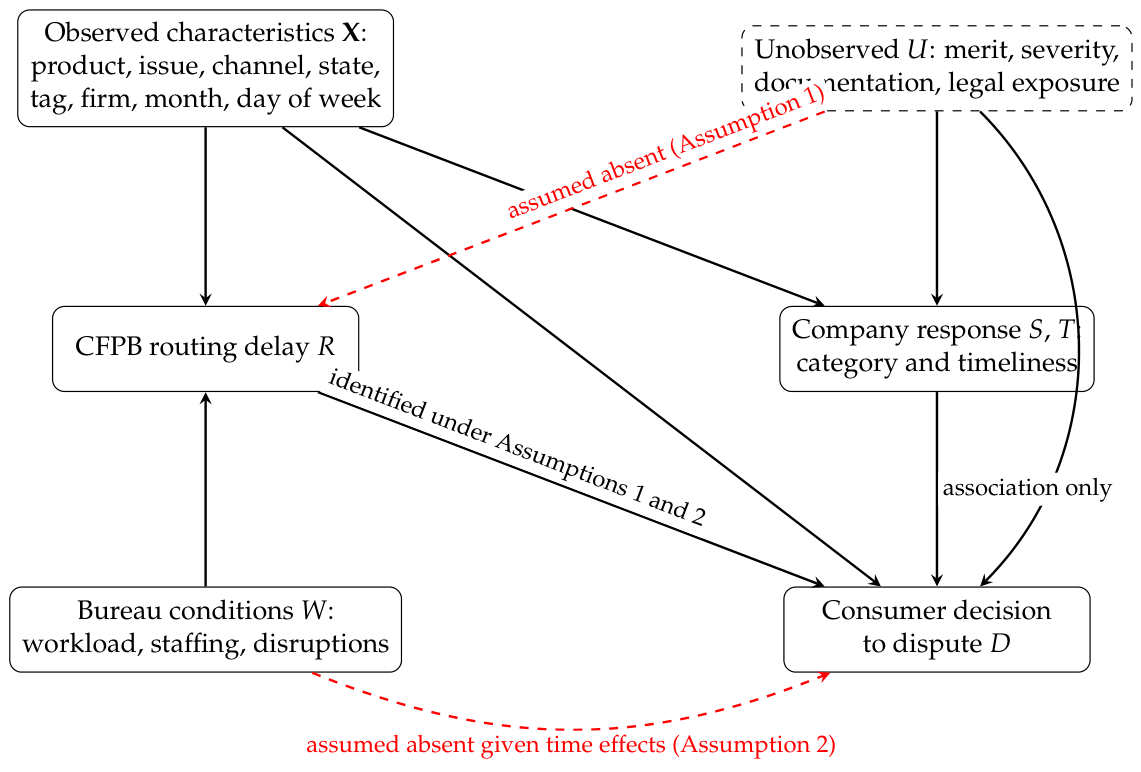
Figure 2.
Unadjusted consumer dispute rates by response category and by the two timing fields. (A) Dispute rate by response category, separately for timely and untimely initial responses, with 95% Wilson intervals (Wilson, 1927). (B) Dispute rate by CFPB routing delay bin within each response category, with 95% intervals. Delay bins rather than deciles are used because half of all complaints are routed on the day of receipt.
Figure 2.
Unadjusted consumer dispute rates by response category and by the two timing fields. (A) Dispute rate by response category, separately for timely and untimely initial responses, with 95% Wilson intervals (Wilson, 1927). (B) Dispute rate by CFPB routing delay bin within each response category, with 95% intervals. Delay bins rather than deciles are used because half of all complaints are routed on the day of receipt.
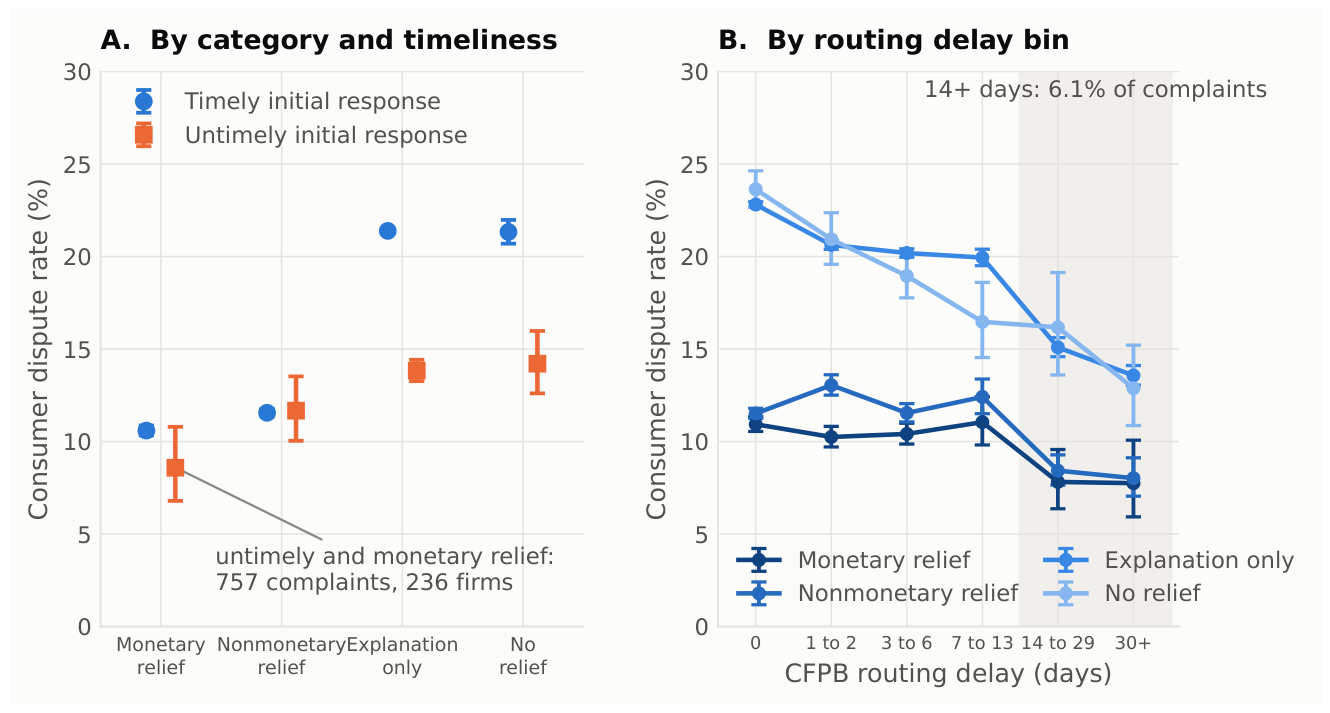
Figure 3.
Predicted dispute probability by routing delay bin and response category. Estimates from the column (6) specification with response category by delay bin interactions and product, issue, channel, state, tag, day of week, calendar month, and company effects, with other covariates at their sample means; bars are 95% confidence intervals clustered by company and receipt week. Delays of 30 days or more are 2.75% of complaints; Table A10 in Appendix C reports the complaints and firms in each cell.
Figure 3.
Predicted dispute probability by routing delay bin and response category. Estimates from the column (6) specification with response category by delay bin interactions and product, issue, channel, state, tag, day of week, calendar month, and company effects, with other covariates at their sample means; bars are 95% confidence intervals clustered by company and receipt week. Delays of 30 days or more are 2.75% of complaints; Table A10 in Appendix C reports the complaints and firms in each cell.
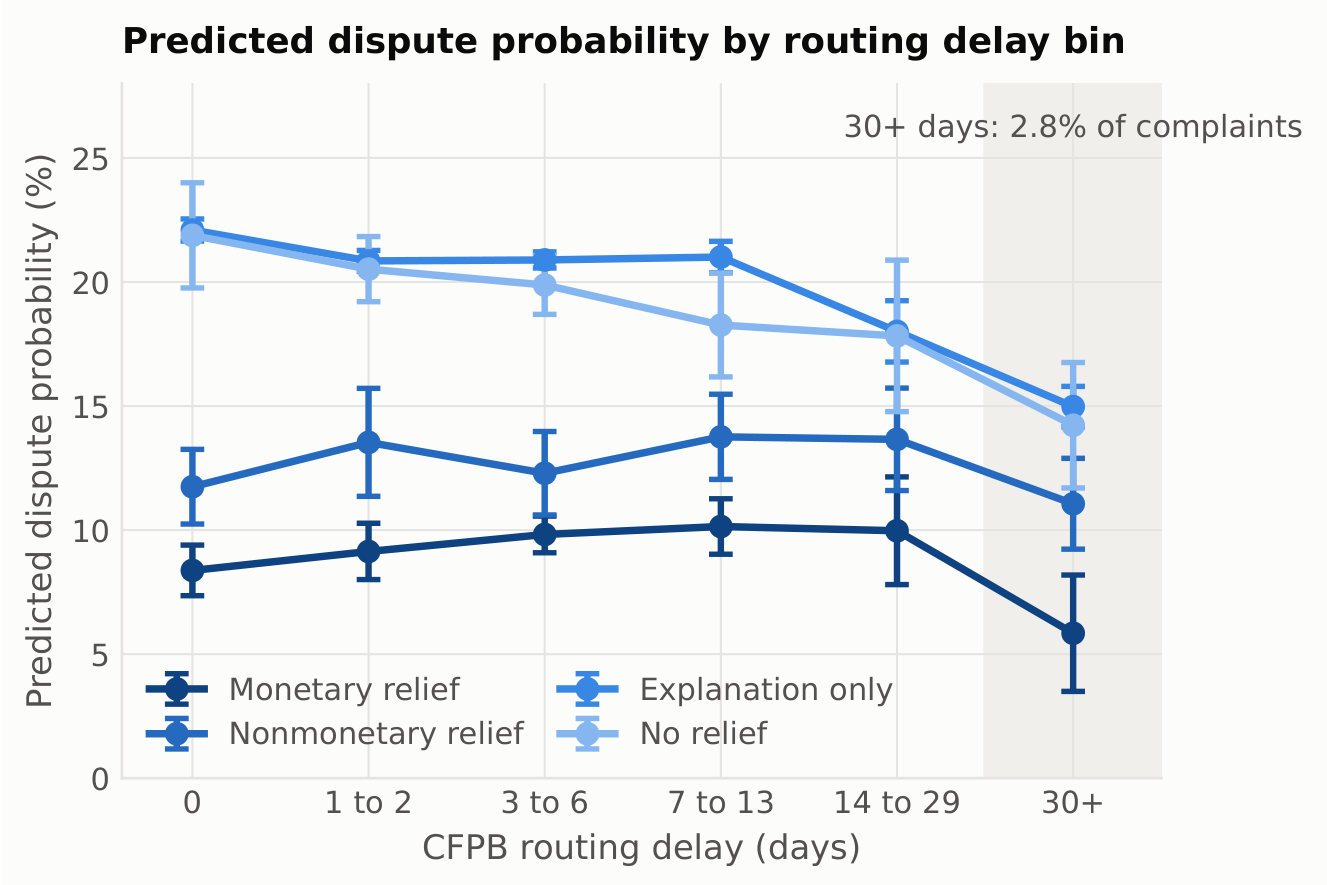
Table 1.
Descriptive statistics for the analysis sample (n = 737,010).
| Share of sample (%) | Dispute rate (%) | |
|---|---|---|
| Product | ||
| Mortgage | 28.6 | 22.4 |
| Debt collection | 19.5 | 17.8 |
| Credit reporting | 19.1 | 15.8 |
| Bank account or service | 11.1 | 18.5 |
| Credit card | 11.1 | 20.5 |
| Student loan | 4.3 | 18.2 |
| Other (consumer loan, money transfer, payday, prepaid) | 6.3 | 19.3 |
| Submission channel | ||
| Web | 69.0 | 21.0 |
| Referral | 16.4 | 16.0 |
| Phone | 6.7 | 15.0 |
| Postal mail | 6.4 | 13.0 |
| Fax | 1.5 | 19.0 |
| Company response category (recovery substance) | ||
| Closed with monetary relief | 6.9 | 10.6 |
| Closed with nonmonetary relief | 12.8 | 11.6 |
| Closed with explanation | 78.0 | 21.2 |
| Closed (no relief) | 2.3 | 20.7 |
| Timing fields | ||
| Timely initial response (within 15 days) | 97.6 | 19.4 |
| Untimely initial response | 2.4 | 13.4 |
| CFPB routing delay of 0 days | 49.9 | 20.5 |
| CFPB routing delay of 1 to 6 days | 38.6 | 18.7 |
| CFPB routing delay of 7 to 13 days | 5.3 | 18.4 |
| CFPB routing delay of 14 days or more | 6.1 | 13.2 |
| Other | ||
| Complaint has a published narrative | 22.1 | 22.0 |
| Overall | 100.0 | 19.2 |
Notes: Product shares are computed on the current export’s product labels. Dispute rates are unadjusted. Shares and rates are rounded to one decimal.
Table 2.
What the two timing fields measure.
| Value | Note | |
|---|---|---|
| Panel A. Initial response timeliness | ||
| Share timely | 97.63% | 719,574 of 737,010 |
| Share untimely | 2.37% | 17,436 complaints |
| Range across years | 97.0% to 98.9% | |
| Untimely and closed with monetary relief | 757 | 236 firms; 6 firms with 10 or more |
| Panel B. Log routing delay: share of variance explained () by | ||
| Product, issue, state, and consumer tag | 0.029 | merit related characteristics |
| Submission channel only | 0.170 | paper and referral intake |
| All complaint characteristics | 0.194 | adds channel |
| Calendar month and day of week only | 0.062 | |
| All characteristics, month, and day of week | 0.233 | |
| All of the above and firm | 0.271 | |
| Firm by product by month cells, channel, issue, state, tag, day of week | 0.365 | |
| Panel C. Candidate instruments for routing delay | ||
| Log weekly Bureau intake, no time controls (SE clustered by firm) | −3.62 (1.61) | first stage F = 5.0; sign reflects the trend |
| Log weekly Bureau intake, characteristics and month effects | −3.15 (3.52) | first stage F = 0.8 |
| Detrended intake shock, dependent variable log(1 + delay) | 0.31 (0.11) | first stage F = 8.1 |
| Day of week of receipt: mean delay, Sunday to Friday | 2.5 to 4.9 days | F = 53.2 on six indicators |
| Day of week of receipt: dispute rate, Sunday to Thursday | 22.9% to 18.5% | exclusion restriction fails |
Notes: Panel B uses log(1 + delay); in levels the shares are smaller because of the long tail (0.007 for product, issue, and state and 0.017 for all characteristics). Weekly intake is the number of complaints received Bureau wide in the calendar week, excluding the focal product line; the detrended shock is the log of intake over the preceding 14 days minus the log of its 365 day centered moving average. F is the square of the t statistic for a single instrument and the Wald statistic for the day of week indicators.
Table 6.
Severity index diagnostics and estimates with severity controls.
| Panel A. What the severity index measures (narrative subsample, n = 163,038) | ||||||||
| Value | Note | |||||||
| of index on product | 0.025 | |||||||
| on product and issue | 0.133 | |||||||
| on product, issue, and firm | 0.144 | 81% of variance within interacted cells | ||||||
| on all fixed effects (adds channel, state, tag, month) | 0.145 | |||||||
| on all fixed effects and eight style proxies | 0.180 | style proxies alone: 0.059 | ||||||
| Largest correlation with a style proxy | 0.22 | dollar signs; words 0.12, sentences 0.14 | ||||||
| Monetary relief on index, within fixed effects (pp per SD) | 5.31 (0.72) | 5.07 (0.71) with style | ||||||
| Dispute on index, within fixed effects (pp per SD) | −0.95 (0.15) | −1.30 (0.12) with style; −0.40 (0.10) with category, timing | ||||||
| Panel B. Delay interaction specification with and without the severity index (pp; SE clustered by company) | ||||||||
| Coefficients | Slope of dispute in log delay by response category | |||||||
| n | Monetary | Nonmonetary | Severity | Monetary | Nonmonetary | Explanation | No relief | |
| Full sample (reference) | 731,254 | −13.63 | −10.14 | +0.37 | +0.27 | −1.24 | −1.65 | |
| (0.60) | (0.94) | (0.19) | (0.21) | (0.16) | (0.35) | |||
| Narrative subsample, no severity index | 162,509 | −14.78 | −11.99 | +0.10 | −0.76 | −1.94 | −2.53 | |
| (0.77) | (1.30) | (0.40) | (0.32) | (0.23) | (0.57) | |||
| Narrative subsample, with severity index | 162,509 | −14.43 | −12.02 | −0.39 | +0.05 | −0.76 | −1.95 | −2.53 |
| (0.75) | (1.30) | (0.10) | (0.40) | (0.32) | (0.23) | (0.57) | ||
| Narrative subsample, severity, severity × delay | 162,509 | −14.38 | −12.02 | −0.44 | −0.04 | −0.74 | −1.94 | −2.52 |
| (0.75) | (1.30) | (0.11) | (0.39) | (0.31) | (0.23) | (0.57) | ||
Notes: The severity index is standardized to unit variance; Appendix B.4 gives its construction and the eight style proxies. Panel B uses the column (6) specification without the timeliness interactions; the full sample row is the baseline of Table 8. The narrative subsample rows lose 529 complaints with a missing state or in singleton cells. All models include product, issue, channel, state, tag, day of week, calendar month, and company effects.
Table 7.
Coefficient stability and bias adjusted bounds under proportional selection (Oster, 2019).
Table 7.
Coefficient stability and bias adjusted bounds under proportional selection (Oster, 2019).
| No controls | All fixed effects | at | for | |||||
|---|---|---|---|---|---|---|---|---|
| Coefficient (pp) | (SE) | |||||||
| Response category and timing fields (column 5 specification) | ||||||||
| Monetary relief | −10.81 | 0.013 | −12.40 (0.49) | 0.039 | −13.35 | −16.64 | 23.0 | 8.8 |
| Nonmonetary relief | −9.79 | 0.013 | −8.97 (0.90) | 0.039 | −8.46 | −6.64 | 5.0 | 1.9 |
| No relief | 0.24 | 0.013 | −0.70 (0.66) | 0.039 | −1.27 | −3.28 | n.a. | n.a. |
| log(1 + routing delay) | −1.68 | 0.013 | −0.98 (0.12) | 0.039 | −0.48 | 1.80 | 1.7 | 0.5 |
| Slope of dispute in log routing delay by response category (delay interaction specification) | ||||||||
| Explanation only | −1.94 | 0.013 | −1.24 (0.16) | 0.039 | −0.79 | 0.91 | 2.2 | 0.7 |
| Monetary relief | −0.48 | 0.013 | 0.37 (0.19) | 0.039 | 0.80 | 1.91 | n.a. | n.a. |
| Nonmonetary relief | −0.47 | 0.013 | 0.27 (0.21) | 0.039 | 0.63 | 1.57 | n.a. | n.a. |
| No relief | −2.64 | 0.013 | −1.65 (0.35) | 0.039 | −1.18 | −0.04 | 3.4 | 1.0 |
Notes: and are from a regression of dispute on the response categories, timeliness, and log delay (and their interactions in the lower panel) with no other controls; and add product, issue, channel, state, tag, day of week, calendar month, and company effects. is the bias adjusted coefficient under equal selection on observables and unobservables (Oster, 2019, Proposition 2 and Corollary 1) and for is the degree of selection on unobservables, relative to observables, that would set the coefficient to zero (Oster, 2019, Proposition 3). n.a. marks cases in which the coefficient with controls is within one standard error of zero or in which the controls move the coefficient across zero, so that the implied is negative and has no interpretation as a degree of selection.
Table 8.
Slope of dispute in log routing delay by response category (percentage points per log day; 95% confidence interval in brackets).
Table 8.
Slope of dispute in log routing delay by response category (percentage points per log day; 95% confidence interval in brackets).
| Monetary | Nonmonetary | Explanation | No relief | |
|---|---|---|---|---|
| Baseline: company and calendar month effects | 0.37 [−0.04, 0.79] | 0.27 [−0.15, 0.68] | −1.24 [−1.56, −0.92] | −1.65 [−2.31, −0.99] |
| Receipt day effects instead of month | 0.37 [0.01, 0.73] | 0.26 [−0.15, 0.68] | −1.24 [−1.55, −0.93] | −1.60 [−2.30, −0.91] |
| Firm × product × month cells | 0.56 [0.13, 1.00] | 0.27 [−0.15, 0.69] | −1.20 [−1.56, −0.85] | −1.81 [−2.47, −1.15] |
| Firm × product × month × channel × category cells, receipt day effects | −0.03 [−0.48, 0.42] | −0.50 [−0.75, −0.24] | −1.09 [−1.42, −0.76] | −1.83 [−2.66, −0.99] |
Notes: Each entry is from the column (6) specification without the timeliness interactions; every row includes product, issue, channel, state, tag, day of week, and timeliness controls. The baseline interval is clustered by company and receipt week (Table A5 reports the alternatives); the other rows are clustered by company. In the last row the cells absorb the response category main effects, so that only the dispersion of routing delay within a cell identifies the slopes. Table A8 in Appendix C reports further fixed effect, sample, and functional form variants and the placebo reshuffles.
Table 9.
Product specific estimates: slope of dispute in log routing delay by response category, with formal tests of the mortgage difference.
Table 9.
Product specific estimates: slope of dispute in log routing delay by response category, with formal tests of the mortgage difference.
| Product | Complaints | Firms | Monetary | Nonmonetary | Explanation | No relief |
|---|---|---|---|---|---|---|
| Mortgage | 209,569 | 1,195 | −1.00 [−1.94, −0.07] | 0.28 [−0.49, 1.05] | −0.13 [−0.68, 0.41] | −1.45 [−2.54, −0.36] |
| Debt collection | 143,115 | 2,818 | 0.84 [−0.59, 2.28] | −0.20 [−0.84, 0.44] | −1.96 [−2.23, −1.69] | −1.65 [−2.73, −0.58] |
| Credit reporting | 139,703 | 607 | 2.17 [0.08, 4.27] | 0.95 [0.19, 1.71] | −1.43 [−2.13, −0.73] | −0.14 [−2.67, 2.40] |
| Bank account or service | 80,426 | 444 | 0.67 [0.08, 1.26] | 1.71 [−1.07, 4.49] | −0.95 [−1.42, −0.48] | −1.35 [−3.44, 0.74] |
| Credit card | 80,764 | 416 | 0.62 [−0.35, 1.58] | 0.60 [−0.22, 1.42] | −1.08 [−1.49, −0.66] | −1.36 [−4.36, 1.65] |
| Student loan | 31,312 | 348 | −1.39 [−2.89, 0.11] | −0.33 [−1.50, 0.84] | −1.52 [−2.10, −0.95] | −3.83 [−7.71, 0.05] |
| Consumer loan | 30,566 | 1,027 | −0.58 [−2.25, 1.08] | −0.24 [−1.66, 1.17] | −1.24 [−1.92, −0.57] | −1.13 [−3.75, 1.49] |
| Mortgage minus all other products (pooled model with mortgage interactions on every term; pp per log day) | ||||||
| Difference in slope | −1.34 (0.45) | 0.23 (0.41) | 1.87 (0.40) | 0.46 (0.69) | ||
| p value | 0.003 | 0.571 | <0.001 | 0.504 | ||
Notes: Each product row is a separate estimate of the column (6) specification without timeliness interactions on that product’s complaints, with issue, channel, state, tag, day of week, calendar month, and company effects; brackets are 95% confidence intervals clustered by company. The bottom panel interacts a mortgage indicator with every term of the pooled specification; a joint Wald test of the four mortgage by delay terms rejects equality (p < 0.001).
Disclaimer/Publisher’s Note: The statements, opinions and data contained in all publications are solely those of the individual author(s) and contributor(s) and not of MDPI and/or the editor(s). MDPI and/or the editor(s) disclaim responsibility for any injury to people or property resulting from any ideas, methods, instructions or products referred to in the content. |
© 2026 by the authors. Licensee MDPI, Basel, Switzerland. This article is an open access article distributed under the terms and conditions of the Creative Commons Attribution (CC BY) license (http://creativecommons.org/licenses/by/4.0/).
Copyright: This open access article is published under a Creative Commons CC BY 4.0 license, which permit the free download, distribution, and reuse, provided that the author and preprint are cited in any reuse.