

Submitted:
22 October 2026
Posted:
23 October 2026
You are already at the latest version
Abstract
Low-cost optical particle sensors are widely used for ambient PM2.5 measurements, but internal heating can raise sample temperature and reduce relative humidity (RH) before optical detection. We measured air temperature in the particle detection zone (PDZ) of the Plantower PMS5003 (PMS), both standalone and within a PurpleAir (PA) monitor. Laboratory measurements demonstrated greater PDZ warming within the PA than in the standalone PMS. A wraparound USB heater was applied to PAs to reproduce the low sample-RH conditions used by regulatory PM2.5 monitors and nephelometers. Field experiments in Santa Rosa, California, compared standalone PMS, unheated PA, and heated PA measurements; a second experiment in Winston-Salem, North Carolina, compared heated and unheated PAs with a Teledyne T640x PM2.5 monitor. External heating substantially reduced PDZ RH and lowered reported PM2.5 at elevated ambient RH. Internal heating in a standard PA also reduced reported PM2.5 relative to a standalone PMS, consistent with partial removal of hygroscopic aerosol water before optical detection. Computational fluid-dynamics and heat-transfer simulations characterized internal airflow, residence time, and temperature distributions, providing a physical framework for interpreting the measurements.
Keywords:
low-cost particle sensor
; computational fluid dynamics
; Plantower PMS5003
; PurpleAir
; heat transfer
; air flow
1. Introduction
Low-cost optical particle sensors are widely used for ambient particulate matter measurements. Their small size, low power consumption, and low cost have enabled dense monitoring networks such as AirNow (https://www.airnow.gov/) that would not be practical with conventional regulatory instrumentation. Low-cost optical PM sensors have also been deployed in a variety of remote and unconventional atmospheric monitoring applications. Roostaei et al. (2024) used Plantower PMS5003 sensors installed on buildings of different heights in Tehran, Iran, to measure vertical variations in PM concentrations from 1.5 to 290 m above ground level. Ouimette et al. (2019) demonstrated extended, unattended operation of PurpleAir monitors containing PMS5003 sensors at remote atmospheric monitoring sites, including White Mountain Summit (4,340 m) and Barcroft Observatory (3,893 m) in California, and a solar-powered remote automated weather station near Austin, Nevada (2,013 m). Ahlawat et al. (2026) used a drone-mounted Plantower PMS7003 sensor with an external sampling pump and upstream desiccant dryer to measure vertical PM2.5 profiles over Delhi, India. Broda et al. (2026) deployed Sensirion SPS30 sensors aboard high-altitude balloons launched in southeastern Poland to obtain vertical aerosol profiles and estimate aerosol light-scattering properties. Together, these studies demonstrate the versatility of compact, inexpensive optical PM sensors for atmospheric measurements extending from ground-based monitoring networks to the upper troposphere and lower stratosphere.
In order to more effectively predict low cost sensor performance compared to regulatory PM2.5 monitors and nephelometers, it is important to understand the properties of the aerosol when they enter the sensor’s particle detection zone (PDZ). The PDZ is the location in the sensor laser beam where the particle scatters light to the photodiode. If the particle is hygroscopic the PDZ relative humidity (RH) will impact the particle’s diameter and refractive index. Most low-cost sensors such as the Plantower PMS5003 (PMS) and the PurpleAir (PA) do not actively control the flow rate, temperature, or relative humidity (RH) of the sampled aerosol. Particles are drawn by a miniature fan through a sensor containing heat-generating electronic components before reaching the PDZ. Consequently, the temperature and RH experienced by particles at optical detection can differ from ambient conditions.
In this study, the temperatures of the PMS PDZ are measured under different heat scenarios, and their RHs are calculated from ambient dewpoints. The rate of heat up of the PMS and PA is measured, compared to simple time dependent heat conduction models, and heat loss to the sample airflow is estimated. Field studies are carried out to estimate in real time the hygroscopic aerosol mass loss in a standard PA and to estimate the total PM2.5 hygroscopic aerosol mass concentration using a standalone PMS sensor and a heated PA monitor. Lastly, computational fluid dynamics modeling is combined with PDZ temperature, measurements of printed circuit board (PCB) electrical power, and airflow to characterize the thermal environment experienced by aerosol within the PMS sensor and PA monitor.
2. Methods and Materials
This study focuses on the PMS heat transfer and its behavior in the PA. Ambient air enters through four circular holes in the PMS metal cover into the top of a chamber (“plenum” in this paper), passes through three circular holes in the bottom opposite side of the plenum (Figure 1), and then toward the PDZ on the opposite side where the particles are detected, counted, and sized. The PMS printed circuit board (PCB) is on the bottom of the plenum. It transfers its heat by conduction in the plastic PMS and by convective diffusion to the air flowing through the plenum.
Convective heat transfer from electronic components and the plenum walls depends strongly on airflow and geometry. For the PMS, the relevant dimensionless quantities are the Reynolds, Prandtl, and Nusselt numbers, which link flow conditions to convective heat transfer from the PCB and other heated surfaces [Hacohen et al., 1995; Kim and Anand, 1994]. The PMS sampling flow is approximately 0.85 L min−1 [Lee, et al. 2025, Ouimette et al. 2024], corresponding to a mean velocity of approximately 0.80 m s−1 through its four plenum inlets and 0.78 m s−1 through its three outlets, for an inlet Reynolds number of 125 and an outlet Reynolds number of 143. This indicates laminar flow through the plenum. The Prandtl number of air at room temperature is approximately 0.71 [Bergman et al., 2011]. Thus, the internal flow occurs at low Reynolds number, while the Prandtl number is characteristic of ordinary air. The fraction of electronic heat transferred to the airflow therefore depends on flow distribution, residence time, and competing heat-loss pathways through the sensor structure.
This distinction is important for hygroscopic aerosol because warming the sampled air is not equivalent to drying the sampled particles. Heating lowers RH without changing the air's water-vapor mixing ratio or dew point, but particle-bound water requires finite time for heat and mass transfer before equilibrium with the surrounding air is approached [Wexler, A. S., and J. H. Seinfeld. 1992]. The aerosol response therefore depends on its thermal and humidity history and the available residence time before optical detection.
PMS sensors in a PA experience a warmer environment than standalone PMS sensors due to the PA’s heat producing Wi-Fi PCB and the insulating PVC plastic housing (Figure 2). Note that the Bosch BME280 sensor measures temperature and RH within the PVC enclosure, which tends to be at a slightly higher temperature and lower RH than ambient [Couzo et al., 2024].
2.1. Instrument Heating and Thermal Response
2.1.1. PMS Particle-Detection-Zone Temperature
The PMS PCB power consumption was measured to be 188 mW, and in this study is assumed to dissipate this power as heat. Consequently, sampled ambient air and particles are heated as they pass through the PMS toward the particle detection zone (PDZ). A Type K beaded thermocouple connected to a Supco SL500TC temperature data logger was used to measure the sampled-air temperature near the PDZ. Independent room temperature, relative humidity (RH), and dew point were monitored and logged with a SensorPush HT1 Temperature and Humidity Smart Sensor.
One half of the PMS metal cover was removed, and a 3.0 mm-diameter hole was drilled through the PMS housing to provide access to the PDZ. The thermocouple, with a 1.9 mm-diameter bead, was inserted through the hole and positioned in the sampled airstream approximately 2 mm downstream of the laser focal point (Figure 3). The metal cover was then reinstalled, and the external thermocouple access hole and metal-cover seams were sealed to minimize air leakage and preserve the normal PMS sampling flow path and enclosed thermal configuration.
Before each experiment, the unpowered PMS and SensorPush ambient temperature sensor were allowed to equilibrate overnight. The initial temperature difference between the PDZ thermocouple and SensorPush was always less than 1 °C. A constant offset correction, determined separately for each experiment, was applied to the SensorPush temperature measurements to eliminate this initial difference. Subsequent PDZ temperature increases were calculated relative to the corrected ambient temperature. This procedure minimized systematic errors arising from differences in the absolute temperature calibrations of the two instruments, although it did not eliminate subsequent instrument drift.
The Type K thermocouple was checked in an ice-water bath at 0 °C before use. Standard Type K thermocouples have a specified absolute tolerance of ±2.2 °C near room temperature; this tolerance does not include logger uncertainty. Because the analysis primarily concerns temperature differences over relatively narrow temperature ranges, constant calibration offsets largely cancel, although uncertainty from logger accuracy and sensor drift remains. Room and PDZ temperatures were recorded at 10-s intervals and subsequently downloaded using the Supco and SensorPush software. This experiment quantified the PMS thermal warm-up time and the steady-state elevation of PDZ temperature above room temperature. The RH at the PDZ was calculated from its temperature and the room dew point assuming that the PDZ and room dew points were equal.
In a separate experiment, the PMS inlet and fan outlet were blocked while electrical power remained on, and PDZ and room temperatures were continuously logged. The openings were then uncovered and cooling was measured as sampling airflow resumed. These sequential tests isolated the contribution of internal through-flow to the removal of electronics-generated heat.
2.1.2. PA PDZ Temperature Under Still-Air Conditions
The PA (PA) contains two PMS sensors, a Bosch BME280 relative humidity, temperature, and pressure (RHTP) sensor, and a custom PCB containing an ESP-WROOM-02 Wi-Fi module based on the ESP8266 microcontroller. The custom PCB is located above the two PMS sensors in the upper portion of the PVC cap (the “dome”). Thus, internal heating of the PA results from the two PMS sensors together with the approximately 410 mW dissipated by the custom PCB.
To measure sampled-air temperature within the PDZ of a PMS inside a PA, one PMS was temporarily removed and instrumented with a thermocouple at the PDZ using the procedure described in Section 2.1.1. The metal cover was reinstalled and sealed, and the instrumented PMS was returned to its normal position within the PA enclosure.
Three internal PA temperatures were measured: dome air temperature, PMS PDZ temperature, and BME280 temperature. The PA was allowed to equilibrate to room temperature before power was applied. Room, dome, and PDZ thermocouple temperatures were recorded and subsequently downloaded. Two-minute-average BME280 temperatures were recorded on the PA micro-SD card and subsequently downloaded.
This experiment quantified the PA thermal warm-up time and the temperature elevations of the PMS PDZ, BME280, and dome relative to room temperature, as well as the temperature differences among these three internal locations.
2.1.3. Effect of Forced Convection on PA PDZ Temperature
The instrumented PA described in Section 2.1.2 was mounted on a vertical support 0.7 m from a 0.3 m-diameter fan. The fan produced an air velocity of 3.5 m s−1 at the PA, measured with a HoldPeak Model HP-866B anemometer. Independent room temperature and RH were monitored and logged with a SensorPush HT1.
As in Section 2.1.2, three internal PA temperatures were measured: dome air temperature, PMS PDZ temperature, and BME280 temperature. The PA was allowed to equilibrate to room temperature before power was applied. Room, dome, and PDZ thermocouple temperatures were recorded and subsequently downloaded, while two-minute-average BME280 temperatures were recorded on the PA micro-SD card.
This experiment quantified the effect of external forced convection on PA thermal warm-up and on the steady-state temperature elevations of the PMS PDZ, BME280, and dome relative to room temperature. Additional instrument construction, thermocouple placement, electronics power, and thermal-test details are provided in the Supplemental Methods.
2.2. Low-RH Sample Conditioning and PM2.5 Response
2.2.1. Heated PA Collocated with Standard PA and PMS in Santa Rosa
A two-week outdoor experiment was conducted in Santa Rosa, California, during July 2024 to reproduce in a PA the low sample-RH condition used by regulatory PM2.5 monitors and nephelometers and to determine its effect on reported PM2.5. A standalone PMS, an unheated PA, and a heated PA were collocated in shade. The heated monitor was wrapped with a NEEWER HW-28 flexible USB lens heater operated at the High setting; the intended PDZ sample RH was approximately 30–40%. Figure S1 is a photo of the setup.
PDZ temperatures in all three instruments were measured every 10 s with Type K thermocouples and a Danoplus THE-343 four-channel logger. Ambient temperature and RH were measured independently with a SensorPush HT1 and were combined with measured PDZ temperature to calculate RH at optical detection. PA BME280 temperature/RH and PM2.5 data were recorded on the microSD cards and transmitted to the PA data system. PM2.5 ratios among the three configurations were used to quantify the response to sample conditioning.
2.2.2. Heated PA Collocated with Standard PA and T640x in Winston-Salem
A second field test was conducted from August 9 to September 21, 2024, at the EPA AQS 37-067-0022 Hattie Avenue station in Winston-Salem, North Carolina. An unheated PA and a second PA heated with the same NEEWER HW-28 heater were collocated with a Teledyne T640x PM2.5 monitor. Two-minute PA PM2.5 and BME280 measurements were downloaded from the PA data system, and site technicians provided hourly T640x PM2.5 and internal RH. The T640x internal RH served as the direct reference for the low-RH sample condition that the heated PA was intended to reproduce. Analysis was restricted to 907 hourly observations for which all three PM2.5 measurements were available.
The heated and unheated PA monitors were not cross-compared before the experiment. Hourly PM2.5 measurements were calculated using the average of the two PMS sensor channels in each PA. Differences in reported PM2.5 may reflect both the effects of heating and inherent differences between the two monitors.
2.3. Three-Dimensional Airflow and Heat-Transfer Modeling
2.3.1. CAD Geometry
Dimensionally representative three-dimensional geometries were constructed in Onshape (https://cad.onshape.com) and imported into SimScale (https://www.simscale.com/). Separate PMS fluid-domain models represented the inlet plenum and the downstream pre-detection passage (“Region 1” in this paper). A separate PA model represented the PVC housing and dome, two PMS sensors, the custom electronics assembly, and the enclosed internal air. Geometry was simplified to retain the principal flow restrictions, changes in direction, heat-source locations, solid-fluid interfaces, and enclosure surfaces while avoiding unnecessary computational complexity.
2.3.2. PMS Airflow and Heat Transfer
The guided workflows in SimScale were used to model airflow and heat transfer. PMS airflow was modeled as incompressible and laminar at the nominal sampling flow of 0.85 min−1. The inlet-plenum model included the four inlet openings and three closely spaced downstream PCB openings; Region 1 represented redistribution of these three streams before the PDZ. No-slip conditions were applied at solid walls, and the mesh was refined around millimeter-scale openings, jets, walls, and regions of large velocity gradient. Steady-state and transient calculations were used to examine velocity fields, jet penetration, recirculation, and flow uniformity approaching the PDZ. Transient passive-scalar and mean-age-of-fluid calculations were used as transport-time diagnostics.
PMS heat-transfer calculations used measured electrical dissipation as the thermal input, with the PCB represented as the principal distributed heat source. Calculations included heat transfer to sampled air, conduction through the sensor structure, and heat rejection to the surroundings. Steady-state simulations provided equilibrium temperature fields, and transient simulations examined warm-up after power application. External cooling was represented with q″ = h(Tw − T∞), with h varied to represent different cooling conditions.
2.3.3. PA Conjugate Heat-Transfer Modeling
The complete PA was modeled in SimScale as a conjugate heat-transfer problem containing the PVC housing, two PMS sensors, the PA PCB in the dome above the PMSs, and the enclosed air volume. The airflow inside the two PMSs was not included in the PA simulations. Gravity was enabled to permit buoyancy-driven internal circulation in the PA dome containing the PCB, and the lower housing with the two PMSs was open to the surroundings. Heat was assigned as power to the dome PCB and the two PMSs. External heat rejection by the wind was represented with a convective heat-transfer coefficient; weak and strong cooling cases were 2 and 40 W m−2 K−1, respectively. Steady-state temperature fields and transient warm-up were compared with measurements at the dome and vertical-wall locations. The simulations were intended to reproduce the wind and internal thermal processes rather than every local construction detail.
3. Results
3.1. Instrument Heating and Thermal Response
3.1.1. PMS Particle-Detection-Zone Temperature and Heat Transfer
After the PMS equilibrated to room temperature, power was applied, and the room and PDZ thermocouple temperatures were recorded at 10 s intervals to determine warm-up and the steady-state PDZ temperature elevation. With normal PMS airflow, the PDZ temperature increased by approximately 3.3 °F (1.8 °C) above ambient and reached 90% of its final temperature rise in approximately 14 min (Figure 4).
The standalone PMS warm-up rate can be checked with a simple one-dimensional transient heat-conduction equation:
∂T/∂t = α ∂2T/∂x2
For a characteristic conduction distance L and PMS plastic thermal diffusivity α, the corresponding diffusion timescale tc is of order:
tc ~ L2/α
Assuming that the diffusion timescale is approximately the 14 minute thermal risetime and α ≈ 1.4 × 10⁻⁷ m2 s−1, these measured times correspond to a characteristic diffusion length L = √(α·tc) of approximately 1.1 cm, comparable to the size of the PMS. Thus, the observed warm-up times and simple one-dimensional conduction timescale are comparable in magnitude. This simple 1-D model ignores the actual 3-D structure of the PMS and the heat carried away by sample airflow.
The sensible heat Q̇air carried by the sample air flow through the PMS is estimated from
Q̇air =ρ V̇cp ΔT
Using a volumetric flow rate V̇ of 0.85 L min−1, air density ρ of approximately 1.2 kg m−3, specific heat capacity cp of approximately 1007 J kg−1 K−1, and the measured PDZ temperature rise DT of 1.8 °C gives Q̇air ≈ 31 mW. Compared with the measured PMS PCB heat generation of approximately 188 mW, the sample airflow therefore removes about 16% of the generated heat under no-wind conditions. This is consistent with the airflow having relatively poor heat exchange with the PMS PCB.
3.1.2. PA PDZ Temperature Under Still-Air Conditions
The thermal response was measured with a PMS installed in a complete PA monitor under quiescent office conditions. Air temperatures were measured by thermocouples in the PA dome and PDZ and in the office, and by the PA Bosch BME280. Following power-up, the internal temperatures rose gradually while ambient office temperature changed only slightly. The warm-up results are shown in Figure 5. At the end of the experiment, the PDZ was approximately 4.8 °C warmer than ambient and 1.5 °C warmer than the BME280. The dome and PDZ reached approximately 90% of their final temperature differences with the office after approximately 35 and 45 minutes, respectively. The additional PA electronics, enclosure, and larger centimeter-scale heat-transfer paths increase both the thermal mass and the characteristic thermal response time compared to the 14-minute PMS response time by itself. The dome was the warmest measured location because of the 410 mW PCB.
Using the measured PDZ temperature elevation of 4.8 °C and assuming a sample flow of 0.85 L min−1 through each of the two PMS sensors, the combined sample airflow carries away approximately 161 mW of sensible heat. This represents approximately 21% of the total PA electrical dissipation of 786 mW (376 mW from the two PMS sensors and 410 mW from the PA PCB). The estimate assumes similar sample-air temperature rises in both PMS sensors. The remaining heat is rejected through the enclosure and other heat-transfer pathways.
3.1.3. Effect of Forced Convection on PA PDZ Temperature
With a 3.5 m s−1 air stream directed across the enclosure, all three internal measurement locations warmed rapidly after power was applied, but a pronounced temperature gradient developed within the enclosure. The dome and PDZ reached approximately 90% of their final temperature differences with the office after approximately 18 and 25 minutes, respectively. This is significantly faster compared to the calm office warmup times.
Using the nominal PMS sample flow of 0.85 L min−1 and the measured PDZ temperature rise of approximately 3.2 °C as a proxy for the sample-air temperature rise gives an airflow heat removal of approximately 109 mW by the two PMS5003s, or 14% of total PA heat generation. This is below the approximately 21% estimated for the two sample streams under calm-air PA conditions. Thus, a 3.5 m s−1 wind reduced the fraction of PA heat carried away by the sampled air and shifted more of the heat rejection to other pathways, principally transfer through the PA PVC enclosure followed by external convection.
Figure 6.
Effect of 3.5 m s−1 forced external convection on thermocouple-measured temperatures within PurpleAir. Dome and PDZ temperatures in orange and black, respectively. BME280 temperature in green.
Figure 6.
Effect of 3.5 m s−1 forced external convection on thermocouple-measured temperatures within PurpleAir. Dome and PDZ temperatures in orange and black, respectively. BME280 temperature in green.
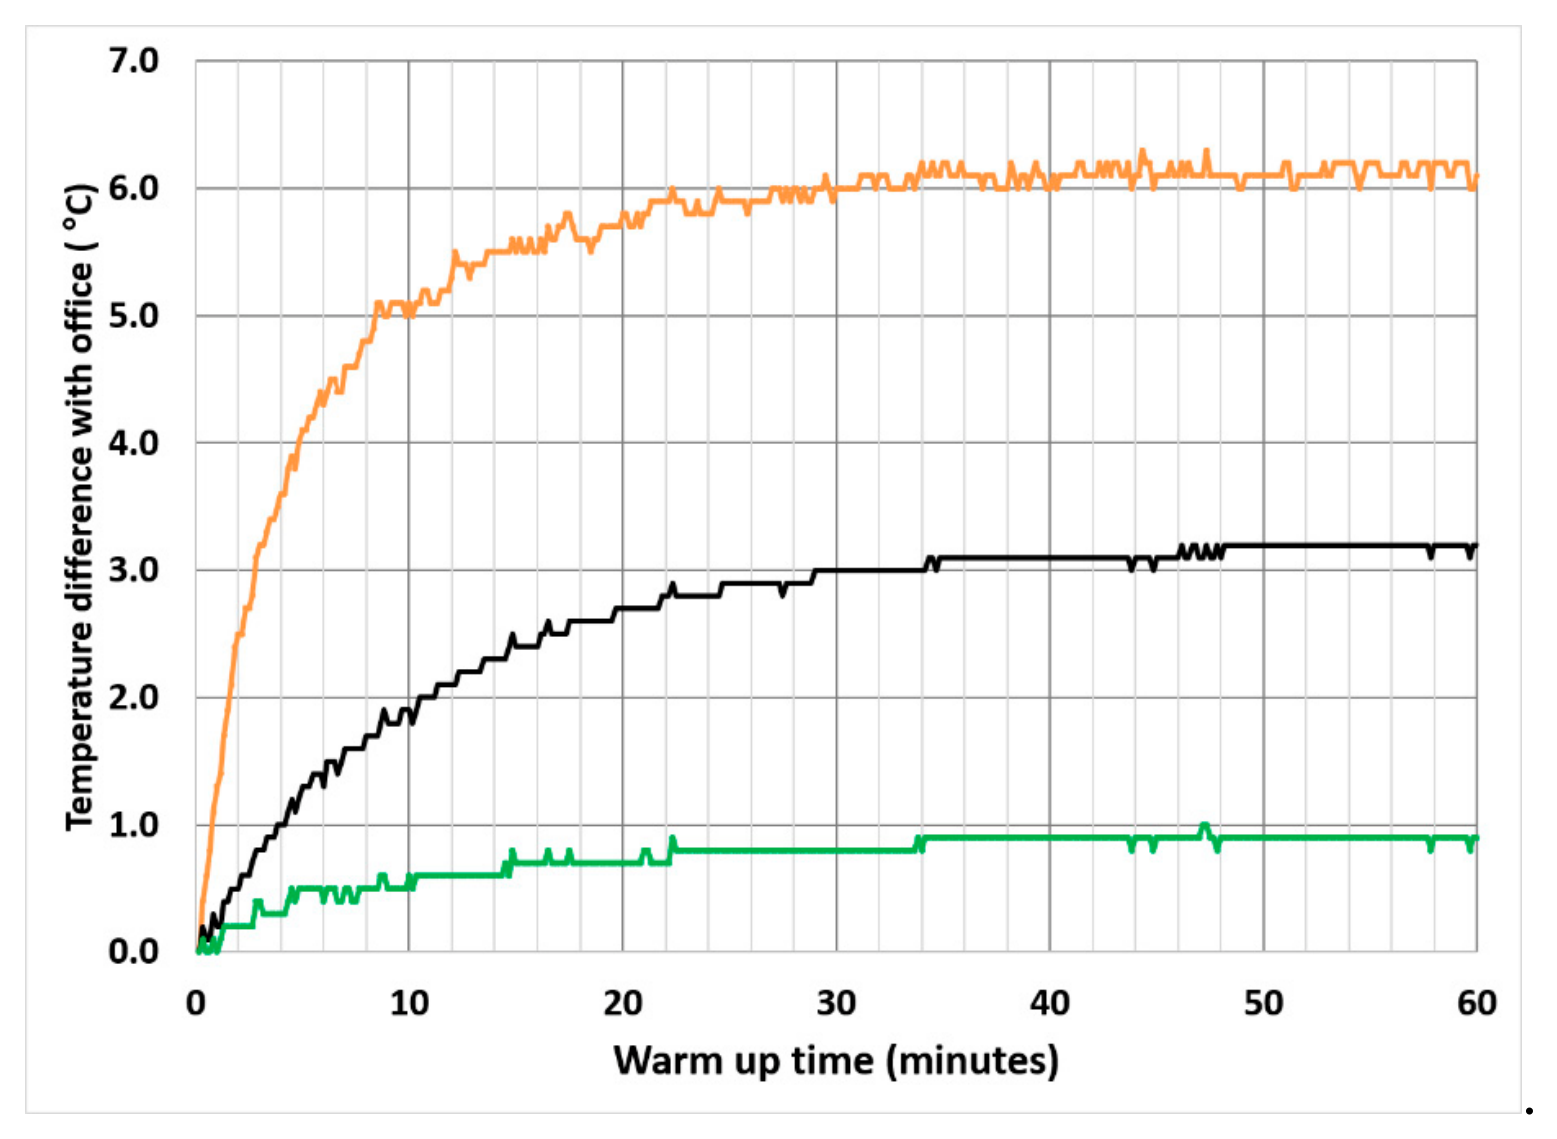
The large response to modest external airflow also demonstrates substantial thermal coupling among the custom PA PCB, the PMS sensors, and the enclosure. The temperature measurements do not determine how this coupling is partitioned among solid conduction, internal convection, and radiation; however, the strong reduction in PDZ temperature under forced external convection indicates that heat generated within the PA can be efficiently transferred to the enclosure and rejected to the surrounding air.
3.2. Heated PA Field Experiments
The outdoor experiments were designed to test a direct consequence of the thermal measurements: whether deliberately warming a PA enough to reproduce the low sample-relative-humidity (RH) environment used by regulatory PM2.5 monitors and nephelometers would alter the reported optical PM2.5. Santa Rosa provided the proof-of-concept experiment with direct thermocouple measurements at the particle detection zones (PDZs). Winston-Salem then provided a longer field scoping experiment alongside a T640x reference monitor and over a wider range of ambient humidity.
3.2.1. Heated PA Collocated with Standard PA and PMS in Santa Rosa
Effect of heating on PDZ temperature and RH - In the outdoor Santa Rosa experiments three degrees of increasing net heat were applied to the PMS: (1) standalone PMS with its PCB in contact with the ambient air; (2) next to a second PMS inside a PA with its additional PCB heat and an insulating PVC cover (“unheated standard PA”); (3) inside a heated standard PA. The experimental details are in Section 2.2.1. Figure 7a shows the PMS PDZ temperatures in the unheated and heated PurpleAir compared with ambient temperature for the period July 13-18, 2024. External PA heating produced a large additional PDZ temperature increase, especially during the cool, humid nighttime period. Figure 7b shows the PDZ RHs in the PMS, unheated PA, and the heated PA. The PDZ RH was calculated from the measured PDZ temperature and the ambient dew point. During the July 13-18 period, the maximum ambient RH was 82%, the maximum standalone PMS PDZ RH was 79%, the maximum unheated PA PDZ RH was 62% and the heated PA PDZ RH remained near 25–30%.
Effect of heating on PMS PM2.5 - In this field test the PM2.5 measured by the standalone PMS was used as an approximate “ambient reference” for comparing the unheated and heated PA PM2.5 because its PDZ RH was closest to ambient (Figure 7b). It was found that on average the heated PA reported a significantly lower PM2.5 compared to the stand-alone PMS, decreasing to approximately 40% lower for RH 80-90% (Figure 8a). The PM2.5 ratios above 60% ambient RH are statistically different than the 30-40% RH PM2.5 ratios at the 99.9% confidence level. This suggests that for these conditions the heated PA reduced the RH to 30-40% used by regulatory monitors, and that it resulted in significantly reducing the reported PM2.5 consistent with hygroscopic water loss. Neither aerosol water content nor the hygroscopic mass fraction was measured.
On average the unheated standard PA reported a slightly lower PM2.5 compared to the stand-alone PMS, decreasing to approximately 20% lower for RH 80-90% (Figure 8b). The PM2.5 ratios above 50% ambient RH are statistically different than the 30-40% RH PM2.5 ratios at the 99.9% confidence level. This is evidence that in this field test the hygroscopic aerosol is heated enough in a standard PA to lose roughly 20% of the total PM2.5 at ambient RH 80-90%. This was less than the 40% loss in the heated PA, suggesting that in normal operation a standard PA heats up the air enough to lose some of the hygroscopic water but not all of it.
Further experiments with known hygroscopic mass fractions and ambient RH > 90% would be useful to quantify the effect of RH on heated and unheated PAs. The standalone PMS in contact with the ambient air may be a reasonable basis of comparison.
3.2.2. Heated PA Collocated with Standard PA and T640x in Winston-Salem
The purpose of the Winston-Salem field test is to see if heating the PA can reduce the PM2.5 difference between a regulatory monitor and a standard PA at elevated RH.
Effect of heating on PA RH - 907 hours of collocated data were collected between August 9 and September 21, 2024. During this time the ambient RH ranged from 27.2 to 96.6% and averaged 69.9%. The results were similar to the Santa Rosa field test. The PA heater produced a large and persistent reduction in the RH measured by its BME280. This can be seen in Figure 9 which provides a one-week snapshot of the RH inside the T640x PM2.5 monitor, the heated and unheated PurpleAirs, and at the nearby airport. The unheated PA followed the diurnal ambient RH cycle but at a lower RH, from approximately 30 to 76%. The heated PA also followed the diurnal cycle but at a much lower RH, from 15 to 42%. The T640x RH was controlled to 35% RH.
Effect of heating on PA PM2.5 – The Winston-Salem field test did not include a standalone PMS for direct comparison with the heated and unheated PAs like Santa Rosa. The PA results were compared with a collocated regulatory Teledyne T640x PM2.5 monitor.
The average unheated PA/T640x PM2.5 ratio increased slightly with ambient RH (Figure 10a) from approximately 1.20 at 40% RH to 1.50 in the 90-100% RH interval. The PM2.5 ratios above 60% ambient RH are statistically different than the 40-50% RH PM2.5 ratios at the 99.9% confidence level. The small average increase in the PM2.5 ratio with RH may be due to a low average hygroscopic mass fraction (HMF) in the ambient aerosol during the field test. The HMF was not measured. The large scatter in the data is likely due to hourly changes in particle size distribution.
The average heated PA/T640x PM2.5 ratio increased slightly from 40% to 60% RH but did not increase thereafter with increasing RH (Figure 10b). The average PM2.5 ratio in the 50-60% RH bin was 1.31, and the average PM2.5 ratio in the 90-100% RH bin was 1.34. This suggests that heating the PA reduced the hygroscopic aerosol water at higher RH as desired.
A follow-up field test at a location with a greater HMF using a standalone PMS, heated and unheated PAs, and a FEM PM2.5 monitor would provide a stronger test of progressively heating the PAs on PM2.5.
3.3. Three-Dimensional Airflow and Heat-Transfer Modeling
3.3.1. PMS Flow and Heat-Transfer Modeling
3.3.1.1. Plenum Airflow Distribution, Residence Time, and Heating
SimScale calculations showed air entering through the plenum’s four inlets formed relatively fast streams that curved toward the three plenum outlets (Figure 11). Much of the remaining plenum had considerably lower velocities and recirculating flow. Thus, rapidly transported air coexisted with air that remained in the plenum much longer. The transient simulation confirmed this behavior. Some air reached the outlet rapidly, while other air exchanged more slowly with the main flow. The residence-time distribution peaked at approximately 0.25 s but had a tail extending for several seconds. The mean residence time was approximately 0.62 s.
Plenum airflow heating
SimScale simulations showed that airflow heating in the plenum was spatially nonuniform. Some air moved rapidly from the inlet to the outlet, while slower-moving air had more time to warm. Together, the flow and temperature simulations show that measurable warming begins in the plenum adjacent to the heat-producing PCB and continues as the air moves toward the PDZ. The modeled temperature increased from approximately 20 °C at the inlet to approximately 23 °C near the plenum outlet (Figure 12). This modeled 3.0°C rise exceeded the measured standalone-PMS PDZ rise of approximately 1.8 °C (Figure 4). The difference may be due to simplifications in the plenum CAD model and the PCB conduction pathways. Recall that the airflow removed only 16% of the heat produced in the PMS (Section 3.1.1). Figure 12 shows that most of the flow has poor contact with the 188 mW PMS PCB.
3.3.1.2. Region 1 Airflow Distribution, Residence Time, and Particle Losses
SimScale simulations showed that the flow immediately downstream of the three plenum outlets and on the other side of the plenum (“Region 1”), had a highly tortuous and nonuniform internal flow. The jets turned, spread, and merged within a large low-velocity volume before converging toward the outlet. Despite this complex path, the outlet-face velocity became comparatively uniform at 0.57 m s−1. (Figure 13).
The calculated residence time distribution of air in Region 1 was broad due to the stagnant zones in blue in Figure 13. The mean residence time in Region 1 was 0.080 sec. It appears that Region 1 acts primarily as a compact flow-conditioning passage and provides little time for additional sample-air heating. Heat-transfer modeling was not conducted for Region 1.
Figure S2 provides photographic evidence of aerosol deposits and particle losses in Region 1. The dominant mechanism is larger particle impaction as a result of the airflow speed and tortuous path.
3.3.2. PA Conjugate Heat-Transfer Modeling
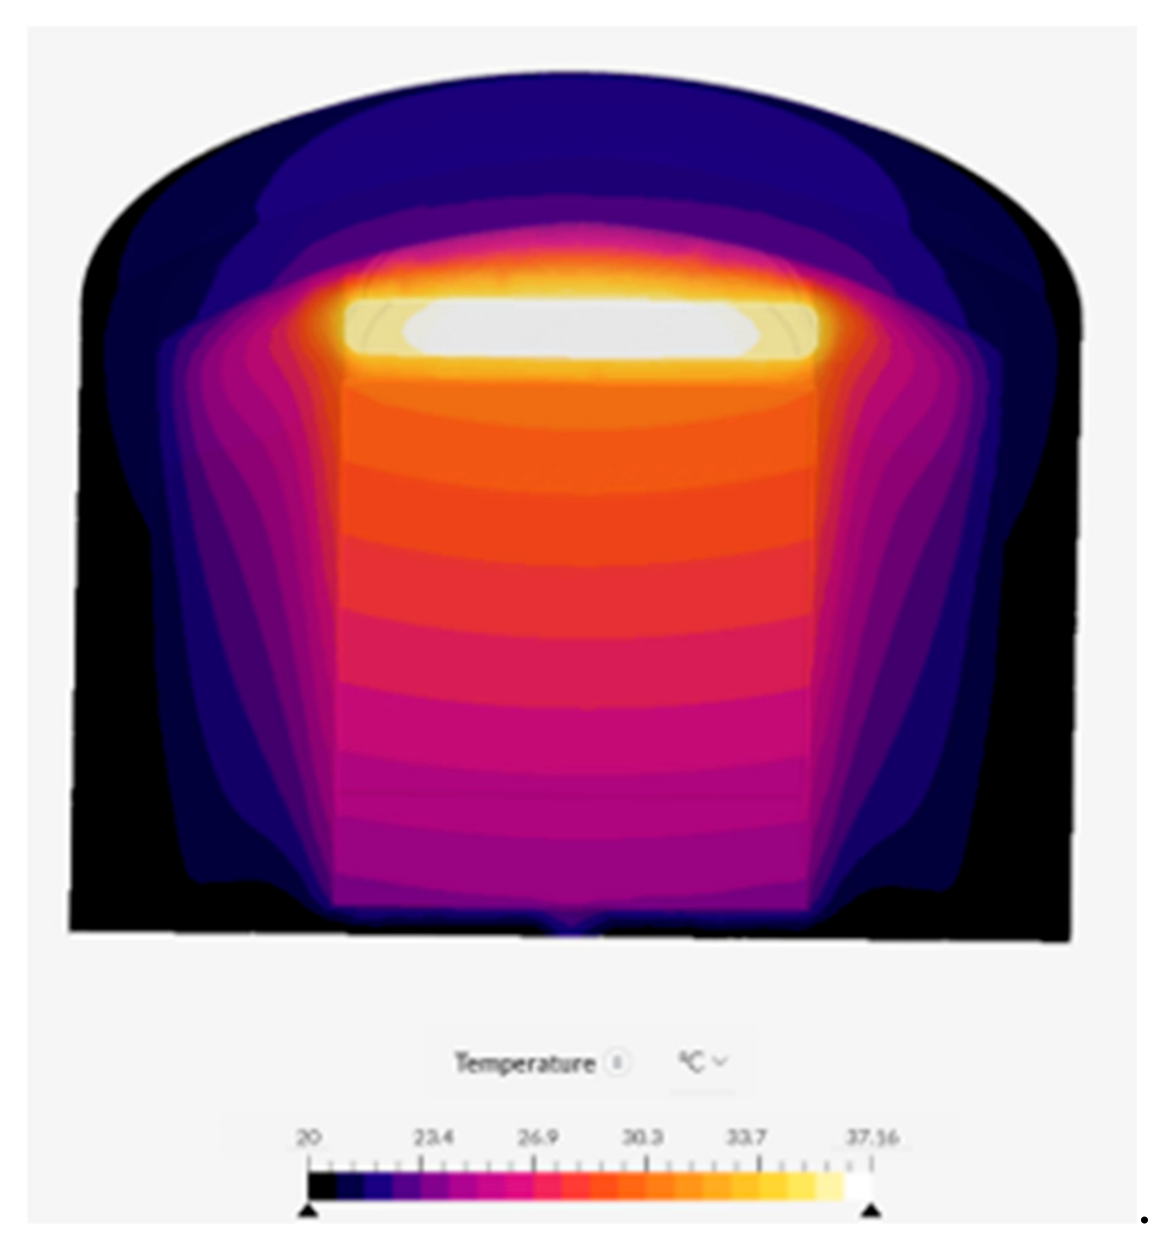
The SimScale simulations predicted temperature vs. time in a number of PA locations, including the PMS PDZ, the dome air, the PA PCB, and the PVC walls. The simulations qualitatively reproduced the PA behavior which had been observed experimentally. The measured vs. modeled warmup time in the PDZ during calm conditions were 51 vs. 45 minutes, respectively. With the low wind case of h = 2 W m−2 K−1, the modeled dome air temperature rise after 30 min was 4.15 °C, compared with the measured rise of approximately 7 °C (Figure 5). Increasing the wind speed and external cooling to h = 40 W m−2 K−1 reduced the modeled dome rise to 1.16 °C, whereas the 3.5 m s−1 fan experiment still produced a 6.1 °C dome rise. Thus, stronger modeled convection produced the correct directional response but overcooled the enclosure. The modelled PCB temperature tended to be significantly hotter than measured (Figure 15), indicating that the heat transfer from the PCB to the rest of the PA was not correctly captured by the simulation.
These discrepancies indicate that the real PA contains distributed thermal masses and resistances which were not captured by simplified geometry, particularly the PCB contact conductance.
4. Discussion
This study shows that the air sampled by the PMS is not necessarily measured under ambient conditions. Heat generated within the sensor warms the sampled air before optical detection, and installation of the PMS within a PA enclosure produces additional warming. Room air measurements showed measurable warming in a standalone PMS and greater, spatially nonuniform warming in the complete PA. The Santa Rosa field experiment showed that a normally operated PA can report a PM2.5 lower than ambient because of loss of some hygroscopic aerosol water due to circuit board heating. But the heated PA results show that hygroscopic aerosol in the unheated PA can still retain significant water at high RH.
In Winston-Salem, the heated PA was able to maintain a low internal RH similar to a Teledyne T640x across a wide range of ambient humidity. The heated PA/T640x PM2.5 ratio showed did not increase at high ambient RH, suggesting that the heated PA may have been able to remove hygroscopic aerosol water as efficiently as the T640x. However, the water loss was not measured.
The flow and heat-transfer simulations provide a qualitative mechanistic framework for these observations. The PMS sample follows a complex path through the inlet plenum and downstream Region 1, but the flow becomes comparatively uniform before entering the PDZ. The simulations were most useful for identifying flow structure, fluid age, and qualitative heat-transfer behavior; discrepancies between modeled and measured PA temperatures also show the limitations of simplified thermal models and the importance of experimental constraints.
One useful next application would be a side-by-side deployment of heated and unheated PurpleAirs at sites with larger hygroscopic aerosol mass fractions, where controlled heating could produce larger differences in reported PM2.5 than observed in the present study.
More broadly, the combination of inexpensive measurements, simple controlled experiments, three-dimensional geometry, and accessible CFD provides a practical framework for investigating the heat and mass transfer of low-cost particle sensors. Extending this framework to other sensor designs could improve interpretation of field measurements, reveal sensor-specific differences in aerosol conditioning, and provide a more physical basis for evaluating humidity effects and developing PM2.5 corrections.
Supplementary Materials
The following supporting information can be downloaded at the website of this paper posted on Preprints.org Figure S1 and Figure S2 can be downloaded at https://zenodo.org/uploads/23400029.
Funding
This research received no external funding.
Data Availability Statement
Acknowledgments
It is a pleasure to acknowledge Greg Perrotte and Cary Gentry, Forsyth County OEAP, Winston-Salem North Carolina for operating the heated PA at their monitoring station. The author appreciates the assistance provided by Ricardo Gasparinin of SimScale in setting up use cases.
Conflicts of Interest
The author declares no conflicts of interest.
Abbreviations
The following abbreviations are used in this manuscript:
| PMS | Plantower Model PMS5003 particle sensor |
| PA | PurpleAir Type II particulate monitor |
| PDZ | Particle detection zone. The location of the Plantower Model PMS5003 laser where particles intercept the laser beam and scatter light to the photodetector |
| HMF | Aerosol hygroscopic mass fraction. The ratio of the dry hygroscopic aerosol (such sulfates and nitrates) mass to the total dry PM2.5 mass. |
| CFD | Computational fluid dynamics |
| BME280 | Bosch model BME280 RH, temperature, and pressure sensor |
| CAD | computer-aided design |
| PVC | polyvinyl chloride |
| PCB | printed circuit board |
| AQS | official EPA air quality monitoring station |
References
- Ahlawat, A.; Julaha, K.; Tiwari, P.; et al. Drone measurements reveal high near-surface urban haze. npj Clean Air 2026, 2, 8. [Google Scholar] [CrossRef]
- Bergman, T. L.; Lavine, A. S.; Incropera, F. P.; DeWitt, D. P. Fundamentals of Heat and Mass Transfer, 7th ed.; John Wiley & Sons: Hoboken, NJ, 2011. [Google Scholar]
- Broda, M.; Zawadzka-Mańko, O.; Chiliński, M. T.; Nurowska, K.; Kłapiński, S.; Makuch, P.; Markowicz, K. M. A new balloon-borne system for measuring the vertical variability of aerosol optical properties using low-cost sensors. Atmos. Meas. Tech. 2026, 19, 5989–6014. [Google Scholar] [CrossRef]
- Couzo, E.; Valencia, A.; Gittis, P. Evaluation and correction of PurpleAir temperature and relative humidity measurements. Atmosphere 2024, 15(4), 415. [Google Scholar] [CrossRef]
- Hacohen, J.; Chiu, T. W.; Wragg, A. A. Forced and free convective heat transfer coefficients for a model printed circuit board channel geometry. Exp. Therm. Fluid Sci. 1995, 10, 327–334. [Google Scholar] [CrossRef]
- Kim, S. H.; Anand, N. K. Laminar developing flow and heat transfer between a series of parallel plates with surface-mounted discrete heat sources. Int. J. Heat Mass Transf. 1994, 37, 2231–2244. [Google Scholar] [CrossRef]
- Lee, Y.-M.; Le, T.-C.; Chen, Y.-C.; Hong, G.-H.; Lin, G.-Y.; Tsai, C.-J. Fundamental study of horizontal wind velocity effect on PM2.5 and PM10 sampling accuracy of low-cost sensors. J. Aerosol Sci. 2025, 189, 106645. [Google Scholar] [CrossRef]
- Ouimette, J.; Sheridan, P.; Burley, J.; Schichtel, B. Estimating the aerosol scattering coefficient in near-pristine locations with a low-cost sensor. AGU Fall Meeting, San Francisco, CA, USA, 9–13 December 2019; 2019. Available online: https://ui.adsabs.harvard.edu/abs/2019AGUFM.A43P2931O/abstract.
- Ouimette, J.; Arnott, W. P.; Laven, P.; Whitwell, R.; Radhakrishnan, N.; Dhaniyala, S.; et al. Fundamentals of low-cost aerosol sensor design and operation. Aerosol Sci. Technol. 2024, 58(1), 1–15. [Google Scholar] [CrossRef]
- Roostaei, V.; Abbasi, A.; Gharibzadeh, F.; Faridi, S.; Naddafi, K.; Yunesian, M.; Hassanvand, M. S. Vertical distribution of air particulate matter (PM1, PM2.5, and PM10) in different regions of Tehran. Aerosol Air Qual. Res. 2024, 24, 240036. [Google Scholar] [CrossRef]
- Wexler, A. S.; Seinfeld, J. H. Analysis of aerosol ammonium nitrate: Departures from equilibrium during SCAQS. Atmospheric Environment. Part A. General. Top. 1992, 26(4), 579–591. [Google Scholar]
Figure 1.
Plantower PMS5003 with the covers off to expose the sample airflow through the plenum containing the heated printed circuit board. The laser particle detection zone is on the other side of the plenum.
Figure 1.
Plantower PMS5003 with the covers off to expose the sample airflow through the plenum containing the heated printed circuit board. The laser particle detection zone is on the other side of the plenum.
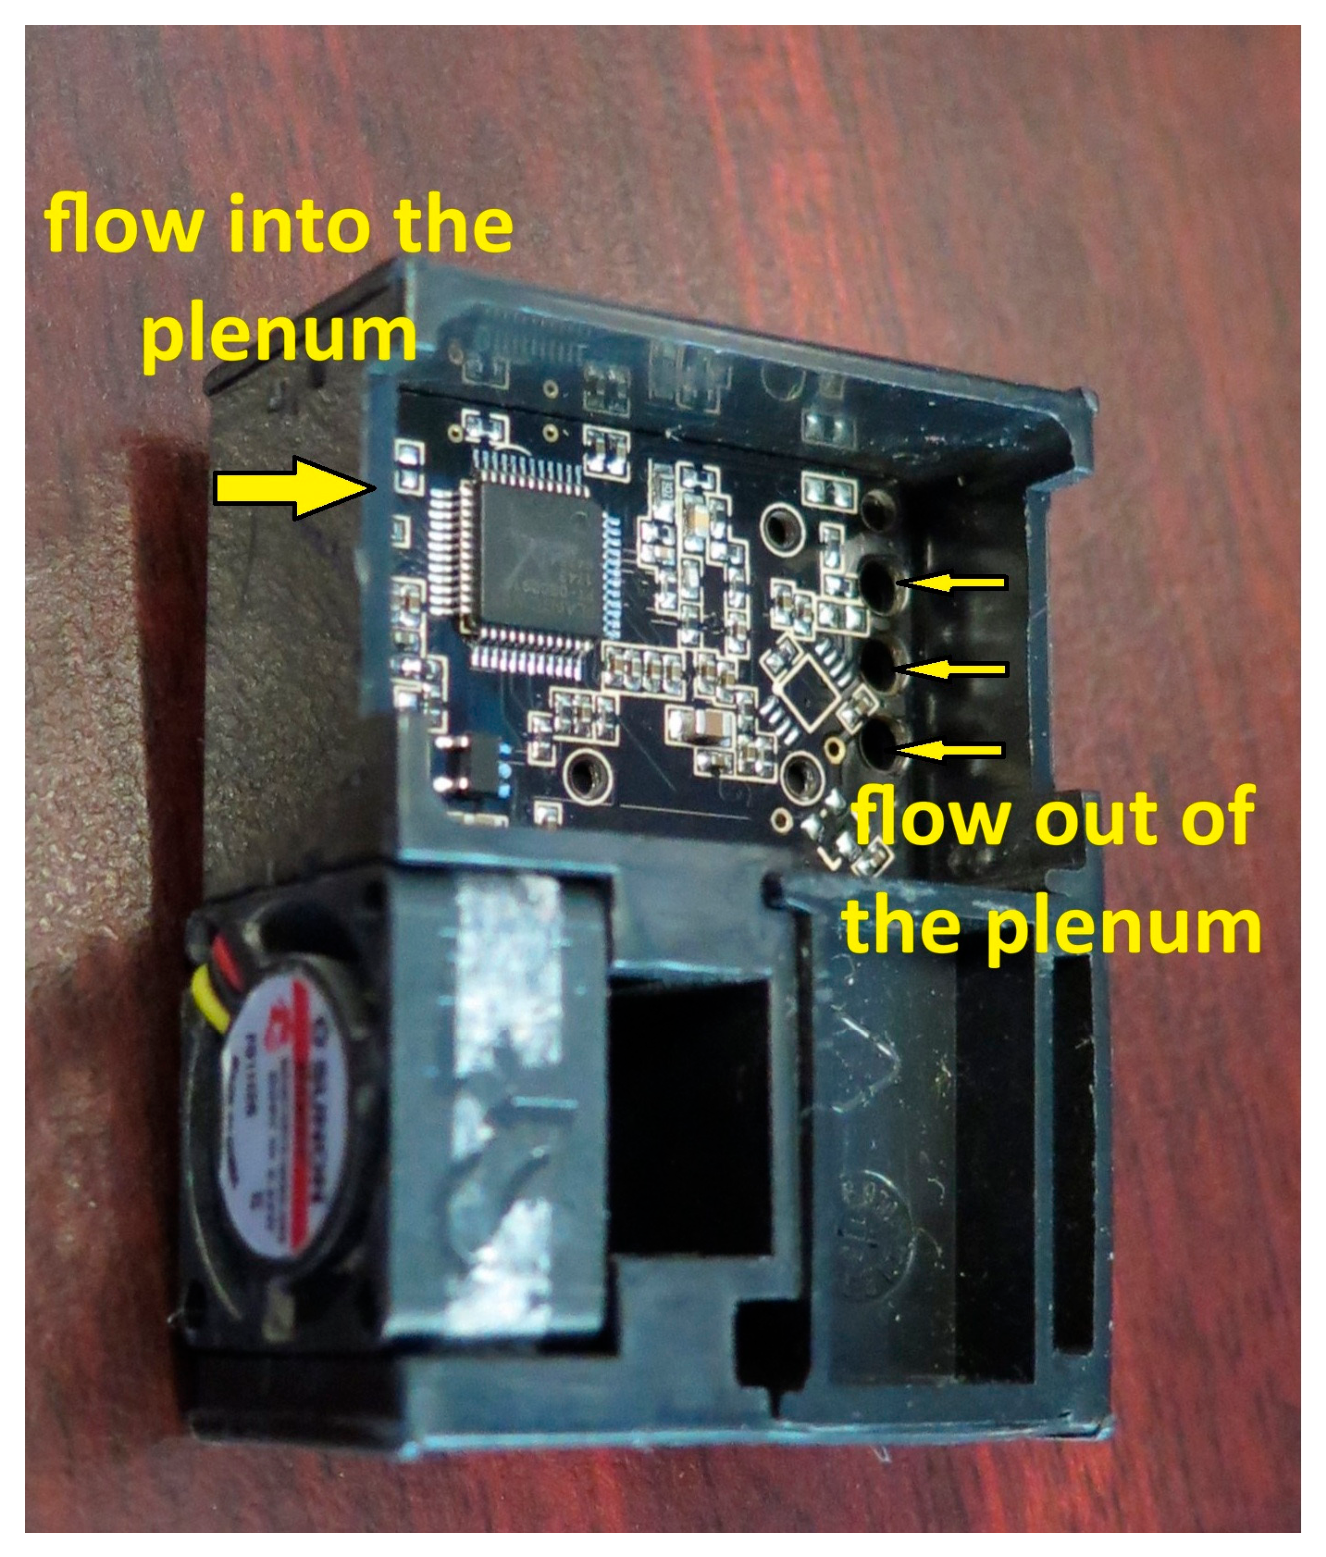
Figure 2.
Disassembled PurpleAir showing the components.
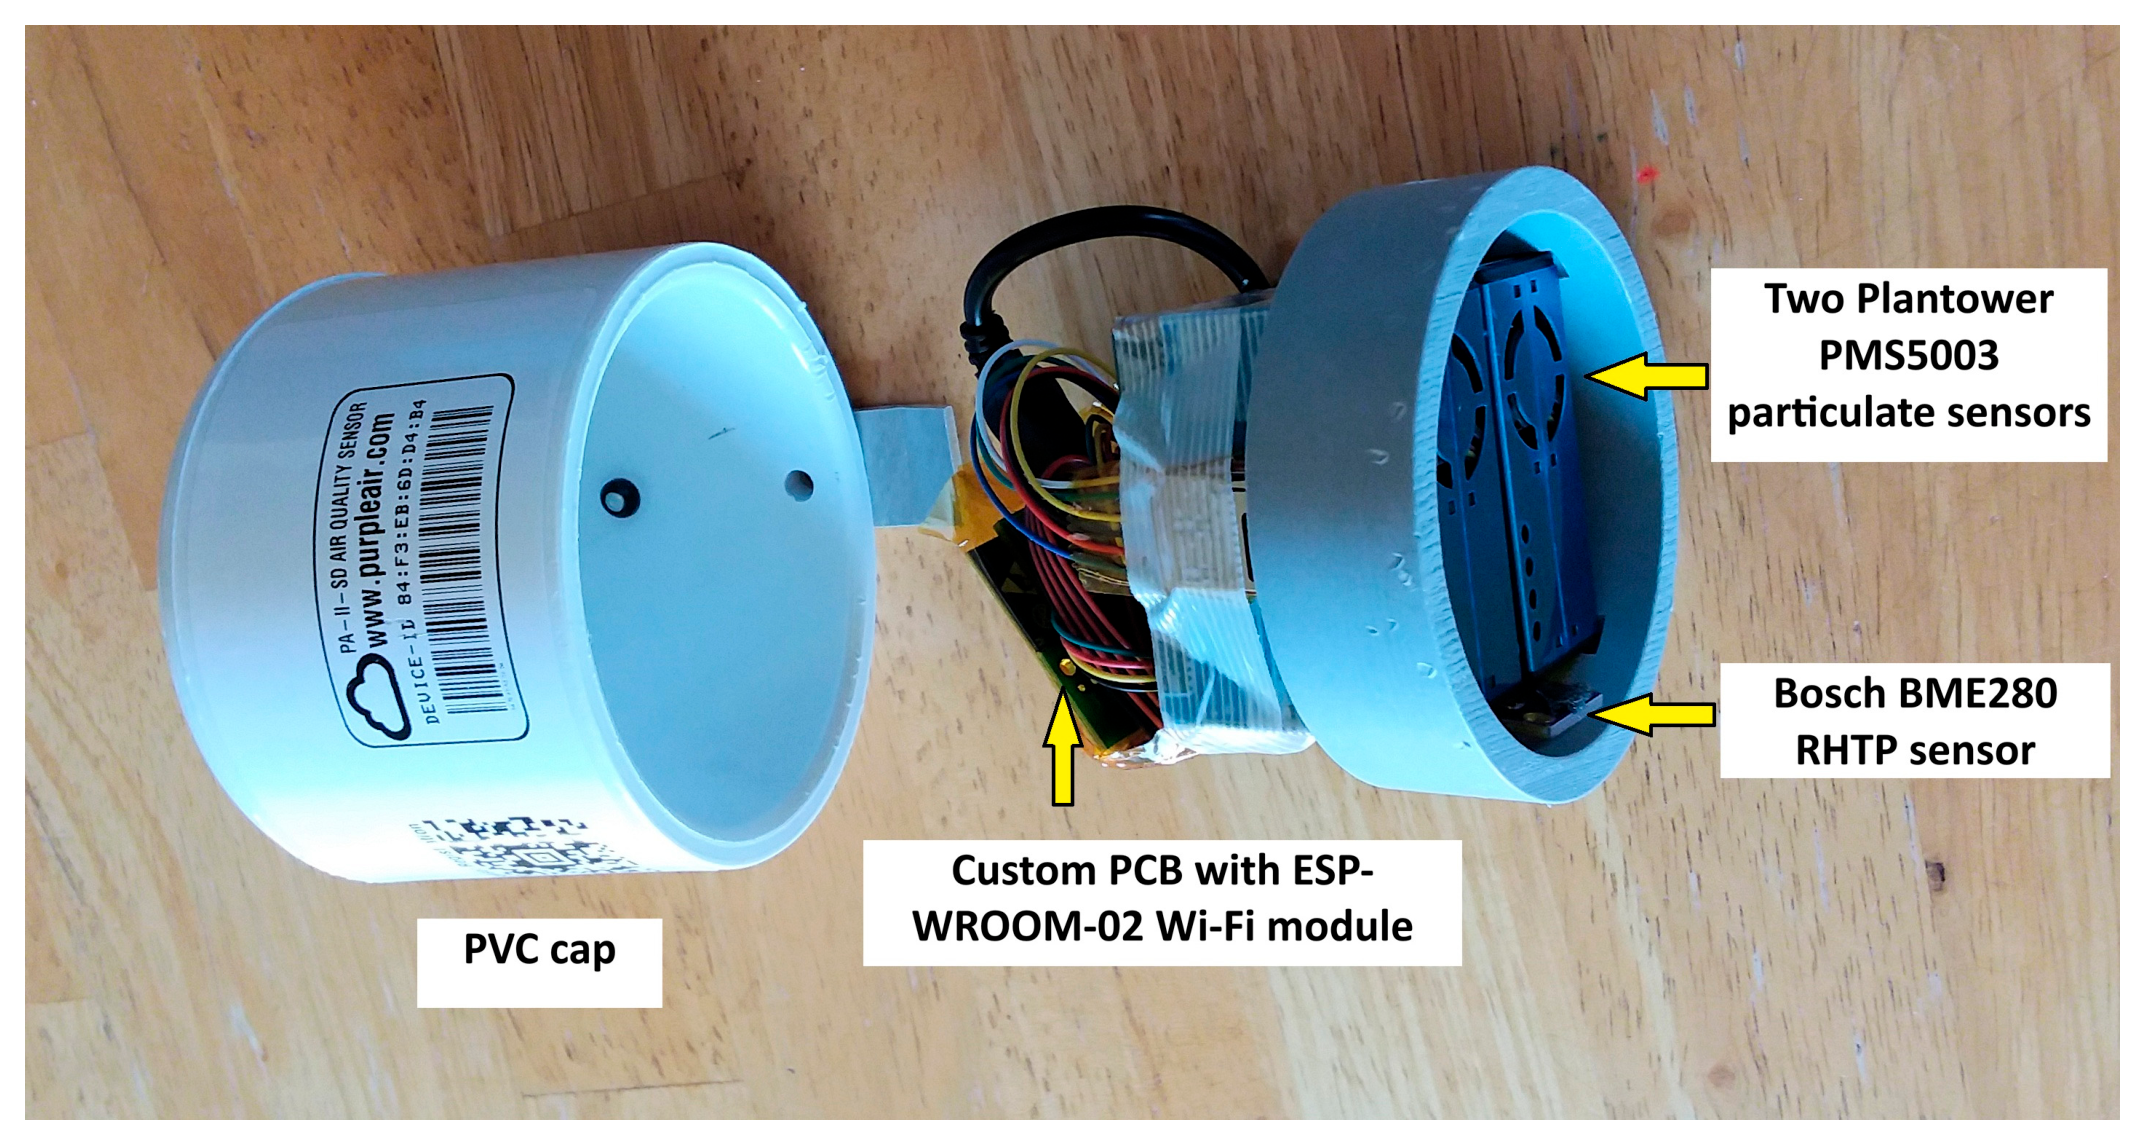
Figure 3.
Location of thermocouple and PMS5003 particle detection zone.
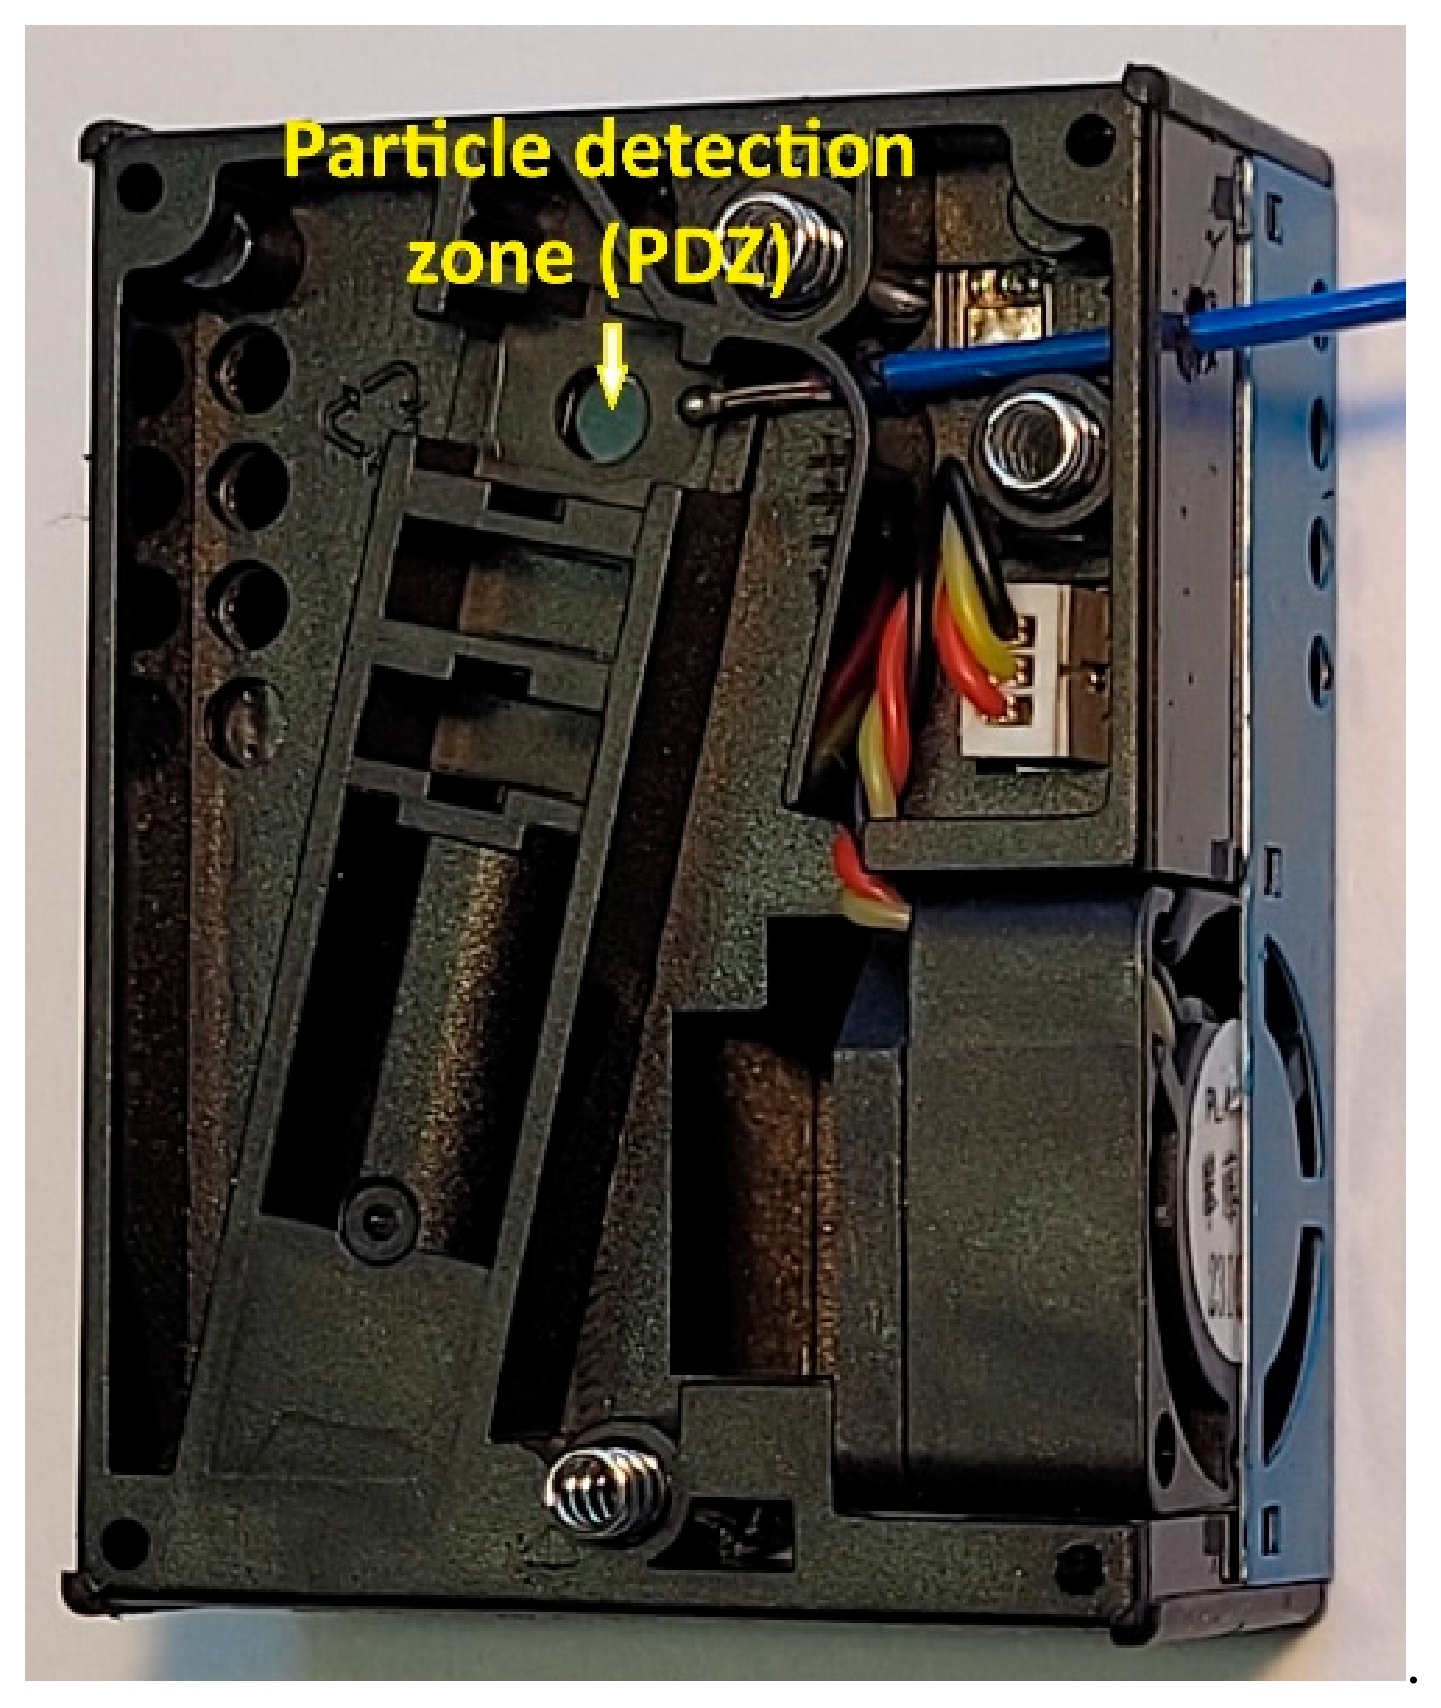
Figure 4.
PMS5003 PDZ temperature minus ambient office temperature following power-up.
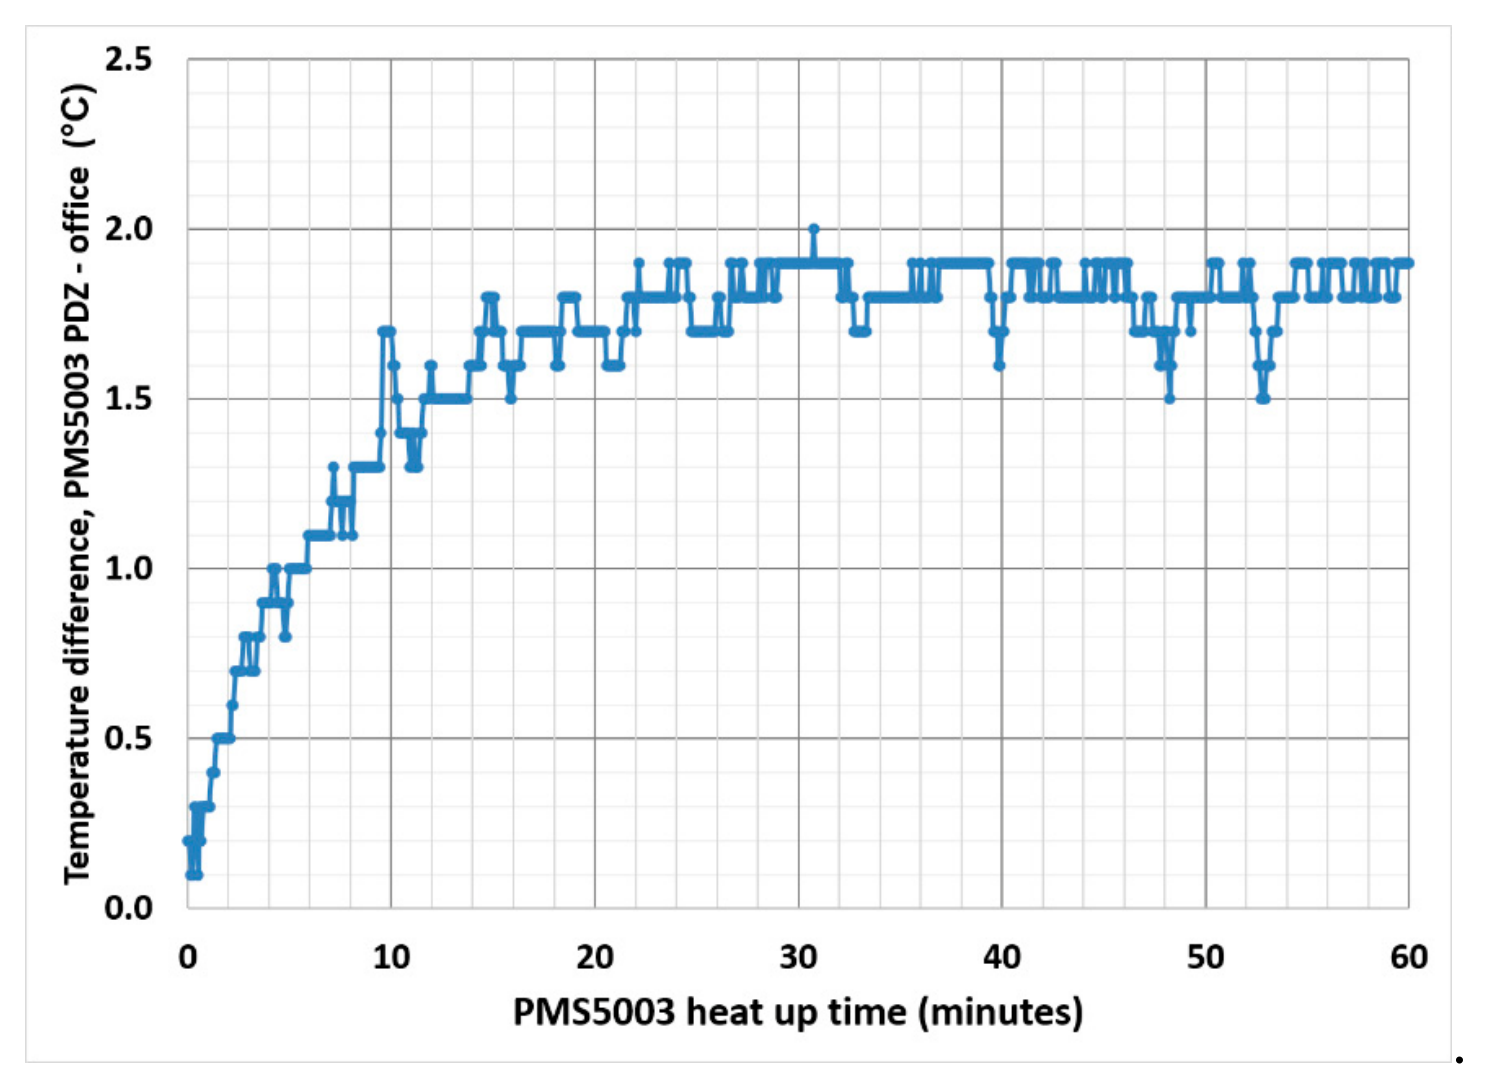
Figure 5.
PurpleAir warmup time in office. Dome and PDZ temperatures in orange and black, respectively. BME280 temperature in green.
Figure 5.
PurpleAir warmup time in office. Dome and PDZ temperatures in orange and black, respectively. BME280 temperature in green.
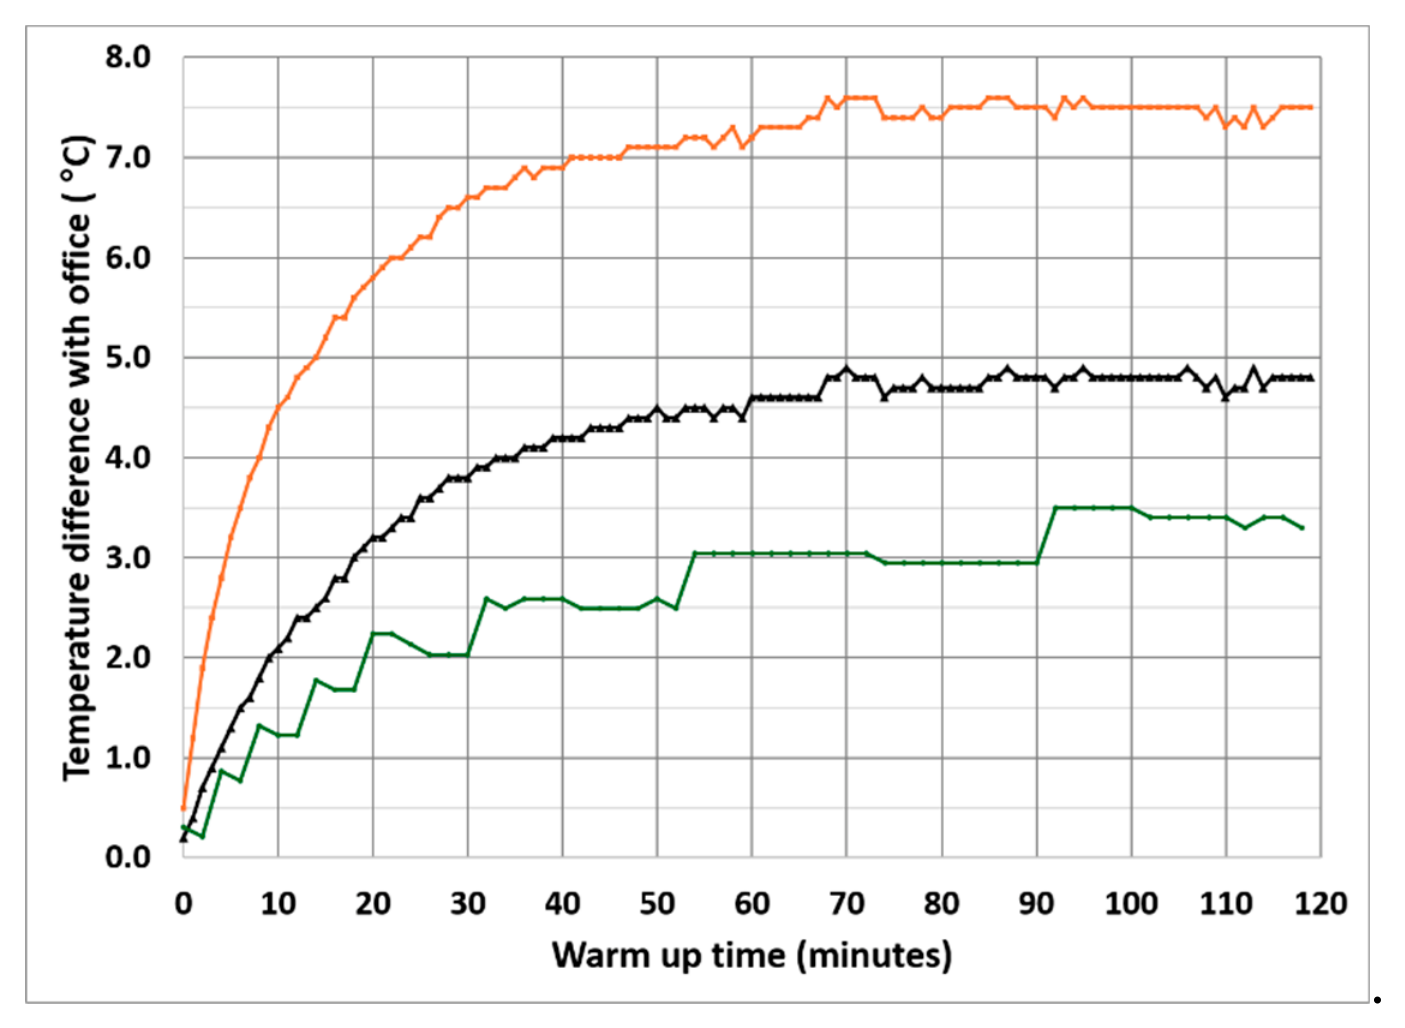
Figure 7.
ab.Thermocouple-measured (a) PDZ temperatures and (b) calculated PDZ RH in the standalone PMS5003, unheated, and heated PurpleAirs compared with ambient temperature in Santa Rosa, July 13–18, 2024.
Figure 7.
ab.Thermocouple-measured (a) PDZ temperatures and (b) calculated PDZ RH in the standalone PMS5003, unheated, and heated PurpleAirs compared with ambient temperature in Santa Rosa, July 13–18, 2024.
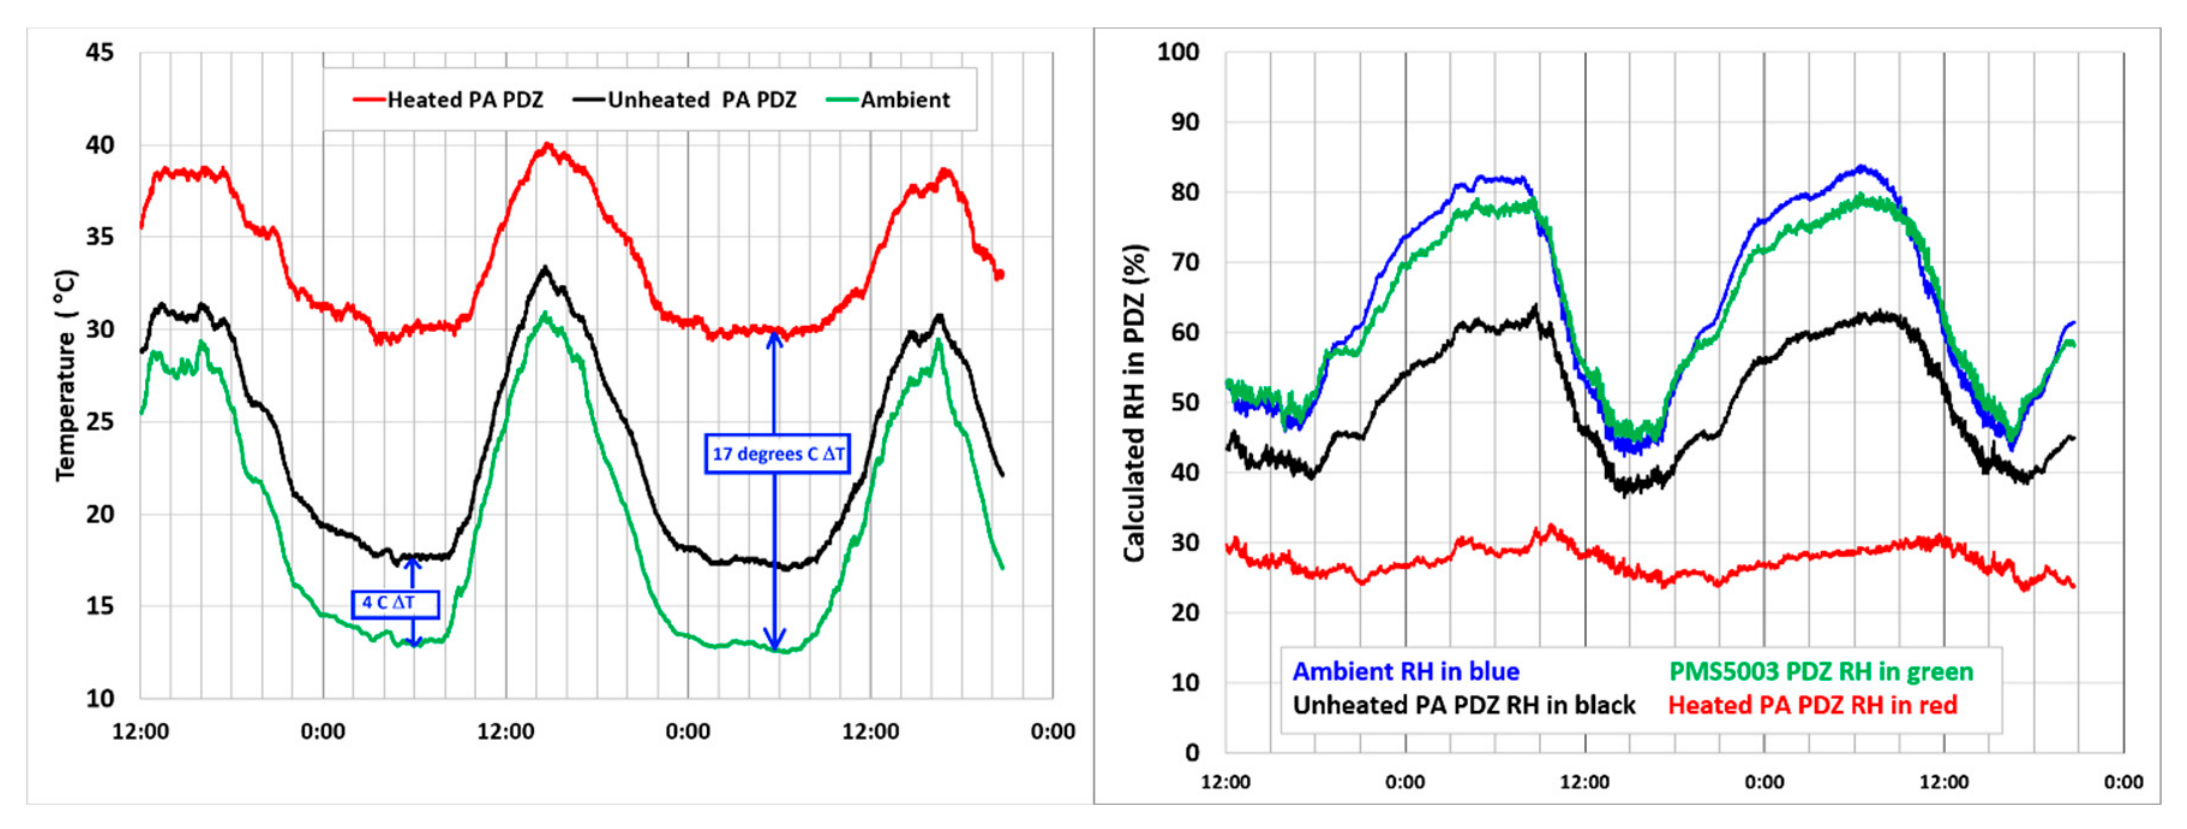
Figure 8.
ab. 30-min average PM2.5 ratios for (a) the (heated PurpleAir)/(standalone PMS5003) vs. ambient RH and (b) the (unheated PurpleAir)/(standalone PMS5003) vs. ambient RH. Raw data in blue and ratio averages in 10% RH increments in black line. Data from Santa Rosa, California, outdoor experiment July 13-28, 2024.
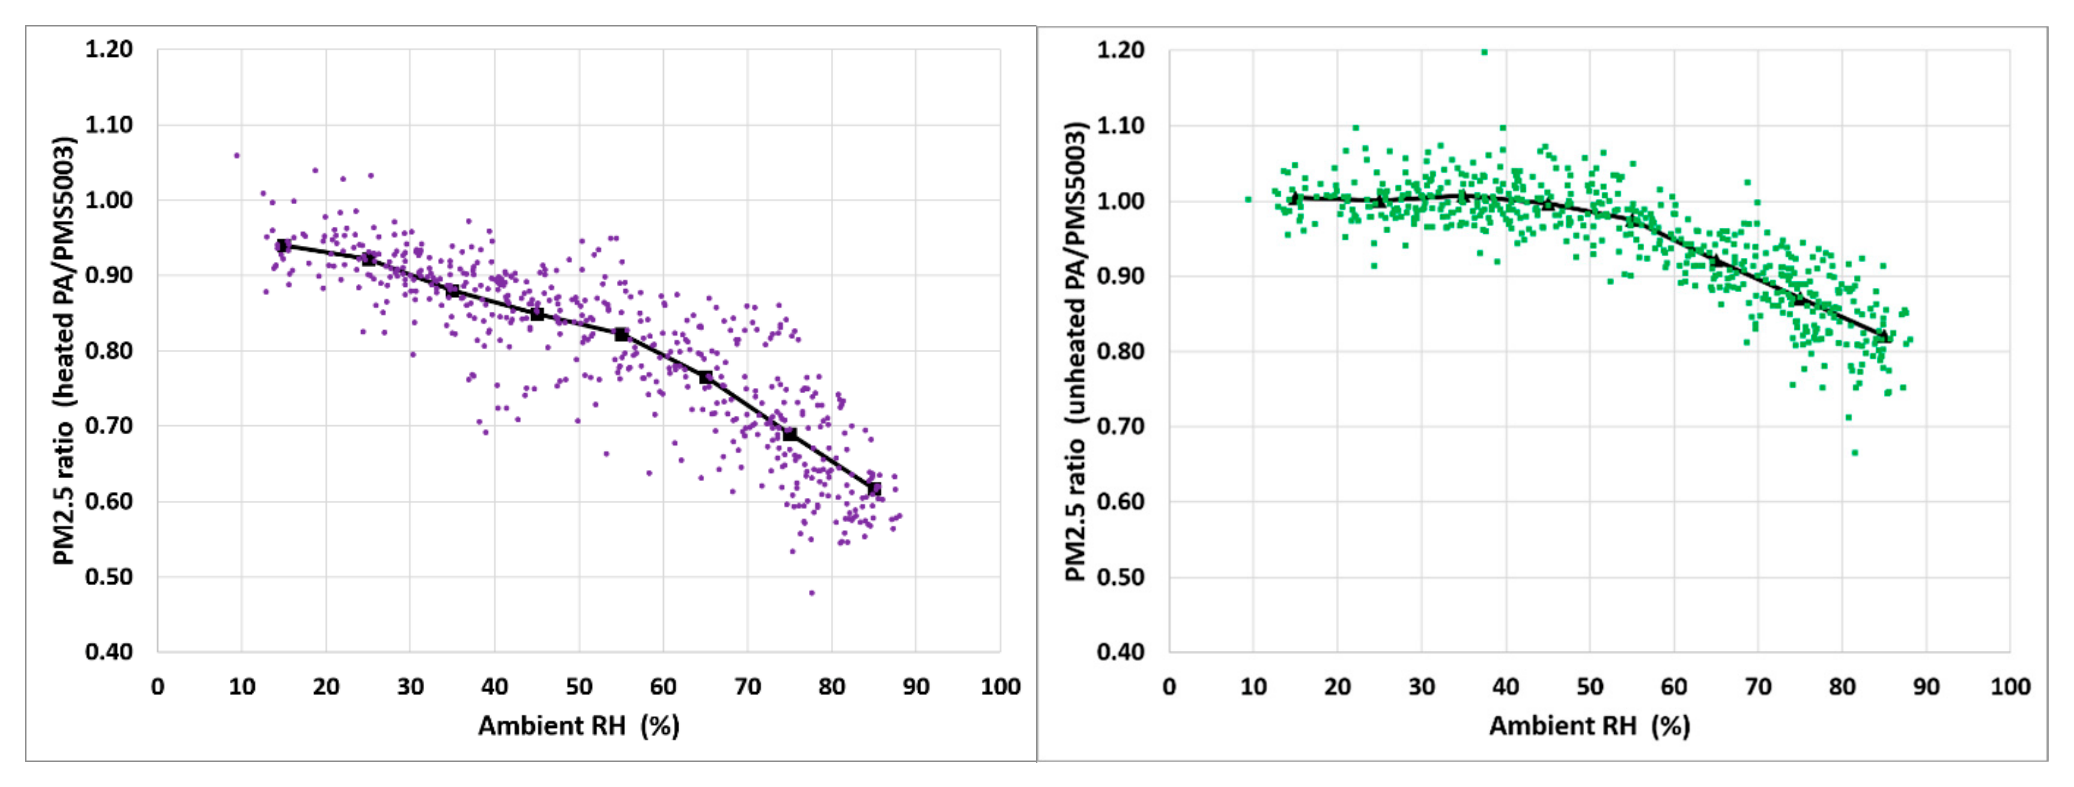
Figure 9.
Hourly average RH - airport ambient RH (green), unheated PA6008 BME280 RH (purple), heated PA231852 BME280 RH (red), and inside the T640x detection zone RH (blue). August 9-15, 2024, Hattie St. AQS station, Winston-Salem, NC. .
Figure 9.
Hourly average RH - airport ambient RH (green), unheated PA6008 BME280 RH (purple), heated PA231852 BME280 RH (red), and inside the T640x detection zone RH (blue). August 9-15, 2024, Hattie St. AQS station, Winston-Salem, NC. .
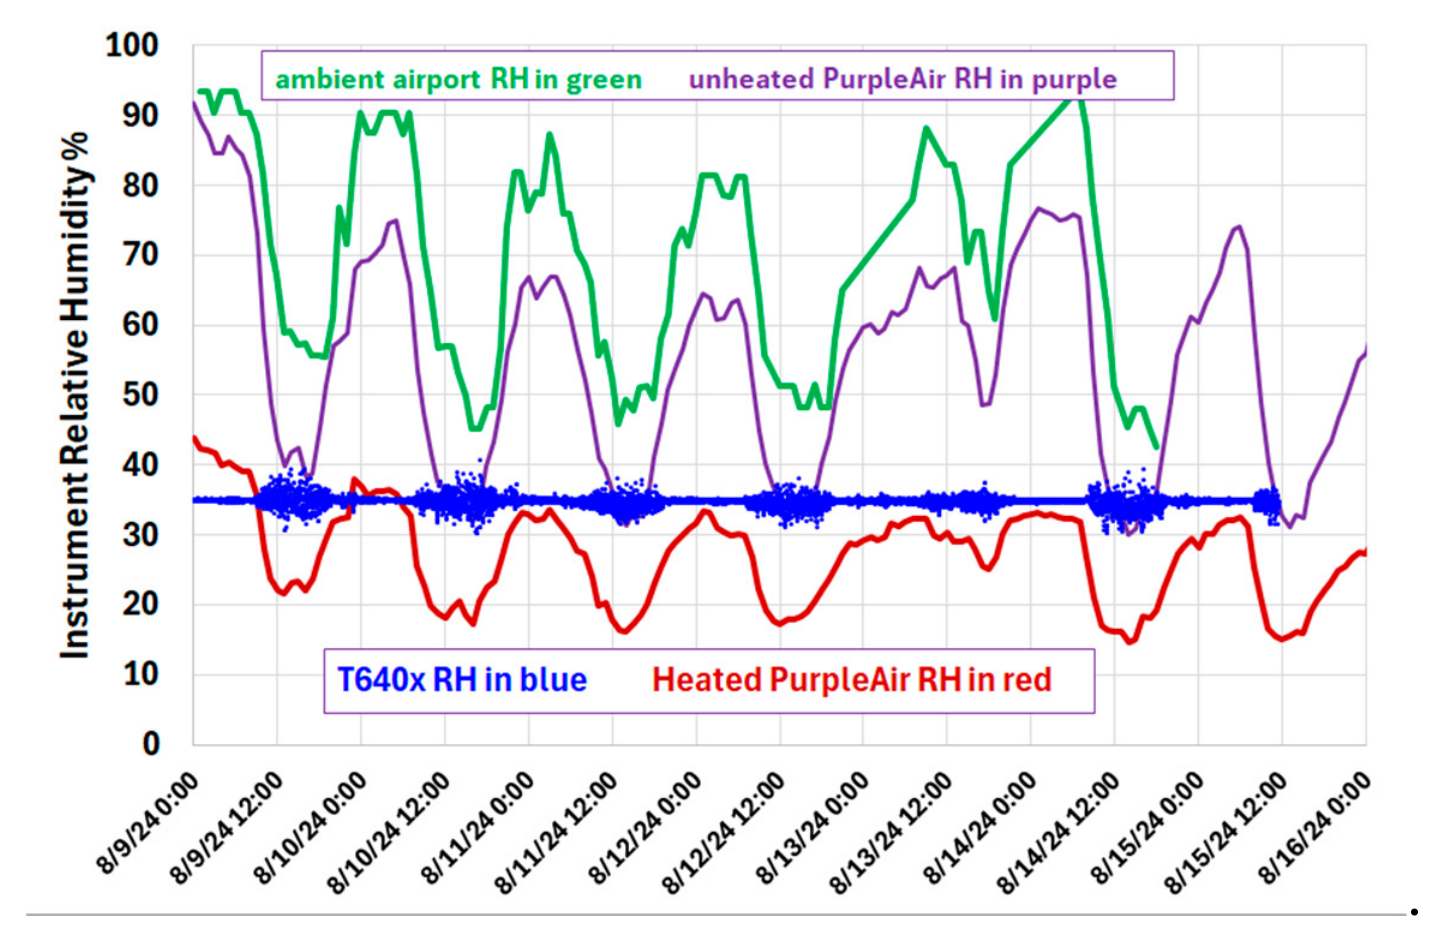
Figure 10.
ab. Unheated and heated PM2.5 ratios. August 9 – September 21, 2024, Hattie St. AQS station, Winston-Salem, NC. .
Figure 10.
ab. Unheated and heated PM2.5 ratios. August 9 – September 21, 2024, Hattie St. AQS station, Winston-Salem, NC. .
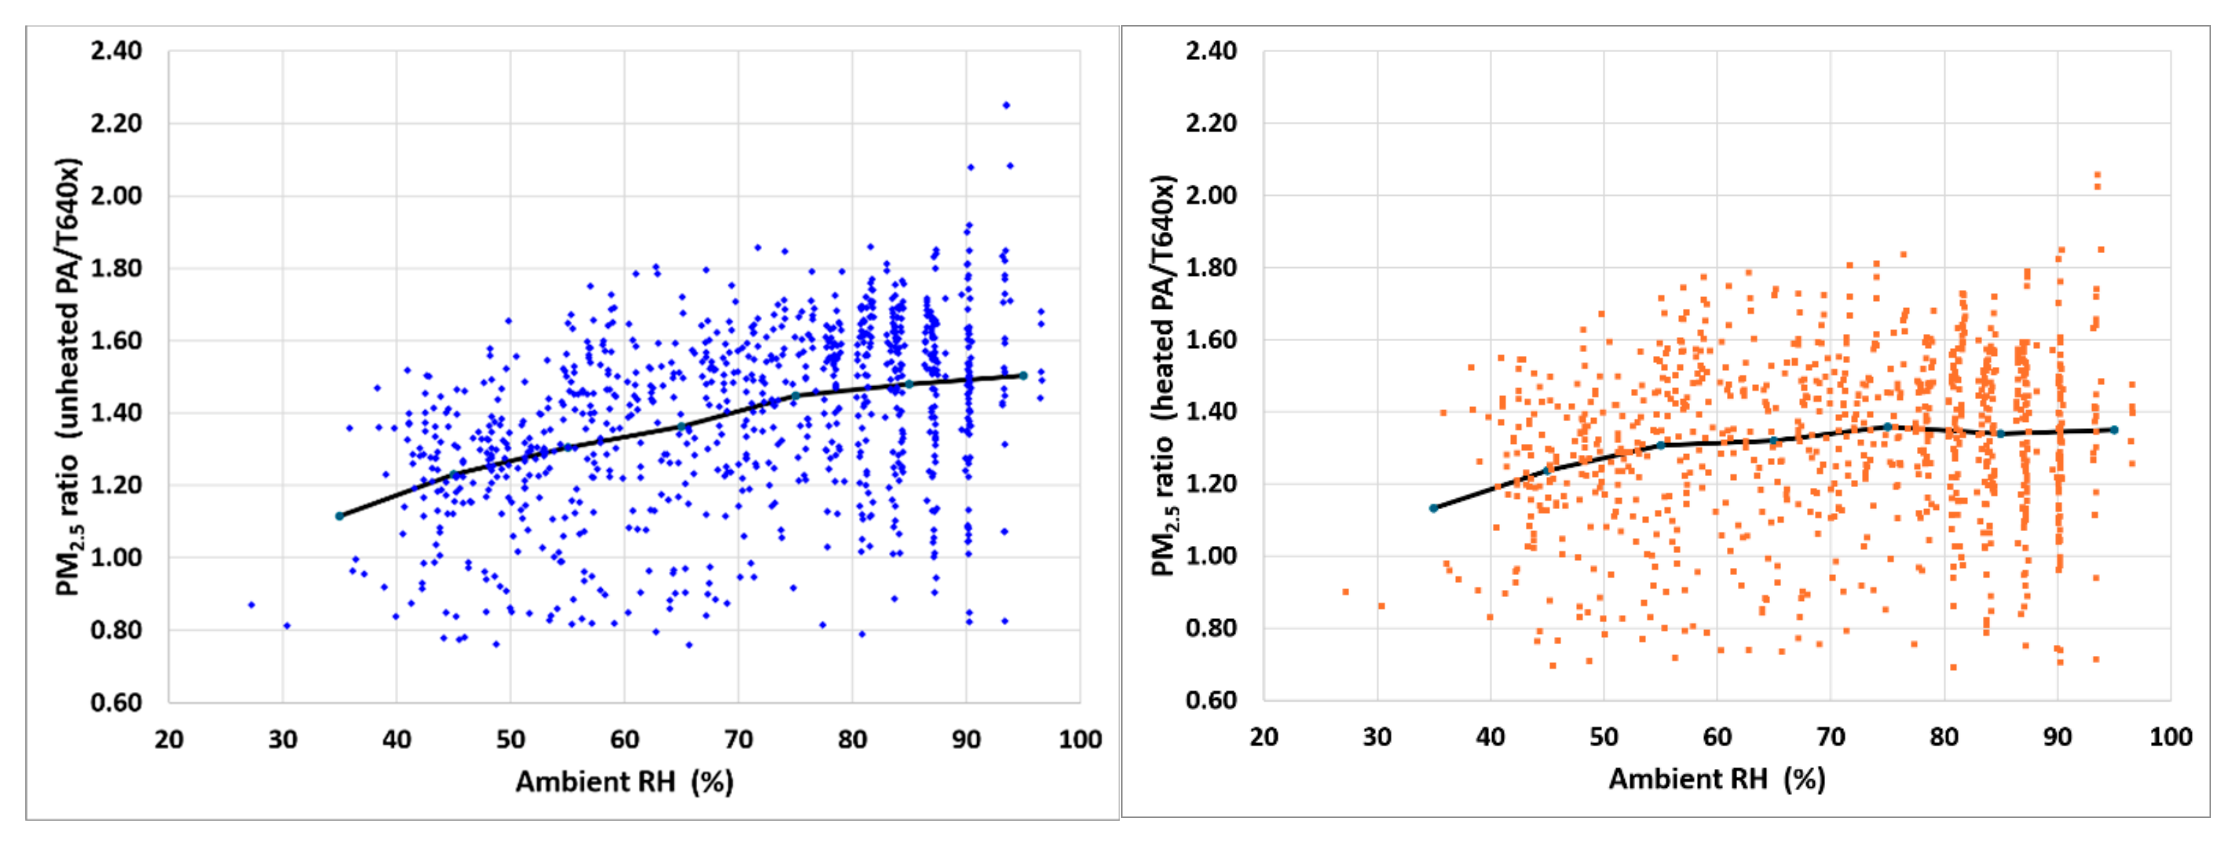
Figure 11.
Longitudinal cutting plane of velocity magnitude in the PMS5003 plenum. A relatively fast stream crosses the cavity and turns toward the outlet, while much of the plenum remains at lower velocity.
Figure 11.
Longitudinal cutting plane of velocity magnitude in the PMS5003 plenum. A relatively fast stream crosses the cavity and turns toward the outlet, while much of the plenum remains at lower velocity.
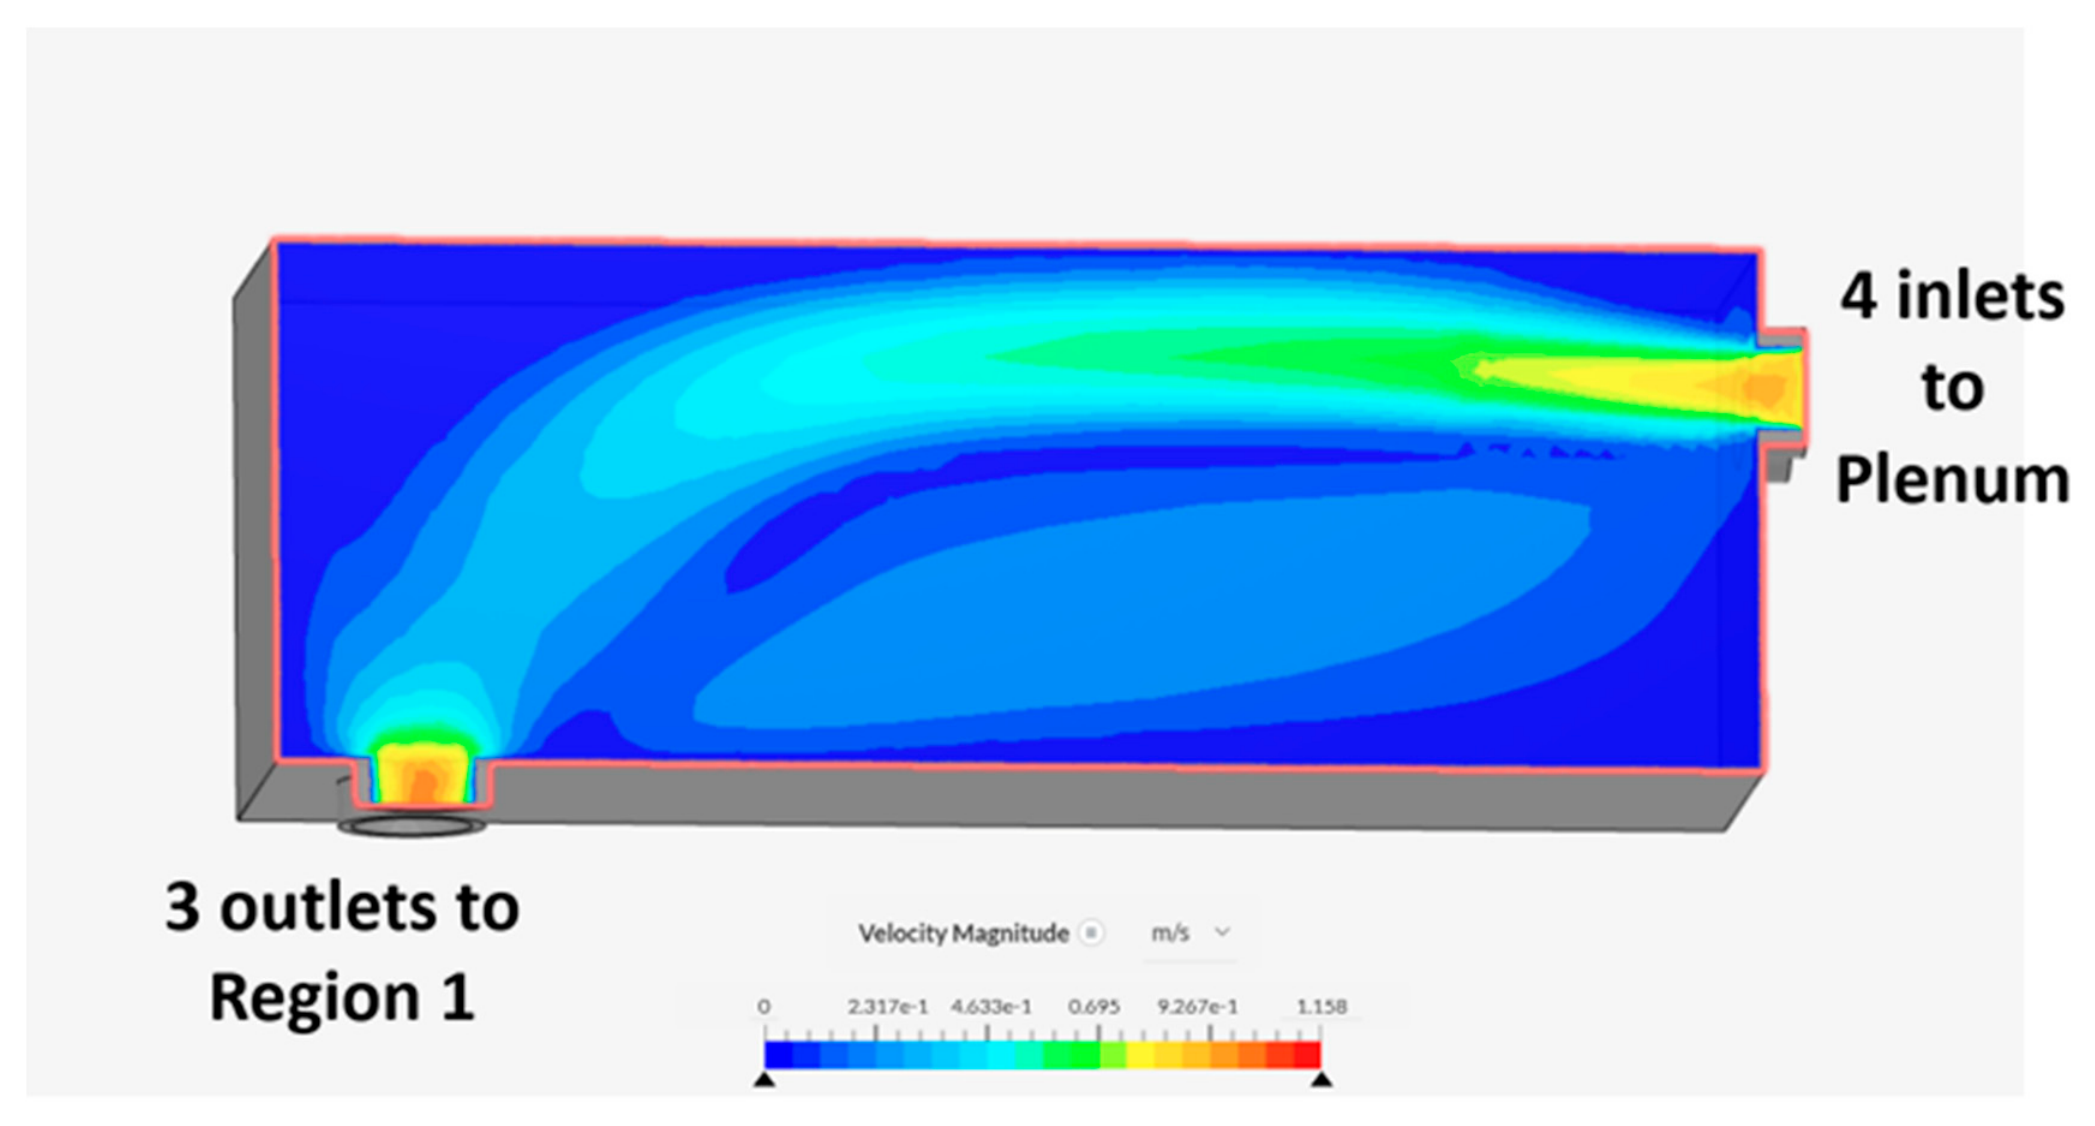
Figure 12.
Longitudinal temperature section through the PMS plenum. Sample air enters at 20 °C at a flow rate of 0.85 L·min−1. The bottom face of the plenum contains a 188 mW PCB providing heat to the PMS.
Figure 12.
Longitudinal temperature section through the PMS plenum. Sample air enters at 20 °C at a flow rate of 0.85 L·min−1. The bottom face of the plenum contains a 188 mW PCB providing heat to the PMS.
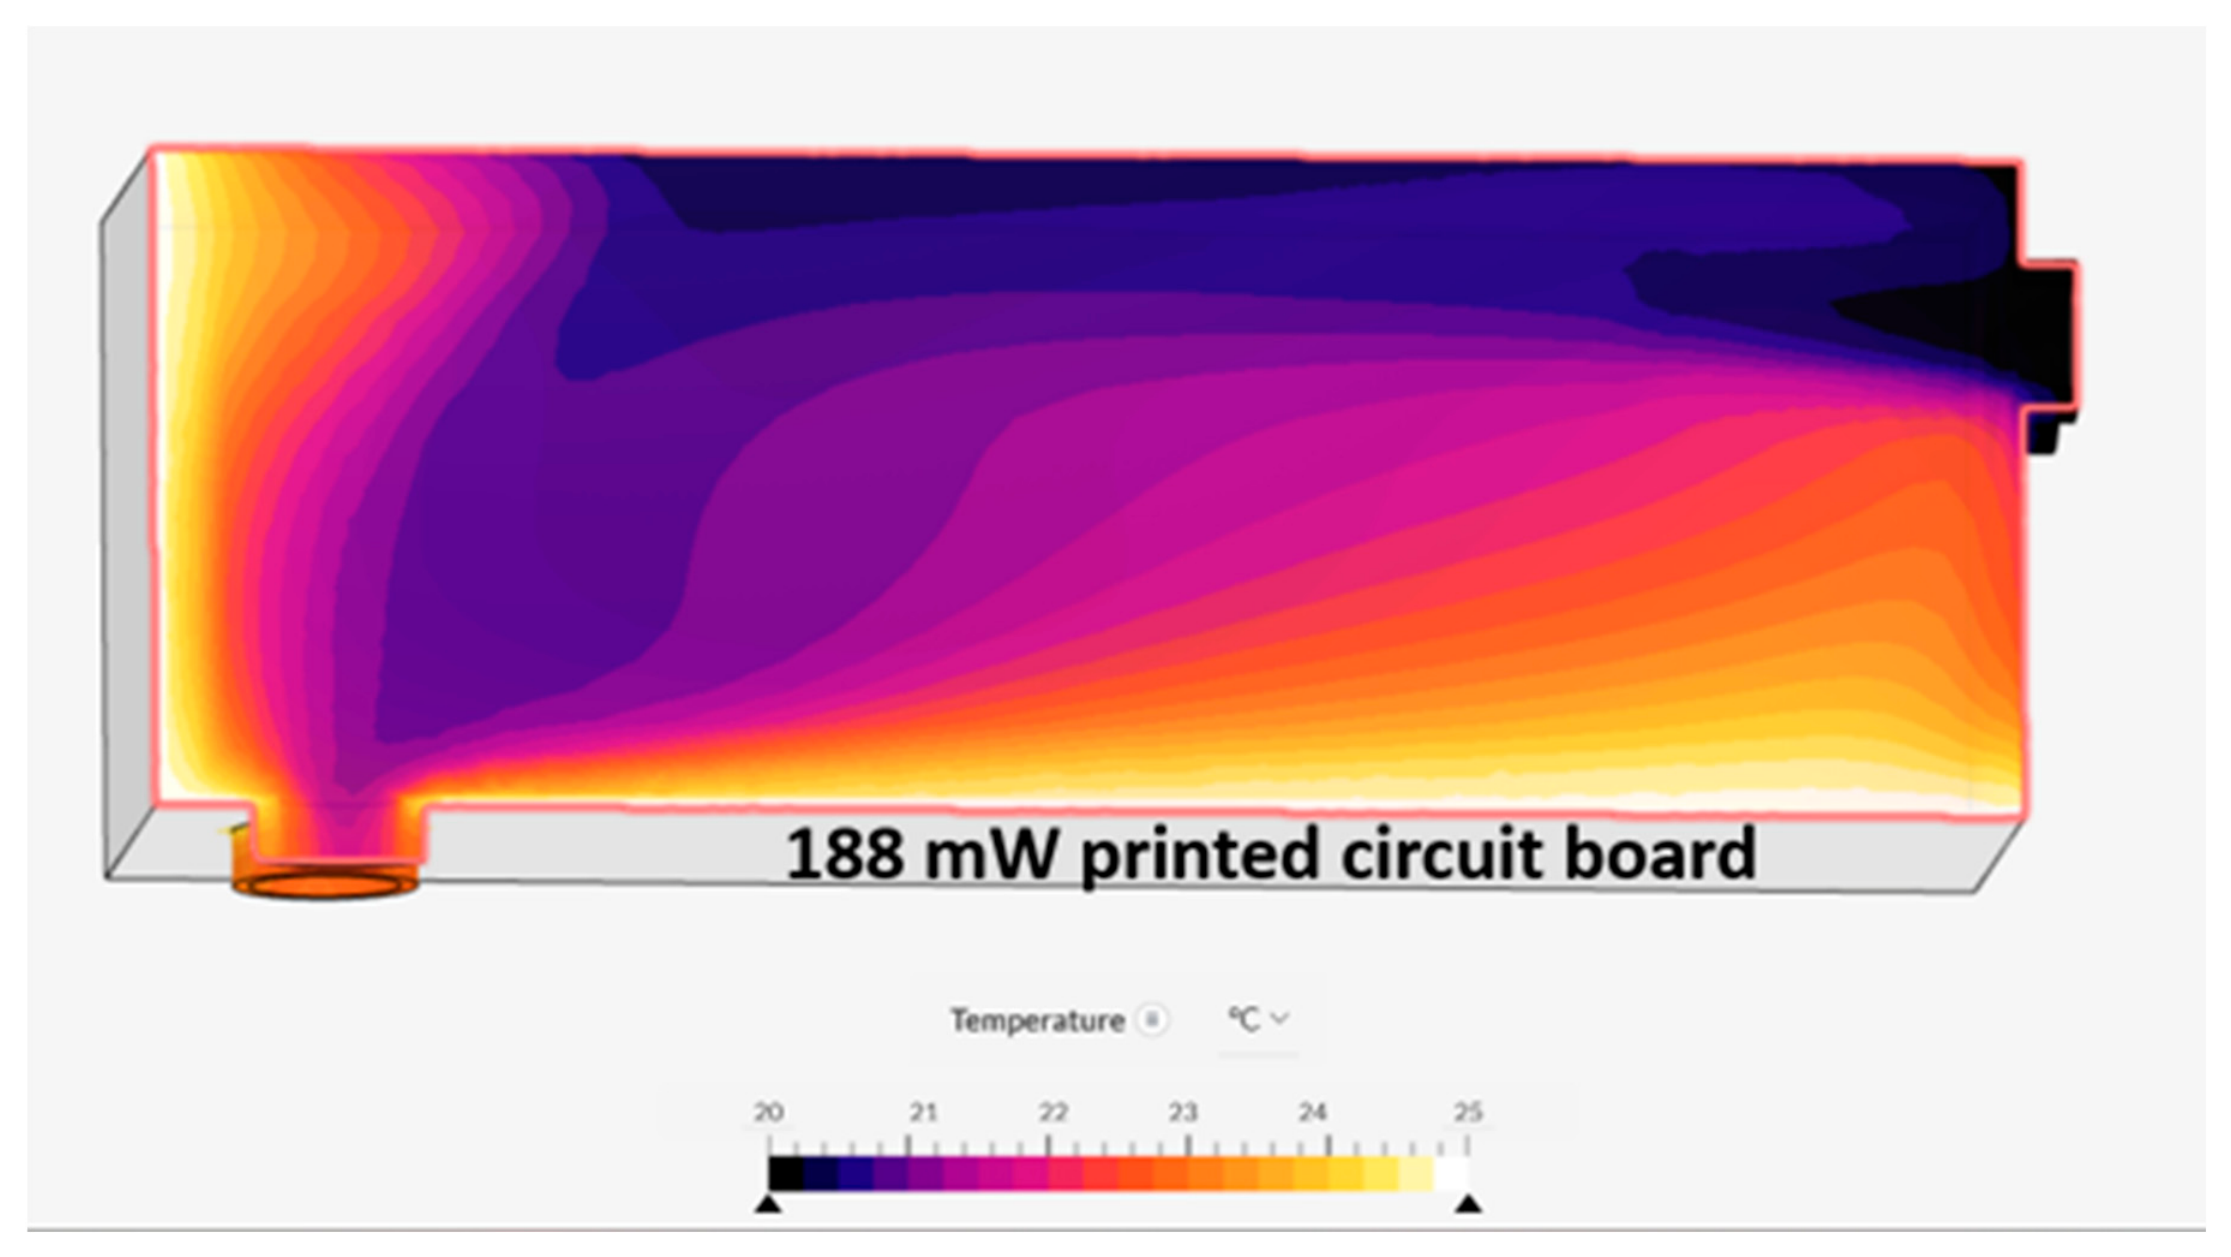
Figure 13.
Velocity-magnitude cutting plane showing the three high-velocity inlet jets and the tortuous redistribution of flow through the shallow Region 1 passage.
Figure 13.
Velocity-magnitude cutting plane showing the three high-velocity inlet jets and the tortuous redistribution of flow through the shallow Region 1 passage.
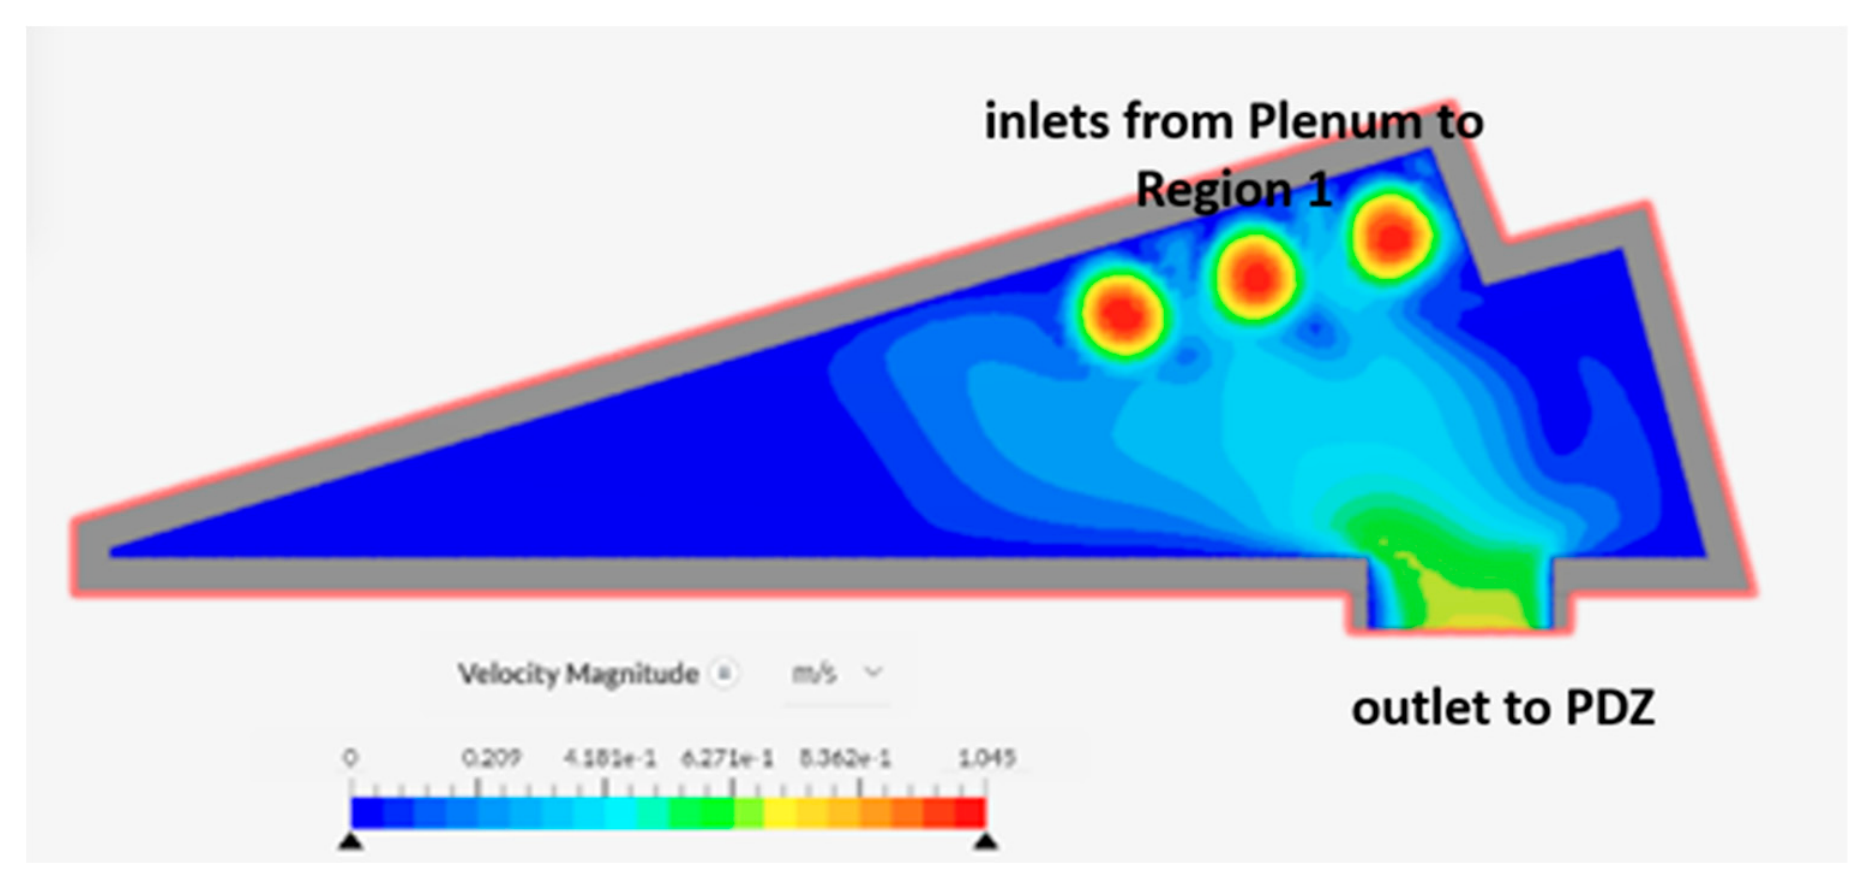
Figure 15.
Cutting plane showing the simulated temperature distribution within the PurpleAir enclosure. The PA PCB is above the two PMS sensors. The warm PA PCB region is surrounded by cooler enclosure air and housing. Simulated temperatures range from approximately 20 °C at the PVC walls to 37 °C within the PCB. Modeled low wind case of h = 2 W m−2 K−1.
Disclaimer/Publisher’s Note: The statements, opinions and data contained in all publications are solely those of the individual author(s) and contributor(s) and not of MDPI and/or the editor(s). MDPI and/or the editor(s) disclaim responsibility for any injury to people or property resulting from any ideas, methods, instructions or products referred to in the content. |
© 2026 by the authors. Licensee MDPI, Basel, Switzerland. This article is an open access article distributed under the terms and conditions of the Creative Commons Attribution (CC BY) license (http://creativecommons.org/licenses/by/4.0/).
Copyright: This open access article is published under a Creative Commons CC BY 4.0 license, which permit the free download, distribution, and reuse, provided that the author and preprint are cited in any reuse.