

Submitted:
21 October 2026
Posted:
22 October 2026
You are already at the latest version
Abstract
High-resolution visualization of cochlear cisplatin distribution is essential for understanding its pharmacokinetics and ototoxicity. We employed synchrotron X-ray fluorescence microscopy (XFM) to map platinum (Pt) at sub-micron resolution. Adult male FVB mice received cisplatin (10 mg/kg) through intravenous (i.v.) or intraperitoneal (i.p.) administration. Cochleae were collected on days 1, 7, and 14, cryo-sectioned, and scanned using XFM. Cochlear Pt signal increased progressively through day 14. Notably, i.v. administration led to higher Pt levels than the i.p. route, with the highest increase observed in the organ of Corti on day 14. These results provided the first cell-specific mapping of cochlear Pt distribution and revealed a persistent Pt accumulation long after systemic cisplatin clearance from plasma. Although no significant hearing loss was detected on day 14, the distinct of Pt kinetics between administration routes highlighted critical disconnections in cispla-tin-induced hearing loss between clinical chemotherapy and current preclinical animal models.
Keywords:
cisplatin-induced hearing loss
; cisplatin pharmacokinetics
; cochlear hair cells
; stria vascularis
; spiral ganglion neurons
; organ of Corti
1. Introduction
Cisplatin is a highly effective chemotherapeutic agent with multisystemic dose-limiting adverse effects, such as nephrotoxicity 1-3 and neurotoxicity 1,2,4. Among these unwanted side effects, cisplatin ototoxicity is usually persistent, irreversible, and cumulative 1,2,5,6, leading to an estimated half-million new cases of cisplatin-induced hearing loss (CIHL) during chemotherapy globally each year 7,8. In clinical oncology, cisplatin is typically administered as a single intravenous (i.v.) infusion in a cycle-by-cycle regimen, with a duration of 14 days per cycle 9. In animal model studies for CIHL, however, multiple low-dose intraperitoneal (i.p.) injections in each cycle are usually adopted 10-13. Different administration methodologies will result in different pharmacokinetics, doses, tolerance, and eventual therapeutic or toxic outcomes. These differences have been addressed in cisplatin systemic cytotoxic and therapeutic effects, but rarely in its ototoxicity 14-16.
Cisplatin exerts its effects through the formation of platinum (Pt)-DNA adducts and Pt-protein complexes 17,18, causing damage at both the DNA and protein levels, particularly affecting proliferating cells, like tumor cells. These cross-links are stable and last permanently in the body 19, including bony cochlear tissue 10. Unlike the general cytotoxicity, which is related to DNA damage17,20, CIHL seems to be more related to excessive accumulation of reactive oxygen species (ROS)5,21. Caused by depletion of intrinsic anti-ROS systems, ROS accumulation leads to damage in various structures, including the organ of Corti, stria vascularis (SV), and the spiral ganglion neurons (SGNs) 22,23. Given that the outer hair cells (OHCs) in the organ of Corti are the most vulnerable cells in CIHL24,25, studies have focused on how cisplatin enters these cells. Although the roles of different ion channels 26 and transporters 27,28 have been proposed, direct evidence for the presence of cisplatin in OHCs is lacking. A recent study indicates that cisplatin is retained in the cochlea long after chemotherapy, and that SV is a hot spot for cisplatin deposition. Cycle-by-cycle changes in platinum (Pt) concentration across different tissues were studied, and accumulation in the cochlea and femur was observed, with a resolution of 25 µm months to years after initial injection with cisplatin 10. However, it is not known how Pt accumulates over time within the same cycle of treatment. Since free cisplatin is eliminated within four hours after administration 29, understanding the time course, locations, and concentrations of Pt accumulation in one cycle of cisplatin treatment may provide insight into the early mechanisms of CIHL and whether that could be associated with Pt localization within the cochlea, possibly explaining the loss of OHCs seen in cisplatin ototoxicity.
The cochlea is housed within the bony capsule of the temporal bone, making imaging and visualization of Pt at a subcellular resolution complicated and difficult. Here we address this difficulty using the state-of-the-art technology Synchrotron X-ray fluorescence microscopy (XFM). XFM is widely used to study elemental compositions in biological samples 30,31. By using high energy, submicron synchrotron X-rays to irradiate the samples, the characteristic fluorescent emissions of different elements can be read to map the elemental composition and distribution of physiologically relevant ions, with a resolution much higher than has been used previously to image the cochlea. The detection sensitivity can be as high as sub-ppm concentration, making it ideally applicable for detecting and quantifying trace elements, like Pt, although challenging when emission lines of two elements are close 32. We pioneered the application of XFM imaging in the cochlea and identified hot spots of physiologically relevant elements in different cochlear locations 33. Since Pt does not normally exist in the body unless administered, XFM is the ideal technique for mapping cisplatin distribution in the cochlea after chemotherapy. Here we hypothesize that, cochlear cisplatin accumulation is affected by administration route, and XFM was able to quantify cochlear Pt distribution after cisplatin treatment. Changes of cochlear Pt accumulation over time after i.v. and i.p. cisplatin administration were studied using XFM.
2. Results
2.1. Progressive Pt Accumulation in the Cochlea Following Cisplatin Administration
XFM scanning was conducted at two synchrotron facilities, beamline 2-ID-E at the Advance Photon Source (APS) of the Argonne National Laboratory (ANL) and beamline 5-ID at the National Synchrotron Light Source-II (NSLS-II) of the Brookhaven National Laboratory (BNL). Both beamlines are equipped with hard X-ray microprobes that collect energy-dispersive fluorescence spectra and thereby provide functionally comparable quantitative elemental mapping.
Signals of multiple elements could be detected simultaneously in one scan, including phosphorus (P), sulfur (S), chlorine (Cl), potassium (K), calcium (Ca), iron (Fe), copper (Cu), Zinc (Zn), and Pt. To understand the process of Pt accumulation in the cochlea after cisplatin administration, we first examined the temporal profile of Pt signal in the cochlea up to 14 days after cisplatin administration (single dose, 10 mg/kg, through either i.v. or i.p. injection). Figure 1 shows XFM images from 10-µm-resolution scans of mid-modiolar cross-sections from different treatment groups 0, 1, 7, and 14 days after cisplatin injection. S (green) and P (blue) signals were used to assist in the visualization of the cochlear structures. As expected, no Pt signal (red) was detected in the untreated control sample (Figure 1A), aside from a low background level. Fluorescent peaks associated with the Pt_Lα and Pt_Lβ lines at 9.44 and 11.07 keV, respectively. This background potentially came from a low signal to noise ratio or contamination from the signal of Selenium (Se), a trace element in organisms sharing a similar fluorescent emission peak with the Pt_Lβ line at 11.22 keV. Figure 1, B&C confirm the detection of Pt after cisplatin administration. Overall, greater increase in Pt signal was observed between day 7 and day 14, compared to between day 1 and day 7. Both i.v. and i.p. samples showed increased Pt signal over time, while greater levels of accumulation were observed in the i.v. samples at all time points.
2.2. Quantitative Subcellular Mapping of Pt Deposition in the Cochlea
High-resolution XFM scans (500 nm beam size) were performed to enable quantitative analysis of Pt accumulation at selected regions of interest (ROIs). Figure 2 shows the XFM image of the organ of Corti from the cochlear middle turn seven days after the mouse received cisplatin by i.v. injection. Anatomical structures in Figure 2A were delineated with the help of S (green) and P (blue). The emission form Pt is shown in Figure 2B, and from S in Figure 2C. Signals were observed in most cochlear structures. A strong P signal was present in the cell nuclei, nerve tissue, and in the nuclei of the IHC, OHCs, supporting cells (Figure 2D). Using these anatomical markers, regions of interest (ROIs) were defined for OHCs, IHCs, and the spiral lamina (SL) (Figure 2A). Utilizing the MAPS software 34, area densities (µg/cm2) of relevant elements (Table showing Pt and S) were obtained for each selected location of interest within the organ of Corti, a process known as ROI-fitting within the software (See Methods section for more detail). ROI fitting was conducted to determine the areal densities (µg/cm2) of relevant elements (Table 1, showing only the Pt and S). To allow comparative analysis across different cells, samples/structures, and treatment groups/days, Pt/S ratio for each ROI were calculated, providing a normalized metric for Pt accumulation independent of confounding factors such as potential batch/facility difference and regional biological variations.
Because the intensity of Pt signal was low in the samples and structural boundaries were not clearly resolved due to scattering of fluorescent photon emissions from the cochlear samples before they can be detected, we implemented the following validation measures to ensure cellular and structural localization:
First, Hematoxylin and Eosin (H&E) staining was performed on adjacent cochlear sections to precisely identify anatomical landmarks for specific cochlear locations and cells (Figure 3). As shown in Figure 3, overlapping of XFM scans and H&E staining images allowed for more accurate identification of cochlear structures.
Table 1 indicates the specific Pt and S signals in units of ug/cm2 and the Pt/S ratio associated with the sample ROI selections seen in Figure 2.
Second, fluorescence spectra were examined to validate the peaks of detected Pt signal. As shown in Figure 4, the integrated spectra generated by counts of photons captured during XFM scans (blue curve) was aligned and compared with model spectra generated with the Kα emission energies of all the elements assumingly existing (Fitted Spectra, red). At the energies of Pt Lα (9.44 keV, the purple line) and Lβ (11.07 keV, the green line) emissions, distinct peaks were detected in cisplatin-treated samples, which verified the presence of Pt.
Due to limited beamtime available, only three cochlear samples per group at each time point were scanned and included in the quantitative analysis.
2.3. Differential Pt Distribution in Cochlear Structures Following i.v. and i.p. Administration
Systemic quantitative analysis of Pt deposition over time following different routes of administration was performed in the organ of Corti, spiral ganglion (SG), and SV. Figure 5 shows the longitudinal distribution of Pt (red) in the organ of Corti across different treatment groups along with S (green) and P (blue) signals. Pt signal consistently increased over time in both i.v. (panels in top rows) and i.p. (panels in bottom rows) cohorts up to day 14, with apparently higher levels observed in the i.v. group. Figure 6 shows the Pt/S ratio measured at different locations. Specifically, Pt signal in IHCs of the i.v. group increased significantly by day 14 compared to day 1 (p=0.006, one-way ANOVA with Tukey’s post-hoc test, same in the following) and day 7 (p=0.008) (Figure 5 and Figure 6A). In OHCs, Pt deposition also increased significantly by day 14 relative to day 1 (p<0.001) and day 7 (p<0.001) (Figure 5 and Figure 6B). Furthermore, Pt signals were significantly higher in both IHCs and OHCs of the i.v. group compared to the i.p. group on day 14 (p=0.007 and p=0.004, respectively). Pt deposition in SL also showed an increase in the i.v. group on day 14 though not statistically significant (Figure 6C). Data from supporting cells were excluded due to the missing or unidentifiable cells in some samples. Notably, analysis across cochlear turns (apical, middle, and basal) showed no significant regional variability based on limited data on IHC and OHCs (Figure 6, A and B).
Figure 7 shows the longitudinal distribution of Pt (red) in SG along with S (green) and P (blue) signals. S was notably enriched in SGNs, helping to identify individual cellular boundaries. Pt signal was also visibly accumulated in SGNs. However, given that precise boundaries of SGNs were difficult to resolve and that Pt signal elevation was also detected in the surrounding nerve fibers with a high P concentration, ROI was selected in a 400 µm2 area adjacent to the SL, which included both SGNs and extraneuronal space. Pt/S ratio calculation revealed that Pt signal also increased with time in both treatment groups (Figure 8). On day 7, Pt signal in i.v. group increased significantly compared to day 1 (p=0.048), while no significant difference was observed between i.v. and i.p. groups. Similar to that in the organ of Corti, Pt signal of the i.v. group had over twice yet insignificant increase on day 14 compared to the i.v. group. This is likely attributable to increased variance from scans conducted at different synchrotron facilities and limited sample size. Note that only two samples each for day 1 treatment groups were able to be scanned at high-resolution.
Figure 9 shows the longitudinal distribution of Pt (red) in the SV along with S (green) and P (blue) signals. On day 1 samples, adjacent organ of Corti in the same scan were included as a direct comparison between the the organ of Corti and SV. Scatter plot for Pt/S ratio (Figure 10) shows that, Pt signal in the i.v. group was significantly greater than the i.p. group on day 1 (p=0.016). Although Pt signals continued to increase over time in both groups, the inter-group difference appeared to diminish. This observation should be interpreted with caution, however, given the limited sample size at certain time points (n=2 for i.p. Day 1 group and n=1 for i.p. Day 14 group).
Pt signal from the cochlear bone (SB) adjacent to SV was also analyzed as a location of interest. Pt signal increased progressively in both treatment groups, while the i.v. group being significantly higher than the i.p. group on day 1 (p<0.001) and day 14 (p=0.024). Within the i.v. group, day 14 was significantly greater than day 1 (p=0.021) and day 7 (p=0.022). Again, cautions should be taken due to limited sample size.
2.4. Pt Accumulation over Time Revealed a Hot Spot in the Organ of Corti
Comparison of Pt signal accumulation between the two treatment groups, i.v. and i.p., was done using a One-Way Student’s T-test. The Pt accumulation in the IV group was shown to be significantly greater than in the i.p. group, p=0.030 (Table 2). Within each treatment group, Pt signal was compared using a One-Way Anova, both of which showed a significant difference in the signal across the three timepoints (p=0.0004 i.v. and p=0.0004 i.p.) (Table 2). Individual comparisons between each of the timepoints can be seen in the supplemental data (Supplemental Table 1).
Table 2 shows the p-values from i.v. and i.p. group comparison with a Student’s T-test and comparison across timepoints for each treatment group with an ANOVA.
Comparison of Pt signal accumulation across cochlear locations and treatment groups overtime were performed based on the quantitative analysis with Pt/S ratio, as shown in Figure 11. These comparisons were done between locations, timepoints, and injection modalities using a linear mixed-effects model, with omnibus main and interaction effects assessed via Type II Wald chi-square tests, and pairwise comparisons of estimated marginal means (emmeans) conducted where significant interactions were identified (Table 3). Per the ANOVA, there was a significant main effect of Day (p<0.001), and a significant Tissue × Day interaction (p=0.042), indicating that while the outcome changes significantly across days overall, the pattern of change over time differs by tissue type. Neither Tissue (p=0.423) nor Group (p=0.371) alone showed a significant main effect, and no significant Tissue × Group, Group × Day, or three-way interactions were observed. Despite the absence of a significant overall Group effect, pairwise comparisons of estimated marginal means revealed route-specific differences within particular tissues and timepoints, described below.

Table 3.
Type III analysis of variance for XFM Data.
| Factor | Chisq | Df | Pr(>Chisq) |
| (Intercept) | 206.239154 | 1 | 9.08679E-47 |
| Tissue | 4.939411845 | 5 | 0.423319164 |
| Group | 0.800589649 | 1 | 0.370917133 |
| Day | 73.5726879 | 2 | 1.05656E-16 |
| Tissue:Group | 4.321899317 | 5 | 0.50406016 |
| Tissue:Day | 18.89838946 | 10 | 0.041572433 |
| Group:Day | 1.411331324 | 2 | 0.493779775 |
| Tissue:Group:Day | 9.513350139 | 10 | 0.48417325 |
Table 3 Summary of the linear mixed-effects model investigating the fixed effects of injection route (group), time (days), and cochlear location (tissue) on Pt accumulation/signal. Subject ID was used as a random effect to account for repeated measures.
Per the pairwise comparisons, on Day 1, Pt signal intensity in the i.v. treatment group was significantly higher than in the i.p. treatment group in CW and SV (p=0.040, p=0.016, respectively), suggesting more rapid initial uptake and deposition of Pt via the i.v. route in these structures. By Day 7, none of the cochlear locations of interest had significantly greater Pt accumulation in the i.v. group compared to the i.p. group. However, by Day 14, Pt signals in the IHC and SL were significantly greater in the i.v. group compared to the i.p. group (p=0.039, p=0.0023). In contrast, Pt deposition in SV was not significantly different between i.v. and i.p. groups on Day 14. The overall trend seen for the level of Pt accumulation in our results was IHCs > OHCs > SL > SG > CW > SV based on Day 14 data from i.v. group.
2.5. Impact of Cisplatin Administration Route on Auditory Function
To evaluate the ototoxic impact of different cisplatin administration routes, we assessed auditory brainstem response (ABR) thresholds at baseline (Day 0) and at 1, 7, and 14 days post-treatment (Figure 12). A linear mixed-effects model was employed to analyze the fixed effects of the administration route, time, and sound frequency on ABR threshold shifts (Table 4). Statistical analysis revealed that injection route (i.v. vs i.p.) did not result in a significant difference in thresholds up to day 14 (p=0.26). There was no significant interaction between the injection route and time (p=0.71).
Table 4 Summary of the linear mixed-effects model investigating the fixed effects of injection route, time (Days), and frequency on ABR thresholds. Subject ID was used as a random effect to account for repeated measures.
3. Discussion
3.1. Hearing Loss Is Minimal in the Early Stage of CIHL in Both Administration Routes
In clinical oncology, cisplatin is typically administered in three cycles (2 weeks/cycle) with a single continuous i.v. infusion per cycle 9. Standard dosing ranges from 75-100 mg/m2 body-surface area (BSA), equivalent to approximately 2-3 mg/kg in humans. When converted using BSA normalization, this corresponds to a lethal 25-30 mg/kg in mice. Therefore, alternative experimental paradigms for CIHL have been developed 35. Near-lethal high-dose intraperitoneal (i.p.) bolus (16-20 mg/kg in 1-2 injections) has been shown to induce high-frequency CIHL (24-32 kHz, 20-40 dB threshold shift) in mice within 2 weeks 13,36. More recently, a multi-cycle, multi-low-dose (MCML) i.p. regimen, developed by Cunningham’s group, has been adopted37. This protocol includes three cycles (two weeks each). In each cycle, cisplatin (3.5-4 mg/kg, i.p.) is administered daily for the first four days, followed by a ten-day recovery period 10-13. However, outcomes vary considerably in these models. Based on our own experiences, severe systemic toxicity, weight loss, and animal mortality are accompanied with cisplatin treatment, which might have contributed to the discrepancies in cochlear function assessment across different laboratories 11,13,38.
According to the guidance for non-clinical animal studies, the maximum plasma concentration (Cmax) should be considered as the standard for different routes of administration 39. It has been reported that cisplatin delivered via i.v. injection results in approximately twice the plasma Cmax compared with i.p. administration 16,39. In the current study, cisplatin i.v. administration with a dose (10 mg/kg) close to the suggested upper limit of Cmax (4.3-4.8 ng/ml) determined in prior studies40,41 was used. The purpose was to determine whether this route induces more pronounced CIHL and whether different routes of administration lead to distinct Pt distribution patterns in the cochlea. Our results indicate that minimal hearing loss (2-3 dB pure-tone average) is induced within 14 days (one cycle) with either i.v. or i.p. injection, although statistical significance was not observed. However, even without significant changes in hearing thresholds, animals in the i.v. group exhibited markedly more severe systemic toxicity, such as greater weight loss, compared to i.p. group (data not shown). While 90% of the animals in the i.v. treated animals survived until day 14, a second dose administration of cisplatin on day 15 resulted in 100% rapid mortality within 24-72 hours (data not shown). These findings suggest that in murine models, cisplatin ototoxicity requires cumulative and gradual Pt deposition even with a relatively high dose, and that the first 14 days of a multicycle regimen represent an early, sub-threshold phase of CIHL while systemic toxicity is already severe after i.v. administration.
3.1. Pharmacokinetics of Cisplatin in the Cochlea Reveal Distinct Profiles Between i.v. and i.p. Injections
The toxic effects of cisplatin are likely mediated by its capacity to cross-linking proteins and DNA17,18. Cisplatin, in particular, binds to 80-90% of serum proteins,41,42. Prior pharmacokinetic studies in the literature have shown that cisplatin is rapidly cleared from plasma, and that typically no free (unbound) cisplatin is detectible within 4 hours 29. However, bound cisplatin (Pt) remains in the body for months to years 29, which may still exhibit some degree of antitumor effect without further kidney or liver toxicity41, although unclear for its ototoxicity. More recently, it has also been reported that Pt displays a strikingly high affinity for type 1 collagen43, a major organic component of the bone matrix (constituting 90%) and soft tissues. Both serum proteins and bone matrix could potentially be the source of Pt accumulation in the organ of Corti as revealed in our study. As a notion to this hypothesis, long-term retention of Pt was found in both cochlea and femur, but not in other soft tissues in a recent study 10. As part of this study we aimed to visualized whether this retention differed under i.v. and i.p. injection conditions. In addition, a hot spot for Pt deposition in the SV is also observed in the same paper10. The inductively coupled plasma mass spectrometry (ICP-MS) technique was used in the study with a resolution of 25 µm, which is insufficient to resolve cellular distribution. Our results further showed Pt accumulation in the cochlea over time with high-resolution (0.3-0.5 µm) XFM images. The highest Pt accumulation in the cochlea is shown in the organ of Corti 14 days after i.v. cisplatin administration. Since unbound cisplatin is depleted by day 1, the continuous accumulation of Pt in the cochlea until day 14 may arise from two sources. The first is the slow release of bound cisplatin from plasma 29, particularly from serum proteins 41. The second is the dissociation from collagen in the bony structures or the tectorial membrane (Figure 2) 43. Although these potential sources might not be fully accountable for the high concentration of Pt in IHCs and OHCs, our results might have partially explained the vulnerability of OHCs in CIHL.
Another major finding of this study is that, Pt signal in specific cochlear locations on day 14 has an average increase of four times in the i.v. group than in the i.p. group. Whether this Pt surge represents simply a higher amount of total Pt remaining in the body or a functional deterioration of SV is unclear at this point. If there is a functional deterioration of the SV as a result of Pt mediated damage, more fundamental cochlear functional changes such as cochlear ion homeostasis might have occurred in the i.v. group, although statistical significance in hearing threshold changes has not reached at this early stage. Further endocochlear potential and ion concentration measurements will help to understand the physiological changes in this stage and potentially elucidate the different pharmacodynamics between i.v. and i.p. injections.
3.1. XFM as a High-Resolution Tool for Studying Ion Distribution in the Cochlea
As a synchrotron-based elemental imaging technique, XFM is widely used in biological samples 30,31 and medical studies 32 to enable high-resolution (nm-scale) and high-sensitivity (ng/cm2) mapping of various elements. By using element-specific fluorescence spectra excited by high-energy photons, quantitative maps of multiple elements can be generated simultaneously without labeling or staining. We have pioneered studies of the spatial distribution of major biologically relevant ions in the cochlea 33 and the middle ear ossicles 44. XFM is uniquely suited for studying cisplatin distribution in the cochlea because Pt is a non-physiological element, which can only be introduced into the body via drug administration. In addition, as an element with high atomic number, the limit of detection (LOD) is much lower than the physiologically relevant lighter elements. Publications of the same beamline (2-ID-D of APS) showed Pt signal to be approximately 10-1000 ng/cm2 in cultured cells treated with 10 µM cisplatin 32. Using the same calculation as in the paper, we estimated the LOD for Pt in our study as 0.1 ng/cm2 with a spot size of 500 nm and a dwell time of 200 ms. Cochlear Pt distribution in the current study with in-vivo measurements ranged from 0.5-1 ng/cm3 or 0.1-0.5 ug/g. These values are around 1 to 3 orders of magnitude lower than those measured in cell cultures but well above the LOD of Pt in our study. The estimated concentration is also comparable to studies in other tissues (in µg/ml or µg/g: lung, 2.4; liver, 0.5–3.7; prostate,1.6–3.6; kidney, 0.4–2.9) using various techniques45,46.
Signals of other biologically relevant and endogenous elements like K, Cl, P, S, Ca, Zn, and Fe were also collected and compared. Since the samples were processed in multiple steps, including cardiac perfusion, fixation, decalcification, and embedding, concentrations of soluble and free ions, such as K, Cl, and Ca, are not reflecting the normal physiological concentrations. Changes in Zinc (Zn) and iron (Fe) concentrations are also observed; these results are not reported in the current study, as it is unclear at this point whether they are real and what their pathological or physiological meaning is. Studies are ongoing to confirm their relevance to ferroptosis 47,48 or hypozincemia 49, both of which are induced by cisplatin.
Challenges also exist in applying XFM to elemental mapping in the cochlea. As pointed out in our other publications, the depth resolution is poor with two-dimensional XFM images, and a 20 µm thickness is challenging for XFM. Furthermore, tissue shrinking after cryo-section might lead to non-flat surfaces, which can also affect fluorescence emission and detection. Furthermore, only bound ions can be quantified reliably, since diffusible ions are prone to change during tissue processing 33. Although Pt binds to DNA and proteins and was considered stable, it still could be dissociated from collagen during tissue processing, particularly during decalcification. In addition, there could also be issues with overlapping energy lines for elements of interest, such as Se and Pt in our case. Finally, another obvious limitation of our results is the small sample size due to highly demand yet limited beamtime. A single scan of a 100 x 100 µm2 area, with a 500 nm step size and a 200 ms dwell time would take roughly 4 hours. Therefore, complete scanning for each sample usually takes about 1-2 days, or 3-6 shifts, for 9 high resolution ROIs. Approved proposals for ANL and BNL typically have 48-60 shifts each, barely sufficient for 10-12 samples.
4. Materials and Methods
4.1. Animal Groups and Treatments
Male FVB mice (Jackson laboratory, Stock No. 001800) at the age of 8 weeks were used in this study. Mice were randomly assigned into three experimental groups: Control, i.v., and i.p. groups. Animals in Control group (n=5) received saline (10 µl/g) through i.v. injection through tail vein on day 0 and were euthanized on day 14. IP (n=15) and IV groups (n=13) received cisplatin (10 mg/kg, Millipore Sigma, St. Louis, MO) on day 0, through either i.p. or i.v. injection, and were euthanized on day 1 (n=3), day 7 (n=3), and day 14 (the rest), respectively. Cisplatin solution was freshly made before each injection, by dissolving in sterile saline with a concentration of 2 mg/ml. Hydration was given daily to all the animals through saline injection (i.p.) with a dose of 50 µl/g.
4.2. ABR Measurements
Cochlear function was evaluated through ABR thresholds measured on day 0 (before), 1, 7, and 14 after cisplatin treatment. Briefly, mice were anesthetized with a mixture of ketamine (80-100 mg/kg) and xylazine (2-2.5 mg/kg) through i.p. injection and were monitored every 15 minutes. A supplementary half dose of ketamine dilution was given approximately 40 minutes after the initial mixture whenever necessary. Body temperature was monitored and maintained at 37 ℃ using a water-filled hearing pad 13,50.
ABRs were measured using a Tucker Davis Technologies (TDT, Alachua, FL) system with RZ6 processor and BioSigRZ software. Hypodermic needle electrodes were placed on the bulla (high), vertex (low), and back (ground), connected to a Medusa 4Z pre-amplifier. Pure tone bursts were delivered via a pre-calibrated MF1 speaker positioned at the ear canal. The parameters of the pure tone bursts include: duration: 5 ms, including a rise/fall time of 1 ms; frequencies: 36, 32, 24, 16, and 8 kHz; sound levels: 85-20 dB SPL (re sound pressure level 20 µPa), attenuated in 5 dB steps, each stimulus was repeated 1024 times or until the signal/noise ratio (SNR) ≥ 4. A WS4 Computer Workstation was used for data acquisition and analysis. ABR threshold was defined as the minimum sound level required for an ABR response with a root-mean-square (RMS) value 1.5 times above the noise floor 50.
4.1. Euthanasia, Sample Preparation, and Cryo-Sectioning
Euthanasia was performed via i.p. injection of 0.15 mL of Euthasol® (pentobarbital sodium and phenytoin sodium, Virbac), followed by cardiac perfusion using 4% paraformaldehyde (PFA). Cochleae were then collected and post-fixed overnight with 4% PFA at 4 ℃. Afterward, cochleae underwent decalcification using 10% Ethylenediaminetetraacetic acid (EDTA) for 4 days on a shaker platform in a 4 ℃ cold room.
For cryo-sectioning, cochlear samples were washed with 1x phosphate-buffered saline (PBS), submerged in 30% sucrose for 24 hours, embedded in Tissue-Tek optimal cutting temperature (OCT) medium, and mounted on a specimen disk pre-frozen on dry ice. Cross-modiolus cryo-sectioning was conducted on a Leica MC1950 cryostat (Leica Biosystems) maintained at -20 ℃. The section thickness was set to 20 μm to ensure the inclusion of hair cells in the organ of Corti (OC). Sections were captured on low-stress SiNx Membranes (on 5 mm x 5 mm frames, thickness 200 µm, Norcada, Canada) for XFM or glass slides for H&E staining.
4.1. XFM Scanning and Data Processing
XFM scanning was performed at the 2-ID-E beamline at APS and the 5-ID SRX beamline at BNL. Both beamlines are scanning hard X-ray microprobes that use a focused monochromatic X-ray beam to raster-scan the specimen while collecting energy-dispersive fluorescence spectra at each scan position, thereby enabling spatially resolved detection and quantification of multiple elements. The 2-ID-E beamline provides submicrometer XFM using Fresnel zone-plate focusing while the 5-ID SRX beamline similarly provides submicrometer-resolution XRF imaging and spatially resolved X-ray absorption spectroscopy. Thus, although the beamlines differ in synchrotron source characteristics, focusing optics, detector configuration, photon flux, and data-acquisition hardware, they employ the same fundamental measurement principle and provide functionally comparable capabilities for quantitative elemental mapping.
A 13.7 keV X-ray beam was used to excite the samples. At 2-ID-E beamline, the X-ray beam was focused to 500 nm, and a 4-element Si-drift energy-dispersive detector was used to detector the fluorescence signals perpendicular to the X-rays. At SRX beamline, the X-ray is focused to 300 nm, and a 7-element Si-drift energy-dispersive detector was used to detect the fluorescence signals perpendicular to the X-rays. The fluorescence signals were normalized to the incident beam intensity.
Three cochlear sections were scanned for each treatment group and time points due to limited beamtime available for scanning. Samples were broadly scanned initially with a 10 µm beam size to generate a low-resolution overview image, as seen in Figure 1. ROIs including OC, SV and SG were then scanned for high-resolution maps with a 500 nm step size and a 200 ms dwell time per pixel. A standard RF type (924580) reference sample (AXO Dresden GmbH, Germany) was scanned and used for quantification.
The raw XFM data was calibrated and processed using XRF_MAPS (uProbeX), the domestic software MAPS developed at the APS 34. This software allowed the cts/s in each pixel for each element to be mapped, allowing for visualization of elemental distribution images and fit spectra for quantification of the elements as areal densities (ug/cm2). Initial data processing involved using the MAPS software to generate integrated spectra across pixels to determine specific fitting parameters to be applied to the complete dataset as part of data calibration and pre-processing. The raw data was calibrated by performing spectral peak-fitting via comparison with known standard data or expected values for Lα and Lβ lines for elements within the program to generate areal densities from the raw fluorescence intensity counts (cts/s)31. After spectral peak-fitting and calibration was done to optimize element quantification, ROI analysis was performed to determine Pt areal densities within specific locations and structures of the cochlea. For each scan, Element-specific images were generated with NNLS fitting and calibration with the downstream ion chamber (DS_IC) for the ANL data and the upstream ion chamber (US_IC) for the BNL data.
ROIs within these scan areas were defined using the ROI Dialog tool and analyzed through the ROI statistics tool to obtain the mean signal intensity as an areal density of each element detected for, within each ROI. In this process of defining ROIs, an image including the distribution of each element of interest was generated with normalization using the KMeans function to ensure that all element intensities were depicted on the same scale (Figure 2). Visualization of the distribution of biologically relevant elements such as S and P enabled objective selection of ROIs based on the known locations of cochlear structures. Using multiple element maps that overlap enabled more accurate ROI selection and a better signal-to-noise ratio when creating an aggregate spectrum. Overall, the selected ROIs included a blank area to represent the background signal and a bony structure (SL or CW) in each image, in addition to other cochlear structures of interest (IHC, OHC, SGN, SV), as defined above. Then, ROI Statistics functions were run to obtain a cleaned signal for each element of interest at each location. This was followed by ROI fitting of spectra to obtain integrated spectra and Pt areal densities for cochlear structures of interest. In Figure1 and Table 1, we present a set of data regarding the areal densities in µg/cm2 and subsequently calculated Pt/S ratio 10, as an example of how the quantitative studies are performed. The areal densities of Pt and S in the IHC, OHCs, and SL in Figure 2 are listed in Table 1. The calculated Pt/S ratios are 0.0184, 0.0172, and 0.0211 (mean ± standard deviation; same across all values), respectively.
The obtained areal densities were normalized to the sulfur areal density of the structure in the same scan, using the Pt/S elemental ratio. Sulfur was chosen as a housekeeping element because it is a bound element unlikely to be altered by cisplatin and easily visualized on XFM scans. The average areal density of sulfur used for normalization was 0.0761 ± 0.031 µg/cm2.
Areal densities obtained by ROI fitting can also be converted to concentrations using the following equation:
Where A represents the absolute areal density, MW is the molecular weight of the element of interest, and represents the thickness of the sample. This equation allows us to take absolute areal densities (ug/cm2) and convert them to volumetric concentrations by dividing via the effective thickness of the slices made through cryo-sectioning. This allowed us to generate concentrations of all the elements, including Pt, at different locations in the unit of µM.
4.1. Hematoxylin and Eosin (H&E) Staining
For further confirming cochlear structure and cells in XFM scans, H&E Staining was performed on adjacent cochlear sections on glass slides following standard procedures. Briefly, the glass slides with the samples were rinsed in distilled water for 2 min and stained with hematoxylin for 10 min. After rinsing, the slides were placed in distilled water for 30 sec, dipped in 0.3% acid alcohol for 3 times, and rinsed in diluted ammonia until the slides were clear. After rinsing again in water, the slides were dipped in 90% ethanol and then counter-stained with eosin for 2 min. The slides were then dehydrated in 90%-100% ethanol, cleared in xylene, and mounted with resinous mounting medium.
4.1. Statistics
ABR data was extracted from the TDT system with thresholds determined via custom code in MATLAB. MATLAB generated ABR thresholds were confirmed visually after analysis. The resulting ABR thresholds were analyzed using a linear mixed-effects model, accounting for repeated measures of each mice. ABR thresholds were the dependent variable, while fixed effects included injection route (i.p. vs. i.v.), time (Days 0, 1, 7, and 14), and frequency (4 ~ 32 kHz). Statistical test for the overall model used a type III analysis of variance. Post-hoc pairwise comparisons between injection routes at each frequency and time used estimated marginal means in R. p-values were adjusted using false discovery rate (FDR) method. lme4, lmerTest, and emmeans packages were used.
To analyze the XFM data and study the Pt distribution and change overtime, we first analyzed the overall data between treatment groups (i.v. vs. I.p.) using a One-Way Student’s T-test. Then within each of the treatment groups, a One-Way ANOVA was done to compare Pt accumulation across the three timepoints. Each of the timepoints were also compared to each other using a Student’s T-Test; these results are included in the supplemental data (Supplemental Table 1).
We also utilized a linear mixed-effects model with a Type III Wald chi-square test to analyze the XFM data considering cochlear locations, treatment group, and timepoints. The locations within the cochlea (IHC, OHC, SL, SG, CW, SV), treatment (i.v. and i.p. injections), and timepoints (day 1, 7, 14) were the fixed effects. Pt/S ratios were transformed via log10 and were the responses or dependent variable. This mode of analysis was chosen as not all of the groups had an equal number of datapoints. Post-hoc pairwise comparions for i.v. vs. i.p. groups were carried out for each location and timepoint. P-values were corrected using Tukey’s Honest Significant Difference (HSD). The statistical analysis was performed in R using lme4, car, emmeans, and ggplot2 packages with alpha = 0.05.
Supplementary Materials
Supplementary data can be found at the end of the manuscript.
Author Contributions
X.T. and C.P.R. conceived the research idea and X.T. acquired the funding; X.T., D.T., P.P., L.K., L.L., R.F., Y.Z., G.J., O.A., Y.Y, S.S., and M.K. conducted experimental work; P.P., L.L., A.G., D.T., I.G., and X.T. performed data analysis for XFM; C.K., R.F., P.P., G.J., and C.P.R. performed data analysis for ABRs; P.P., L.L., C.P.R., and X.T. interpreted the results. P.P., L.L., and X.T. drafted the manuscript. All authors edited the manuscript draft and approved the final manuscript.
Funding
This work is supported by NIH R01 DC019434, the startup fund of the Department of Otolaryngology at Northwestern University, and American Hearing Research Foundation to XT.
Institutional Review Board Statement
All animal procedures were carried out in accordance with the NIH Guide for the Care and Use of Laboratory Animals and were approved by the Institutional Animal Care and Use Committee at Northwestern University (protocol #IS00018749).
Informed Consent Statement
Not applicable
Data Availability Statement
All the relevant raw data for quantitative analysis of Pt is attached as supplementary results.
Acknowledgments
The XFM scanning was performed on the 2-ID-E beamline from the Advanced Photon Source, a U.S. Department of Energy (DOE) Office of Science user facility operated for the DOE Office of Science by Argonne National Laboratory under Contract No. DE-AC02-06CH11357. This research also used resources at the 5-ID SRX beamline of the National Synchrotron Light Source II, a U.S. Department of Energy (DOE) Office of Science User Facility operated for the DOE Office of Science by Brookhaven National Laboratory under Contract No. DE-SC0012704.
Conflicts of Interest
The authors declare no conflict of interest. The funders of the study had no role in the design of the study; in the collection, analyses, or interpretation of data; in the writing of the manuscript; or in the decision to publish the results.
Abbreviations
The following abbreviations are used in this manuscript:
| Pt | Platinum |
| XFM | X-ray Fluorescence Microscopy |
| ABR | Auditory Brainstem Responses |
References
- Kelland, L. The resurgence of platinum-based cancer chemotherapy. Nat. Rev. Cancer 2007, 7, 573–584. [Google Scholar] [CrossRef] [PubMed]
- Florea, A.M.; Busselberg, D. Cisplatin as an anti-tumor drug: cellular mechanisms of activity, drug resistance and induced side effects. Cancers 2011, 3, 1351–1371. [Google Scholar] [CrossRef] [PubMed]
- Pabla, N.; Dong, Z. Cisplatin nephrotoxicity: mechanisms and renoprotective strategies. Kidney Int. 2008, 73, 994–1007. [Google Scholar] [CrossRef] [PubMed]
- Gregg, R.W.; Molepo, J.M.; Monpetit, V.J.; Mikael, N.Z.; Redmond, D.; Gadia, M.; Stewart, D.J. Cisplatin neurotoxicity: the relationship between dosage, time, and platinum concentration in neurologic tissues, and morphologic evidence of toxicity. J. Clin. Oncol. 1992, 10, 795–803. [Google Scholar] [CrossRef] [PubMed]
- Rybak, L.P.; Whitworth, C.A.; Mukherjea, D.; Ramkumar, V. Mechanisms of cisplatin-induced ototoxicity and prevention. Hear Res. 2007, 226, 157–167. [Google Scholar] [CrossRef] [PubMed]
- Schacht, J.; Talaska, A.E.; Rybak, L.P. Cisplatin and aminoglycoside antibiotics: hearing loss and its prevention. Anat. Rec. 2012, 295, 1837–1850. [Google Scholar] [CrossRef] [PubMed]
- Kessler, L.; Koo, C.; Richter, C.P.; Tan, X. Hearing loss during chemotherapy: prevalence, mechanisms, and protection. Am. J. Cancer Res. 2024, 14, 4597–4632. [Google Scholar] [CrossRef] [PubMed]
- Dillard, L.K.; Lopez-Perez, L.; Martinez, R.X.; Fullerton, A.M.; Chadha, S.; McMahon, C.M. Global burden of ototoxic hearing loss associated with platinum-based cancer treatment: A systematic review and meta-analysis. Cancer Epidemiol. 2022, 79, 102203. [Google Scholar] [CrossRef] [PubMed]
- Brock, P.R.; Maibach, R.; Childs, M.; Rajput, K.; Roebuck, D.; Sullivan, M.J.; Laithier, V.; Ronghe, M.; Dall'Igna, P.; Hiyama, E.; et al. Sodium Thiosulfate for Protection from Cisplatin-Induced Hearing Loss. N Engl. J. Med. 2018, 378, 2376–2385. [Google Scholar] [CrossRef] [PubMed]
- Breglio, A.M.; Rusheen, A.E.; Shide, E.D.; Fernandez, K.A.; Spielbauer, K.K.; McLachlin, K.M.; Hall, M.D.; Amable, L.; Cunningham, L.L. Cisplatin is retained in the cochlea indefinitely following chemotherapy. Nat. Commun. 2017, 8, 1654. [Google Scholar] [CrossRef] [PubMed]
- Sung, C.Y.W.; Hayase, N.; Yuen, P.S.T.; Lee, J.; Fernandez, K.; Hu, X.; Cheng, H.; Star, R.A.; Warchol, M.E.; Cunningham, L.L. Macrophage depletion protects against cisplatin-induced ototoxicity and nephrotoxicity. Sci. Adv. 2024, 10, eadk9878. [Google Scholar] [CrossRef] [PubMed]
- Hazlitt, R.A.; Teitz, T.; Bonga, J.D.; Fang, J.; Diao, S.; Iconaru, L.; Yang, L.; Goktug, A.N.; Currier, D.G.; Chen, T.; et al. Development of Second-Generation CDK2 Inhibitors for the Prevention of Cisplatin-Induced Hearing Loss. J. Med. Chem. 2018, 61, 7700–7709. [Google Scholar] [CrossRef] [PubMed]
- Tan, X.; Zhou, Y.; Agarwal, A.; Lim, M.; Xu, Y.; Zhu, Y.; O'Brien, J.; Tran, E.; Zheng, J.; Gius, D.; Richter, C.P. Systemic application of honokiol prevents cisplatin ototoxicity without compromising its antitumor effect. Am. J. Cancer Res. 2020, 10, 4416–4434. [Google Scholar] [PubMed]
- Fung-Kee-Fung, M.; Provencher, D.; Rosen, B.; Hoskins, P.; Rambout, L.; Oliver, T.; Gotlieb, W.; Covens, A.; Canada, I.P.C.W.G.S.o.G.O.o. Intraperitoneal chemotherapy for patients with advanced ovarian cancer: a review of the evidence and standards for the delivery of care. Gynecol. Oncol. 2007, 105, 747–756. [Google Scholar] [CrossRef] [PubMed]
- Tamura, K.; Kitayama, J.; Saga, Y.; Takei, Y.; Fujiwara, H.; Yamaguchi, H.; Nagai, R.; Aizawa, K. Combined Intraperitoneal and Systemic Chemotherapy for Peritoneal Metastases: Drug Delivery Concepts, Pharmacokinetics, and Clinical Applications: A Narrative Review. Pharmaceutics 2026, 18. [Google Scholar] [CrossRef] [PubMed]
- Kireeva, G.; Kruglov, S.; Maydin, M.; Gubareva, E.; Fedoros, E.; Zubakina, E.; Ivanenko, N.; Bezruchko, M.; Solovyev, N. Modeling of Chemoperfusion vs. Intravenous Administration of Cisplatin in Wistar Rats: Adsorption and Tissue Distribution. Molecules 2020, 25. [Google Scholar] [CrossRef] [PubMed]
- Chvalova, K.; Brabec, V.; Kasparkova, J. Mechanism of the formation of DNA-protein cross-links by antitumor cisplatin. Nucleic Acids Res. 2007, 35, 1812–1821. [Google Scholar] [CrossRef] [PubMed]
- Treskes, M.; Nijtmans, L.G.; Fichtinger-Schepman, A.M.; van der Vijgh, W.J. Effects of the modulating agent WR2721 and its main metabolites on the formation and stability of cisplatin-DNA adducts in vitro in comparison to the effects of thiosulphate and diethyldithiocarbamate. Biochem Pharmacol. 1992, 43, 1013–1019. [Google Scholar] [CrossRef] [PubMed]
- Brouwers, E.E.; Huitema, A.D.; Beijnen, J.H.; Schellens, J.H. Long-term platinum retention after treatment with cisplatin and oxaliplatin. BMC Clin. Pharmacol. 2008, 8, 7. [Google Scholar] [CrossRef] [PubMed]
- Pinto, A.L.; Lippard, S.J. Binding of the antitumor drug cis-diamminedichloroplatinum(II) (cisplatin) to DNA. Biochim Biophys. Acta 1985, 780, 167–180. [Google Scholar] [CrossRef] [PubMed]
- Ramkumar, V.; Mukherjea, D.; Dhukhwa, A.; Rybak, L.P. Oxidative Stress and Inflammation Caused by Cisplatin Ototoxicity. Antioxidants 2021, 10. [Google Scholar] [CrossRef] [PubMed]
- van Ruijven, M.W.; de Groot, J.C.; Smoorenburg, G.F. Time sequence of degeneration pattern in the guinea pig cochlea during cisplatin administration. A quantitative histological study. Hear Res. 2004, 197, 44–54. [Google Scholar] [CrossRef] [PubMed]
- van Ruijven, M.W.; de Groot, J.C.; Klis, S.F.; Smoorenburg, G.F. The cochlear targets of cisplatin: an electrophysiological and morphological time-sequence study. Hear Res. 2005, 205, 241–248. [Google Scholar] [CrossRef] [PubMed]
- Bragado, P.; Armesilla, A.; Silva, A.; Porras, A. Apoptosis by cisplatin requires p53 mediated p38alpha MAPK activation through ROS generation. Apoptosis 2007, 12, 1733–1742. [Google Scholar] [CrossRef] [PubMed]
- Choi, Y.M.; Kim, H.K.; Shim, W.; Anwar, M.A.; Kwon, J.W.; Kwon, H.K.; Kim, H.J.; Jeong, H.; Kim, H.M.; Hwang, D.; et al. Mechanism of Cisplatin-Induced Cytotoxicity Is Correlated to Impaired Metabolism Due to Mitochondrial ROS Generation. PLoS ONE 2015, 10, e0135083. [Google Scholar] [CrossRef] [PubMed]
- Thomas, A.J.; Hailey, D.W.; Stawicki, T.M.; Wu, P.; Coffin, A.B.; Rubel, E.W.; Raible, D.W.; Simon, J.A.; Ou, H.C. Functional mechanotransduction is required for cisplatin-induced hair cell death in the zebrafish lateral line. J. Neurosci. 2013, 33, 4405–4414. [Google Scholar] [CrossRef] [PubMed]
- More, S.S.; Akil, O.; Ianculescu, A.G.; Geier, E.G.; Lustig, L.R.; Giacomini, K.M. Role of the copper transporter, CTR1, in platinum-induced ototoxicity. J. Neurosci. 2010, 30, 9500–9509. [Google Scholar] [CrossRef] [PubMed]
- Ciarimboli, G.; Deuster, D.; Knief, A.; Sperling, M.; Holtkamp, M.; Edemir, B.; Pavenstadt, H.; Lanvers-Kaminsky, C.; am Zehnhoff-Dinnesen, A.; Schinkel, A.H.; et al. Organic cation transporter 2 mediates cisplatin-induced oto- and nephrotoxicity and is a target for protective interventions. Am. J. Pathol. 2010, 176, 1169–1180. [Google Scholar] [CrossRef] [PubMed]
- Urien, S.; Lokiec, F. Population pharmacokinetics of total and unbound plasma cisplatin in adult patients. Br. J. Clin. Pharmacol. 2004, 57, 756–763. [Google Scholar] [CrossRef] [PubMed]
- Bourassa, D.; Gleber, S.C.; Vogt, S.; Yi, H.; Will, F.; Richter, H.; Shin, C.H.; Fahrni, C.J. 3D imaging of transition metals in the zebrafish embryo by X-ray fluorescence microtomography. Metallomics 2014, 6, 1648–1655. [Google Scholar] [CrossRef] [PubMed]
- Kopittke, P.M.; Punshon, T.; Paterson, D.J.; Tappero, R.V.; Wang, P.; Blamey, F.P.C.; van der Ent, A.; Lombi, E. Synchrotron-Based X-Ray Fluorescence Microscopy as a Technique for Imaging of Elements in Plants. Plant Physiol. 2018, 178, 507–523. [Google Scholar] [CrossRef] [PubMed]
- Ilinski, P.; Lai, B.; Cai, Z.; Yun, W.; Legnini, D.; Talarico, T.; Cholewa, M.; Webster, L.K.; Deacon, G.B.; Rainone, S.; et al. The direct mapping of the uptake of platinum anticancer agents in individual human ovarian adenocarcinoma cells using a hard X-ray microprobe. Cancer Res. 2003, 63, 1776–1779. [Google Scholar] [PubMed]
- Brister, E.Y.; Vasi, Z.; Antipova, O.; Robinson, A.; Tan, X.; Agarwal, A.; Stock, S.R.; Carriero, A.; Richter, C.P. X-ray fluorescence microscopy: A method of measuring ion concentrations in the ear. Hear Res. 2020, 391, 107948. [Google Scholar] [CrossRef] [PubMed]
- Glowacki, A.T. XRF-MAPS; U.S. Department of Energy, 2020. [Google Scholar]
- Perse, M. Cisplatin Mouse Models: Treatment, Toxicity and Translatability. Biomedicines 2021, 9. [Google Scholar] [CrossRef] [PubMed]
- Hill, G.W.; Morest, D.K.; Parham, K. Cisplatin-induced ototoxicity: effect of intratympanic dexamethasone injections. Otol. Neurotol. 2008, 29, 1005–1011. [Google Scholar] [CrossRef] [PubMed]
- Roy, S.; Ryals, M.M.; Van den Bruele, A.B.; Fitzgerald, T.S.; Cunningham, L.L. Sound preconditioning therapy inhibits ototoxic hearing loss in mice. J. Clin. Invest 2013, 123, 4945–4949. [Google Scholar] [CrossRef] [PubMed]
- Hati, S.; Zallocchi, M.; Hazlitt, R.; Li, Y.; Vijayakumar, S.; Min, J.; Rankovic, Z.; Lovas, S.; Zuo, J. AZD5438-PROTAC: A selective CDK2 degrader that protects against cisplatin- and noise-induced hearing loss. Eur. J. Med. Chem. 2021, 226, 113849. [Google Scholar] [CrossRef] [PubMed]
- Al Shoyaib, A.; Archie, S.R.; Karamyan, V.T. Intraperitoneal Route of Drug Administration: Should it Be Used in Experimental Animal Studies? Pharm. Res. 2019, 37, 12. [Google Scholar] [CrossRef] [PubMed]
- Liston, D.R.; Davis, M. Clinically Relevant Concentrations of Anticancer Drugs: A Guide for Nonclinical Studies. Clin. Cancer Res. 2017, 23, 3489–3498. [Google Scholar] [CrossRef] [PubMed]
- Matsuo, N.C.A.; Ando, H.; Takata, H.; Ishida, T. Protein-bound cisplatin could exhibit an efficient antitumor effect in vivo. J. Pharm. Sci. 2025, 114, 103881. [Google Scholar] [CrossRef] [PubMed]
- Troisi, R.; Galardo, F.; Ferraro, G.; Sica, F.; Merlino, A. Cisplatin Binding to Human Serum Transferrin: A Crystallographic Study. Inorg. Chem. 2023, 62, 675–678. [Google Scholar] [CrossRef] [PubMed]
- Chang, Q.; Ornatsky, O.I.; Siddiqui, I.; Straus, R.; Baranov, V.I.; Hedley, D.W. Biodistribution of cisplatin revealed by imaging mass cytometry identifies extensive collagen binding in tumor and normal tissues. Sci. Rep. 2016, 6, 36641. [Google Scholar] [CrossRef] [PubMed]
- Ugarteburu, M.; Doube, M.; Rau, C.; Antipova, O.; Li, L.X.; Stock, S.R.; Tan, X.; Cardoso, L.; Richter, C.P.; Carriero, A. Effect of bisphosphonate treatment on the oim mouse middle ear ossicles' structure, composition and hearing. Bone 2026, 204, 117764. [Google Scholar] [CrossRef] [PubMed]
- Ried, M.; Lehle, K.; Neu, R.; Diez, C.; Bednarski, P.; Sziklavari, Z.; Hofmann, H.S. Assessment of cisplatin concentration and depth of penetration in human lung tissue after hyperthermic exposure. Eur. J. Cardiothorac. Surg. 2015, 47, 563–566. [Google Scholar] [CrossRef] [PubMed]
- Stewart, D.J.; Benjamin, R.S.; Luna, M.; Feun, L.; Caprioli, R.; Seifert, W.; Loo, T.L. Human tissue distribution of platinum after cis-diamminedichloroplatinum. Cancer Chemother. Pharmacol. 1982, 10, 51–54. [Google Scholar] [CrossRef] [PubMed]
- Liu, Z.; Zhang, H.; Hong, G.; Bi, X.; Hu, J.; Zhang, T.; An, Y.; Guo, N.; Dong, F.; Xiao, Y.; et al. Inhibition of Gpx4-mediated ferroptosis alleviates cisplatin-induced hearing loss in C57BL/6 mice. Mol. Ther. 2024. [Google Scholar] [CrossRef] [PubMed]
- Wang, W.; Ma, P.; Gao, W.; Lu, P.; Ding, X.; Chen, J.; Yuan, H.; Lu, L. Nrf2 Knockout Affected the Ferroptosis Signaling Pathway against Cisplatin-Induced Hair Cell-Like HEI-OC1 Cell Death. Oxid. Med. Cell Longev. 2022, 2022, 2210733. [Google Scholar] [CrossRef] [PubMed]
- Sweeney, J.D.; Ziegler, P.; Pruet, C.; Spaulding, M.B. Hyperzincuria and hypozincemia in patients treated with cisplatin. Cancer 1989, 63, 2093–2095. [Google Scholar] [CrossRef] [PubMed]
- Koo, C.; Zhou, Y.; Thomas, D.; Fuentes, R.; Li, J.; Kim, M.; Richter, C.P.; Tan, X. Sex-specific hearing loss in Sirt3 knockout mice and attenuation by honokiol. Hear Res. 2026, 470, 109502. [Google Scholar] [CrossRef] [PubMed]
Figure 1.
Representative coarse XFM scans (10 µM steps) showing longitudinal Pt distribution in the cochlea after cisplatin treatment. (A) Compositive and individual plots of a control sample showing the distribution of platinum (Pt, red), Sulfur (S, green), and Phosphorus (P, blue). Three cochlear turns are clearly visible, and the location of the stria vascularis (SV), organ of Corti (OC), and spiral ganglion (SG) are marked on the basal section. (B) Compositive and Pt plots showing the longitudinal Pt accumulation over 14 days after cisplatin i.v. injection. (C) Compositive and Pt plots showing the longitudinal Pt accumulation over 14 days after cisplatin i.p. injection. Note the higher Pt signal intensity observed in i.v. compared to i.p. samples at all time points.
Figure 1.
Representative coarse XFM scans (10 µM steps) showing longitudinal Pt distribution in the cochlea after cisplatin treatment. (A) Compositive and individual plots of a control sample showing the distribution of platinum (Pt, red), Sulfur (S, green), and Phosphorus (P, blue). Three cochlear turns are clearly visible, and the location of the stria vascularis (SV), organ of Corti (OC), and spiral ganglion (SG) are marked on the basal section. (B) Compositive and Pt plots showing the longitudinal Pt accumulation over 14 days after cisplatin i.v. injection. (C) Compositive and Pt plots showing the longitudinal Pt accumulation over 14 days after cisplatin i.p. injection. Note the higher Pt signal intensity observed in i.v. compared to i.p. samples at all time points.
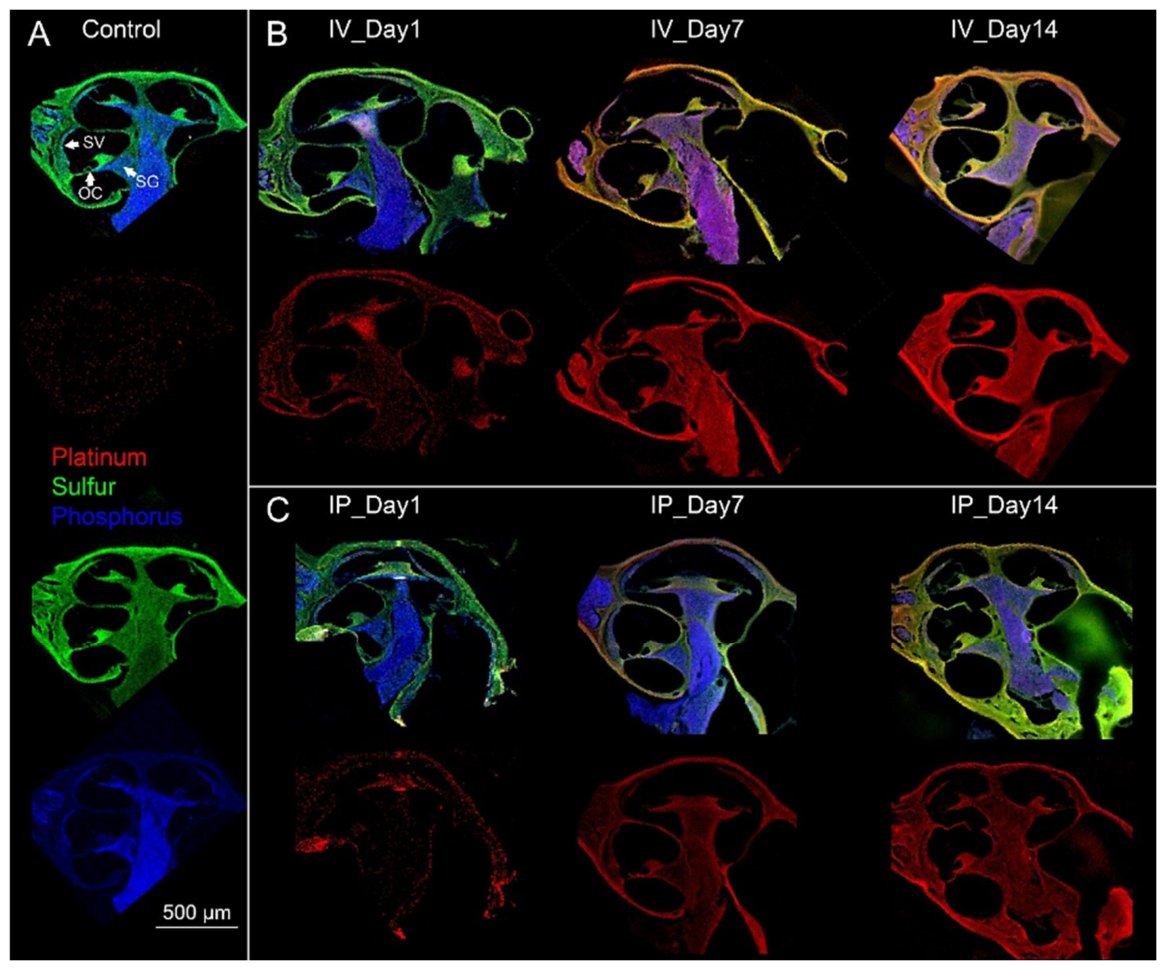
Figure 2.
Subcellular XFM mapping in the organ of Corti and selection of ROIs. Fine XFM imaging of the middle turn organ of Corti was obtained from an i.v. treated mouse (day 7), with a 500 nm scanning step size. (A) compositive plot showing Pt (red), S (green), and P (blue) signals, and the ROIs of OHCs, IHC, SL, and a blank area for quantitative analysis. (B-D) Signals of individual elements (Pt, S, and P) included in the compositive plot. S (green) serves as a house-keeping element to normalize Pt signals in different cells and structures. P (blue) helps to identify nuclei and nerve tissues. Inset in (C): schematic image of the organ of Corti. TM: tectorial membrane; CN: cochlear nerve.
Figure 2.
Subcellular XFM mapping in the organ of Corti and selection of ROIs. Fine XFM imaging of the middle turn organ of Corti was obtained from an i.v. treated mouse (day 7), with a 500 nm scanning step size. (A) compositive plot showing Pt (red), S (green), and P (blue) signals, and the ROIs of OHCs, IHC, SL, and a blank area for quantitative analysis. (B-D) Signals of individual elements (Pt, S, and P) included in the compositive plot. S (green) serves as a house-keeping element to normalize Pt signals in different cells and structures. P (blue) helps to identify nuclei and nerve tissues. Inset in (C): schematic image of the organ of Corti. TM: tectorial membrane; CN: cochlear nerve.
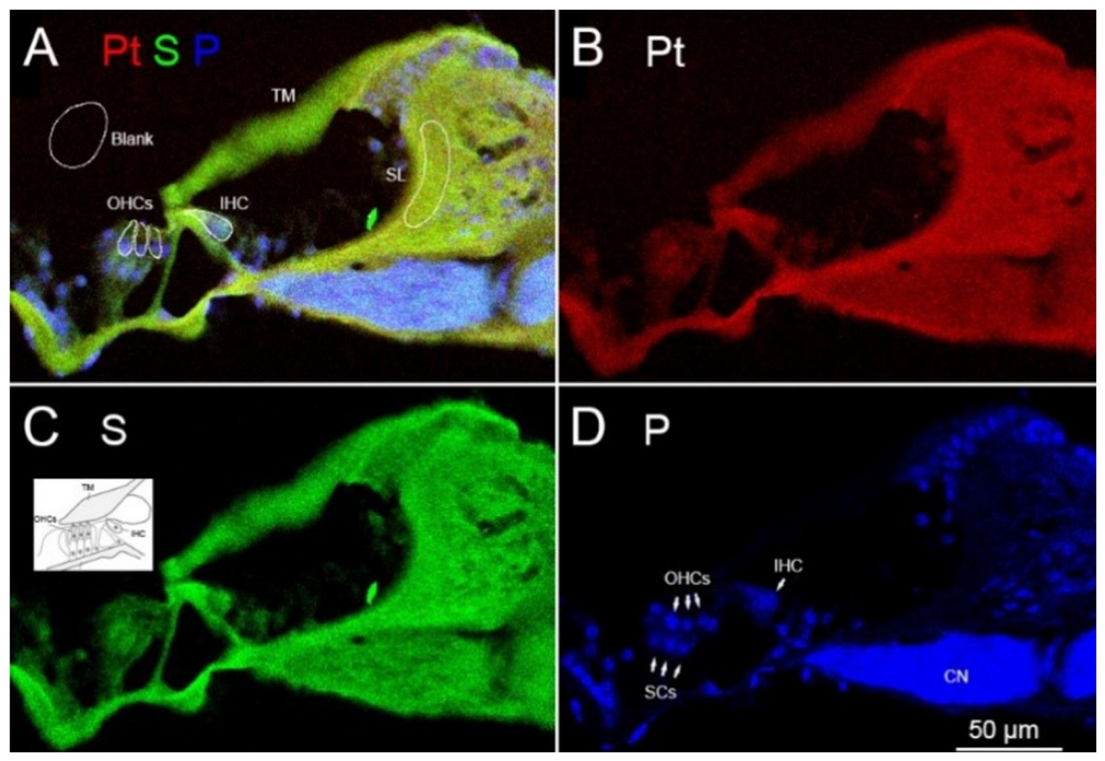
Figure 3.
Morphological validation of cochlear structures via overlay of H&E and XFM image. Figure 3. (A) H&E staining of an adjacent cochlear section. (B-D) Overlay of XFM and H&E images showing Pt (red), S (green), and P (blue) signals. Scale bar: 200 µm.
Figure 3.
Morphological validation of cochlear structures via overlay of H&E and XFM image. Figure 3. (A) H&E staining of an adjacent cochlear section. (B-D) Overlay of XFM and H&E images showing Pt (red), S (green), and P (blue) signals. Scale bar: 200 µm.
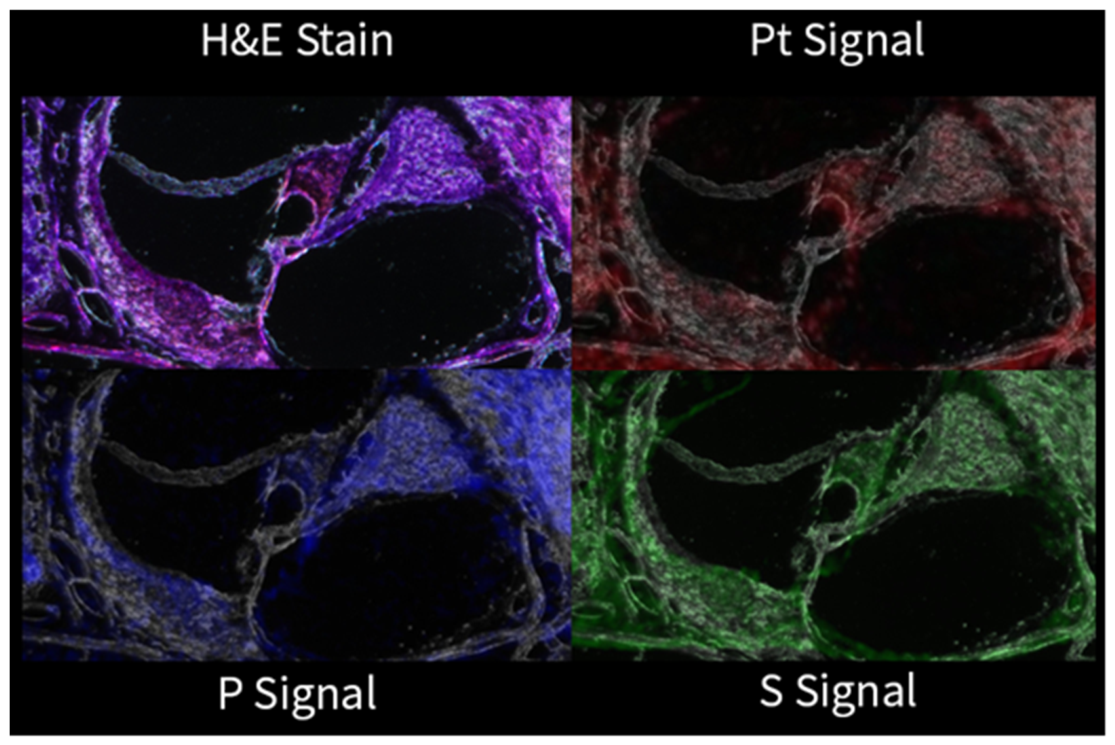
Figure 4.
X-ray fluorescence spectra confirmation of Pt emission of the sample in Figure 2. The blue curve is the integrated spectra acquired during XFM scan. The red curve is the model spectra generated with the peaks of emissions of all elements (as marked at the top) that were detected. The green curve represents the emission baseline. Two peaks of Pt emissions (Lα and Lβ) were shown at 9.44 and 11.07 keV, respectively.
Figure 4.
X-ray fluorescence spectra confirmation of Pt emission of the sample in Figure 2. The blue curve is the integrated spectra acquired during XFM scan. The red curve is the model spectra generated with the peaks of emissions of all elements (as marked at the top) that were detected. The green curve represents the emission baseline. Two peaks of Pt emissions (Lα and Lβ) were shown at 9.44 and 11.07 keV, respectively.
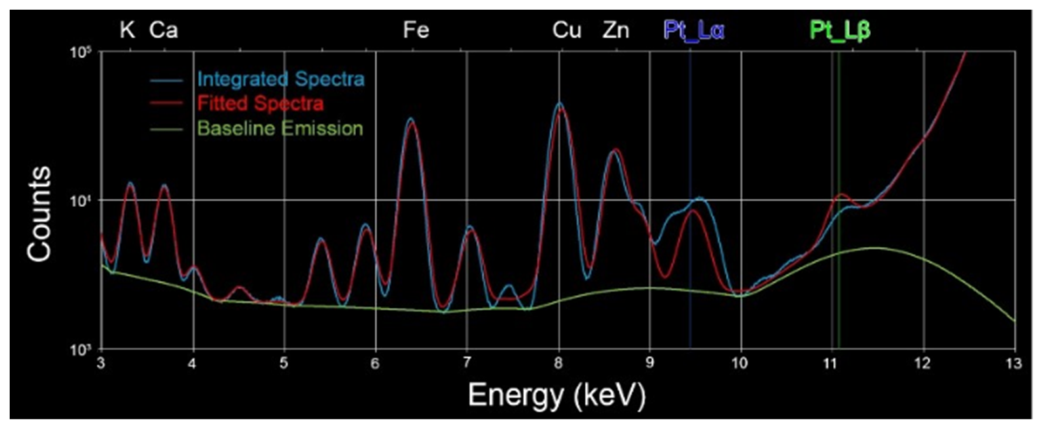
Figure 5.
Longitudinal Pt distribution in the organ of Corti following i.v. or i.p. cisplatin administration. Representative compositive and Pt signals in the organ of Corti for i.v. (top rows) and i.p. (bottom rows) treatment groups were included to show longitudinal changes of Pt distribution. Compositive images include Pt (red), S (green), and P (blue). Structural boundaries of IHCs and OHCs outsketched were determined by the location of nuclei, which were enriched with P. Further verification was performed by overlay with H&E staining of the adjacent sections when necessary, as above described. Images for IP D1 were scanned at NSLS-II with a resolution of 300 nm, and the rest images were scanned at APS with a resolution of 500 nm. Note that Pt signals in the entire organ of Corti increased over time as clearly shown in the scatter plots.
Figure 5.
Longitudinal Pt distribution in the organ of Corti following i.v. or i.p. cisplatin administration. Representative compositive and Pt signals in the organ of Corti for i.v. (top rows) and i.p. (bottom rows) treatment groups were included to show longitudinal changes of Pt distribution. Compositive images include Pt (red), S (green), and P (blue). Structural boundaries of IHCs and OHCs outsketched were determined by the location of nuclei, which were enriched with P. Further verification was performed by overlay with H&E staining of the adjacent sections when necessary, as above described. Images for IP D1 were scanned at NSLS-II with a resolution of 300 nm, and the rest images were scanned at APS with a resolution of 500 nm. Note that Pt signals in the entire organ of Corti increased over time as clearly shown in the scatter plots.
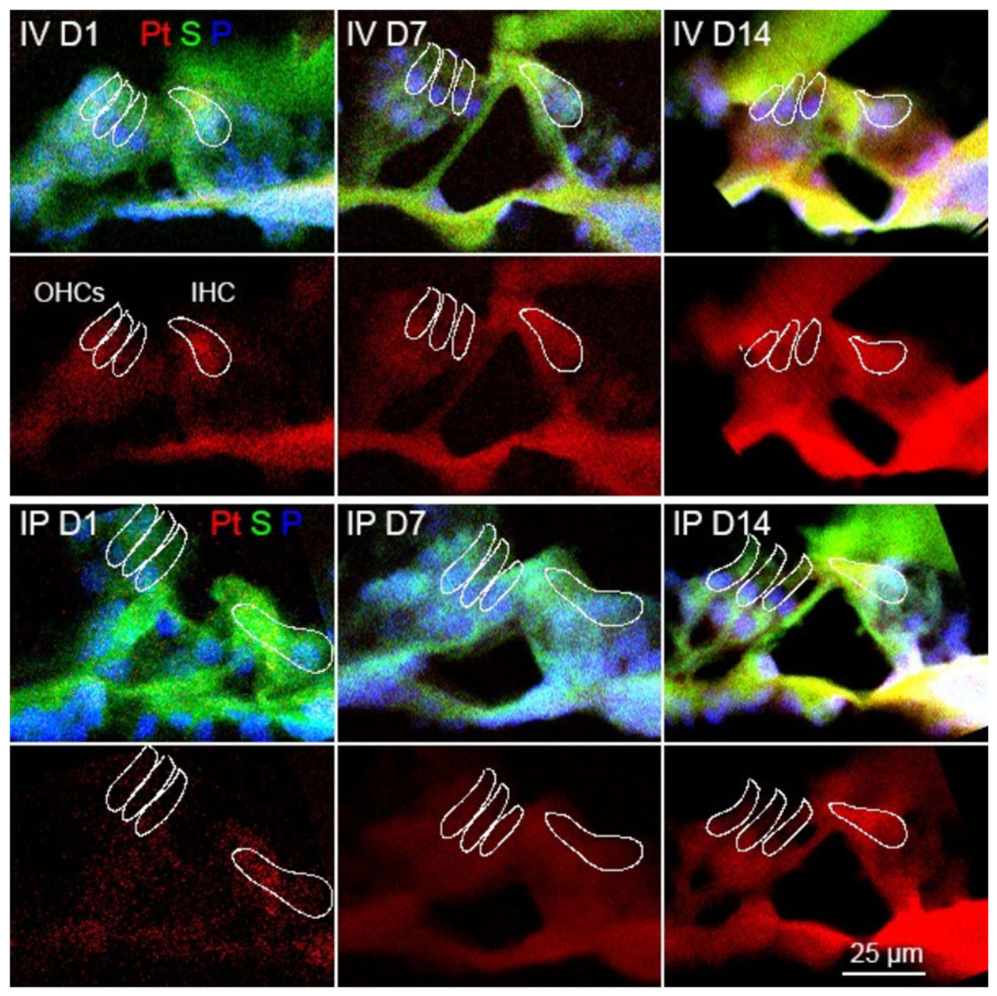
Figure 6.
Quantitative analysis of Pt accumulation in the organ of Corti. Scatter plots of Pt/S ratio measured in (A) IHCs, (B) OHCs, and (C) SL. Data points were obtained from three cochlear samples per group/time point. Different symbols denote the cochlear turn of origin: apical (▲), middle (●), and basal (■). The mean and one standard deviation (SD) were indicated by horizontal bars for each cohort. Pt/S ratios were calculated to normalize Pt accumulation against regional biological variation.
Figure 6.
Quantitative analysis of Pt accumulation in the organ of Corti. Scatter plots of Pt/S ratio measured in (A) IHCs, (B) OHCs, and (C) SL. Data points were obtained from three cochlear samples per group/time point. Different symbols denote the cochlear turn of origin: apical (▲), middle (●), and basal (■). The mean and one standard deviation (SD) were indicated by horizontal bars for each cohort. Pt/S ratios were calculated to normalize Pt accumulation against regional biological variation.
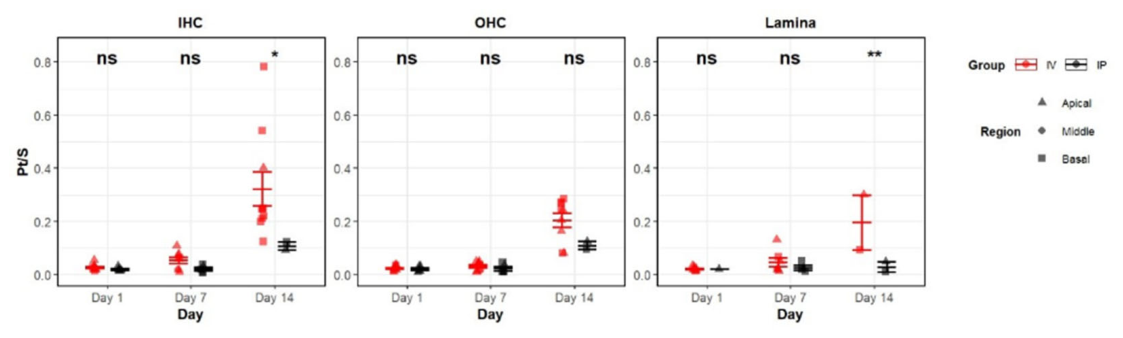
Figure 7.
Longitudinal Pt distribution in the SG following i.v. or i.p. cisplatin administration. Representative compositive (Pt in red, S in green, and P in blue) and Pt signals alone in the SG of i.v. (top rows) and i.p. (bottom rows) treatment groups were included. SL: spiral lamina; SGNs: spiral ganglion neurons. Images for IP D1 were scanned at NSLS-II with a resolution of 300 nm, and the rest images were scanned at APS with a resolution of 500 nm. Note that S signal was enriched in SGNs, and the accumulation of Pt signal in SGNs was clearly visible.
Figure 7.
Longitudinal Pt distribution in the SG following i.v. or i.p. cisplatin administration. Representative compositive (Pt in red, S in green, and P in blue) and Pt signals alone in the SG of i.v. (top rows) and i.p. (bottom rows) treatment groups were included. SL: spiral lamina; SGNs: spiral ganglion neurons. Images for IP D1 were scanned at NSLS-II with a resolution of 300 nm, and the rest images were scanned at APS with a resolution of 500 nm. Note that S signal was enriched in SGNs, and the accumulation of Pt signal in SGNs was clearly visible.
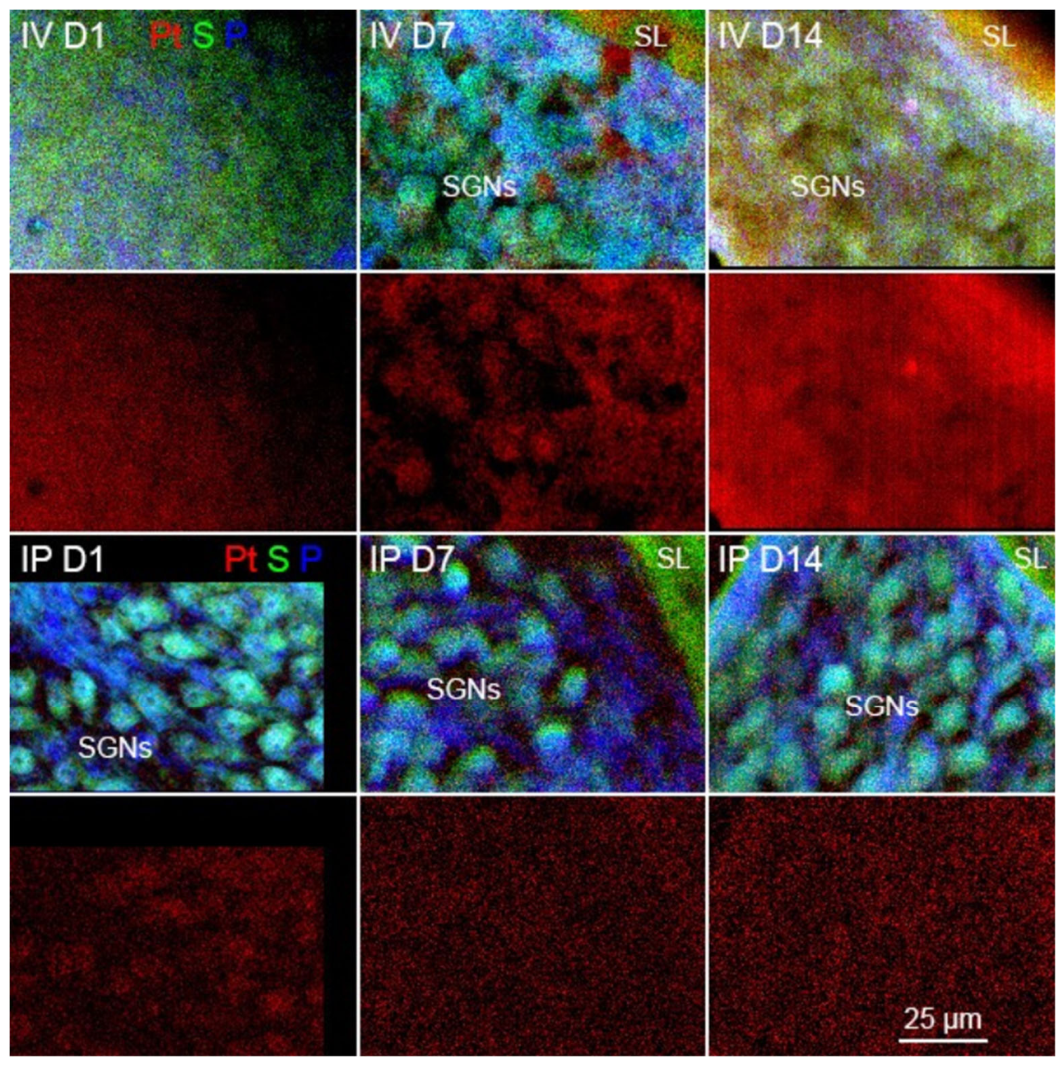
Figure 8.
Quantitative analysis of Pt accumulation in SG. Scatter plots of Pt/S ratio measured in an area of 400 µm2 adjacent to SL were shown. Different symbols denote the cochlear turn of origin: apical (▲), middle (●), and basal (■). The mean and one standard deviation (SD) were indicated by horizontal bars for each cohort.
Figure 8.
Quantitative analysis of Pt accumulation in SG. Scatter plots of Pt/S ratio measured in an area of 400 µm2 adjacent to SL were shown. Different symbols denote the cochlear turn of origin: apical (▲), middle (●), and basal (■). The mean and one standard deviation (SD) were indicated by horizontal bars for each cohort.
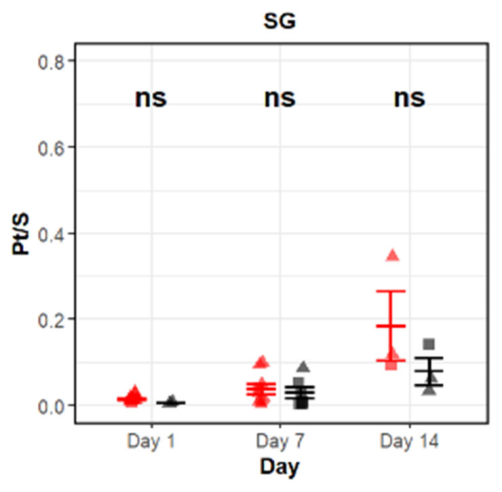
Figure 9.
Longitudinal Pt distribution in the SV and CB following i.v. or i.p. cisplatin administration. Representative compositive (Pt in red, S in green, and P in blue) and Pt signals alone in the SG of i.v. (top rows) and i.p. (bottom rows) treatment groups were included. SL: spiral lamina; SGNs: spiral ganglion neurons. All the samples presented were scanned at APS with a resolution of 500 nm. Note that day 1 samples included adjacent organ of Corti in the same image, which could serve as the direct comparison between SV and the organ of Corti.
Figure 9.
Longitudinal Pt distribution in the SV and CB following i.v. or i.p. cisplatin administration. Representative compositive (Pt in red, S in green, and P in blue) and Pt signals alone in the SG of i.v. (top rows) and i.p. (bottom rows) treatment groups were included. SL: spiral lamina; SGNs: spiral ganglion neurons. All the samples presented were scanned at APS with a resolution of 500 nm. Note that day 1 samples included adjacent organ of Corti in the same image, which could serve as the direct comparison between SV and the organ of Corti.
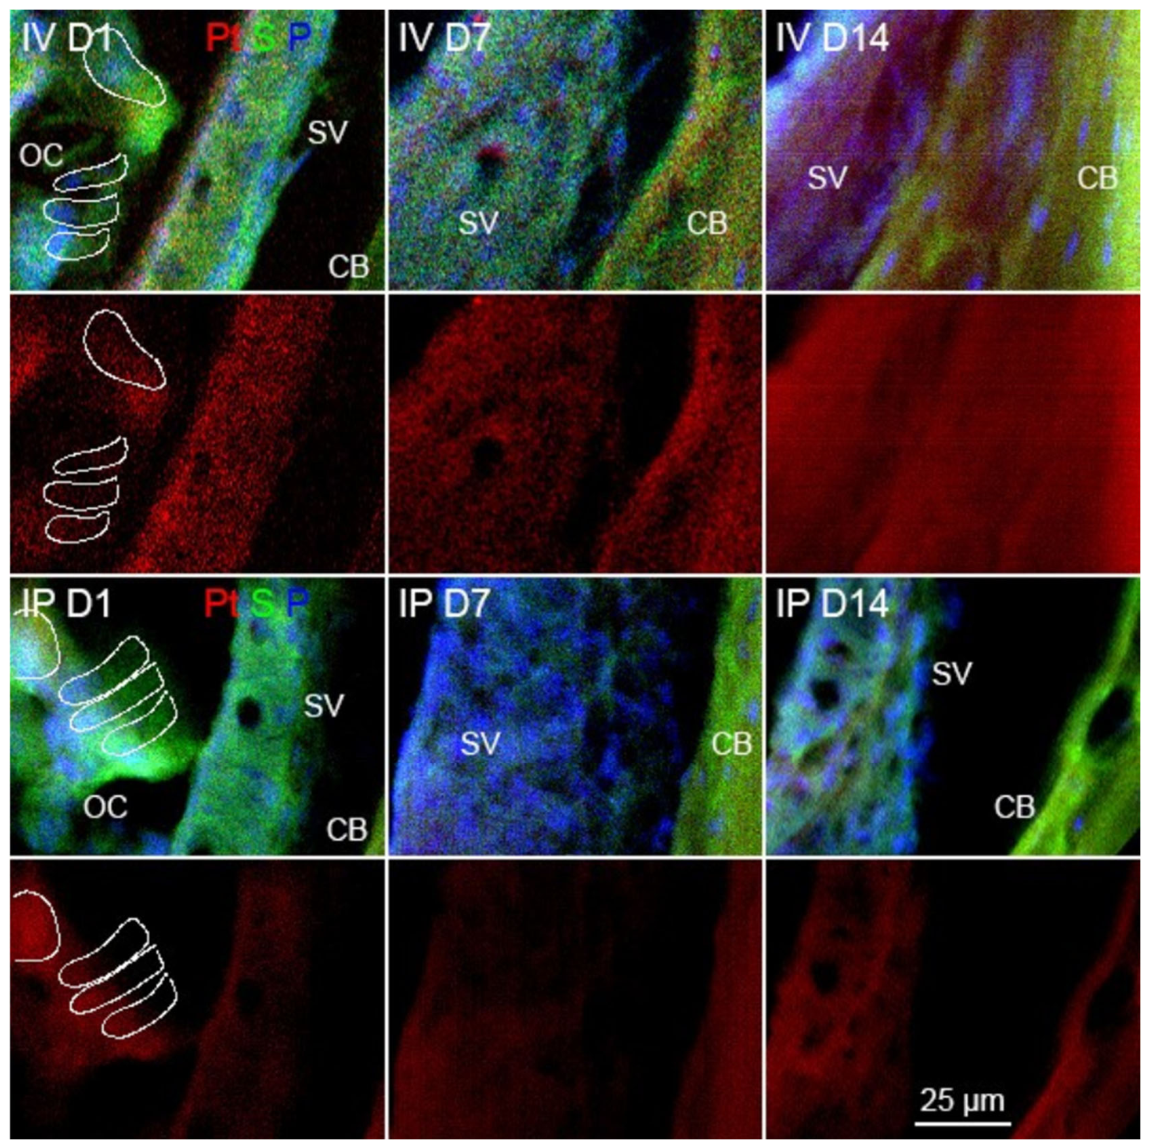
Figure 10.
Scatter plot for Pt/S ratio.
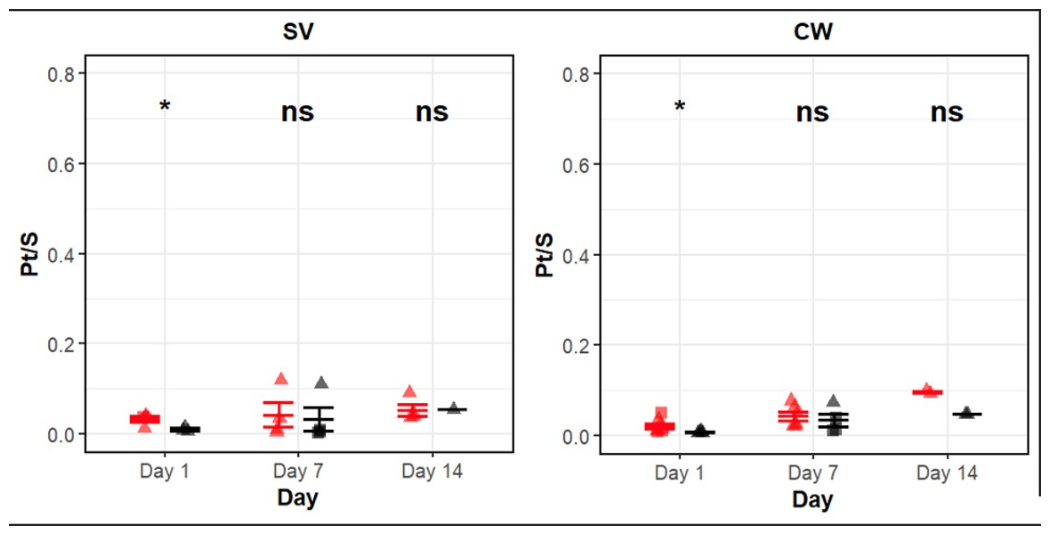
Figure 11.
Comparative analysis of Pt signal intensity across cochlear locations. Box plot for quantitative assessment of normalized Pt/S ratios in the organ of Corti (IHCs and OHCs), SL, SG, CB, and SV at days 1, 7, and 14 post-cisplatin administration. A trend of preferential Pt accumulation in the organ of Corti compared to other cochlear substructures was demonstrated. Numerical key for the boxplot is located in the supplementary data.
Figure 11.
Comparative analysis of Pt signal intensity across cochlear locations. Box plot for quantitative assessment of normalized Pt/S ratios in the organ of Corti (IHCs and OHCs), SL, SG, CB, and SV at days 1, 7, and 14 post-cisplatin administration. A trend of preferential Pt accumulation in the organ of Corti compared to other cochlear substructures was demonstrated. Numerical key for the boxplot is located in the supplementary data.
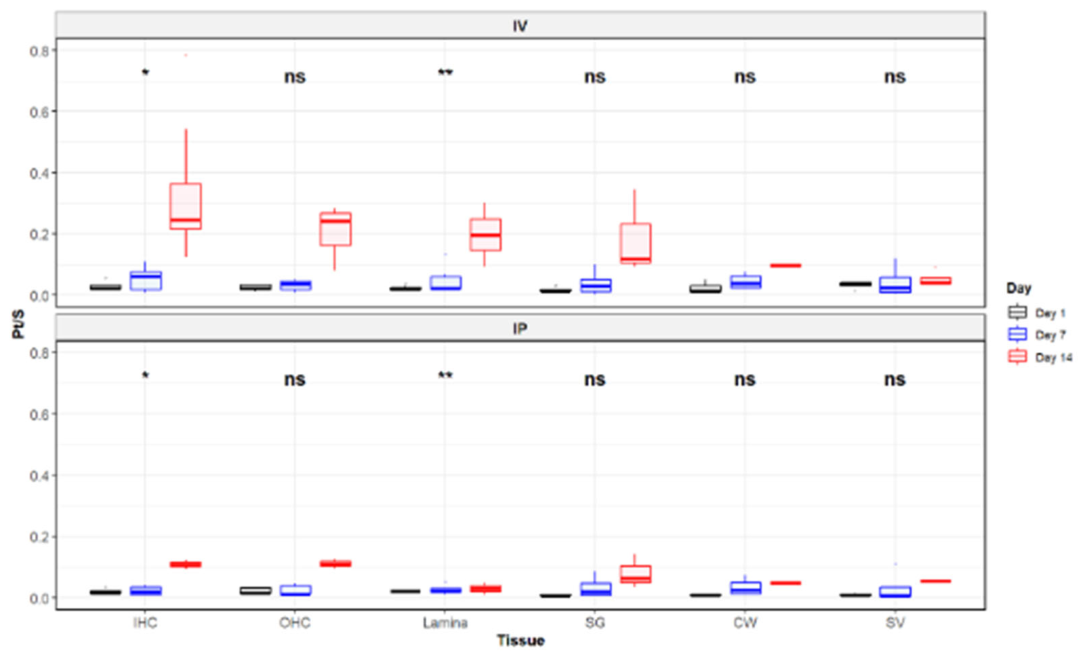
Figure 12.
ABR threshold changes following i.v. and i.p. cisplatin treatment. ABR thresholds at frequency range 4-32 kHz were measured at baseline (Day 0) and at 1, 7, and 14 days post-cisplatin administration. No significant difference in threshold shifts was observed between i.p. and i.v. cohorts across all tested frequencies. Data are presented as mean ± SD.
Figure 12.
ABR threshold changes following i.v. and i.p. cisplatin treatment. ABR thresholds at frequency range 4-32 kHz were measured at baseline (Day 0) and at 1, 7, and 14 days post-cisplatin administration. No significant difference in threshold shifts was observed between i.p. and i.v. cohorts across all tested frequencies. Data are presented as mean ± SD.
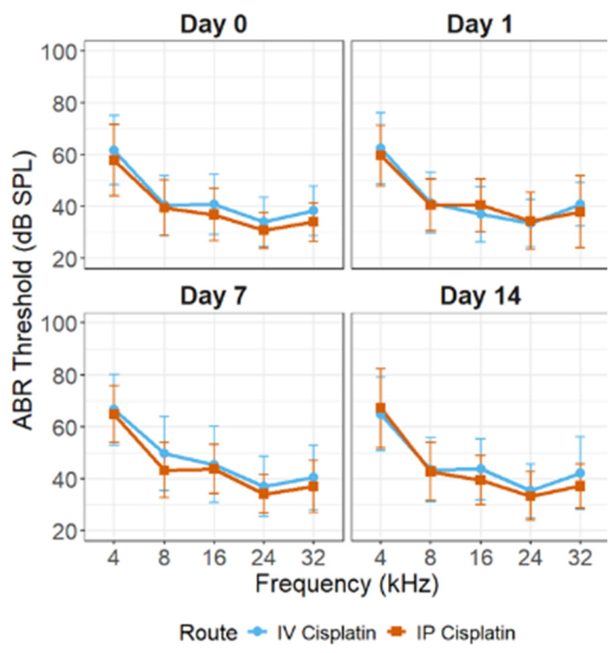
Table 1.
Selected ROIs with Pt and S signals for the sample shown in Figure 2.
Table 1.
Selected ROIs with Pt and S signals for the sample shown in Figure 2.
| Location | Pt (ug/cm2) | S (ug/cm2) | Pt/S |
| IHCs | 0.0010 | 0.0545 | 0.018 |
| OHCs | 0.0008 | 0.0476 | 0.017 |
| SL | 0.0307 | 1.4559 | 0.021 |
Table 2.
Comparison of Pt accumulation across days and treatment groups.
| Comparison | P-value |
| IV vs. IP | 0.03037 |
| IV : time | 0.00038 |
| IP : time | 0.00042 |
Table 4.
Type III analysis of variance for ABR thresholds.
| Factor | Sum Sq | Mean Sq | df | F value | p-value |
| Injection route | 125.5262 | 125.5262 | 1 | 1.269428 | 0.261574 |
| Days | 1900.221 | 633.4069 | 3 | 6.405548 | 0.000264 |
| Frequency | 103262.1 | 25815.52 | 4 | 261.0684 | 1.4E-159 |
| Route:Days | 267.9678 | 89.32259 | 3 | 0.903306 | 0.43887 |
| Route:Freq | 221.8101 | 55.45252 | 4 | 0.560783 | 0.691184 |
| Days:Freq | 1237.755 | 103.1462 | 12 | 1.043102 | 0.406127 |
| Route:Days:Freq | 887.0252 | 73.91877 | 12 | 0.747529 | 0.705121 |
Disclaimer/Publisher’s Note: The statements, opinions and data contained in all publications are solely those of the individual author(s) and contributor(s) and not of MDPI and/or the editor(s). MDPI and/or the editor(s) disclaim responsibility for any injury to people or property resulting from any ideas, methods, instructions or products referred to in the content. |
© 2026 by the authors. Licensee MDPI, Basel, Switzerland. This article is an open access article distributed under the terms and conditions of the Creative Commons Attribution (CC BY) license.
Copyright: This open access article is published under a Creative Commons CC BY 4.0 license, which permit the free download, distribution, and reuse, provided that the author and preprint are cited in any reuse.