

Submitted:
21 October 2026
Posted:
22 October 2026
You are already at the latest version
Abstract
Background: Type 1 diabetes mellitus (T1DM) is characterised by substantial heterogeneity in clinical manifestations, the rate of β-cell destruction, and diabetes-associated autoantibody (DAA) profiles across individuals of different ethnic backgrounds and ages. We investigated the immunological heterogeneity of T1DM through immunophenotyping of major lymphocyte populations using multiparameter flow cytometry. Results: T1DM associates with distinct immunophenotypes dependent on age, disease stage, DAA profiles, and the presence of Diabetic Ketoacidosis (DKA). Paediatric T1DM (n = 49) shows attenuated innate immunity (fewer NK and MAIT cells) alongside higher T-cell activation. Adult T1DM (n = 55) features remodelling in NK-cell receptor landscape, specifically expanding CD8+, CD38+, CD161+, and NKG2A+ NK-cell subsets. Long-standing T1DM (n = 28) combines higher CD8+ T-cell cytotoxicity with lower NK-cell cytotoxicity. High Autoantibody / Multi-antibody T1DM is marked by fewer CD8+ T cells, B cells, protective NKregs, and MAIT cells, but more CD38+ NK cells. Seronegative / Low Antibody T1DM shows a drop in total NK and NKeff cells, but an expansion of inhibitory, CD56bright, and CD8+ NK subsets. Paediatric DKA is linked to fewer innate-like T cells and more activated T cells. Adult DKA is characterized by drops in various NK cells (CD3-CD56+, CD3-CD8+, NKeff) and specific T cells (CD8+CD161+ and CD161+ double-negative). Conclusions: The immunological heterogeneity identified in patients with T1DM underscores the importance of patient stratification, which may facilitate the discovery of predictive and prognostic cellular biomarkers capable of estimating the rate of progression to clinically manifest T1DM and the risk of an aggressive disease course, respectively.
Keywords:
diabetes-associated autoantibodies (DAA)
; immunological heterogeneity
; T cells
; MAIT cells
; CD8+HLA-DR-CD38+ T cells
; NK cells
; CD56bright NKregs
; CD38+ NK cells
; CD8+CD161+ NK cells
; CD8+NKG2A+ NK cells
; perforin
; granzyme B
1. Introduction
Type 1 diabetes mellitus (T1DM) is a common autoimmune disease that frequently manifests during childhood and adolescence [1]. An intriguing feature distinguishing T1DM from other autoimmune disorders is the age-related decline in the incidence of newly diagnosed cases [2]. The disease process begins long before the onset of overt clinical symptoms [3], thereby complicating timely diagnosis, the identification of early immune abnormalities, and the investigation of the underlying mechanisms of immunopathogenesis. T1DM is characterised by three distinct stages of disease progression. Stage 1 is defined by the initial autoimmune destruction of pancreatic β-cells and seroconversion to multiple islet autoantibodies in the absence of disturbances in carbohydrate metabolism, with normoglycaemia being preserved. Stage 2 is associated with dysglycaemia resulting from progressive β-cell destruction and a concomitant decline in insulin secretion. Progression to stage 3 reflects a substantial reduction in endogenous insulin secretion due to the loss of the majority of β-cells, which is clinically and biochemically manifested by pronounced hyperglycaemia [4].
T1DM is characterised by considerable heterogeneity across multiple levels, including epidemiology, genetic susceptibility, aetiological factors, the rate of disease progression, clinical manifestations and, ultimately, response to therapy [5]. Two major endotypes of T1DM have been proposed, T1DE1 and T1DE2, which are thought to be underpinned by distinct pathogenic mechanisms. T1DE1 is associated with early childhood, typically before 7 years of age, rapid loss of β-cell mass and function, a more aggressive clinical course, and pronounced lymphocytic infiltration of the pancreas. T1DE2 is associated with disease onset later in life, including in children older than 12 years and in adults, a slower decline in β-cell function, and later clinical manifestation [2]. Considerable heterogeneity is also observed within T1DE2, with patients broadly classified as rapid or slow progressors. Rapid progressors develop classical T1DM with a relatively swift loss of β-cell function and fall within the category of so-called severe autoimmune diabetes (SAID). At the opposite end of the T1DM spectrum are slowly progressive forms, including latent autoimmune diabetes in adults (LADA) and slowly progressive type 1 diabetes mellitus (SPIDDM), the latter being particularly characteristic of the Japanese population [6].
Marked heterogeneity should likewise be recognised in relation to diabetes-associated autoantibodies (DAA), as patients with T1DM differ in the spectrum, combinations, titres, epitope specificity and affinity of these autoantibodies [7]. In clinical practice and research, several principal types of DAA are routinely assessed, including autoantibodies against the 65-kDa isoform of glutamic acid decarboxylase (GADA), insulin autoantibodies (IAA), islet cell antibodies (ICA), autoantibodies against tyrosine phosphatase-related antigens, including insulinoma-associated antigen 2 (IA-2A) and the tyrosine phosphatase-like molecule IA-2β, as well as autoantibodies against zinc transporter 8 (ZnT8A). The presence of autoantibodies directed against two or more islet antigens is considered a reliable predictor of T1DM risk. Nevertheless, up to 30% of individuals with multiple autoantibody positivity do not develop clinically overt T1DM within 10 years and are therefore classified as slow progressors [8]. A distinct subgroup is represented by seronegative patients with T1DM, who account for up to 15% of cases [9]. These patients are classified as having so-called idiopathic T1DM, formerly referred to as type 1B diabetes, in which the mechanisms responsible for β-cell destruction remain unknown.
DAA detected during the preclinical stage of the disease indicate that a loss of both T-cell and B-cell tolerance has already been initiated. The autoantibodies themselves, however, are not considered to contribute directly to pancreatic immunopathology. Rather, the critical role of B cells, producing autoantibodies, in the pathogenesis of T1DM is attributed primarily to their capacity to present autoantigens to T cells and thereby promote T-cell activation [10]. Although the trigger responsible for the autoimmune attack in T1DM remains incompletely understood, β-cell destruction is thought to be associated with immune-cell infiltration of the pancreatic islets and the subsequent development of insulitis [11]. Several lymphocyte populations are considered to play central roles in disease pathogenesis, including cytotoxic CD8+ T cells, which directly mediate β-cell destruction; CD4+ T cells, which secrete pro-inflammatory cytokines; regulatory T cells (Tregs), whose capacity to restrain effector-cell activity is impaired; and antigen-presenting cells (APCs), including dendritic cells (DCs) and B cells. Dysregulated interactions between APCs and T cells collectively contribute to the initiation and perpetuation of the autoimmune response [12]. Importantly, intrinsic β-cell dysfunction and cellular stress also contribute to the maintenance of local autoinflammation [13].
Although the principal pathogenic processes take place within the pancreas and pancreatic lymph nodes (pLNs), peripheral blood may reflect immunological alterations occurring within these tissues. Individuals with T1DM exhibit abnormalities in both the frequency and functional properties of several lymphocyte subsets. In children with T1DM, reduced frequencies of DCs and their respective subpopulations have been reported, including plasmacytoid dendritic cells (pDCs), myeloid dendritic cells (mDCs), slan-CD16- mDCs and slan-CD16+ mDCs [14]. A reduction in the total natural killer (NK) cell population and in specific NK-cell subsets, including CD56dimCD16bright and CD56dimCD16- cells, has likewise been described in children [14] and adults [15]. A pronounced imbalance within the T-cell compartment has also been demonstrated. This includes a reduction in CD8+ T cells accompanied by a reciprocal increase in CD4+ T cells, and an increased frequency of activated HLA-DR+CD38+ CD4+ and CD8+ T cells in children. Disturbances in naive/memory T-cell homeostasis have been observed in both children and adults, with a predominance of naive and central memory (CM) populations alongside reduced effector memory (EM) and terminally differentiated effector memory cells re-expressing CD45RA (TEMRA). Other reported abnormalities include an increased frequency of circulating T follicular helper (cTfh) cells [16], a reduction in both the number and suppressive capacity of Tregs [17], and disruption of the B-cell compartment, characterised by an increased proportion of transitional B cells together with a reduced proportion of regulatory B cells (Bregs) [18].
However, findings reported across different laboratories remain highly inconsistent, most likely owing to the substantial heterogeneity of the T1DM populations under investigation, which may obscure otherwise detectable immunological differences. Accordingly, considerable efforts have been directed towards identifying immunological profiles characteristic of distinct subgroups of patients with T1DM. Slow progressors at the preclinical stage have been shown to lack islet-specific CD8+ T cells and to exhibit higher levels of CD95 expression across several B-cell subsets, rendering these cells more susceptible to apoptotic death and potentially contributing to a slower rate of T1DM progression [8]. Single-cell transcriptomic sequencing data further demonstrate that, compared with classical T1DM, LADA is characterised by more moderate activation of the Janus kinase/signal transducer and activator of transcription (JAK/STAT) axis and reduced interplay between the pro-inflammatory epidermal growth factor receptor (EGFR) and nuclear factor kappa B (NF-κB) signalling pathways [19]. Another study investigating immunological differences between seronegative and seropositive patients with a three-year duration of T1DM failed to identify a distinctive immunophenotype in either group based on the analysis of naive and memory T- and B-cell subsets, T helper 1 (Th1) and circulating T follicular helper (cTfh) cells, regulatory T cells (Tregs) and regulatory B cells (Bregs), as well as innate-like lymphocyte populations, including natural killer (NK) cells, γδ T cells and mucosal-associated invariant T (MAIT) cells [20].
The principal aim of the present study was to characterise immunological heterogeneity and to identify distinctive immunophenotypes associated with the different patient groups investigated. Given that the immune system undergoes profound developmental and age-related changes, while epidemiological data indicate that the incidence of T1DM onset declines with age, it is particularly important to delineate the immunopathogenic features associated with T1DM across different age groups and disease stages, as well as to identify factors potentially associated with severe complications such as diabetic ketoacidosis (DKA). We therefore compared the immunophenotypes of: (1) children with T1DM at the preclinical (n=37) and clinical stages, including at disease onset (n=49) and during long-standing disease (n=28); (2) younger children with T1DM aged 1-9 years (n=31) and the overall paediatric cohort of 1-18 years (n=49); (3) children aged 1-18 years and adults aged 18-55 years with T1DM; (4) subgroups of children and adults stratified according to DAA status, including seronegative individuals and those positive for one, two or three DAAs, as well as according to quantitative DAA levels; and (5) children and adults with T1DM with a history of DKA. Distinctive immunophenotypes were identified, each comprising a specific pattern of several immune-cell subpopulations. These findings are of relevance both to fundamental research and clinical medicine. They enabled us not only to delineate age-dependent cellular mechanisms underlying T1DM development, and to characterise the trajectory of disease progression in children through comparative analysis of different stages of T1DM, but also to identify critical immune-cell subpopulations associated with an aggressively progressive autoimmune process in the context of multiple DAA positivity and a history of DKA. The immunophenotypes identified across the different patient subgroups may represent candidate biomarkers. They may therefore warrant consideration in clinical practice as an additional approach to patient stratification, complementing the assessment of circulating DAAs. Such immunophenotypic stratification may ultimately prove valuable for individualised therapeutic decision-making, including the selection and implementation of immunotherapeutic strategies.
2. Materials and Methods
Study Cohorts (Subjects)
The study included children younger than 18 years of age (n=140) and adults aged 18-55 years (n=105). All participants were stratified into the following clinical groups. The healthy donor (HD) control group comprised children (n=23) and adults (n=42) with no family history of T1DM and no abnormalities of carbohydrate metabolism. The stage 1-2 T1DM group included children (n=40) and adults (n=7) with preclinical-stage T1DM, defined by the presence of two or more diabetes-associated autoantibodies in the absence of clinically overt hyperglycaemia. The stage 3 T1DM group comprised children (n=49) and adults (n=56) with clinically manifest T1DM, characterised by overt hyperglycaemia and the requirement for insulin therapy. In addition, 28 children with T1DM of more than one year in duration were analysed as a separate clinical group. The stage 3 T1DM group was further stratified according to the presence of diabetic ketoacidosis (DKA) at diagnosis. Among children, two subgroups were distinguished: those without DKA (n=31) and those presenting with DKA (n=18). Among adults, the DKA subgroup comprised 27 participants, whereas 10 participants had no history of DKA. Information regarding the presence or absence of DKA was unavailable or unknown for 18 participants.
All participants underwent clinical and laboratory assessment at the State Research Centre of the Russian Federation, Academician I.I. Dedov National Medical Research Centre for Endocrinology of the Ministry of Health of the Russian Federation, between 2024 and 2026. In all study participants, parameters of carbohydrate metabolism, complete blood count indices, and T1DM-associated autoantibodies were assessed. Venous blood samples for laboratory analyses were collected in the morning after an overnight fast. Glycated haemoglobin (HbA1c) was measured in whole blood using HPLC at D-10 analyzer, BioRad, USA, certified in accordance with the requirements of the National Glycohemoglobin Standardization Program/International Federation of Clinical Chemistry and Laboratory Medicine (NGSP/IFCC). Serum glucose concentration was measured using an Architect c8000 automated biochemical analyser (Abbott Laboratories, USA), and insulin and C-peptide levels were measured using an Cobas е 601 immunochemical analyser (Roche, Switzerland). T1DM-associated autoantibodies were determined by enzyme-linked immunosorbent assay (ELISA) in accordance with the manufacturers' instructions for Euroimmun (Germany), Orgentec (Germany), Biomerica (USA) diagnostic kits. Complete blood counts, including leukocyte counts and haemoglobin concentrations, were obtained using a Sysmex XN-1000 automated haematology analyser (Sysmex Corp., Japan).
The diagnosis of type 1 diabetes mellitus and determination of disease stage were performed in accordance with the current 2025 Algorithms of Specialised Medical Care for Patients with Diabetes Mellitus issued by the Ministry of Health of the Russian Federation, the Russian Association of Endocrinologists, and Endocrinology Research Centre, as well as on the basis of the 2026 American Diabetes Association (ADA) Standards of Care and the 2024 International Society for Pediatric and Adolescent Diabetes (ISPAD) guidelines. Participants in all study groups underwent assessment of titres of five types of specific autoantibodies: glutamic acid decarboxylase autoantibodies (GADA), insulin autoantibodies (IAA), islet cell antibodies (ICA), insulinoma-associated antigen-2 autoantibodies (IA-2A), and zinc transporter 8 autoantibodies (ZnT8A). The presence of at least two T1DM-associated autoantibodies in the absence of abnormalities in carbohydrate metabolism constituted the principal diagnostic criterion for stage 1 T1DM. The presence of at least one T1DM-associated autoantibody in conjunction with dysglycaemia or hyperglycaemia served as the diagnostic criterion for stage 2 and stage 3 T1DM, respectively. Dysglycaemia at stage 2 was defined in accordance with the ADA 2025 and ISPAD 2024 criteria as follows: fasting plasma glucose 5.6-6.9 mmol/L; 2-hour plasma glucose during an oral glucose tolerance test (OGTT) 7.8-11.0 mmol/L; glycated haemoglobin (HbA1c) 5.7-6.4%; or an increase in HbA1c of ≥10% relative to the previous measurement. Hyperglycaemia at stage 3 was confirmed by a random plasma glucose concentration or 2-hour plasma glucose during an OGTT of ≥11.1 mmol/L, HbA1c ≥6.5% (≥48 mmol/mol), or fasting plasma glucose ≥7.0 mmol/L. Patients with T1DM had no concomitant autoimmune diseases and, accordingly, were not receiving treatment for any coexisting autoimmune condition. Exclusion criteria comprised a history of diabetes mellitus of another type, including maturity-onset diabetes of the young (MODY), other autoimmune diseases, acute or chronic pancreatitis, acute illness or exacerbation of a chronic disease at the time of study enrolment, infectious diseases, vaccination within 6 months prior to study inclusion, and pregnancy.
The healthy volunteer group comprised age-matched individuals with no history of type 1 or type 2 diabetes mellitus, other disorders of carbohydrate metabolism, autoimmune diseases, or acute inflammatory conditions, and with normal glycaemic parameters at the time of enrolment.
The study was observational, cross-sectional, and conducted at a single centre. The study protocol was approved by the Local Ethics Committee of the Endocrinology Research Centre, protocol extract No. 18 dated 12 October 2022. All participants provided written informed consent prior to inclusion in the study.
Sample Preparation for Flow Cytometry
Flow cytometric analysis was performed using freshly collected peripheral blood. Blood samples were obtained by venepuncture of the median cubital vein (v. mediana cubiti) into tubes containing ethylenediaminetetraacetic acid (EDTA) as an anticoagulant. Immunostaining with antibody mixtures was performed prior to erythrocyte lysis on the day of blood collection and no later than 3 hours after venepuncture. Cell viability exceeded 99% in all samples. Blood from each participant was stained with antibody mixtures arranged into several flow cytometry panels (Supplementary Materials and Methods, Figure S1–S4).
Flow Cytometry
The antibodies, fluorochromes, manufacturers, catalogue numbers, and dilutions used for flow cytometric analysis are listed in Table S1. Samples were acquired using a BD LSRFortessa flow cytometer (BD Biosciences, USA) equipped with five lasers operating at 355, 405, 488, 561, and 640 nm. Acquisition was performed at a flow rate not exceeding 2,000 events per second. All events were recorded, with a minimum of 10,000 events acquired within the CD3-CD19- natural killer (NK) cell gate. Data were analysed using FlowJo software version 10.0 (BD Biosciences, San Diego, CA, USA). The gating strategy is presented in the Supplementary Materials (Figure S1–S4).
Statistical Analysis
Statistical analyses were performed in Python 3.10.2 using the statsmodels 0.14.5, SciPy 1.16.1, and pandas 2.2.3 libraries. Graphical histograms were prepared using GraphPad Prism version 8.0 (GraphPad Software, San Diego, CA, USA). Between-group differences were assessed using Student's t-test for parametrically distributed continuous variables and the Mann-Whitney U test for non-parametrically distributed data in two independent groups. Differences were considered statistically significant at p<0.05. Correlation analysis was performed using Spearman's rank correlation coefficient for non-parametrically distributed data and Pearson's correlation coefficient for parametrically distributed data. Associations were considered statistically significant at a p-value ≤0.05.
3. Results
Baseline Characteristics of the Study Participants
The study included children younger than 18 years of age (n=140) and adults aged 18-55 years (n=105). Given the age-dependent changes occurring within the immune system, the paediatric cohort was further stratified into three age groups: group 1, 1-9 years; group 2, 9-14 years; and group 3, 14-18 years. Several considerations underpinned this age-based stratification. In early-onset T1DM, seroconversion to disease-associated autoantibodies is known to occur sequentially and, in many cases, within relatively characteristic age windows, although the precise timing varies between paediatric cohorts. According to the Finnish Type 1 Diabetes Prediction and Prevention (DIPP) study, the peak incidence of insulin autoantibody appearance occurs between 2 and 3 years of age, whereas GADA most commonly emerge between 3 and 5 years of age [21]. In addition, age at disease onset is a recognised risk factor for T1DM progression. In The TrialNet Pathway to Prevention (TNPTP) study, the median age of individuals progressing from stage 1 to stage 3 T1DM within less than 5 years was 11.6 years, compared with 17 years among those who developed clinical T1DM over a period exceeding 5 years [22]. We therefore defined a pubertal group aged 9-14 years, a post-pubertal group aged 14-18 years, and a pre-pubertal group aged 1-9 years. Unfortunately, further subdivision of the pre-pubertal cohort into groups aged 1-4 and 4-9 years was not feasible because of the limited number of participants aged 1-4 years among both healthy volunteers and children with stage 1-2 T1DM.
The demographic, clinical and laboratory characteristics of the paediatric and adult study cohorts, including their immunological profiles of DAAs, are presented in Table 1, Table S2 and Table S3. The median of age of the overall group of children and adults with clinically manifest diabetes, corresponding to stage 3 T1DM, appeared significantly lower than that of healthy controls. As expected, the study groups differed in HbA1c levels and in the spectrum of autoantibodies, including GADA, IA-2A and ZnT8A, consistent with the autoimmune nature of the disease. Children and adults with stage 3 T1DM exhibited, as expected, significantly higher HbA1c levels than their respective control groups, with p<0.0001. No increase in HbA1c was observed in children with stage 1-2 T1DM compared with age-matched healthy controls. Among children with stage 3 T1DM, plasma glucose levels correlated positively with HbA1c (r=0.5233, p=0.0013) and inversely with C-peptide concentrations (r=-0.3425, p=0.0474), as shown in Figure 1A. In adults with stage 3 T1DM, HbA1c levels correlated positively with plasma glucose concentrations (r=0.4713, p=0.0003), whereas C-peptide concentrations showed a strong positive correlation with insulin levels (r=0.8576, p<0.0001), as shown in Figure 1B.
Among adults with stage 3 T1DM and a disease duration of less than 1 year, the presence of DKA at diagnosis was associated with a younger age: 22 [19; 28] versus 30 [21; 36] years (p=0.020). Patients with DKA also exhibited lower C-peptide concentrations: 0.83 [0.69; 1.14] versus 1.20 [0.94; 1.78] ng/mL (p=0.031). No statistically significant between-group differences were observed in diabetes duration, glucose or HbA1c levels, or GAD, IAA, ICA, and IA-2 autoantibodies. Among children with stage 3 T1DM, no significant differences were identified between the DKA and non-DKA subgroups, with the exception of a longer duration of the clinical stage in children with DKA: 7.5 [4.75; 10.25] versus 2 [1; 7] months, respectively (p=0.0047) (Table S2).
In children with stage 1-2 and stage 3 T1DM, no significant changes were observed in IAA or ICA levels, whereas concentrations of GADA, IA-2A and ZnT8A were increased compared with the control group (Table 1). No statistically significant differences in autoantibody levels were identified between the DKA and non-DKA subgroups in either children or adults. Among adults, the DKA group exhibited higher ZnT8A levels than the non-DKA group: 354.59 [18.71; 2000.00] versus 9.22 [4.48; 343.19], respectively (p=0.012).
Likewise, no significant differences in autoantibody levels were observed between the paediatric age subgroups within the same stage of T1DM (Table S2), although a trend towards lower levels of GADA, IA-2A and ZnT8A was apparent in the 14-18-year age group compared with younger children (Figure 1C). Although autoantibody levels tended to decline with disease progression, eventually approaching values observed in healthy individuals among patients with long-standing T1DM, no statistically significant differences were detected between stages 1-2 and 3 within the corresponding age groups (Table S2). Notably, in the youngest age group (1-9 years), the highest levels were observed for IA-2A and GADA, whereas ZnT8A levels became more prominent in the older age groups. Across the entire paediatric cohort aged 1-18 years, all three autoantibodies were elevated, with IA-2A and ZnT8A predominating at both stages 1-2 and 3. In the adult cohort with stage 3 T1DM, GADA and ZnT8A were quantitatively predominant.
Within the youngest paediatric subgroup aged 1-9 years at stage 1-2 T1DM, GADA and IA-2A were the most frequently detected autoantibodies, being present in 75% and 80% of participants, respectively, whereas in the oldest paediatric group ZnT8A was the most prevalent, being detected in 60% of cases (Figure 1D, Table S3). Among adults with stage 1-2 T1DM, GADA and ZnT8A were likewise the most frequently detected autoantibodies, being present in 100% and 80% of participants, respectively. A similar distribution was retained at the onset of stage 3 T1DM. Approximately 35.5% of children at stage 1-2 T1DM and 25.6% of adults were positive for all three autoantibodies, with this proportion decreasing by stage 3. Among adults at stage 3 T1DM, approximately 21% were seronegative (Figure 1E, Table S3). In both paediatric and adult cohorts at stages 1-2 and 3, some individuals were positive for only a single autoantibody, either GADA or IA-2A. Isolated ZnT8A positivity was not observed. The proportion of children positive for all three autoantibodies was higher at stage 1-2 T1DM and declined from 22.5% to 2% by stage 3. In contrast, among adults with stage 3 T1DM, triple-autoantibody positivity remained relatively frequent, being observed in 34.9% of participants (Figure 1F, Table S3).
Alterations in the Frequencies of B- and T-Lymphocyte Subsets, Including CD4+ and CD8+ T Cells, in Patients with T1DM: A Multiple-Autoantibody, High-Titre T1DM Endotype Is Associated with Reduced B-Cell Frequencies in Children and Adults, Reduced CD8+ T-Cell Frequencies with Concomitant Increase in CD4+ T-Cell Frequencies in Children
Flow cytometry and three multicolour antibody panels were used to identify and quantify the frequencies of the major lymphocyte subpopulations in whole blood (Supplementary Materials and Methods, Table S1).
B lymphocytes accumulating within the pancreas of patients with T1DM may play a critical role in disease pathogenesis by acting as antigen-presenting cells. In peripheral blood, we observed an increase in the frequency of B cells at the clinical stage of T1DM compared with the control group in participants aged 9-14 years (p=0.0181) and across the entire paediatric cohort aged 1-18 years (p=0.0017), as well as compared with stage 1-2 T1DM in the 9-14-year age group (p=0.0223) (Figure 2A). Of particular interest, progression of T1DM was accompanied by a subsequent decline in B-cell frequency in patients with long-standing disease compared with those with clinically manifest T1DM of less than one year in duration. A significant reduction was observed in the 9-14-year age group (p=0.0044) and in the overall paediatric cohort aged 1-18 years (p=0.0114). No T1DM-associated alterations in B-cell frequency were detected in adults.
Given the anticipated heterogeneity of the T1DM population, and in order to investigate potential associations between elevated autoantibody levels and immune-cell subpopulations, patients were further stratified into several subgroups: (1) according to the absence or presence of one or multiple autoantibodies; (2) according to autoantibody titre, classified as low, intermediate or high among patients positive for a given autoantibody (GADA, IA-2A or ZnT8A); and (3) according to the presence of at least two distinct autoantibodies with absent, intermediate or high quantitative levels (Table S3). Notably, this stratification revealed several significant differences. Among adults with stage 3 T1DM, seronegative patients had a significantly higher proportion of B cells (16.8% [11.0; 18.2]) than patients positive for one autoantibody (9.0% [8.0; 11.3], p=0.0340) or three autoantibodies (9.9% [8.5; 11.4], p=0.0226) (Figure 2A1). Likewise, when adult patients were stratified according to the absence or different quantitative levels of GADA, the proportion of B cells was reduced in GADA-positive patients with low (8.9% [8.0; 9.8], p=0.0224) and intermediate GADA levels (9.8% [7.9; 11.9], p=0.0430) compared with GADA-negative patients, in whom B cells accounted for 12.3% [9.7; 17.2] (Figure 2A2). A similar pattern was observed in children with stage 1-2 T1DM when stratified according to the absence or different quantitative levels of ZnT8A. The proportion of B cells decreased to 15.6% [13.8; 17.7] in ZnT8A-positive children with intermediate ZnT8A levels (p=0.0117), compared with 18.8% [15.9; 24.0] in ZnT8A-negative patients, and declined further to 11.8% [10.8; 13.1] in those with high ZnT8A levels (p=0.0062) (Figure 2A3).
With regard to T cells, no significant alterations in their frequency were observed in patients with stage 1-2 or clinically manifest T1DM compared with healthy controls. Long-standing T1DM, however, was associated with an increased proportion of T cells. Significant differences were detected between healthy children and those with long-standing T1DM in the overall 1-18-year cohort (p=0.0015), as well as between children with stage 3 T1DM of less than one year in duration and those with long-standing disease (p=0.0054) (Figure 2B). Analysis of T cells in adults with stage 3 T1DM stratified according to the absence or multiplicity of autoantibody positivity demonstrated a lower proportion of T cells in patients positive for three autoantibodies than in those positive for a single autoantibody: 71.8% [68.1; 73.9] versus 77.8% [75.4; 80.1], respectively (p=0.0068) (Figure 2B1). When patients were stratified according to the absence or different quantitative levels of GADA, an increased proportion of T cells was observed in the group with low GADA levels compared with GADA-negative patients: 79.0% [77.1; 79.6] versus 70.8% [66.1; 77.3], respectively (p=0.0240) (Figure 2B2).
Cytotoxic CD8+ T cells, which are recognised as the principal effector population directly involved in pancreatic β-cell destruction, showed a significant reduction compared with healthy controls across all stages of T1DM, including long-standing disease, but only in the youngest paediatric age group of 1-9 years (Table S4, Figure 3A). No alterations in the proportion of CD8+ T cells were observed in the adult T1DM cohort, in agreement with our previous findings. Analysis of CD8+ T cells in adults with stage 3 T1DM stratified according to the absence or multiplicity of autoantibody positivity revealed a pattern similar to that described above for the total T-cell population. Specifically, the proportion of CD8+ T cells was reduced in patients positive for three autoantibodies compared with those positive for a single autoantibody: 24.2% [22.1; 27.6] versus 28.7% [26.4; 31.8], respectively (p=0.0485) (Figure 3A1). When patients were stratified according to the absence or different quantitative levels of GADA, the proportion of CD8+ T cells was higher in the low-GADA group than in the intermediate-GADA group: 29.4% [27.2; 36.1] versus 26.1% [23.6; 28.9], respectively (p=0.0393) (Figure 3A2). In children with stage 3 T1DM, the relationship between CD8+ T-cell frequency and GADA levels appeared more linear, with a progressive reduction in CD8+ T cells accompanying increasing GADA levels. The proportion of CD8+ T cells was 36.2% [30.4; 39.3] in GADA-negative children and 25.7% [23.6; 28.9] in those with high GADA levels (p=0.0332) (Figure 3A3).
The proportion of CD4+ T cells was significantly increased in children aged 1-9 years with clinically manifest T1DM (p=0.0261) and in those with long-standing disease compared with healthy controls in both the 1-9-year (p=0.0136) and overall 1-18-year (p=0.0274) age groups. CD4+ T-cell frequencies were also increased compared with children with stage 1-2 T1DM in the 1-9-year group (p=0.0095) (Table S4, Figure 3B). In adults, no alterations in CD4+ T-cell frequencies were detected either in the overall T1DM cohort compared with healthy controls or among T1DM subgroups stratified according to autoantibody levels. In contrast, among children with stage 3 T1DM, increasing GADA levels were associated with an increased proportion of CD4+ T cells; 36.5% [32.0; 40.0] in GADA-negative children and 49.2% [46.0; 50.9] in those with high GADA levels (p=0.0083) (Figure 3B1). Similarly, in children with stage 1-2 T1DM, higher IA-2A levels were associated with an increased proportion of CD4+ T cells: 60.6% [57.7; 62.3] in the group with the highest IA-2A levels compared with 49.1% [44.3; 55.1] in those with intermediate IA-2A levels (p=0.0149) (Figure 3B2).
Analysis of T-cell activation markers, including CD38 and HLA-DR, demonstrated an increased frequency of CD3+CD38+ T cells (p=0.0305), CD4+HLA-DR+CD38+ T cells (p=0.0039), and CD8+HLA-DR-CD38+ T cells (p=0.0330) in the overall paediatric cohort aged 1-18 years compared with healthy controls (Table S4). Importantly, no comparable perturbations in T-cell activation were observed in the adult T1DM cohort. When patients were stratified according to DAA profiles, children at the preclinical stages of T1DM exhibited an increased proportion of CD8+HLA-DR-CD38+ T cells in the presence of intermediate GADA titres compared with the GADA-negative subgroup: 66.0% [58.6; 71.0] versus 53.2% [48.2; 61.2], respectively (p=0.0374) (Table S4, Figure 3A4). Further supporting the particular importance of autoreactive T-cell responses in paediatric T1DM, stage 3 disease was characterised by inverse correlations between C-peptide levels and CD4+ T cells (r=-0.4352, p=0.0080) (Figure 3B3), activated CD3+CD38+ T cells (r=-0.5869, p=0.0003) (Figure 2B3), CD4+HLA-DR-CD38+ T cells (r=-0.6155, p=0.0001) (Figure 3B4), and CD8+CD38+ T cells (r=-0.4298, p=0.0089) (Figure 3A5). At the preclinical stage, an inverse correlation was also observed between CD4+CD38+ T cells and C-peptide (r=-0.3990, p=0.0290). No comparable correlations were identified in adults with T1DM.
Reduction in the Overall NK-Cell Population in Children and Adults with stage 3 T1DM, Associated with Seronegative Patients
Although CD8+ T cells are considered the principal aggressive effector population responsible for the destruction of insulin-producing β-cells, natural killer (NK) cells also appear to play an important role in the progression and maintenance of autoimmune inflammation. Several studies have suggested that NK cells may participate at multiple stages of T1DM immunopathogenesis [15,23] and have demonstrated their involvement in the initiation of pancreatic insulitis [24].
At stage 3 T1DM, we observed a reduction in NK-cell frequency in both the overall paediatric cohort aged 1-18 years (p=0.0031) and the adult cohort aged 18-55 years (p=0.0284) (Figure 4A). The potential relevance of NK cells to residual β-cell function was further supported by a positive correlation between NK-cell frequency and C-peptide levels in children with T1DM (r=0.4844, p=0.0329) (Figure 4A4). Interestingly, although no differences in NK-cell frequency were observed between healthy controls and patients with stage 1-2 T1DM, a significant decline in NK cells was evident between autoantibody-positive individuals with stage 1-2 disease and those with stage 3 T1DM. This difference was observed in children aged 1-9 years (p=0.0018) and across the entire paediatric cohort aged 1-18 years (p=0.0012). Long-standing T1DM was likewise associated with a significant reduction in NK-cell frequency compared with healthy controls in the 1-18-year cohort (p=0.0054), as well as compared with stage 1-2 T1DM, with significant differences observed in the 14-18-year (p=0.0140) and overall 1-18-year (p=0.0026) groups (Figure 4A).
Stratification according to autoantibody profiles revealed further differences. Seronegative adults had the lowest proportion of NK cells, at 10.5% [8.7; 14.9], compared with 17.0% [14.5; 21.2] in patients positive for three autoantibodies (p=0.0062) (Figure 4A1). Similarly, when both paediatric and adult patients were stratified according to the absence or presence of different IA-2A titres, the lowest NK-cell frequencies were observed in IA-2A-negative individuals (Figure 4A2–A3).
Analysis of NK-cell subpopulations based on the expression of CD16 and CD56, which distinguishes NK-cell subsets according to their maturation status and functional properties, revealed an increase in the regulatory CD56brightCD16- NK-cell population (NKregs) in children aged 1-9 years at both stage 1-2 (p=0.0224) and stage 3 T1DM (p=0.0136), as well as in the overall paediatric cohort aged 1-18 years at stage 3 T1DM (p=0.0201) (Table S4, Figure 4B). Interestingly, long-standing T1DM was associated with a reduction in the proportion of NKregs. Significant differences were observed in children aged 9-14 years between those with recently manifested stage 3 T1DM and those with long-standing disease (p=0.0044), as well as in the overall paediatric cohort (p=0.0014). The proportion of this NK-cell subset was also reduced in children with long-standing T1DM compared with autoantibody-positive individuals with stage 1-2 disease in the 1-18-year group (p=0.0071). Paediatric T1DM was also accompanied by an increase in another intermediate CD56bright NK-cell subset, namely CD56brightCD16dim NK cells. In children aged 1-9 years, this population was increased in stage 3 T1DM compared with healthy controls (p=0.0031), in stage 3 compared with stage 1-2 T1DM (p=0.0003), in long-standing T1DM compared with healthy controls (p=0.0167), and in long-standing stage 3 T1DM compared with stage 1-2 disease (p=0.0293). Similar differences were observed in the overall paediatric cohort aged 1-18 years, with an increase in stage 3 T1DM compared with healthy controls (p=0.0022), in long-standing T1DM compared with healthy controls (p=0.0323), and in long-standing stage 3 T1DM compared with stage 1-2 disease (p=0.0082) (Table S4, Figure 4C). When both CD56bright subsets were considered together, an almost two-fold increase in the overall CD56brightCD16-/dim/+ NK-cell population was observed in children aged 1-18 years with stage 3 T1DM compared with healthy controls: 5.8% [4.0; 7.0] versus 3.2% [1.9; 5.5], respectively (p=0.0066) (Table S4). A similar increase was evident compared with autoantibody-positive individuals with stage 1-2 T1DM: 5.8% [4.0; 7.0] versus 3.8% [2.8; 4.6], respectively (p=0.0024) (Table S4).
Importantly, no significant alterations in the proportions of CD56bright NK-cell subsets were detected in the adult cohort as a whole. However, stratification according to autoantibody profiles revealed a reduction in NKregs, as well as in the total CD56bright NK-cell population, among adults with intermediate IA-2A levels compared with IA-2A-negative patients: 1.7% [0.7; 2.6] versus 0.9% [0.5; 1.4], respectively (p=0.0260) (Figure 4B1,B2). In addition, the proportion of CD56brightCD16dim NK cells was lower in adults with multiple autoantibodies than in seronegative patients: 1.5% [0.9; 3.1] versus 4.2% [2.7; 5.3], respectively (p=0.0062) (Figure 4C1). A similar reduction was observed in adults with elevated ZnT8A levels compared with ZnT8A-negative individuals: 2.5% [1.2; 3.2] versus 4.0% [2.4; 5.2], respectively (p=0.0420) (Figure 4C2). Among children with stage 1-2 T1DM, those with a ZnT8A-negative profile exhibited a higher proportion of regulatory CD56brightCD16- NK cells than ZnT8A-positive children with high antibody titres: 1.7% [1.3; 1.9] versus 0.6% [0.5; 1.2], respectively (p=0.0434). The same pattern was observed for intermediate CD56brightCD16dim NK cells (p=0.0117) and for the total CD56bright NK-cell population (p=0.0434).
Distinct patterns were observed in the principal effector CD56dimCD16bright NK-cell subset. In the adult cohort, the proportion of these cells was reduced in patients with stage 3 T1DM compared with healthy donors (p=0.0026). In contrast, among children, a significant increase in this NK-cell subset was observed in long-standing stage 3 T1DM compared with healthy controls aged 1-9 years (p=0.0330) and 1-18 years (p=0.0016), compared with autoantibody-positive individuals aged 1-9 years (p=0.0276) and 1-18 years (p=0.0009), and compared with patients with recently manifested stage 3 T1DM (p=0.0157) (Table S4, Figure 4D). When subgroups were analysed according to autoantibody profiles, the adult cohort showed a pattern similar to that observed for the total NK-cell population. The proportion of NKeff was lower in seronegative patients, at 79.3% [78.2; 83.0], compared with 85.7% [82.8; 90.2] in patients positive for three autoantibodies (p=0.0420) (Figure 4D1). A reduction was also observed in IA-2A-negative adults, in whom these cells accounted for 81.2% [78.5; 85.5], compared with IA-2A-positive patients with intermediate antibody levels (p=0.0086) (Figure 4D2).
In the paediatric cohort with stage 3 T1DM, in which only groups positive for one or two autoantibodies could be compared, the opposite pattern was observed. Children positive for a single autoantibody had a higher proportion of NKeff cells than those positive for two autoantibodies: 83.2% [81.8; 84.5] versus 80.7% [76.9; 81.2], respectively (p=0.0303) (Figure 4D3). A similar trend was evident for GADA, with GADA-negative children exhibiting a higher proportion of NKeff cells than GADA-positive children with stage 3 T1DM: 81.2% [80.2; 83.2] versus 75.8% [70.8; 80.2], respectively (p=0.0349). By contrast, at stage 1-2 T1DM, ZnT8A-negative children exhibited a lower proportion of NKeff cells than ZnT8A-positive children with stage 3 T1DM: 75.7% [72.0; 77.5] versus 79.4% [77.5; 85.6], respectively (p=0.0207).
A divergent pattern was observed for the CD56-CD16bright NK-cell subset, with an increase in adults and a decrease in children (Table S4). In adults, the proportion of these cells was increased in stage 3 T1DM compared with healthy controls (p=0.0163). In children, by contrast, this subset was reduced in stage 3 T1DM compared with healthy controls in the 1-9-year (p=0.0018) and 1-18-year (p=0.0124) age groups, as well as compared with the autoantibody-positive stage 1-2 group in the 9-14-year (p=0.0054) and 1-18-year (p=0.0042) age groups. Longer disease duration was likewise associated with a reduced proportion of CD56-CD16bright NK cells in children, with significant differences observed compared with healthy controls aged 1-9 years (p=0.0012) and 1-18 years (p=0.0002).
The minor and rarely investigated immature CD56-CD16- NK-cell subset was increased in adults with stage 3 T1DM compared with healthy controls (p=0.0460) (Table S4). In children, however, the proportion of these cells declined with disease progression and longer disease duration. Significant reductions were observed compared with healthy controls aged 1-9 years (p=0.0068) and 1-18 years (p=0.0009), as well as compared with autoantibody-positive individuals aged 1-9 years (p=0.0003) and 1-18 years (p<0.0001). The proportion of CD56-CD16- NK cells was also lower in stage 3 T1DM than in the autoantibody-positive stage 1-2 group among children aged 1-9 years (p=0.0048) and 1-18 years (p=0.0042). Another immature subset, CD56dimCD16- NK cells, was reduced in children with stage 3 T1DM compared with healthy controls (p=0.0281), and was also lower in children aged 1-18 years with long-standing T1DM than in autoantibody-positive individuals with stage 1-2 disease (p=0.0094) (Table S4).
Increased Frequencies of CD8+ NK, CD8+CD38+ NK, CD8+CD161+ NK, and CD8+NKG2A+ NK-Cell Subsets in Adults with Newly Diagnosed T1DM and Their Association with Multiple DAAs in Children and Adults
We next focused on markers reflecting the functional properties of the NK-cell populations under investigation. NK cells constitute a highly heterogeneous lymphocyte population. Unlike B and T cells, whose diversity is generated through somatic recombination of B-cell and T-cell receptor genes, NK-cell heterogeneity is largely determined by distinct combinations of activating and inhibitory receptors expressed on the cell surface and recognising ligands on different target-cell populations. Based on the co-expression of the CD8 and CD38 co-receptors, NK cells can be further subdivided into distinct subsets. We observed an increased proportion of CD8+ NK cells in adults with stage 3 T1DM (p=0.0036) (Table S4, Figure 5A). In children, however, no overall increase in CD8+ NK cells was detected. Although a trend towards higher frequencies was apparent in the 14-18-year age group, together with a modest non-significant increase in individuals with preclinical T1DM, significant reductions were observed in children aged 1-9 years in patients with newly diagnosed stage 3 T1DM (p=0.0035) and with long-standing disease (p=0.0125) compared with individuals at preclinical stage. A similar reduction was observed in the 9-14-year age group between individuals at preclinical stage and patients with long-standing stage 3 T1DM (p=0.0016). When all children aged 1-18 years were analysed together, differences between healthy controls and patients at the onset of stage 3 T1DM were no longer apparent, whereas a reduction in CD8+ NK cells remained evident between patients at stage 1-2 and those with long-standing T1DM (p=0.0051) (Table S4, Figure 5A).
Comparative analysis of NK-cell subsets based on CD8 and CD38 co-expression revealed an increased proportion of CD8+CD38+ NK cells in adults aged 18-55 years with stage 3 T1DM compared with healthy volunteers (p=0.0130) (Figure 5B). In children aged 1-18 years, an increased proportion of CD8+CD38+ NK cells was observed at the preclinical stage (p=0.0217). Moreover, among children with stage 3 T1DM, those positive for two DAAs exhibited a higher proportion of this subset than those positive for a single DAA: 32.3% [30.3; 46.0] versus 23.8% [22.4; 26.6], respectively (p=0.0330) (Figure 5B1).
No significant differences in the overall proportion of CD38+ NK cells were observed between healthy controls and the different stages of T1DM in either children or adults. However, stratification according to DAA profiles revealed several notable differences. Adults with stage 3 T1DM and multiple circulating DAAs exhibited a higher proportion of CD38+ NK cells than seronegative patients: 89.8% [86.4; 91.0] versus 85.2% [82.3; 86.8], respectively (p=0.0402) (Figure 5B2). Likewise, children with stage 1-2 T1DM and high ZnT8A titres had a higher proportion of CD38+ NK cells than ZnT8A-negative children: 91.4% [89.5; 92.9] versus 87.0% [84.8; 88.4], respectively (p=0.0294) (Figure 5B3). Children positive for two or more DAA at intermediate or high levels also exhibited an increased proportion of CD38+ NK cells compared with those without DAA: 93.1% [92.5; 95.7] versus 88.2% [84.8; 89.3], respectively (p=0.0257).
The regulatory CD56brightCD16-CD38+ NK-cell population may inhibit the proliferation of autologous CD4+ T cells through CD38-mediated generation of extracellular adenosine (ADO) [25]. However, owing to their capacity to produce a broad range of other cytokines, these cells may also inhibit the differentiation of regulatory T cells from CD4+ T cells and, conversely, promote the proliferation of autologous T cells, as previously demonstrated in rheumatoid arthritis [26]. We therefore sought to assess changes in the frequency of this population in T1DM by identifying all CD56brightCD16- NKreg cells on CD8/CD38 dot plots (Figure S1, D2-1). The proportion of CD56brightCD16-CD38+ NK cells was increased in children with stage 1-2 T1DM compared with age-matched healthy controls, both in the 9-14-year group (p=0.0389) and in the overall paediatric cohort aged 1-18 years (p=0.0448). Their frequency subsequently declined towards control levels at stage 3 T1DM compared with stage 1-2 disease in children aged 9-14 years (p=0.0383), 14-18 years (p=0.0167), and 1-18 years (p=0.0089) (Table S4). No significant between-group differences in the frequency of CD56brightCD16-CD38+ NK cells were observed in adults.
Another CD8-positive NK-cell subset, CD8+NKG2A+ NK cells, was likewise increased in adults at the onset of T1DM compared with healthy controls (p=0.0103) and individuals at the preclinical stage (p=0.0064). In the paediatric cohort aged 14-18 years, this NK-cell subset was also increased at stage 3 T1DM compared with stage 1-2 disease (p=0.0334) (Table S4, Figure 5C). GADA-negative adults exhibited a higher proportion of CD8+NKG2A+ NK cells than GADA-positive adults with low GADA titres: 26.5% [16.1; 29.9] versus 8.9% [4.6; 16.1], respectively (p=0.0288) (Table S4, Figure 5C1). The total CD8+ NK-cell population identified on the CD8/NKG2A dot plot was also increased in adults with stage 3 T1DM compared with healthy volunteers (p=0.0142) (Table S4). In contrast, among children, the proportion of CD8+ NK cells was reduced at stage 3 T1DM compared with stage 1-2 disease in both the 1-9-year (p=0.0412) and overall 1-18-year (p=0.0062) age groups (Table S4).
The onset of T1DM in adults was also accompanied by an increased proportion of CD8+CD161+ NK cells compared with healthy controls (p=0.0042), whereas no significant alterations in this population were detected in the paediatric groups (Table S4, Figure 5D). Conversely, CD8-CD161+ NK cells were reduced in adults with newly diagnosed T1DM compared with healthy controls (p=0.0165), while this population was increased in children aged 1-18 years (p=0.0397) (Table S4, Figure 5E). Interestingly, children with stage 1-2 T1DM exhibited a lower proportion of CD8-CD161+ NK cells than those at the onset of stage 3 T1DM in the 9-14-year (p=0.0369), 14-18-year (p=0.0485), and overall 1-18-year (p=0.0079) age groups. The total CD8+ NK-cell population identified on the CD8/CD161 dot plot was likewise increased in adults with stage 3 T1DM compared with healthy volunteers (p=0.0053) (Table S4). Importantly, stratification according to autoantibody profiles demonstrated that increases in both CD8+ NK cells and CD8+CD161+ NK cells were particularly evident in seronegative adults with stage 3 T1DM compared with patients positive for three DAAs: 51.0% [43.7; 59.9] versus 30.9% [21.2; 45.6], respectively (p=0.0373) for CD8+ NK cells (Figure 5A1), and 44.6% [41.3; 58.1] versus 22.4% [12.0; 41.6], respectively (p=0.0454) for CD8+CD161+ NK cells (Figure 5D1). The proportion of CD161+ NK cells was also higher in individuals positive for a single DAA than in those positive for three autoantibodies: 95.4% [90.8; 97.5] versus 81.1% [48.9; 88.4], respectively (p=0.0247). IA-2A-negative adults exhibited a higher proportion of CD8+ NK cells than IA-2A-positive adults with intermediate IA-2A titres: 48.6% [42.0; 56.9] versus 35.1% [25.6; 49.3], respectively (p=0.0339). Among children with stage 3 T1DM, GADA-negative patients had a higher proportion of CD8+CD161+ NK cells than GADA-positive patients with intermediate GADA titres: 27.4% [21.1; 38.4] versus 18.2% [15.1; 25.2], respectively (p=0.0424).
Comparable Levels of IFNγ and TNFα Secretion by CD8+ NK Cells in Patients with T1DM and Healthy Volunteers
Given the increased frequency of CD8+ NK-cell subsets observed in the adult T1DM cohort, we next compared the cytotoxic activity of CD8+ and CD8neg NK-cell populations by assessing secretion of interferon gamma (IFNγ) and tumour necrosis factor alpha (TNFα). However, no differences in cytokine expression were detected between CD8+ and CD8neg NK-cell populations. Moreover, neither IFNγ nor TNFα expression differed in CD8+ or CD8neg NK-cell subsets between patients with T1DM and healthy volunteers (Table S5). Likewise, no differences were observed in the simultaneous expression of IFNγ and TNFα by polyfunctional CD8+ NK and CD8- NK cells between patients with T1DM and healthy controls.
Reciprocal Changes of Cytotoxic Potential of CD8+ T Cells and NK Cells in Children with Long-Standing T1DM
An increased proportion of perforin-containing CD8+ T cells was observed in children with long-standing T1DM in the 9-14-year (p=0.0303), 14-18-year (p=0.0444), and overall 1-18-year (p=0.0008) age groups compared with age-matched healthy controls. The proportion of these cells was also increased compared with the preclinical stage of T1DM in children aged 1-9 years (p=0.0299) and in the overall paediatric cohort aged 1-18 years (p=0.0003), as well as compared with early clinical manifestation in the 14-18-year group (p=0.0444) and in the overall 1-18-year cohort (p=0.0020) (Table S4, Figure 6A). Granzyme B-containing CD8+ T cells were reduced at T1DM onset in the 1-9-year (p=0.0315) and 1-18-year (p=0.0350) groups. However, with disease progression and longer T1DM duration, the proportion of granzyme B-containing CD8+ T cells increased compared with both the preclinical stage (p=0.0299) and the early clinical stage (p=0.0020) in children aged 1-18 years (Table S4, Figure 6B).
In contrast, CD16+ and CD56+ NK cells showed a reduction in perforin-related cytotoxic potential in children aged 1-18 years with long-standing T1DM. For CD16+ NK cells, the proportion of perforin-containing cells was reduced compared with healthy controls (p=0.0021), the preclinical stage (p=0.0002), and the clinical stage of T1DM (p=0.0153). A reduction in perforin-containing CD56+ NK cells was likewise observed in long-standing T1DM compared with healthy donors (p=0.0014) and patients at the preclinical stage (p=0.0002). In addition, the proportion of perforin-containing CD56+ NK cells was reduced at T1DM onset compared with both healthy controls (p<0.0001) and patients at the preclinical stages of disease (p<0.0001) (Table S4, Figure 6C,D). No significant differences in granzyme-related cytotoxic potential were observed for CD16+ or CD56+ NK cells in children with long-standing T1DM (Table S4). The present study did not include a group of adults with long-standing disease, and no differences in perforin- or granzyme-related cytotoxic potential were detected between adults at the preclinical and clinical stages of T1DM.
It is of note that CD8+ NK cells exhibited increased perforin- and granzyme-associated cytotoxic potential in children with long-standing T1DM. In the overall paediatric cohort aged 1-18 years, the proportion of perforin-containing CD8+ NK cells differed significantly compared with healthy controls (p=0.0008), the preclinical stage (p<0.0001), and the clinical stage of T1DM (p=0.0010). Similarly, the proportion of granzyme B-containing CD8+ NK cells differed significantly compared with healthy controls (p=0.0047), the preclinical stage (p<0.0001), and the clinical stage (p=0.0086) (Table S4, Figure 6E,F).
Reduction in Circulating MAIT Cells in Children with T1DM
Gut dysbiosis and increased gastrointestinal inflammation may act as triggers for the development of autoimmune diseases, including T1DM, in genetically predisposed individuals [27,28]. Accordingly, the analysis of mucosa-associated invariant T (MAIT) cells, a specialised subset of innate-like T cells that contribute to mucosal defence against microorganisms through rapid cytokine production, is of particular relevance in T1DM.
MAIT cells, which express the invariant T-cell receptor (TCR) Vα7.2-Jα33 chain, also comprise a heterogeneous cellular population. We analysed the proportion of total CD3+ MAIT cells, as well as CD4+ MAIT, CD8+ MAIT, and CD4-CD8- double-negative (DN) MAIT-cell subsets. A reduction in CD3+ MAIT cells was observed in children with stage 3 T1DM compared with healthy controls, both in the 1-9-year age group (p<0.0001) and in the overall 1-18-year cohort (p=0.0009). Children aged 1-9 years at the preclinical stage also exhibited reduced MAIT-cell frequencies (p=0.0004) (Table S4, Figure 7A). Long-standing T1DM was associated with an even more pronounced reduction in MAIT cells in the 1-9-year group compared with age-matched healthy controls (p=0.0047). Analysis of CD4+, CD8+, and DN MAIT-cell subsets revealed similar patterns and additionally demonstrated a significant reduction in DN MAIT cells at the preclinical stage in the overall 1-18-year cohort compared with healthy controls (p=0.0470) (Table S4, Figure 7B). No consistent differences in MAIT-cell frequencies were identified across subgroups stratified according to overall autoantibody profiles. However, among children with stage 1-2 T1DM, GADA-negative patients exhibited a higher proportion of CD3+ MAIT cells than GADA-positive patients with intermediate GADA titres: 8.5% [6.3; 8.7] versus 5.7% [3.9; 8.2], respectively (p=0.0491) (Table S4, Figure 7C). This finding may point towards a potentially protective role of MAIT cells, whereby their reduction in patients with intermediate GADA titres could be associated with more rapid progression of T1DM. Further supporting a role for MAIT cells in paediatric T1DM, C-peptide levels correlated positively with both CD3+ MAIT cells (r=0.5296, p=0.0011) and CD8+ MAIT cells (r=0.4451, p=0.0074) (Figure 7D).
Diabetic Ketoacidosis
Diabetic ketoacidosis (DKA) is a severe and potentially life-threatening complication that may occur at the onset of T1DM and may reflect a more aggressive course of disease progression. Following stratification of children and adults with T1DM according to the presence or absence of DKA, several differences in the frequencies of lymphocyte subpopulations were identified. In adults, DKA was characterised by reduced frequencies of CD3-CD56+ NK cells (10.5% [7.5; 15.1] versus 16.8% [13.9; 19.9], p=0.0246), CD3-CD8+ NK cells (5.9% [4.6; 7.2] versus 9.9% [7.8; 14.6], p=0.0081), and NKeff cells (81.5% [78.4; 85.8] versus 86.6% [85.5; 86.8], p=0.0297), together with an increased proportion of NKregs (1.6% [0.9; 2.6] versus 0.5% [0.4; 1.0], p=0.0159) (Figure 7E1). Adult patients with DKA also exhibited reduced frequencies of CD161+CD8+ T cells (10.3% [8.5; 13.4] versus 15.9% [14.2; 20.2], p=0.0171), CD161+ double-negative (DN) T cells (39.4% [24.2; 50.9] versus 53.3% [41.0; 71.5], p=0.0499), and CD8+TCR Vδ2+ T cells (2.4% [1.3; 4.0] versus 6.5% [3.3; 8.3], p=0.0207) (Figure 7E2).
Because CD3-CD56+ NK cells were reduced in patients with DKA and had also been found to be reduced in seronegative patients, we further examined the distribution of DAA positivity among patients with and without a history of DKA. DKA tended to occur more frequently among individuals positive for one, two, or three DAA; however, no statistically significant increase in the degree of seropositivity was observed in association with DKA (Figure 7E3).
In children, DKA was characterised by a reduced proportion of CD56+ NKT cells (2.5% [1.4; 3.5] versus 6.2% [2.1; 11.7], p=0.0422), an increased proportion of CD4+CD8+ double-positive (DP) T cells (0.9% [0.7; 1.2] versus 0.5% [0.4; 0.7], p=0.0263), and an increased proportion of activated CD38+HLA-DR+ CD8+ T cells (5.9% [5.5; 8.6] versus 3.2% [1.6; 4.7], p=0.0292). Unexpectedly, and in contrast to the pattern observed in adults with DKA, children with DKA also exhibited an increased proportion of CD8+TCR Vδ2+ T cells (3.9% [3.3; 4.3] versus 1.9% [1.5; 2.7], p=0.0360) (Figure 7F1).
Discussion
In the present study, using multiparameter flow cytometry, we analysed the major populations of circulating lymphocytes, NK cells and their subsets, as well as innate-like T-cell populations, including MAIT and iNKT cells, across distinct groups of patients with T1DM stratified according to age, disease stage and duration, DAA profile and quantitative antibody levels, and the presence or absence of a history of DKA. We identified distinct immunophenotypes across these patient subgroups, each representing a combination of immune-cell populations associated with a particular clinical or immunological phenotype (Figure 8).
Age-Associated Immunological Heterogeneity of Peripheral Lymphocyte Subsets in Relation to T1DM Onset
The clinical course of T1DM, as well as the profile of immune cells infiltrating the pancreas, appears to correlate with age at disease onset. However, data regarding the functional activity of residual β-cells in relation to age at T1DM diagnosis remain somewhat inconsistent. The TrialNet Pathway to Prevention (TNPTP) study reported a more rapid decline in C-peptide levels among children who developed T1DM early in life [29], whereas other cohorts found no significant association with age [30]. Nevertheless, paediatric T1DM generally develops more rapidly and is more frequently accompanied by severe hyperglycaemia and DKA, whereas adult-onset T1DM tends to evolve more gradually and progress at a slower rate [31]. In addition, the proportion of circulating ZnT8₁₈₆₋₁₉₄-specific CD8+ T cells is higher in children with T1DM than in adults [32]. Autoreactive CD8+ T cells in children also harbour T-cell receptors (TCRs) recognising a broader repertoire of autoantigens, and this repertoire differs between paediatric and adult patients [2]. One potential explanation for the more aggressive course of paediatric T1DM may lie in the relative immaturity of regulatory T cells, whose numbers physiologically increase during immune-system maturation from birth to 18 years of age [33]. More efficient mechanisms of immune regulation in adults may therefore contribute to the comparatively milder course of adult-onset T1DM. In addition, the smaller mass of the immature pancreas in children, acting in parallel with an incompletely matured immune system, may predispose to more rapid β-cell destruction.
At the same time, differences in the number, type, and relative proportions of infiltrating immune cells, in proinsulin processing, in the distribution of normal and aberrantly insulin-producing islets, and in the extent of β-cell loss have led to the recognition of two paediatric T1DM endotypes and suggest that distinct aetiological mechanisms may underlie the disease. In children younger than 7 years, T1DM follows a more aggressive course. Approximately 75% of islets affected by insulitis contain high numbers of CD8+ T cells and CD20+ B cells, whereas the proportion of CD4+ T cells is relatively low. Accordingly, the CD20+ B-cell to CD4+ T-cell ratio is high [22]. In adolescents older than 12 years, the pathological pattern differs substantially: only approximately 25% of islets exhibit insulitis, and the numbers of both CD8+ T cells and CD20+ B cells are markedly lower. Although CD8+ T cells remain the predominant infiltrating population, the CD20+ B-cell to CD4+ T-cell ratio decreases to <1, accompanied by a substantial increase in CD4+ T cells.
When the relative number of circulating lymphocyte subsets was compared within the paediatric age groups, the youngest group, aged 1-9 years, exhibited a reduction in peripheral cytotoxic CD8+ T cells accompanied by an increase in CD4+ T cells. The observed decrease in the proportion of circulating CD8+ T cells, potentially reflecting their migration into the pancreas, may indicate a particularly important role for this lymphocyte population in the immunopathogenesis of early-onset T1DM developing between 1 and 9 years of age, compared with older paediatric age groups. At the same time, the inverse correlations observed between CD4+ T-cell frequencies and C-peptide levels suggest that CD4+ T cells themselves may also make a critical contribution to T1DM pathogenesis. When all children aged 1-18 years were analysed together, these age-specific differences were no longer apparent. Nevertheless, the overall paediatric cohort was characterised by increased frequencies of activated T-cell subsets, including CD3+CD38+, CD4+CD38+HLA-DR+, and CD8+CD38+HLA-DR- T cells, in contrast to the adult T1DM cohort. Collectively, these findings further emphasise the particularly prominent role of T cells in the immunopathogenesis of paediatric T1DM compared with adult-onset disease.
Nevertheless, the initiation and progression of autoimmune diseases depend upon complex interactions between the innate and adaptive arms of the immune system. Environmental factors, particularly infectious agents, may contribute substantially to disease pathogenesis and act as triggers of autoimmunity through activation of innate immune populations, including NK and NKT cells, γδ T cells, and B1 cells [34]. NK cells may influence the magnitude of autoantigen-specific immune responses either through direct destruction of target tissues and/or through immunoregulatory effects on other immune-cell populations, including dendritic cells (DCs) [35], NKT cells [36], B cells [37], and T cells [38]. NK cells have been identified within target organs in a range of autoimmune diseases, including T1DM. Their contribution to the severity of insulitis and acceleration of T1DM progression has previously been demonstrated [39]. However, HLA class I expression is generally not reduced in these patients, calling into question the extent to which direct NK-cell cytotoxicity contributes to T1DM pathogenesis and instead drawing attention to their immunoregulatory functions. Through their capacity to secrete not only pro-inflammatory mediators, including IFNγ, TNFα, granulocyte-macrophage colony-stimulating factor (GM-CSF), interleukin (IL)-1, IL-8, and the chemokines CCL3 and CCL4, but also anti-inflammatory cytokines such as IL-5, IL-10, IL-13, and transforming growth factor beta (TGF-β), NK cells function as potent immunomodulatory cells capable of either enhancing or suppressing the activity of other immune-cell populations [40]. Overall, there are multiple stages at which NK cells may modulate inflammation and influence the breakdown of immune tolerance. It therefore remains difficult to define NK cells unequivocally as either pro-diabetogenic or anti-diabetogenic, as several studies indicate that their functional role may differ between the priming and effector phases of T1DM [41,42].
Data regarding alterations in the frequency of circulating NK cells in both children and adults remain inconsistent. Some studies have reported no significant changes in the number of CD3-CD56+ NK cells at T1DM onset in children [43] or adults [44], whereas others have demonstrated clear alterations [15,45]. In the present study, we observed a T1DM-associated reduction in NK-cell frequency in both paediatric and adult cohorts. Given previous reports demonstrating that reduced circulating NK-cell numbers correlate with their infiltration into the pancreas and pancreatic lymph nodes [46], we suggest that the decline observed in peripheral blood may reflect NK-cell extravasation into affected tissues. The positive correlation between NK-cell frequency and C-peptide levels identified in our study further supports the notion that a reduction in circulating NK cells parallels deterioration of residual β-cell function. However, the distribution of NK-cell subsets defined by CD16 and CD56 expression differed markedly between children and adults. In adults, we observed a reduction in the principal effector CD56dimCD16bright NK-cell population, most likely reflecting mobilisation of this NKeff cells towards the pancreas. In children with stage 3 T1DM, by contrast, the opposite pattern was evident, with expansion of CD56dimCD16bright NKeff cells accompanied by increases in CD56brightCD16- NKregs and intermediate CD56brightCD16dim NK cells. NKregs are characterised by robust cytokine production and may exert both pro-inflammatory effects through IFNγ, TNF, and GM-CSF and anti-inflammatory effects through IL-10 and IL-13. In addition to cytokine secretion, NKregs may also display cytotoxic activity, although to a lesser extent than NKeff cells [47], and can modulate autoimmune responses by suppressing excessively activated CD4+ T cells and mature antigen-presenting dendritic cells, thereby attenuating the intensity of autoimmune inflammation [48]. As this population frequently correlates with the honeymoon phase in children, it has been proposed to exert a protective role and to represent a compensatory response aimed at restraining the autoimmune process [45]. The simultaneous expansion of NKeff and NKreg populations observed in children may therefore reflect an active compensatory NKreg response occurring in parallel with accelerated differentiation towards more mature cytotoxic NKeff cells under conditions of chronic autoimmune inflammation in T1DM [47].
Because the functional effects of NK cells are determined by the balance of multiple surface receptors, including both inhibitory and activating receptors [49], we further analysed several molecules known to be relevant to T1DM pathogenesis [43,50]. CD8+ NK-cell subsets expressing the CD8α isoform at lower levels than those observed on CD8+ T cells have been recognised since the 1990s [51]. Nevertheless, despite major advances in NK-cell biology over the past three decades, information regarding the functional significance of CD8α expression on NK cells remains limited, and the role of CD8-positive NK-cell subsets is still incompletely understood. In our previous work, we also observed an increased relative abundance of CD8-positive NK-cell subsets, including CD8+CD38+, CD8+CD161+, and CD8+NKG2A+ NK cells, in adults with newly diagnosed T1DM [15]. When comparing the cytotoxic properties of CD8+ and CD8neg NK cells on the basis of IFNγ and TNFα production, we found no significant differences between these populations, in agreement with earlier findings [52]. We likewise observed no differences in cytokine secretion by CD8+ NK cells between healthy volunteers and patients with T1DM. Given that NK-cell functional activity is determined not only by cytokine production and/or cytotoxic granules containing perforin and granzymes A/B, but also by the distribution of inhibitory and activating receptors on the cell surface, we hypothesise that receptor expression patterns may in fact account for differential functional activity between CD8+ and CD8neg NK-cell populations. Perri et al. reported an increased proportion of CD3-CD8dullCD56+ILT2+ NK cells, as well as an increased frequency of CD3-CD8dullCD56+GAD65 AA 114-122 pentamer-reactive NK cells following peripheral blood mononuclear cell (PBMC) stimulation in children with T1DM compared with healthy age-matched controls. The authors discussed the potential memory-like properties of this NK-cell subset, although its relevance to T1DM pathogenesis during secondary antigenic stimulation remains unresolved [43,53]. In the present study, using a large cohort of adult patients, we observed expansion of CD8+CD38+, CD8+CD161+, and CD8+NKG2A+ NK-cell subsets in adults at the onset of stage 3 T1DM. Interestingly, NKG2A+ NK cells have also been reported to display memory-like properties in the context of Epstein-Barr virus (EBV) infection [54].
CD38 functions both as an ectonucleotidase involved in NAD+ metabolism and as a receptor capable of transducing extracellular signals and modulating intercellular interactions. It is expressed on a wide range of immune-cell populations, including NK cells, and according to our data is present on nearly 87% of NK cells under physiological conditions. Expansion of CD38+ NK cells has been associated with a number of autoimmune diseases, including rheumatoid arthritis and systemic lupus erythematosus [55,56]. CD38 expression has also been shown to enhance the cytotoxic properties of CD38+ NK cells [57]. Several studies have reported that CD38+ NK cells may suppress the differentiation of CD4+ T cells into Tregs. CD38 modulates cytokine production by CD38+ NK cells, promoting increased IFNγ release together with reduced production of TNFα and TGFβ, cytokines required for Treg activation and proliferation [58]. Accordingly, the increase in circulating CD38+ NK cells observed in seropositive patients with T1DM may contribute to disease development through the capacity of CD38+ NK cells to reduce the number of induced regulatory T cells (iTregs) [59].
CD161, also known as KLRB1 or NKR-P1A, is a membrane C-type lectin-like receptor expressed predominantly on NK cells and selected T-cell subsets. CD161 functions as an inhibitory NK-cell receptor and participates in the regulation of NK-cell cytotoxicity. Its principal physiological ligand is lectin-like transcript 1 (LLT1), which is typically expressed on activated cells, including APCs, T cells, and NK cells themselves [60,61]. In the adult T1DM cohort, we observed expansion of the CD8+CD161+ NK-cell subset, whereas in children the increase predominantly involved CD8-CD161+ NK cells. CD161 expression also identifies an NK-cell population capable of responding more rapidly to innate cytokines, including IL-12 and IL-18 [62], which are generally present at elevated concentrations in the serum of patients with T1DM [63,64]. Notably, expansion of both CD8+CD161+ NK and CD8+NKG2A+ NK cells was observed in seronegative patients.
NKT cells may also exert a substantial influence on the initiation of T1DM and have been proposed to play a protective role [65]. Earlier studies reported a reduction in the total circulating MAIT-cell population in children with T1DM, whereas the frequencies of CD8+ and DN MAIT cells remained unchanged compared with healthy controls [66]. In our paediatric cohorts aged 1-9 and 1-18 years, we observed a reduction not only in the total CD3+ MAIT-cell population, but also in CD4+, CD8+, and DN MAIT-cell subsets compared with age-matched healthy individuals. In contrast, no significant alterations in MAIT-cell frequencies were detected in the adult T1DM cohort.
Taken together, T1DM in children younger than 9 years was characterised by an increased proportion of CD4+ T cells and a reduction in CD8+ T cells, together with the expansion of NKregs, intermediate CD56brightCD16dim NK cells, and NKeff cells. MAIT cells also appear to play an important role in the regulation of paediatric T1DM, as their frequencies were consistently reduced. Across the overall paediatric cohort aged 1-18 years, T1DM was characterised by increased frequencies of activated CD3+CD38+, CD4+CD38+, CD4+HLA-DR+CD38+, and CD8+HLA-DR-CD38+ T cells, a reduction in the total NK-cell population, expansion of NKregs, NKeff cells, and CD8-CD161+ NK cells, and a reduction in MAIT cells. Adult T1DM, by contrast, was characterised by reductions in the total NK-cell population and NKeff cells, accompanied by expansion of CD8+ NK, CD8+CD38+ NK, CD8+CD161+ NK, and CD8+NKG2A+ NK-cell subsets, together with a reduction in CD8-CD161+ NK cells.
Immunological Heterogeneity of Peripheral Lymphocyte Subsets Associated with the Stage of T1DM Progression
The clinical manifestation of T1DM is preceded by clinically silent events marking the initiation of autoimmunity and its gradual amplification, involving complex cellular interactions between the innate and adaptive immune systems. Accordingly, assessment of changes in the composition of peripheral lymphocyte subsets at preclinical stages, in comparison with clinically manifest disease, is of particular interest. Owing to the limited number of adults with preclinical T1DM (n=7), we were unable to compare potential immune-response switching patterns accompanying preclinical and clinical disease in adults, and the conclusions regarding stage-associated changes could therefore be drawn only from the paediatric cohort.
At the preclinical stage, children aged 1-18 years exhibited increased frequencies of CD56brightCD16-CD38+, CD8+CD38+, and CD8-CD161+ NK-cell subsets. Previous studies have likewise reported increased CD161 expression on NK cells in children at the preclinical stage of T1DM [50]. At a later stage, we observed a shift in immunophenotype, with clinically manifest disease characterised by a reduction in the total NK-cell population and in CD3+ MAIT cells, including CD8+ MAIT cells. In children with long-standing T1DM, B-cell and NKreg frequencies were reduced. Of particular interest, we also observed a degree of reciprocity between CD8+ T cells and NK cells at the level of cytotoxic potential in children with long-standing T1DM. The proportion of CD8+ T cells containing perforin- and granzyme B-positive granules, and therefore potentially possessing greater cytotoxic capacity, increased, whereas the proportion of perforin-containing CD16+ and CD56+ NK cells declined. NK cells and T cells are indeed capable of reciprocal interactions and may either inhibit or stimulate one another [42]. During the initiation phase of the autoimmune response, NK-cell survival and expansion are promoted by T-cell-derived IL-2, together with IL-15 and IL-18 secreted by APCs. As autoimmune inflammation progresses, activated T cells secrete IL-21, which can promote apoptotic death of NK cells [67]. Thus, the frequency, phenotype, and functional activity of NK cells appear to be highly dependent on the phase of the autoimmune process: NK-cell numbers may increase during the initiation phase, whereas functional deterioration becomes more apparent during the effector phase [68]. Impaired NK-cell cytotoxicity in patients with long-standing disease has likewise been reported previously [47,69,70].
In summary, progression of paediatric T1DM from the preclinical to the clinical stage is accompanied by marked shifts in immunophenotype, ranging from expansion of CD56brightCD16-CD38+, CD8+CD38+, and CD8-CD161+ NK-cell subsets at the preclinical stage to reductions in NK and MAIT cells at the clinical stage. Long-standing clinical T1DM is further characterised by reduced B-cell and NKreg frequencies in children. Longer disease duration is also associated with increased cytotoxic potential of CD8+ T cells, reflected by increased perforin- and granzyme B-containing granules, occurring in parallel with a decline in perforin-associated NK-cell cytotoxicity. Future studies should seek to define quantitative thresholds for these immune-cell subsets that may characterise the "phase transition" from preclinical to clinically manifest T1DM.
Immunological Heterogeneity of Peripheral Lymphocyte Subsets Associated with Circulating Diabetes-Associated Autoantibodies (DAAs) Profiles
DAAs are widely accepted biomarkers of immune-mediated β-cell destruction, and their diversity, levels, and persistence correlate with T1DM progression, loss of endogenous insulin secretion, and clinical disease severity. Patients with multiple autoantibodies are generally associated with more rapid β-cell destruction, whereas seronegative patients tend to exhibit a milder degree of β-cell loss [71]. Importantly, circulating autoantibody levels change over the course of disease progression. After reaching a peak, they gradually decline as β-cell destruction proceeds and may eventually fall below the limit of detection, not only in patients with long-standing T1DM but also by the time of clinical manifestation. The predictive value of autoantibody number and titre for the risk of T1DM progression depends on both disease stage and patient age: individuals positive for two or more autoantibodies progress to clinical disease more rapidly than those with a single autoantibody at stages 1-2; children and adolescents positive for two or more autoantibodies progress faster than adults with the same number of autoantibodies; and individuals positive for IA-2A and ZnT8A progress more rapidly than those positive for IAA and GADA [72,73,74].
To investigate the relationship between autoantibody profiles and distinct immunophenotypes, we stratified patients with T1DM according to: (1) the absence or presence of one, two, or three autoantibodies; (2) the absence or presence of individual autoantibodies (GADA65, IA-2A, ZnT8A) at arbitrarily defined low, intermediate, or high concentrations; and (3) the absence or presence of at least two autoantibodies in any combination, again classified according to low, intermediate, or high quantitative levels. We observed that the most pronounced differences emerged when seronegative patients were compared with individuals positive for multiple autoantibodies.
The frequency of B cells was significantly higher in seronegative adults with stage 3 T1DM than in patients positive for either one or three autoantibodies. B-cell frequencies were also lower in adults with stage 3 T1DM and intermediate GADA levels than in GADA-negative patients. In children with stage 1-2 T1DM, B-cell frequencies were reduced in ZnT8A-positive individuals and showed an inverse relationship with ZnT8A levels. The reduction in circulating B cells in patients with multiple autoantibodies and high GADA and ZnT8A levels most likely reflects their migration into the pancreas. Thus, the decrease in peripheral B cells observed in the context of multiple autoantibody positivity and higher autoantibody titres is consistent with the current concept of more rapid T1DM progression in patients with greater accumulation of B cells within the pancreatic islets [75]. With regard to T cells, increasing GADA levels in children with stage 3 T1DM were associated with a reduction in the overall CD8+ T-cell population, whereas activated CD8+HLA-DR-CD38+ T cells were increased at the preclinical stage compared with seronegative children. These findings further underscore the central role of activated T cells in the immunopathogenesis of paediatric T1DM.
The proportion of NK cells was reduced at stage 3 T1DM in both our paediatric and adult cohorts. Of particular interest, this reduction was most evident in seronegative patients, whereas children and adults with stage 3 T1DM who were positive for multiple autoantibodies or had high IA-2A levels retained NK-cell frequencies within the normal range. It is possible that the reduction in NK cells observed in seronegative patients reflects an early decline in β-cell function and identifies a subgroup of slow progressors, potentially corresponding to a stage characterised by NK-cell migration into the pancreas. Recruitment of NK cells may have divergent consequences for pancreatic tissue: these cells may migrate in response to an infectious insult and contribute to host defence, but may also promote secondary bystander tissue injury [42]. Interestingly, the proportion of CD3-CD8+ NK cells within the total lymphocyte pool was also reduced in patients with DKA.
No doubt, seronegative patients with T1DM represent a subgroup of particular interest. At present, it remains unclear which mechanisms contribute to islet destruction in these individuals and whether the absence of DAA necessarily indicates a non-immune form of T1DM. The fact that T1DM may develop in individuals with profound B-cell deficiency, including patients with X-linked agammaglobulinaemia or common variable immunodeficiency (CVID), in which T1DM has been reported in approximately 1.5% of cases, suggests that B cells are not indispensable for disease development and that the absence of DAA does not preclude activation of autoreactive T cells [76]. Similarly, only approximately 50% of individuals who develop T1DM as a complication of immune checkpoint inhibitor therapy for cancer are DAA-positive, although the presence of DAA has been associated with more rapid development of T1DM and a higher frequency of DKA [77]. Several potential explanations for the absence of detectable DAA have been proposed: (1) B-cell deficiency; (2) a delayed B-cell response; (3) DAA reversion [78]; and (4) extremely rapid β-cell destruction, with autoantibody levels declining before they are measured [79]. Interpretation of seronegativity therefore requires discrimination between true autoantibody negativity, DAA reversion, the presence of DAA at concentrations close to the analytical detection limit, and the possible existence of as-yet unidentified diabetes-associated autoantibodies [80]. Seronegative T1DM is generally considered to be associated with a slower rate of β-cell destruction, as these patients tend to retain higher C-peptide levels and require lower doses of insulin [81]. It has also been proposed that the pathogenesis of seronegative T1DM may resemble that observed in patients positive for a single DAA, with disease arising from the interaction between a less aggressive autoimmune process and insulin resistance (IR) [9]. IR is known to contribute to T1DM development in older individuals and appears to be more characteristic of patients at intermediate rather than high risk of disease progression [82]. According to TrialNet data, single-autoantibody positivity in T1DM is associated with older age and IR [83]. Further studies are therefore required to determine the contribution of IR to seronegative T1DM, single-DAA-positive disease, and T1DM arising in individuals at lower immunological risk.
Among NK-cell subsets defined by CD16 and CD56 expression, we also observed a reduction in the principal effector CD56dimCD16bright NK-cell population in seronegative adults with stage 3 T1DM. In addition, the regulatory CD56bright NK-cell compartment was expanded in seronegative adults but reduced in patients positive for multiple autoantibodies. A similar pattern was observed in children with stage 1-2 T1DM, in whom ZnT8A-negative individuals exhibited higher frequencies of circulating NKregs, intermediate CD56brightCD16dim NK cells, and total CD56bright NK cells than ZnT8A-positive children with high autoantibody titres. Assuming a protective role for NKregs, their reduction in adults with multiple autoantibodies, as well as in ZnT8A-positive adults with stage 3 T1DM and ZnT8A-positive children with stage 1-2 disease, may contribute to amplification of autoimmune inflammation. This interpretation is consistent with the concept that T1DM is more aggressive in the presence of multiple DAA and high ZnT8A levels. The reduction in NKregs observed in children with long-standing disease further supports a potentially protective role for this population.
Adults with stage 3 T1DM who were positive for multiple DAA, as well as children with stage 1-2 T1DM and high ZnT8A titres, exhibited increased frequencies of CD38+ NK cells compared with seronegative adults and ZnT8A-negative children, respectively. Given the aforementioned capacity of CD38+ NK cells to modulate autoreactive CD4+ T-cell activity and potentially shift the immune response towards enhanced T-cell proliferation, the preferential expansion of CD38+ NK cells in seropositive patients appears biologically plausible.
At the same time, expansion of CD8+CD161+ and CD8+NKG2A+ NK-cell subsets was observed specifically in seronegative patients. NKG2A and CD161 are inhibitory receptors expressed on the surface of NK cells and CD8+ T cells. Their interaction with the respective ligands, HLA-E and LLT1, transmits inhibitory signals that restrain NK-cell cytotoxic activity [84]. In patients with low autoantibody titres or complete seronegativity, the autoimmune process may be less pronounced or more effectively controlled by regulatory mechanisms [73]. A higher frequency of cells expressing the inhibitory receptors NKG2A and CD161 may therefore reflect compensatory activation of mechanisms aimed at preserving peripheral tolerance and limiting autoimmune aggression. The predominance of a CD8+NKG2A+ and CD8+CD161+ inhibitory phenotype in patients with low autoantibody titres suggests that their immune profile may be biased towards signals that mitigate tissue destruction, whereas this protective balance may be disrupted in the setting of more active humoral and cellular autoimmunity.
In summary, the T1DM phenotype characterised by multiple autoantibodies and high antibody titres, which is frequently associated with a more aggressive and rapidly progressive disease course than the seronegative phenotype, was accompanied by reduced B-cell frequencies in both children and adults and reduced CD8+ T-cell frequencies in children; depletion of potentially protective NKregs in adults with stage 3 T1DM and children with stage 1-2 disease; expansion of CD38+ NK cells in children with stage 1-2 T1DM and adults with stage 3 disease, a population with the potential to shift autoreactive CD4+ T-cell responses towards enhanced proliferation; and reduced CD3+ MAIT-cell frequencies in GADA-positive children at the preclinical stage. By contrast, seronegative adults and individuals with low autoantibody titres were characterised by a reduction in the total NK-cell population, including reduced NKeff cells, together with expansion of CD56bright NK and CD8+ NK cells, as well as increased frequencies of CD8+CD161+ and CD8+NKG2A+ NK cells exhibiting an inhibitory phenotype.
Immunological Heterogeneity of Peripheral Lymphocyte Subsets Associated with Diabetic Ketoacidosis
Stratification of patients according to the presence or absence of a history of DKA enabled us to identify lymphocyte subpopulations associated with DKA in children and adults. Notably, the age-associated immunological signatures of T1DM were partly evident when DKA-related changes were compared between paediatric and adult patients. Paediatric DKA was accompanied by a reduction in CD3+CD56+ NKT cells, partly paralleling the decrease in MAIT cells, which likewise belong to the innate-like T-cell compartment. Children with DKA also exhibited increased frequencies of CD4+CD8+ double-positive (DP) T cells and activated CD8+CD38+HLA-DR+ T cells. Expansion of the latter population also accompanied paediatric T1DM. Moreover, increased frequencies of activated CD8+CD38+HLA-DR- T cells were observed in seropositive children at the asymptomatic stage of T1DM.
Adult DKA, however, was associated with a distinct pattern of immune-cell alterations, again partly overlapping with the age-dependent changes identified earlier. A reduction in NK cells was once more evident, involving CD3-CD56+ NK cells, CD3-CD8+ NK cells, and NKeff cells. Interestingly, the T-cell subsets assessed in our flow-cytometry panels showed no substantial alterations in adult T1DM overall. In the subgroup with DKA, however, reductions were observed in CD8+CD161+ and CD161+ double-negative T cells, populations that phenotypically overlap with innate-like T cells, as well as in CD8+CD161+TCR Vδ2+ T cells.
Conclusions
The present study demonstrates substantial immunological heterogeneity in T1DM at the level of peripheral blood lymphocyte subpopulations, associated with age at disease onset, stage of disease progression, circulating DAA profiles, and a history of DKA. These findings are relevant not only to fundamental research, as they delineate the trajectory and cellular mechanisms underlying the progressive autoimmune process, but also to clinical practice, as they suggest that patients may be stratified not solely according to DAA profiles but also on the basis of immunophenotypes characteristic of distinct disease subgroups. The immunological heterogeneity identified among patients with T1DM further underscores the importance of patient stratification. Such an approach may facilitate the identification of predictive and prognostic cellular biomarkers capable of estimating the rate of progression to clinically manifest T1DM and the risk of an aggressive disease course, respectively, and may also contribute to the development of individualised therapeutic strategies, including immunotherapy.
Strengths and Limitations
A major strength of the present study is the extensive profiling of peripheral blood lymphocyte subpopulations across multiple clinically distinct subgroups of patients with T1DM, differing in age, disease stage, autoantibody status, and the presence or absence of a history of DKA. The use of a single analytical platform enabled direct comparisons between subgroups and facilitated the identification of age-dependent features of T1DM immunopathogenesis, as well as the characterisation of disease trajectories across different stages of the autoimmune process. It also allowed us to identify lymphocyte subpopulations associated with multiple DAA positivity and with DKA. As a result, we revealed immunophenotypes characteristic of the subgroups investigated, each comprising a specific pattern of altered lymphocyte populations. Our findings support the hypothesis that the immune response in T1DM varies according to age and disease endotype, stage of T1DM, autoantibody status, and the presence or absence of DKA. Future validation of immunophenotypes associated with circulating DAA and a history of DKA in larger patient cohorts may contribute to the development of clinically relevant diagnostic tools for the differential diagnosis of complex cases, including adults with negative autoantibody profiles and an uncertain type of diabetes mellitus.
We acknowledge several limitations. Identifying individuals at the very earliest stage of autoimmune initiation is extremely challenging, if not impossible, and the boundaries between individual stages of T1DM remain inherently conditional. Sample sizes in some subgroups, particularly those defined according to DAA profiles, were not always sufficient to provide high statistical power. In addition, the present study represents an initial investigation of T1DM immunopathogenesis at the level of peripheral blood and should therefore be regarded primarily as hypothesis-generating rather than mechanistic. Finally, our study was cross-sectional, whereas identification of biomarkers capable of predicting the rate of transition between disease stages and the aggressiveness of T1DM progression will require longitudinal follow-up of these patients over time.
Supplementary Materials
The following supporting information can be downloaded at the website of this paper posted on Preprints.org. Figure S1: Gating strategy for NK-cell, T-lymphocyte, and B-lymphocyte subpopulations based on antibody Panel 1; Figure S2: Gating strategy for innate-like T cells and NK-cell subpopulations based on CD161, NKG2A, and EOMES expression; Figure S3: Gating strategy for CD8+ T cells and NK cells and assessment of their cytotoxic potential using antibody; Panel 3. Figure S4: Gating strategy for T and NK lymphocytes and analysis of intracellular cytokine production (IFNγ and TNFα) using antibody Panel 4; Table S1: Antibodies used for flow cytometric analysis; Table S2: Clinical data of patients with T1DM in association with age groups; Table S3: Aotoantibody distribution among patients with T1DM in association with age groups; Table S4: Frequencies of immune subsets in association with age, T1DM stage and autoantibody positivity; Table S5: IFNγ and TNFα expression by CD8+ and CD8neg NK-cell subpopulations.
Author Contributions
Conceptualization, M.L., I.M., I.D., D.L., M.Sh., V.C.,; methodology, M.L., N.S., D.L., A.I.; software, M.L., D.L., A.P.; validation, A.P., N.S., I.G., M.S.; formal analysis, A.P., N.S., A.F., M.T., M.S. D.L., M.L.; investigation, A.P., N.S., A.S., A.F., M.S.; Flow cytometry, N.S., A.P.; resources, M.S., A.F., M.T., I.G.; data curation, M.L., D.L., A.I.; writing—original draft preparation, M.L,, A.P., N.S., A.F., M.S.; writing—review and editing, M.L,, A.P., N.S., A.F., M.S., A.S., L.N., A.I., S.R., D.L, M.S.; visualization, A.P., N.S., D.L., M.L.; supervision, M.L., S.R., M.Sh., O.B., V.P., G.M., V.C., N.M.; project administration, M.L., I.M., M.Sh.; funding acquisition, M.Sh., I.M., I.D., N.M., V.C. All authors have read and agreed to the published version of the manuscript.
Funding
This research was funded by the Ministry of Science and Higher Education of the Russian Federation (agreement No. 075-15-2024-645 from 12 July 2024).
Institutional Review Board Statement
The study was conducted in accordance with the Declaration of Helsinki, and approved by the Local Ethics Committee of the Endocrinology Research Centre, Ministry of Health of the Russian Federation, protocol extract No. 18 dated 12 October 2022.
Informed Consent Statement
Informed consent was obtained from all subjects involved in the study.
Data Availability Statement
The raw data supporting the conclusions of this article will be made available the authors without undue reservation The statistical analysis of the data supporting reported results is available in Supplementary tables 2-4.
Conflicts of Interest
The authors declare no conflicts of interest.
References
- Stanescu, D.E.; Lord, K.; Lipman, T.H. The Epidemiology of Type 1 Diabetes in Children. Endocrinol. Metab. Clin. North Am. 2012, 41(4), 679–94. [Google Scholar] [CrossRef] [PubMed]
- Leete, P.; Mallone, R.; Richardson, S.J.; Sosenko, J.M.; Redondo, M.J.; Evans-Molina, C. The Effect of Age on the Progression and Severity of Type 1 Diabetes: Potential Effects on Disease Mechanisms. Curr. Diab Rep. 2018, 18(11), 115. [Google Scholar] [CrossRef] [PubMed]
- Golden, G.J.; Wu, V.H.; Hamilton, J.T.; Amses, K.R.; Shapiro, M.R.; Sada Japp, A.; et al. Immune perturbations in human pancreas lymphatic tissues prior to and after type 1 diabetes onset. Nat. Commun. 2025, 16(1), 4621. [Google Scholar] [CrossRef] [PubMed]
- Fyvie, M.J.; Gillespie, K.M. The importance of biomarker development for monitoring type 1 diabetes progression rate and therapeutic responsiveness. Front Immunol. 2023, 14, 1158278. [Google Scholar] [CrossRef] [PubMed]
- Redondo, M.J.; Morgan, N.G. Heterogeneity and endotypes in type 1 diabetes mellitus. Nat. Rev. Endocrinol. 2023, 19(9), 542–54. [Google Scholar] [CrossRef] [PubMed]
- Ahlqvist, E.; Storm, P.; Käräjämäki, A.; Martinell, M.; Dorkhan, M.; Carlsson, A.; et al. Novel subgroups of adult-onset diabetes and their association with outcomes: a data-driven cluster analysis of six variables. Lancet Diabetes Endocrinol. 2018, 6(5), 361–9. [Google Scholar] [CrossRef] [PubMed]
- Zufarova, I.M.; Laptev, D.N.; Minniahmetov, I.R.; Khusainova, R.I.; Popov, S.V.; Titovich, E.V.; et al. Clinical, bio chemical and genetic characteristics of familial forms of type 1 diabetes. Diabetes Mellit. 2025, 27(6), 520–7. [Google Scholar] [CrossRef]
- Hanna, S.J.; Powell, W.E.; Long, A.E.; Robinson, E.J.S.; Davies, J.; Megson, C.; et al. Slow progressors to type 1 diabetes lose islet autoantibodies over time, have few islet antigen-specific CD8+ T cells and exhibit a distinct CD95hi B cell phenotype. Diabetologia 2020, 63(6), 1174–85. [Google Scholar] [CrossRef] [PubMed]
- Patel, S.K.; Ma, C.S.; Fourlanos, S.; Greenfield, J.R. Autoantibody-Negative Type 1 Diabetes: A Neglected Subtype. Trends Endocrinol. Metab. 2021, 32(5), 295–305. [Google Scholar] [CrossRef] [PubMed]
- Silveira, P.; Johnson, E.; Chapman, H.; Bui, T.; Tisch, R.; Serreze, D. The preferential ability of B lymphocytes to act as diabetogenic APC in NOD mice depends on expression of self-antigen-specific immunoglobulin receptors. Eur. J. Immunol. 2002, 32(12), 3657–66. [Google Scholar] [CrossRef] [PubMed]
- In’t Veld, P. Insulitis in human type 1 diabetes: The quest for an elusive lesion. Islets 2011, 3(4), 131–8. [Google Scholar] [CrossRef] [PubMed]
- Burrack, A.L.; Martinov, T.; Fife, B.T. T Cell-Mediated Beta Cell Destruction: Autoimmunity and Alloimmunity in the Context of Type 1 Diabetes. Front Endocrinol. 2017, 8, 343. [Google Scholar] [CrossRef] [PubMed]
- Roep, B.O.; Thomaidou, S.; Van Tienhoven, R.; Zaldumbide, A. Type 1 diabetes mellitus as a disease of the β-cell (do not blame the immune system?). Nat. Rev. Endocrinol. 2021, 17(3), 150–61. [Google Scholar] [CrossRef] [PubMed]
- Oras, A.; Peet, A.; Giese, T.; Tillmann, V.; Uibo, R. A study of 51 subtypes of peripheral blood immune cells in newly diagnosed young type 1 diabetes patients. Clin. Exp. Immunol. 2019, 198(1), 57–70. [Google Scholar] [CrossRef] [PubMed]
- Loguinova, M.; Sergeev, N.; Samsonova, M.; Sorokina, A.; Grebennikov, D.; Golodnikov, I.; et al. Changes in circulating NK and innate-like T cells in type 1 and type 2 diabetes. Front Immunol. 2025, 16, 1667888. [Google Scholar] [CrossRef] [PubMed]
- Ferreira, R.C.; Simons, H.Z.; Thompson, W.S.; Cutler, A.J.; Dopico, X.C.; Smyth, D.J.; et al. IL-21 production by CD4+ effector T cells and frequency of circulating follicular helper T cells are increased in type 1 diabetes patients. Diabetologia 2015, 58(4), 781–90. [Google Scholar] [CrossRef] [PubMed]
- Hull, C.M.; Peakman, M.; Tree, T.I.M. Regulatory T cell dysfunction in type 1 diabetes: what’s broken and how can we fix it? Diabetologia 2017, 60(10), 1839–50. [Google Scholar] [CrossRef] [PubMed]
- Deng, C.; Xiang, Y.; Tan, T.; Ren, Z.; Cao, C.; Huang, G.; et al. Altered Peripheral B-Lymphocyte Subsets in Type 1 Diabetes and Latent Autoimmune Diabetes in Adults. Diabetes Care 2016, 39(3), 434–40. [Google Scholar] [CrossRef] [PubMed]
- Golodnikov, I.I.; Podshivalova, E.S.; Chechekhin, V.I.; Zubritskiy, A.V.; Matrosova, A.A.; Sergeev, N.A.; et al. Single-cell immune transcriptomics reveals an inflammatory-inhibitory set-point spectrum in autoimmune diabetes. JCI Insight 2026, 11(1), e199050. [Google Scholar] [CrossRef] [PubMed]
- Patel, S.K.; Ma, C.S.; Fourlanos, S.; Greenfield, J.R. Clinical, immunogenetic and metabolic characteristics of autoantibody-negative and autoantibody-positive type 1 diabetes. Diabetologia 2026, 69(3), 600–9. [Google Scholar] [CrossRef] [PubMed]
- Ilonen, J.; Hammais, A.; Laine, A.P.; Lempainen, J.; Vaarala, O.; Veijola, R.; et al. Patterns of β-Cell Autoantibody Appearance and Genetic Associations During the First Years of Life. Diabetes 2013, 62(10), 3636–40. [Google Scholar] [CrossRef] [PubMed]
- Leete, P.; Willcox, A.; Krogvold, L.; Dahl-Jørgensen, K.; Foulis, A.K.; Richardson, S.J.; et al. Differential insulitic profiles determine the extent of β-cell destruction and the age at onset of type 1 diabetes. Diabetes 2016, 65(5), 1362–9. [Google Scholar] [CrossRef] [PubMed]
- Marca, V.; Gianchecchi, E.; Fierabracci, A. Type 1 Diabetes and Its Multi-Factorial Pathogenesis: The Putative Role of NK Cells. Int. J. Mol. Sci. 2018, 19(3), 794. [Google Scholar] [CrossRef] [PubMed]
- Poirot, L.; Benoist, C.; Mathis, D. Natural killer cells distinguish innocuous and destructive forms of pancreatic islet autoimmunity. Proc. Natl. Acad. Sci. 2004, 101(21), 8102–7. [Google Scholar] [CrossRef] [PubMed]
- Morandi, F.; Horenstein, A.L.; Chillemi, A.; Quarona, V.; Chiesa, S.; Imperatori, A.; et al. CD56brightCD16− NK Cells Produce Adenosine through a CD38-Mediated Pathway and Act as Regulatory Cells Inhibiting Autologous CD4+ T Cell Proliferation. J. Immunol. 2015, 195(3), 965–72. [Google Scholar] [CrossRef] [PubMed]
- Wang, H.; Fang, K.; Yan, W.; Chang, X. T-Cell Immune Imbalance in Rheumatoid Arthritis Is Associated with Alterations in NK Cells and NK-Like T Cells Expressing CD38. J. Innate Immun. 2022, 14(2), 148–66. [Google Scholar] [CrossRef] [PubMed]
- Westerholm-Ormio, M.; Vaarala, O.; Pihkala, P.; Ilonen, J.; Savilahti, E. Immunologic Activity in the Small Intestinal Mucosa of Pediatric Patients With Type 1 Diabetes. Diabetes 2003, 52(9), 2287–95. [Google Scholar] [CrossRef] [PubMed]
- Brown, C.T.; Davis-Richardson, A.G.; Giongo, A.; Gano, K.A.; Crabb, D.B.; Mukherjee, N.; et al. Gut Microbiome Metagenomics Analysis Suggests a Functional Model for the Development of Autoimmunity for Type 1 Diabetes. In PLoS ONE; Roop, R.M., Ed.; 17 Oct 2011; Volume 6, 10. [Google Scholar] [CrossRef] [PubMed]
- Hao, W.; Gitelman, S.; DiMeglio, L.A.; Boulware, D.; Greenbaum, C.J. for the Type 1 Diabetes TrialNet Study Group. Fall in C-Peptide During First 4 Years From Diagnosis of Type 1 Diabetes: Variable Relation to Age, HbA1c, and Insulin Dose. Diabetes Care 2016, 39(10), 1664–70. [Google Scholar] [CrossRef] [PubMed]
- Shields, B.M.; McDonald, T.J.; Oram, R.; Hill, A.; Hudson, M.; Leete, P.; et al. C-Peptide Decline in Type 1 Diabetes Has Two Phases: An Initial Exponential Fall and a Subsequent Stable Phase. Diabetes Care 2018, 41(7), 1486–92. [Google Scholar] [CrossRef] [PubMed]
- Wagner, R.; Füchtenbusch, M.; Hummel, M.; Miszon, M.; Pfützner, A.; Reger-Tan, S.; et al. Adult-onset type 1 diabetes: early detection, differential diagnosis, and emerging disease-modifying therapies. Diabetes Res. Clin. Pract. 2026, 231, 113047. [Google Scholar] [CrossRef] [PubMed]
- Culina, S.; Lalanne, A.I.; Afonso, G.; Cerosaletti, K.; Pinto, S.; Sebastiani, G.; et al. Islet-reactive CD8+ T cell frequencies in the pancreas, but not in blood, distinguish type 1 diabetic patients from healthy donors. Sci. Immunol. 2018, 3(20), eaao4013. [Google Scholar] [CrossRef] [PubMed]
- Brusko, T.M.; Wasserfall, C.H.; Clare-Salzler, M.J.; Schatz, D.A.; Atkinson, M.A. Functional Defects and the Influence of Age on the Frequency of CD4+CD25+ T-Cells in Type 1 Diabetes. Diabetes 2005, 54(5), 1407–14. [Google Scholar] [CrossRef] [PubMed]
- Sundaresan, B.; Shirafkan, F.; Ripperger, K.; Rattay, K. The Role of Viral Infections in the Onset of Autoimmune Diseases. Viruses 2023, 15(3), 782. [Google Scholar] [CrossRef] [PubMed]
- Piccioli, D.; Sbrana, S.; Melandri, E.; Valiante, N.M. Contact-dependent Stimulation and Inhibition of Dendritic Cells by Natural Killer Cells. J. Exp. Med. 2002, 195(3), 335–41. [Google Scholar] [CrossRef] [PubMed]
- Carnaud, C.; Lee, D.; Donnars, O.; Park, S.H.; Beavis, A.; Koezuka, Y.; et al. Cutting edge: cross-talk between cells of the innate immune system: NKT cells rapidly activate NK cells. J. Immunol. 1999, 163(9), 4647–50. [Google Scholar] [CrossRef]
- Blanca, I.R.; Bere, E.W.; Young, H.A.; Ortaldo, J.R. Human B Cell Activation by Autologous NK Cells Is Regulated by CD40-CD40 Ligand Interaction: Role of Memory B Cells and CD5+ B Cells. J. Immunol. 2001, 167(11), 6132–9. [Google Scholar] [CrossRef] [PubMed]
- Zingoni, A.; Sornasse, T.; Cocks, B.G.; Tanaka, Y.; Santoni, A.; Lanier, L.L. Cross-Talk between Activated Human NK Cells and CD4+ T Cells via OX40-OX40 Ligand Interactions. J. Immunol. 2004, 173(6), 3716–24. [Google Scholar] [CrossRef] [PubMed]
- Alba, A.; Planas, R.; Clemente, X.; Carrillo, J.; Ampudia, R.; Puertas, M.C.; et al. Natural killer cells are required for accelerated type 1 diabetes driven by interferon-β. Clin. Exp. Immunol. 2008, 151(3), 467–75. [Google Scholar] [CrossRef] [PubMed]
- Horwitz, D.A.; Gray, J.D.; Ohtsuka, K.; Hirokawa, M.; Takahashi, T. The immunoregulatory effects of NK cells: the role of TGF-β and implications for autoimmunity. Immunol. Today 1997, 18(11), 538–42. [Google Scholar] [CrossRef] [PubMed]
- Shi, F.D.; Van Kaer, L. Reciprocal regulation between natural killer cells and autoreactive T cells. Nat. Rev. Immunol. 2006, 6(10), 751–60. [Google Scholar] [CrossRef] [PubMed]
- Shi, F.D.; Wang, H.B.; Li, H.; Hong, S.; Taniguchi, M.; Link, H.; et al. Natural killer cells determine the outcome of B cell–mediated autoimmunity. Nat. Immunol. 2000, 1(3), 245–51. [Google Scholar] [CrossRef] [PubMed]
- Perri, V.; Gianchecchi, E.; Cifaldi, L.; Pellegrino, M.; Giorda, E.; Andreani, M.; et al. Identification of GAD65 AA 114-122 reactive “memory-like” NK cells in newly diagnosed Type 1 diabetic patients by HLA-class I pentamers. In PLOS ONE; Pietropaolo, M., Ed.; 13 Dec 2017; Volume 12, 12. [Google Scholar] [CrossRef] [PubMed]
- Teniente-Serra, A.; Pizarro, E.; Quirant-Sánchez, B.; Fernández, M.A.; Vives-Pi, M.; Martinez-Caceres, E.M. Identifying Changes in Peripheral Lymphocyte Subpopulations in Adult Onset Type 1 Diabetes. Front Immunol. 2021, 12, 784110. [Google Scholar] [CrossRef] [PubMed]
- Gomez-Muñoz, L.; Perna-Barrull, D.; Villalba, A.; Rodriguez-Fernandez, S.; Ampudia, R.M.; Teniente-Serra, A.; et al. NK Cell Subsets Changes in Partial Remission and Early Stages of Pediatric Type 1 Diabetes. Front Immunol. 2021, 11, 611522. [Google Scholar] [CrossRef] [PubMed]
- Brauner, H.; Elemans, M.; Lemos, S.; Broberger, C.; Holmberg, D.; Flodström-Tullberg, M.; et al. Distinct Phenotype and Function of NK Cells in the Pancreas of Nonobese Diabetic Mice. J. Immunol. 2010, 184(5), 2272–80. [Google Scholar] [CrossRef] [PubMed]
- Kucuksezer, U.C.; Aktas Cetin, E.; Esen, F.; Tahrali, I.; Akdeniz, N.; Gelmez, M.Y.; et al. The Role of Natural Killer Cells in Autoimmune Diseases. Front Immunol. 2021, 12, 622306. [Google Scholar] [CrossRef] [PubMed]
- Bahadorian, D.; Mollazadeh, S.; Mirazi, H.; Faraj, T.; Kheder, R.; Esmaeili, S. Regulatory NK cells in autoimmune disease. Iran. J. Basic Med. Sci. 2023, 26(6). [Google Scholar] [CrossRef] [PubMed]
- Quatrini, L.; Della Chiesa, M.; Sivori, S.; Mingari, M.C.; Pende, D.; Moretta, L. Human NK cells, their receptors and function. Eur. J. Immunol. 2021, 51(7), 1566–79. [Google Scholar] [CrossRef] [PubMed]
- Starskaia, I.; Valta, M.; Pietilä, S.; Suomi, T.; Pahkuri, S.; Kalim, U.U.; et al. Distinct cellular immune responses in children en route to type 1 diabetes with different first-appearing autoantibodies. Nat. Commun. 2024, 15(1), 3810. [Google Scholar] [CrossRef] [PubMed]
- Moebius, U.; Kober, G.; Griscelli, A.L.; Hercend, T.; Meuer, S.C. Expression of different CD8 isoforms on distinct human lymphocyte subpopulations. Eur. J. Immunol. 1991, 21(8), 1793–800. [Google Scholar] [CrossRef] [PubMed]
- Abdalla, I. Characterisation of CD8neg and CD8+ human natural killer cell subsets [Internet]; University of Leeds, 2012; Available online: https://etheses.whiterose.ac.uk/id/eprint/4372/.
- Sinha, O.; Abhipsha, S.; Sen Santara, S. Power of Memory: A Natural Killer Cell Perspective. Cells 2025, 14(11), 846. [Google Scholar] [CrossRef] [PubMed]
- Desimio, M.G.; Covino, D.A.; Rivalta, B.; Cancrini, C.; Doria, M. The Role of NK Cells in EBV Infection and Related Diseases: Current Understanding and Hints for Novel Therapies. Cancers 2023, 15(6), 1914. [Google Scholar] [CrossRef] [PubMed]
- Humbel, M.; Bellanger, F.; Fluder, N.; Horisberger, A.; Suffiotti, M.; Fenwick, C.; et al. Restoration of NK Cell Cytotoxic Function With Elotuzumab and Daratumumab Promotes Elimination of Circulating Plasma Cells in Patients With SLE. Front Immunol. 2021, 12, 645478. [Google Scholar] [CrossRef] [PubMed]
- Pan, W.; Yue, L.; Wang, Q.; Wang, Z.; Wang, X.; Li, S.; et al. CD38 positive natural killer cells may be involved in progression of inflammation in rheumatoid arthritis patients. Int. J. Clin. Exp. Med. 2017, 10(3), 4696–704. [Google Scholar]
- Sconocchia, G.; Titus, J.A.; Mazzoni, A.; Visintin, A.; Pericle, F.; Hicks, S.W.; et al. CD38 Triggers Cytotoxic Responses in Activated Human Natural Killer Cells. Blood 1999, 94(11), 3864–71. [Google Scholar] [CrossRef]
- Wang, H.; Li, S.; Zhang, G.; Wu, H.; Chang, X. Potential therapeutic effects of cyanidin-3-O-glucoside on rheumatoid arthritis by relieving inhibition of CD38+ NK cells on Treg cell differentiation. Arthritis Res. Ther. 2019, 21(1), 220. [Google Scholar] [CrossRef] [PubMed]
- Chang, X.; Fang, K. CD38+ NK cells: novel players in immunoregulation. Front Immunol. 2026, 17, 1757958. [Google Scholar] [CrossRef] [PubMed]
- Germain, C.; Meier, A.; Jensen, T.; Knapnougel, P.; Poupon, G.; Lazzari, A.; et al. Induction of Lectin-like Transcript 1 (LLT1) Protein Cell Surface Expression by Pathogens and Interferon-γ Contributes to Modulate Immune Responses. J. Biol. Chem. 2011, 286(44), 37964–75. [Google Scholar] [CrossRef] [PubMed]
- Aldemir, H.; Prod’homme, V.; Dumaurier, M.J.; Retiere, C.; Poupon, G.; Cazareth, J.; et al. Cutting edge: lectin-like transcript 1 is a ligand for the CD161 receptor. J. Immunol. 2005, 175(12), 7791–5. [Google Scholar] [CrossRef] [PubMed]
- Kurioka, A.; Cosgrove, C.; Simoni, Y.; Van Wilgenburg, B.; Geremia, A.; Björkander, S.; et al. CD161 Defines a Functionally Distinct Subset of Pro-Inflammatory Natural Killer Cells. Front Immunol. 2018, 9, 486. [Google Scholar] [CrossRef] [PubMed]
- Ryba-Stanisławowska, M.; Rybarczyk-Kapturska, K.; Myśliwiec, M.; Myśliwska, J. Elevated Levels of Serum IL-12 and IL-18 are Associated with Lower Frequencies of CD4+CD25highFOXP3+ Regulatory T cells in Young Patients with Type 1 Diabetes. Inflammation 2014, 37(5), 1513–20. [Google Scholar] [CrossRef] [PubMed]
- Altinova, A.E.; Yetkin, I.; Akbay, E.; Bukan, N.; Arslan, M. Serum IL-18 levels in patients with type 1 diabetes: Relations to metabolic control and microvascular complications. Cytokine 2008, 42(2), 217–21. [Google Scholar] [CrossRef] [PubMed]
- Lehuen, A.; Lantz, O.; Beaudoin, L.; Laloux, V.; Carnaud, C.; Bendelac, A.; et al. Overexpression of natural killer T cells protects Vα14-Jα281 transgenic nonobese diabetic mice against diabetes. J. Exp. Med. 1998, 188(10), 1831–9. [Google Scholar] [CrossRef] [PubMed]
- Harms, R.Z.; Ostlund, K.R.; Cabrera, M.; Edwards, E.; Smith, V.B.; Smith, L.M.; et al. Frequencies of CD8 and DN MAIT Cells Among Children Diagnosed With Type 1 Diabetes Are Similar to Age-Matched Controls. Front Immunol. 2021, 12, 604157. [Google Scholar] [CrossRef] [PubMed]
- Kasaian, M.T.; Whitters, M.J.; Carter, L.L.; Lowe, L.D.; Jussif, J.M.; Deng, B.; et al. IL-21 Limits NK Cell Responses and Promotes Antigen-Specific T Cell Activation. Immunity 2002, 16(4), 559–69. [Google Scholar] [CrossRef] [PubMed]
- Liu, R.; Van Kaer, L.; La Cava, A.; Price, M.; Campagnolo, D.I.; Collins, M.; et al. Autoreactive T Cells Mediate NK Cell Degeneration in Autoimmune Disease. J. Immunol. 2006, 176(9), 5247–54. [Google Scholar] [CrossRef] [PubMed]
- Ferreira-Hermosillo, A.; Santana-Sánchez, P.; Vaquero-García, R.; García-Sáenz, M.R.; Castro-Ríos, A.; Chávez-Rueda, A.K.; et al. Circulating T Cell Subsets in Type 1 Diabetes. Cells 2025, 14(1), 48. [Google Scholar] [CrossRef] [PubMed]
- Rodacki, M.; Svoren, B.; Butty, V.; Besse, W.; Laffel, L.; Benoist, C.; et al. Altered Natural Killer Cells in Type 1 Diabetic Patients. Diabetes 2007, 56(1), 177–85. [Google Scholar] [CrossRef] [PubMed]
- Sabbah, E.; Savola, K.; Kulmala, P.; Veijola, R.; Vähäsalo, P.; Karjalainen, J.; et al. Diabetes-Associated Autoantibodies in Relation to Clinical Characteristics and Natural Course in Children with Newly Diagnosed Type 1 Diabetes1. J. Clin. Endocrinol. Metab. 1999, 84(5), 1534–9. [Google Scholar] [CrossRef] [PubMed]
- Gorus, F.K.; Balti, E.V.; Messaaoui, A.; Demeester, S.; Van Dalem, A.; Costa, O.; et al. Twenty-Year Progression Rate to Clinical Onset According to Autoantibody Profile, Age, and HLA-DQ Genotype in a Registry-Based Group of Children and Adults With a First-Degree Relative With Type 1 Diabetes. Diabetes Care 2017, 40(8), 1065–72. [Google Scholar] [CrossRef] [PubMed]
- Grace, S.L.; Bowden, J.; Walkey, H.C.; Kaur, A.; Misra, S.; Shields, B.M.; et al. Islet Autoantibody Level Distribution in Type 1 Diabetes and Their Association With Genetic and Clinical Characteristics. J. Clin. Endocrinol. Metab. 2022, 107(12), e4341–9. [Google Scholar] [CrossRef] [PubMed]
- Romanenkova, E.M.; Zufarova, I.M.; Sorokin, D.Y.; Eremina, I.A.; Sechko, E.A.; Nikankina, L.V.; et al. Islet autoantibodies and residual beta-cell function in children with type 1 diabetes depending on age of manifestation. Diabetes Mellit. 2023, 26(3), 204–12. [Google Scholar] [CrossRef]
- Smith, M.J.; Cambier, J.C.; Gottlieb, P.A. Endotypes in T1D: B lymphocytes and early onset. Curr. Opin. Endocrinol. Diabetes Obes. 2020, 27(4), 225–30. [Google Scholar] [CrossRef] [PubMed]
- Milota, T.; Šumník, Z.; Obermannová, B.; Králíčková, P.; Vondrák, K.; Klocperk, A.; et al. Negativity for Specific Autoantibodies in Patients with Type 1 Diabetes That Developed on a Background of Common Variable Immunodeficiency. Int. Arch. Allergy Immunol. 2015, 168(3), 197–204. [Google Scholar] [CrossRef] [PubMed]
- Akturk, H.K.; Kahramangil, D.; Sarwal, A.; Hoffecker, L.; Murad, M.H.; Michels, A.W. Immune checkpoint inhibitor-induced Type 1 diabetes: a systematic review and meta-analysis. Diabet. Med. 2019, 36(9), 1075–81. [Google Scholar] [CrossRef] [PubMed]
- So, M.; O’Rourke, C.; Bahnson, H.T.; Greenbaum, C.J.; Speake, C. Autoantibody Reversion: Changing Risk Categories in Multiple-Autoantibody–Positive Individuals. Diabetes Care 2020, 43(4), 913–7. [Google Scholar] [CrossRef] [PubMed]
- Lukose, S.; Rapoport, Y.; Obici, S. SAT-627 Seronegative Type 1 Diabetes Mellitus in a Young Adult. J. Endocr. Soc. 2025, 9 (Supplement_1), bvaf149.1153. [Google Scholar] [CrossRef]
- Imagawa, A.; Hanafusa, T.; ichiro, Miyagawa J; Matsuzawa, Y. A Novel Subtype of Type 1 Diabetes Mellitus Characterized by a Rapid Onset and an Absence of Diabetes-Related Antibodies. N Engl. J. Med. 2000, 342(5), 301–7. [Google Scholar] [CrossRef] [PubMed]
- Aguilera, E.; Casamitjana, R.; Ercilla, G.; Oriola, J.; Gomis, R.; Conget, I. Adult-onset atypical (type 1) diabetes: additional insights and differences with type 1A diabetes in a European Mediterranean population. Diabetes Care 2004, 27(5), 1108–14. [Google Scholar] [PubMed]
- Xu, P.; Cuthbertson, D.; Greenbaum, C.; Palmer, J.P.; Krischer, J.P. for the Diabetes Prevention Trial–Type 1 Study Group. Role of Insulin Resistance in Predicting Progression to Type 1 Diabetes. Diabetes Care 2007, 30(9), 2314–20. [Google Scholar] [CrossRef] [PubMed]
- Redondo, M.J.; Sosenko, J.; Libman, I.; McVean, J.J.F.; Tosur, M.; Atkinson, M.A.; et al. Single Islet Autoantibody at Diagnosis of Clinical Type 1 Diabetes is Associated With Older Age and Insulin Resistance. J. Clin. Endocrinol. Metab. 2020, 105(5), 1629–40. [Google Scholar] [CrossRef] [PubMed]
- Wang, X.; Xiong, H.; Ning, Z. Implications of NKG2A in immunity and immune-mediated diseases. Front Immunol. 2022, 13, 960852. [Google Scholar] [CrossRef] [PubMed]
Figure 1.
Correlations between biochemical parameters (HbA1c, glucose, and C-peptide) reflecting the endocrine function of β-cells, and distribution of autoantibodies across the study groups. A. Correlations between biochemical parameters (HbA1c, glucose, and C-peptide) in children with T1DM. B. Correlations between biochemical parameters (HbA1c, glucose, C-peptide, and insulin) in adults with T1DM. C. Quantitative distribution of autoantibodies across age groups at different stages of T1DM. Data in histogram C are presented as medians. D. Frequency of autoantibodies (calculated as the percentage number of patients within each group exhibiting elevated levels of a given autoantibody) across age groups at different stages of T1DM. E. Percentage distribution of paediatric and adult patients with T1DM according to the absence or presence of one or more autoantibodies. F. Percentage distribution of paediatric and adult patients with T1DM according to positivity for only one of the assessed autoantibodies or for all three simultaneously.
Figure 1.
Correlations between biochemical parameters (HbA1c, glucose, and C-peptide) reflecting the endocrine function of β-cells, and distribution of autoantibodies across the study groups. A. Correlations between biochemical parameters (HbA1c, glucose, and C-peptide) in children with T1DM. B. Correlations between biochemical parameters (HbA1c, glucose, C-peptide, and insulin) in adults with T1DM. C. Quantitative distribution of autoantibodies across age groups at different stages of T1DM. Data in histogram C are presented as medians. D. Frequency of autoantibodies (calculated as the percentage number of patients within each group exhibiting elevated levels of a given autoantibody) across age groups at different stages of T1DM. E. Percentage distribution of paediatric and adult patients with T1DM according to the absence or presence of one or more autoantibodies. F. Percentage distribution of paediatric and adult patients with T1DM according to positivity for only one of the assessed autoantibodies or for all three simultaneously.
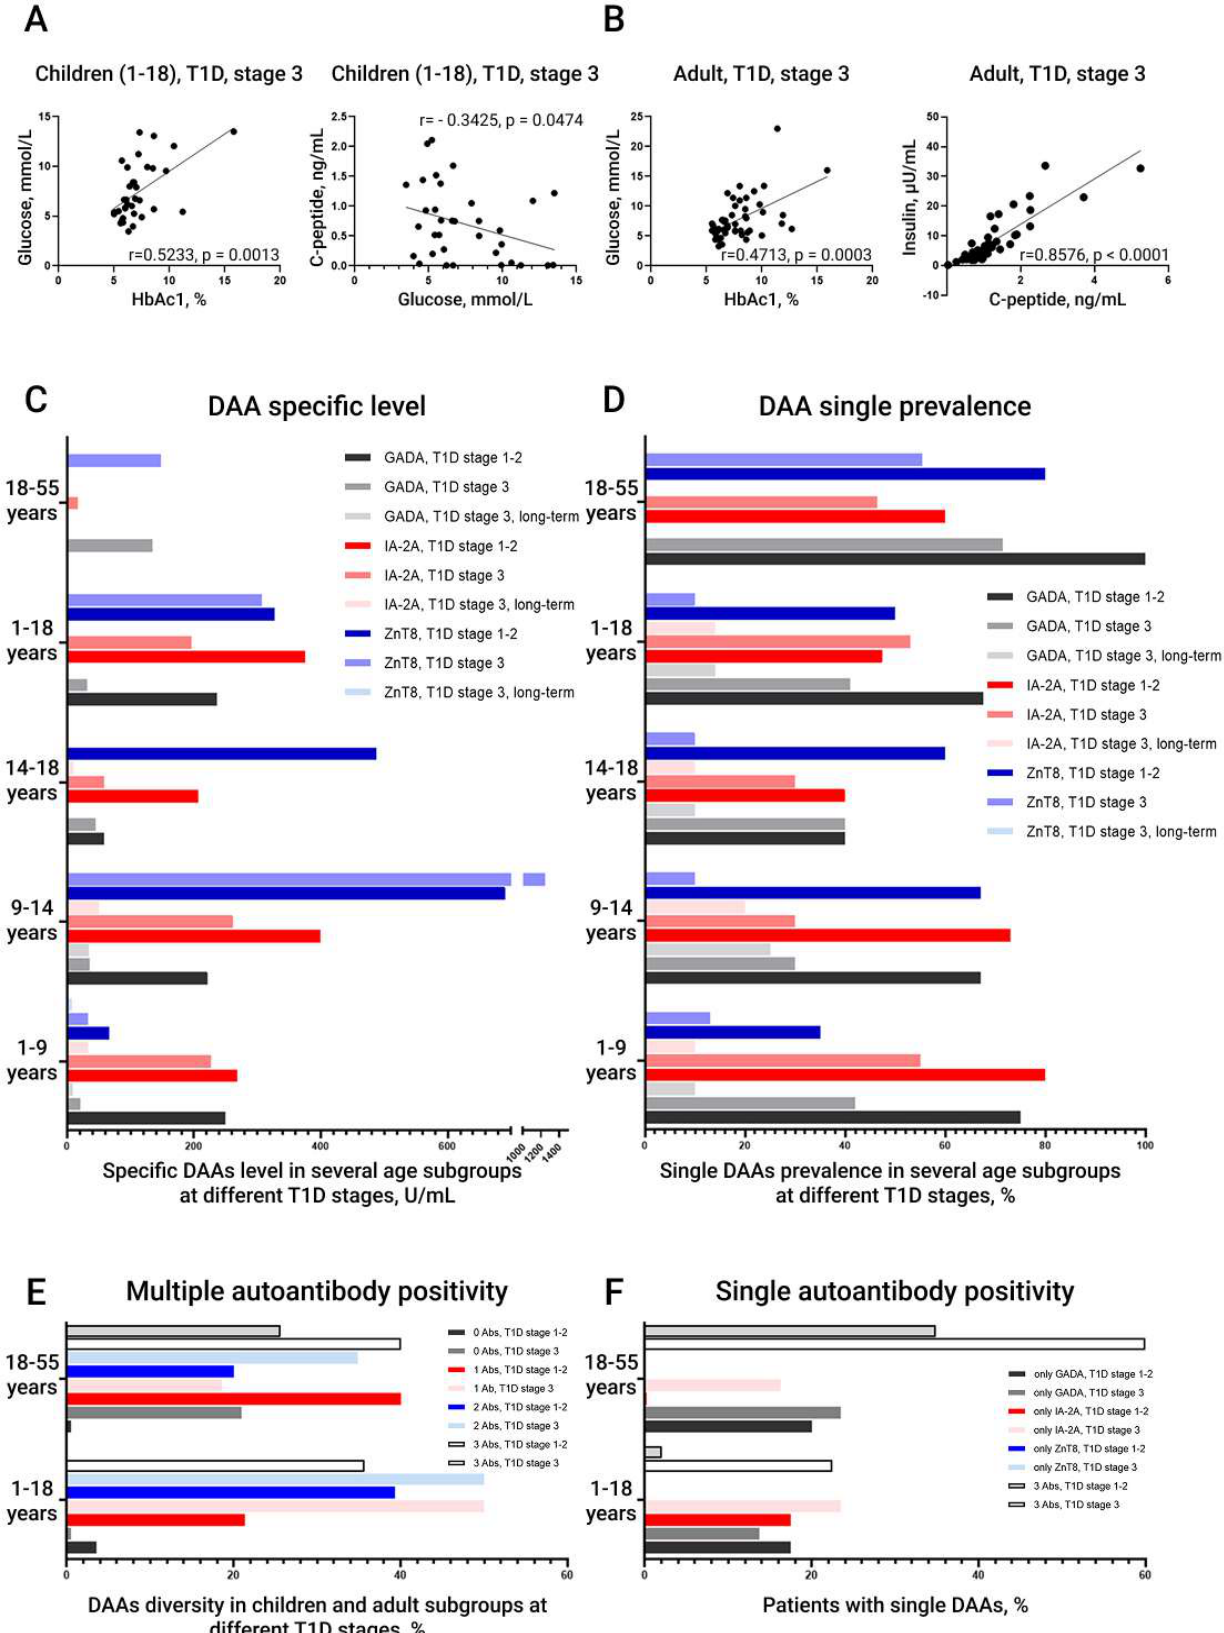
Figure 2.
Alterations in the frequencies of B and T cells, including CD4+ and CD8+ T cells, across the study groups. A. Changes in the proportion of circulating B lymphocytes in different age groups of healthy volunteers and patients with stage 1-2 T1DM, stage 3 T1DM, and long-standing T1DM. Horizontal histograms: A1: Changes in the proportion of CD19+ B lymphocytes in adults with stage 3 T1DM according to the absence or presence of multiple autoantibodies. A2: Changes in the proportion of B lymphocytes in adults with stage 3 T1DM according to the absence or presence of different levels of GADA. A3: Changes in the proportion of B lymphocytes in children with stage 1-2 T1DM according to the absence or presence of different levels of ZnT8A. B. Changes in the proportion of circulating CD3+ T lymphocytes in different age groups of healthy volunteers and patients with stage 1-2 T1DM, stage 3 T1DM, and long-standing T1DM. Horizontal histograms: B1: Changes in the proportion of T lymphocytes in adults with stage 3 T1DM according to the absence or presence of multiple autoantibodies. B2: Changes in the proportion of T lymphocytes in adults with stage 3 T1DM according to the absence or presence of different levels of GADA. B3. Inverse correlation between activated CD3+CD38+ T cells and C-peptide. Data are presented as medians with interquartile ranges. Significant differences are indicated by asterisks. * - p-value < 0.05, ** - p-value < 0.005, *** - p-value < 0.0001.
Figure 2.
Alterations in the frequencies of B and T cells, including CD4+ and CD8+ T cells, across the study groups. A. Changes in the proportion of circulating B lymphocytes in different age groups of healthy volunteers and patients with stage 1-2 T1DM, stage 3 T1DM, and long-standing T1DM. Horizontal histograms: A1: Changes in the proportion of CD19+ B lymphocytes in adults with stage 3 T1DM according to the absence or presence of multiple autoantibodies. A2: Changes in the proportion of B lymphocytes in adults with stage 3 T1DM according to the absence or presence of different levels of GADA. A3: Changes in the proportion of B lymphocytes in children with stage 1-2 T1DM according to the absence or presence of different levels of ZnT8A. B. Changes in the proportion of circulating CD3+ T lymphocytes in different age groups of healthy volunteers and patients with stage 1-2 T1DM, stage 3 T1DM, and long-standing T1DM. Horizontal histograms: B1: Changes in the proportion of T lymphocytes in adults with stage 3 T1DM according to the absence or presence of multiple autoantibodies. B2: Changes in the proportion of T lymphocytes in adults with stage 3 T1DM according to the absence or presence of different levels of GADA. B3. Inverse correlation between activated CD3+CD38+ T cells and C-peptide. Data are presented as medians with interquartile ranges. Significant differences are indicated by asterisks. * - p-value < 0.05, ** - p-value < 0.005, *** - p-value < 0.0001.
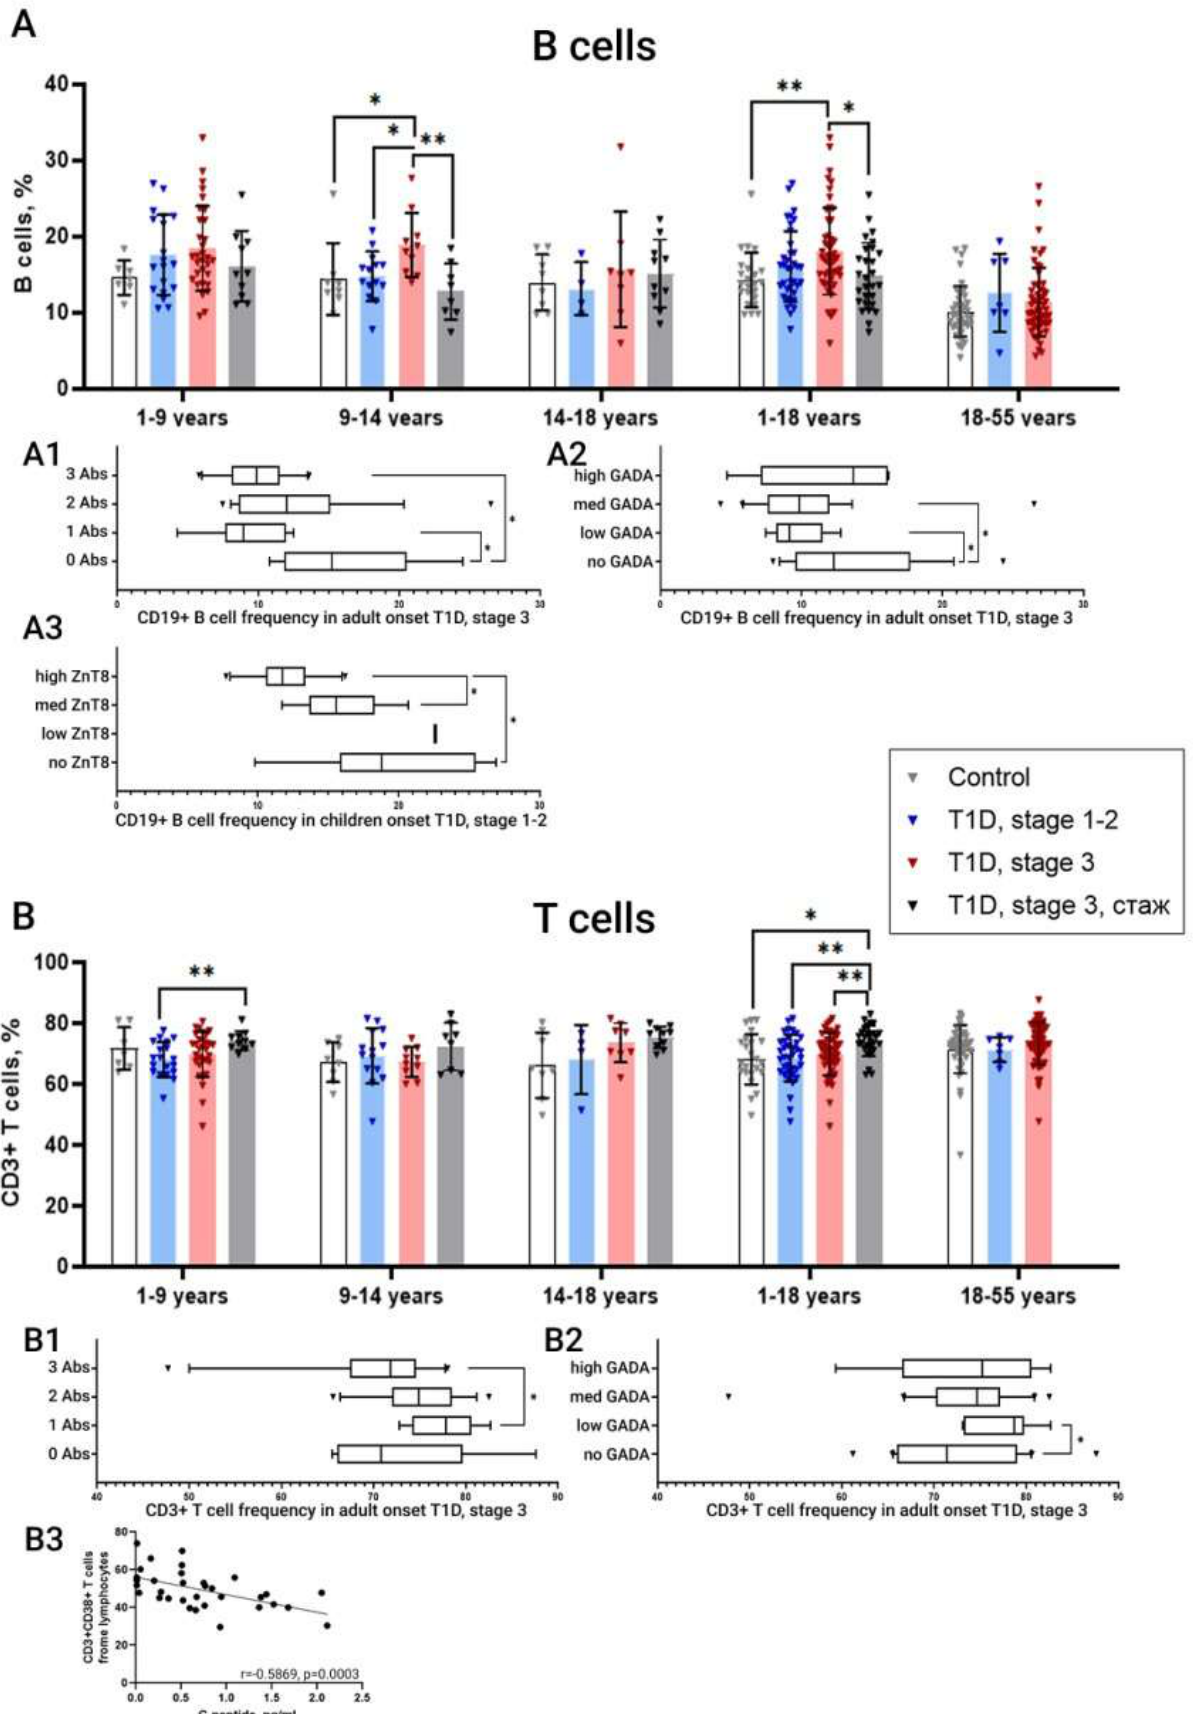
Figure 3.
Alterations in the frequencies of CD4+ and CD8+ T cells across the study groups. A. Changes in the proportion of circulating CD8+ T lymphocytes in different age groups of healthy volunteers and patients with stage 1-2 T1DM, stage 3 T1DM, and long-standing T1DM. Horizontal histograms: A1. Changes in the proportion of CD8+ T lymphocytes in adults with stage 3 T1DM according to the absence or presence of multiple autoantibodies. A2. Changes in the proportion of CD8+ T lymphocytes in adults with stage 3 T1DM according to the absence or presence of different levels of GADA. A3. Changes in the proportion of CD8+ T lymphocytes in children with stage 3 T1DM according to the absence or presence of different levels of GADA. A4. Changes in the proportion of CD8+HLA-DR-CD38+ T lymphocytes in children with stage 1-2 T1DM according to the absence or presence of different levels of GADA. A5. Inverse correlation between activated CD8+CD38+ T cells and C-peptide. B. Changes in the proportion of circulating CD4+ T lymphocytes in different age groups of healthy volunteers and patients with stage 1-2 T1DM, stage 3 T1DM, and long-standing T1DM. Horizontal histograms: B1. Changes in the proportion of CD4+ T lymphocytes in children with stage 3 T1DM according to the absence or presence of different levels of GADA. B2. Changes in the proportion of CD4+ T lymphocytes in children with stage 1-2 T1DM according to the absence or presence of different levels of IA-2A. B3.Inverse correlation between activated CD3+CD4+ T cells and C-peptide. B4. Inverse correlation between activated HLA-DR-CD38+ CD4+ T cells and C-peptide. Data are presented as medians with interquartile ranges. Significant differences are indicated by asterisks. * - p-value < 0.05, ** - p-value < 0.005, *** - p-value < 0.0001.
Figure 3.
Alterations in the frequencies of CD4+ and CD8+ T cells across the study groups. A. Changes in the proportion of circulating CD8+ T lymphocytes in different age groups of healthy volunteers and patients with stage 1-2 T1DM, stage 3 T1DM, and long-standing T1DM. Horizontal histograms: A1. Changes in the proportion of CD8+ T lymphocytes in adults with stage 3 T1DM according to the absence or presence of multiple autoantibodies. A2. Changes in the proportion of CD8+ T lymphocytes in adults with stage 3 T1DM according to the absence or presence of different levels of GADA. A3. Changes in the proportion of CD8+ T lymphocytes in children with stage 3 T1DM according to the absence or presence of different levels of GADA. A4. Changes in the proportion of CD8+HLA-DR-CD38+ T lymphocytes in children with stage 1-2 T1DM according to the absence or presence of different levels of GADA. A5. Inverse correlation between activated CD8+CD38+ T cells and C-peptide. B. Changes in the proportion of circulating CD4+ T lymphocytes in different age groups of healthy volunteers and patients with stage 1-2 T1DM, stage 3 T1DM, and long-standing T1DM. Horizontal histograms: B1. Changes in the proportion of CD4+ T lymphocytes in children with stage 3 T1DM according to the absence or presence of different levels of GADA. B2. Changes in the proportion of CD4+ T lymphocytes in children with stage 1-2 T1DM according to the absence or presence of different levels of IA-2A. B3.Inverse correlation between activated CD3+CD4+ T cells and C-peptide. B4. Inverse correlation between activated HLA-DR-CD38+ CD4+ T cells and C-peptide. Data are presented as medians with interquartile ranges. Significant differences are indicated by asterisks. * - p-value < 0.05, ** - p-value < 0.005, *** - p-value < 0.0001.
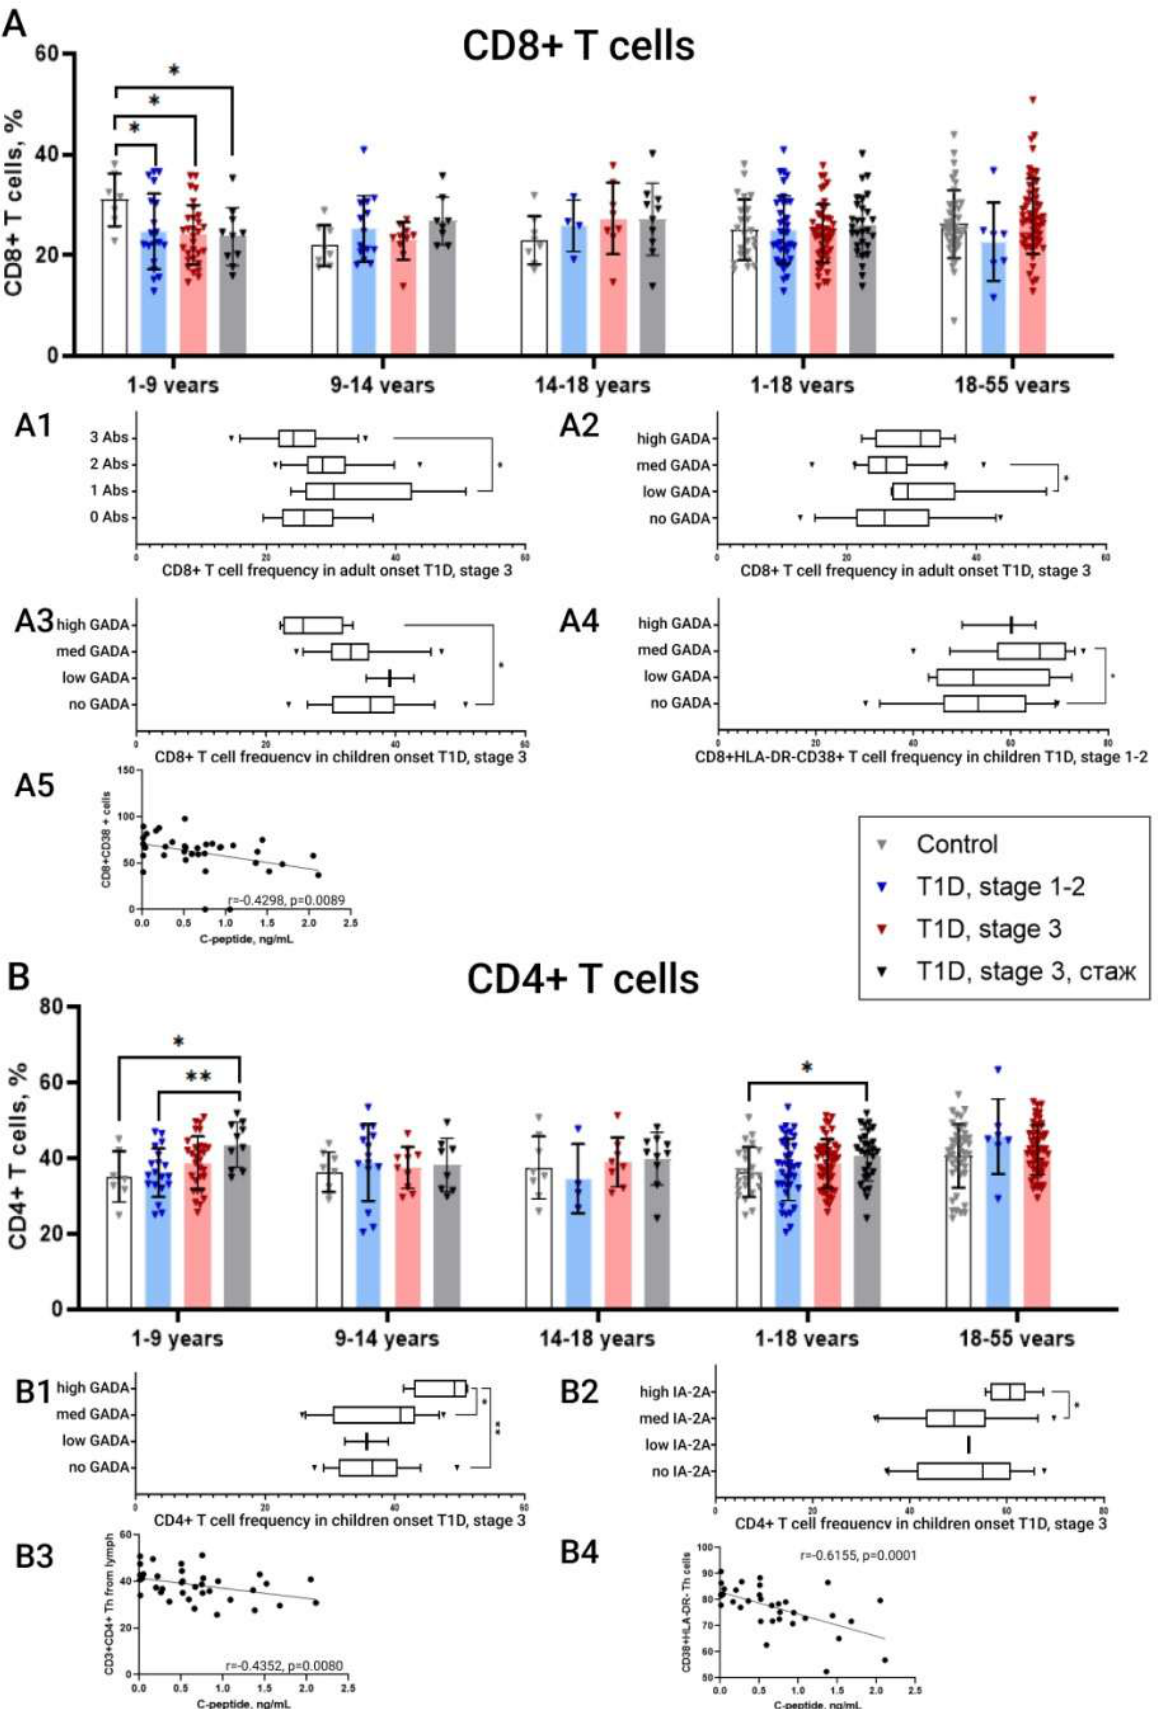
Figure 4.
Alterations in the frequencies of circulating NK cells and their subsets defined by CD56 and CD16 expression across different age groups of healthy volunteers, patients with stage 1-2 T1DM, stage 3 T1DM, and long-standing T1DM, as well as in subgroups stratified according to circulating autoantibody profiles. A. Changes in the frequency of the total CD3-CD19- NK-cell population across the study groups. Horizontal histograms: A1. Changes in the proportion of CD3-CD19- NK cells in adults with stage 3 T1DM according to the absence or presence of multiple autoantibodies. A2. Changes in the proportion of CD3-CD19- NK cells in adults with stage 3 T1DM according to the absence or presence of different levels of IA-2A. A3. Changes in the proportion of CD3-CD19- NK cells in children with stage 3 T1DM according to the absence or presence of different levels of IA-2A. A4. Correlation between CD3-CD19- NK cells and C-peptide. B. Changes in the frequency of CD56brightCD16- regulatory NK cells (NKregs) across the study groups. Horizontal histograms: B1. Changes in the proportion of NKregs in adults with stage 3 T1DM according to the absence or presence of different levels of IA-2A. B2. Changes in the proportion of total CD56bright NK cells in adults with stage 3 T1DM according to the absence or presence of different levels of IA-2A. C. Changes in the frequency of intermediate CD56brightCD16dim NK cells across the study groups. Horizontal histograms: C1. Changes in the proportion of CD56brightCD16dim NK cells in adults with stage 3 T1DM according to the absence or presence of multiple autoantibodies. C2. Changes in the proportion of CD56brightCD16dim NK cells in adults with stage 3 T1DM according to the absence or presence of different levels of ZnT8A. D. Changes in the frequency of effector CD56dimCD16bright NK cells (NKeff) across the study groups. Horizontal histograms: D1. Changes in the proportion of NKeff cells in adults with stage 3 T1DM according to the absence or presence of multiple autoantibodies. D2. Changes in the proportion of NKeff cells in adults with stage 3 T1DM according to the absence or presence of different levels of IA-2A. D3. Changes in the proportion of NKeff cells in children with stage 3 T1DM positive for one or two autoantibodies. Representative CD16/CD56 dot plots of NK cells from an adult patient at the onset of stage 3 T1DM are shown above panels B, C, and D, with arrows indicating the NK-cell subpopulations analysed. Data are presented as medians with interquartile ranges. Significant differences are indicated by asterisks. * - p-value < 0.05, ** - p-value < 0.005, *** - p-value < 0.0001.
Figure 4.
Alterations in the frequencies of circulating NK cells and their subsets defined by CD56 and CD16 expression across different age groups of healthy volunteers, patients with stage 1-2 T1DM, stage 3 T1DM, and long-standing T1DM, as well as in subgroups stratified according to circulating autoantibody profiles. A. Changes in the frequency of the total CD3-CD19- NK-cell population across the study groups. Horizontal histograms: A1. Changes in the proportion of CD3-CD19- NK cells in adults with stage 3 T1DM according to the absence or presence of multiple autoantibodies. A2. Changes in the proportion of CD3-CD19- NK cells in adults with stage 3 T1DM according to the absence or presence of different levels of IA-2A. A3. Changes in the proportion of CD3-CD19- NK cells in children with stage 3 T1DM according to the absence or presence of different levels of IA-2A. A4. Correlation between CD3-CD19- NK cells and C-peptide. B. Changes in the frequency of CD56brightCD16- regulatory NK cells (NKregs) across the study groups. Horizontal histograms: B1. Changes in the proportion of NKregs in adults with stage 3 T1DM according to the absence or presence of different levels of IA-2A. B2. Changes in the proportion of total CD56bright NK cells in adults with stage 3 T1DM according to the absence or presence of different levels of IA-2A. C. Changes in the frequency of intermediate CD56brightCD16dim NK cells across the study groups. Horizontal histograms: C1. Changes in the proportion of CD56brightCD16dim NK cells in adults with stage 3 T1DM according to the absence or presence of multiple autoantibodies. C2. Changes in the proportion of CD56brightCD16dim NK cells in adults with stage 3 T1DM according to the absence or presence of different levels of ZnT8A. D. Changes in the frequency of effector CD56dimCD16bright NK cells (NKeff) across the study groups. Horizontal histograms: D1. Changes in the proportion of NKeff cells in adults with stage 3 T1DM according to the absence or presence of multiple autoantibodies. D2. Changes in the proportion of NKeff cells in adults with stage 3 T1DM according to the absence or presence of different levels of IA-2A. D3. Changes in the proportion of NKeff cells in children with stage 3 T1DM positive for one or two autoantibodies. Representative CD16/CD56 dot plots of NK cells from an adult patient at the onset of stage 3 T1DM are shown above panels B, C, and D, with arrows indicating the NK-cell subpopulations analysed. Data are presented as medians with interquartile ranges. Significant differences are indicated by asterisks. * - p-value < 0.05, ** - p-value < 0.005, *** - p-value < 0.0001.
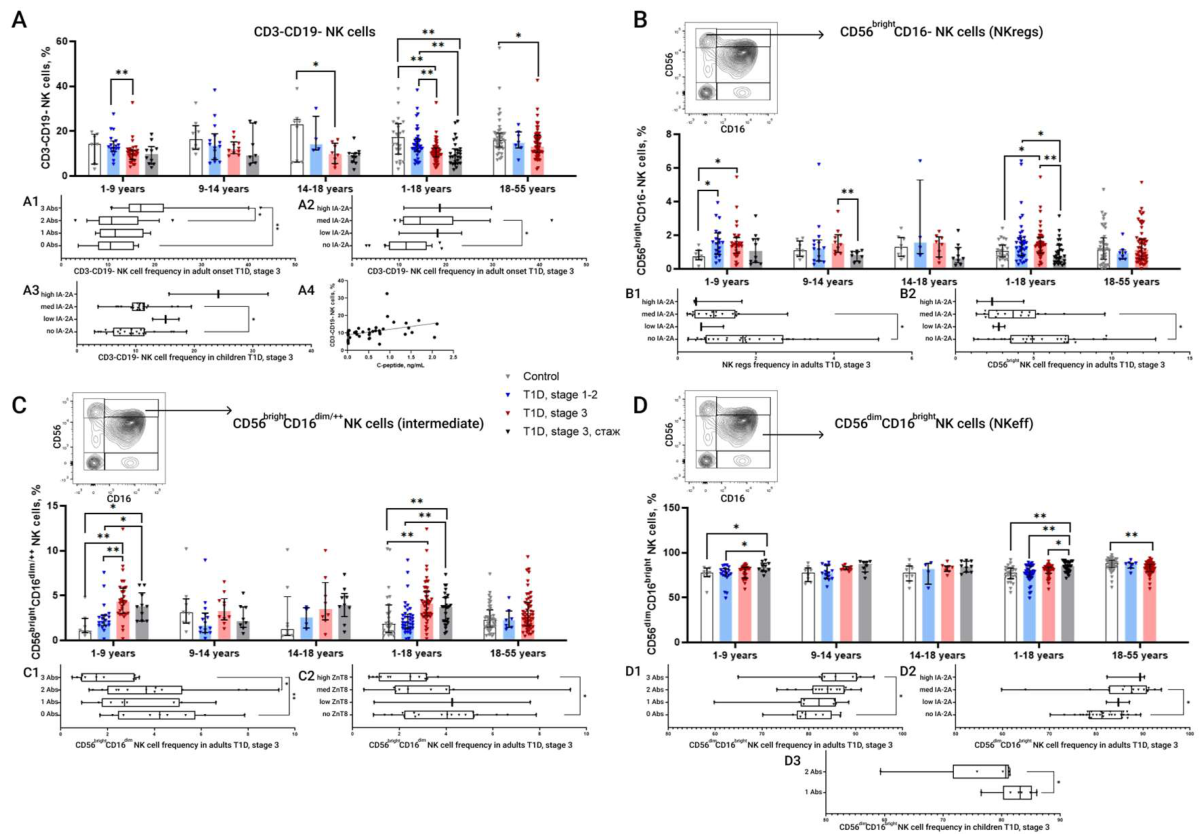
Figure 5.
Distribution of NK-cell subsets according to the co-expression of CD8, CD38, CD161, and NKG2A in the peripheral blood of patients at different stages of T1DM compared with healthy volunteers across different age groups. A. Proportion of CD8+ NK cells, calculated as the sum of CD8+CD38+ and CD8+CD38- NK cells. Horizontal histogram: A1. Changes in the proportion of CD8+ NK cells in adults with stage 3 T1DM according to the absence or presence of multiple autoantibodies. B. Proportion of CD8+CD38+ NK cells. Horizontal histograms: B1. Changes in the proportion of CD8+CD38+ NK cells in children with stage 3 T1DM according to positivity for one or two DAAs. B2.Changes in the proportion of CD38+ NK cells in adults with stage 3 T1DM according to the absence or presence of multiple autoantibodies. B3. Changes in the proportion of CD38+ NK cells in children with stage 1-2 T1DM according to the absence or presence of different levels of ZnT8A. C. Proportion of CD8+NKG2A+ NK cells. Horizontal histogram: C1. Changes in the proportion of CD8+NKG2A+ NK cells in adults with stage 3 T1DM according to the absence or presence of different levels of GADA. D. Proportion of CD8+CD161+ NK cells. Horizontal histogram: D1. Changes in the proportion of CD8+CD161+ NK cells in adults with stage 3 T1DM according to the absence or presence of multiple autoantibodies. E. Proportion of CD8+CD161+ NK cells. In the upper left, a representative dot plot of NK cells from an adult patient at the onset of stage 3 T1DM is shown, used to define the target NK-cell population indicated by the arrow. Data are presented as medians with interquartile ranges. Significant differences are indicated by asterisks. * - p-value < 0.05, ** - p-value < 0.005, *** - p-value < 0.0001.
Figure 5.
Distribution of NK-cell subsets according to the co-expression of CD8, CD38, CD161, and NKG2A in the peripheral blood of patients at different stages of T1DM compared with healthy volunteers across different age groups. A. Proportion of CD8+ NK cells, calculated as the sum of CD8+CD38+ and CD8+CD38- NK cells. Horizontal histogram: A1. Changes in the proportion of CD8+ NK cells in adults with stage 3 T1DM according to the absence or presence of multiple autoantibodies. B. Proportion of CD8+CD38+ NK cells. Horizontal histograms: B1. Changes in the proportion of CD8+CD38+ NK cells in children with stage 3 T1DM according to positivity for one or two DAAs. B2.Changes in the proportion of CD38+ NK cells in adults with stage 3 T1DM according to the absence or presence of multiple autoantibodies. B3. Changes in the proportion of CD38+ NK cells in children with stage 1-2 T1DM according to the absence or presence of different levels of ZnT8A. C. Proportion of CD8+NKG2A+ NK cells. Horizontal histogram: C1. Changes in the proportion of CD8+NKG2A+ NK cells in adults with stage 3 T1DM according to the absence or presence of different levels of GADA. D. Proportion of CD8+CD161+ NK cells. Horizontal histogram: D1. Changes in the proportion of CD8+CD161+ NK cells in adults with stage 3 T1DM according to the absence or presence of multiple autoantibodies. E. Proportion of CD8+CD161+ NK cells. In the upper left, a representative dot plot of NK cells from an adult patient at the onset of stage 3 T1DM is shown, used to define the target NK-cell population indicated by the arrow. Data are presented as medians with interquartile ranges. Significant differences are indicated by asterisks. * - p-value < 0.05, ** - p-value < 0.005, *** - p-value < 0.0001.
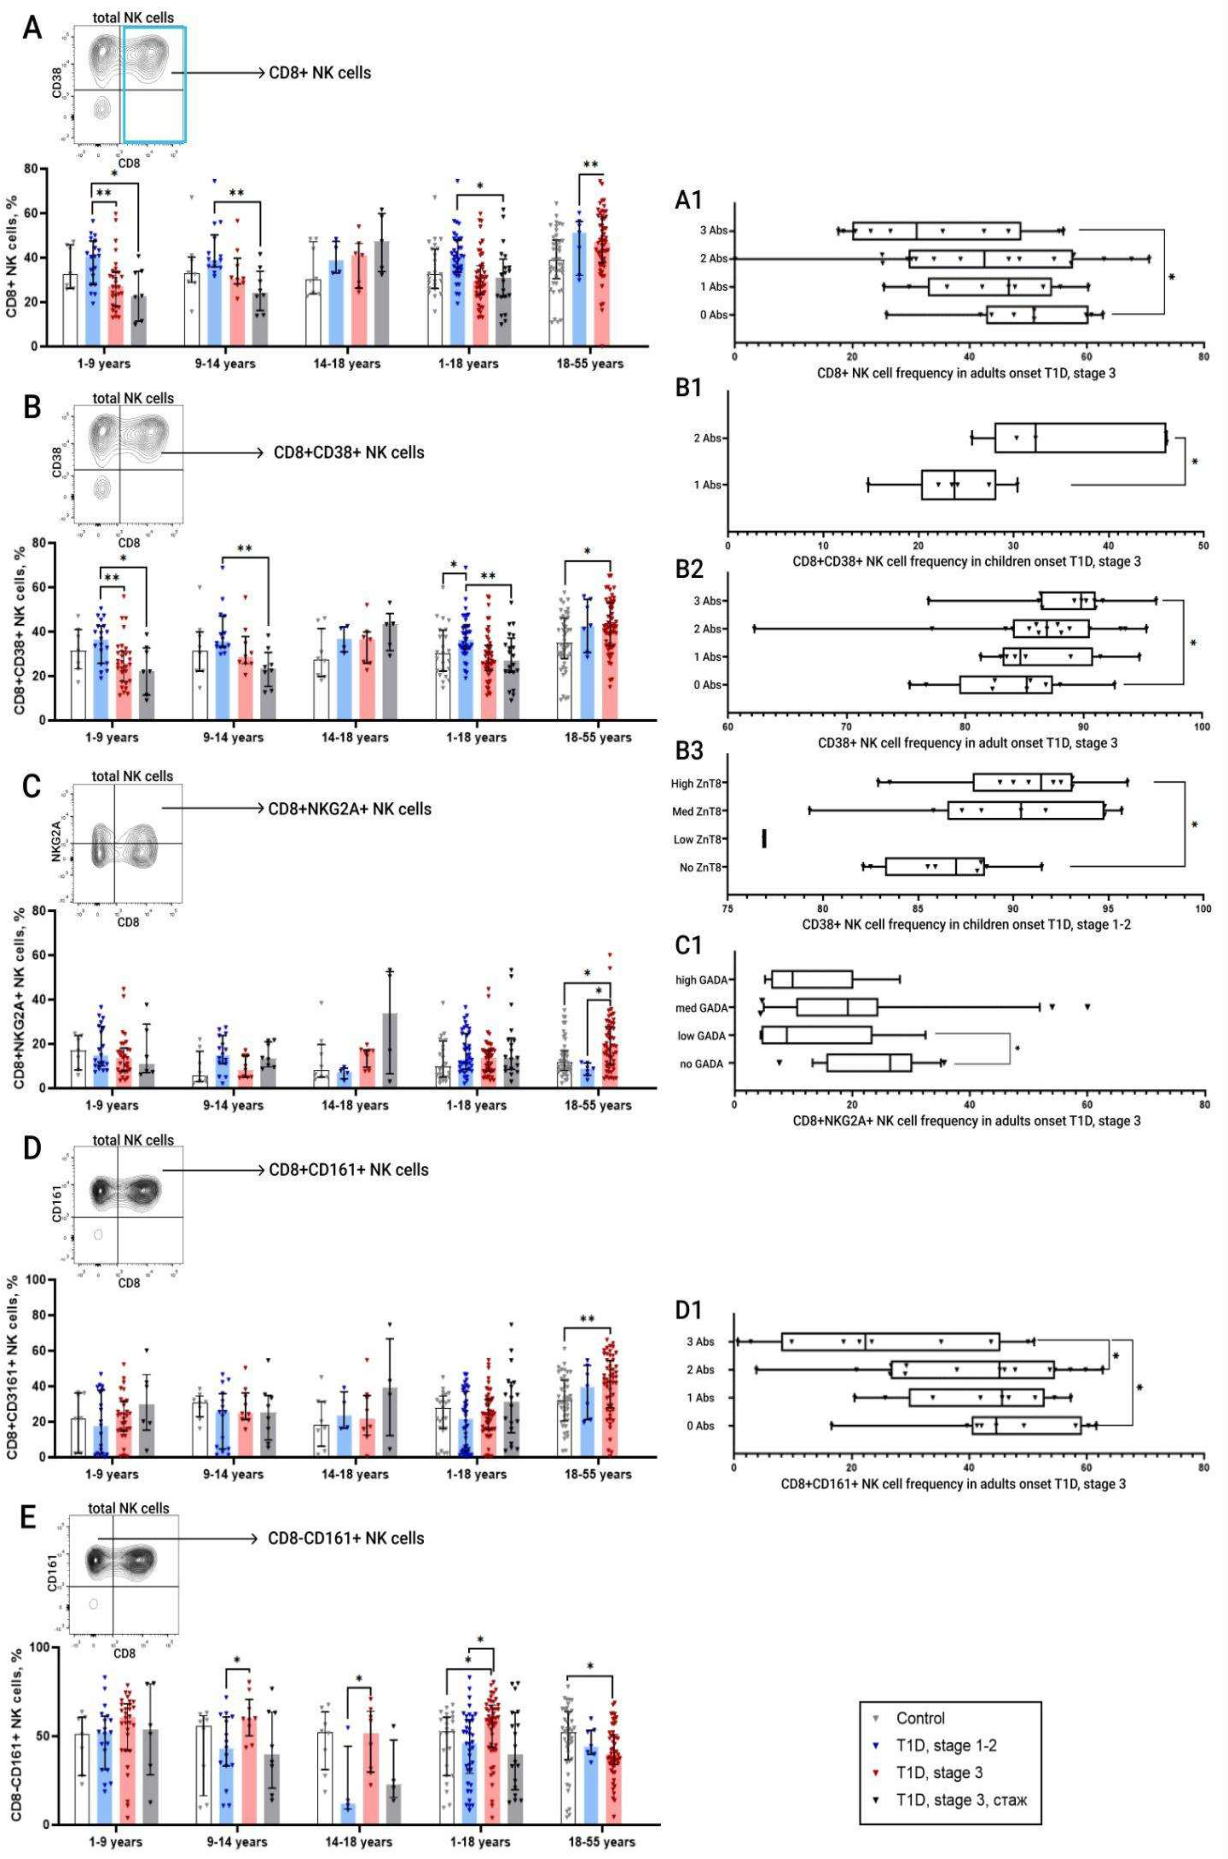
Figure 6.
Cytotoxic potential of CD8+ T cells, CD16+ NK cells, CD56+ NK cells, and the CD8+ NK-cell subset, assessed on the basis of the presence of perforin- and granzyme-containing granules. A. Cytotoxic potential of CD8+ T cells as assessed by perforin content. B. Cytotoxic potential of CD8+ T cells as assessed by granzyme B content. C. Cytotoxic potential of CD16+ NK cells as assessed by perforin content. D. Cytotoxic potential of CD56+ NK cells as assessed by perforin content. E. Cytotoxic potential of CD8+ NK cells as assessed by perforin content. F. Cytotoxic potential of CD8+ NK cells as assessed by granzyme B content. Data are presented as medians with interquartile ranges. Significant differences are indicated by asterisks. * - p-value < 0.05, ** - p-value < 0.005, *** - p-value < 0.0001.
Figure 6.
Cytotoxic potential of CD8+ T cells, CD16+ NK cells, CD56+ NK cells, and the CD8+ NK-cell subset, assessed on the basis of the presence of perforin- and granzyme-containing granules. A. Cytotoxic potential of CD8+ T cells as assessed by perforin content. B. Cytotoxic potential of CD8+ T cells as assessed by granzyme B content. C. Cytotoxic potential of CD16+ NK cells as assessed by perforin content. D. Cytotoxic potential of CD56+ NK cells as assessed by perforin content. E. Cytotoxic potential of CD8+ NK cells as assessed by perforin content. F. Cytotoxic potential of CD8+ NK cells as assessed by granzyme B content. Data are presented as medians with interquartile ranges. Significant differences are indicated by asterisks. * - p-value < 0.05, ** - p-value < 0.005, *** - p-value < 0.0001.
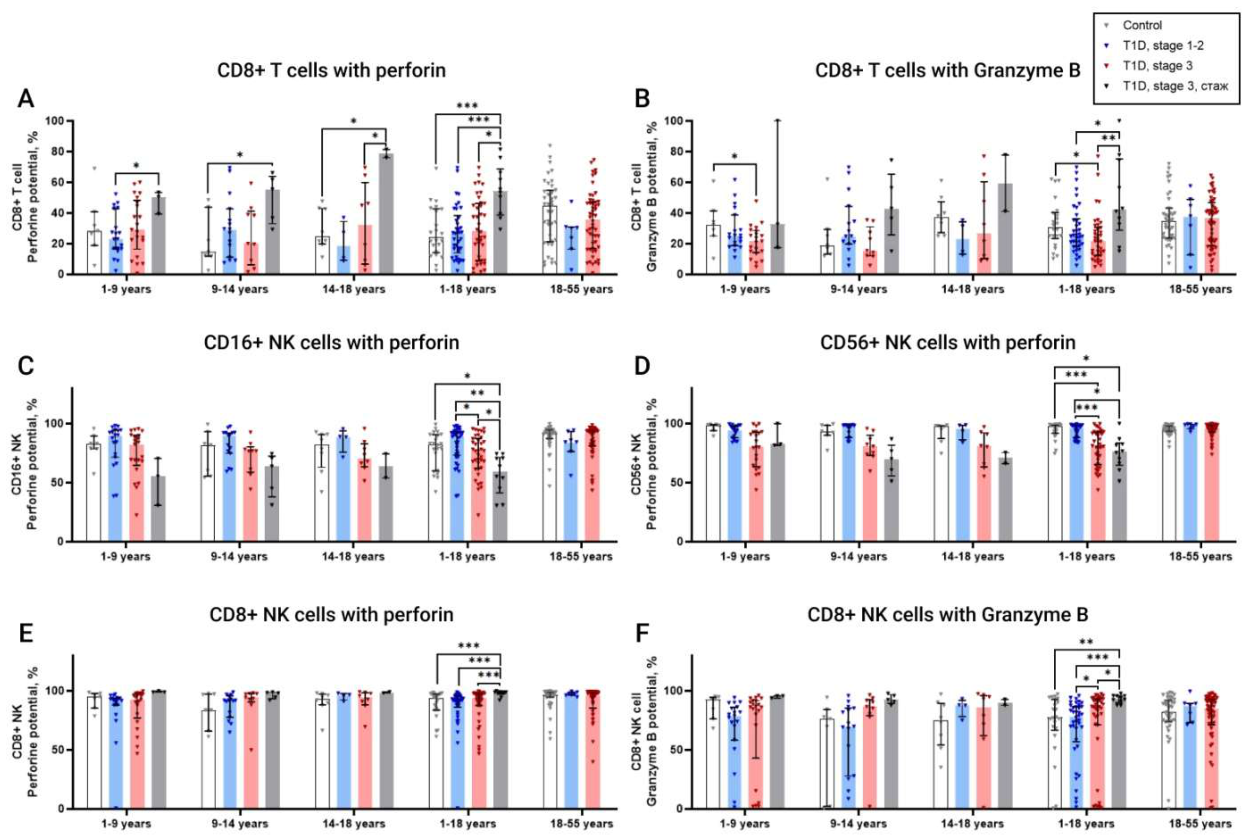
Figure 7.
Changes in the frequency of circulating MAIT cells and their subsets across different age groups of healthy volunteers and patients with stage 1-2 T1DM, stage 3 T1DM, and long-standing T1DM. The effect of the presence/absence of DKA on lymphocyte subpopulations. A. Changes in the proportion of circulating CD3+ MAIT cells across the study groups. Upper left - representative TCR Vα7.2/TCR Vα24-Jα18 dot plot used to identify the total CD3+ MAIT-cell population as TCR Vα7.2-positive cells. B. Changes in the proportion of circulating CD8+ MAIT cells across the study groups. Upper left - TCR Vα7.2/CD161 dot plot used to identify the CD8+ MAIT-cell subset as TCR Vα7.2+CD161+ cells. C. Horizontal histogram showing changes in the proportion of CD3+ MAIT cells in children with stage 1-2 T1DM according to the absence or presence of different levels of GADA. D. Correlation between CD3+ MAIT cells and C-peptide. E1-E2. Histograms showing the relative frequencies of CD3-CD56+ NK cells, CD3-CD8+ NK cells, NKregs, NKeff, CD161+CD8+ T cells, CD161+DN+ T cells, and CD8+TCR Vδ2+ T cells in adult patients with T1DM with and without a history of DKA. E3. Histogram showing seropositivity for different numbers of diabetes-associated autoantibodies in adult patients with T1DM with and without a history of DKA. F1. Histograms showing the relative frequencies of CD3+CD56+ NKT cells, CD4+CD8+ double-positive (DP) cells, activated CD8+CD38+HLA-DR+ T cells, and CD8+CD161+TCR Vδ2 T cells in children with T1DM with and without a history of DKA. F2. Histogram showing seropositivity for different numbers of diabetes-associated autoantibodies in children with T1DM with and without a history of DKA.
Figure 7.
Changes in the frequency of circulating MAIT cells and their subsets across different age groups of healthy volunteers and patients with stage 1-2 T1DM, stage 3 T1DM, and long-standing T1DM. The effect of the presence/absence of DKA on lymphocyte subpopulations. A. Changes in the proportion of circulating CD3+ MAIT cells across the study groups. Upper left - representative TCR Vα7.2/TCR Vα24-Jα18 dot plot used to identify the total CD3+ MAIT-cell population as TCR Vα7.2-positive cells. B. Changes in the proportion of circulating CD8+ MAIT cells across the study groups. Upper left - TCR Vα7.2/CD161 dot plot used to identify the CD8+ MAIT-cell subset as TCR Vα7.2+CD161+ cells. C. Horizontal histogram showing changes in the proportion of CD3+ MAIT cells in children with stage 1-2 T1DM according to the absence or presence of different levels of GADA. D. Correlation between CD3+ MAIT cells and C-peptide. E1-E2. Histograms showing the relative frequencies of CD3-CD56+ NK cells, CD3-CD8+ NK cells, NKregs, NKeff, CD161+CD8+ T cells, CD161+DN+ T cells, and CD8+TCR Vδ2+ T cells in adult patients with T1DM with and without a history of DKA. E3. Histogram showing seropositivity for different numbers of diabetes-associated autoantibodies in adult patients with T1DM with and without a history of DKA. F1. Histograms showing the relative frequencies of CD3+CD56+ NKT cells, CD4+CD8+ double-positive (DP) cells, activated CD8+CD38+HLA-DR+ T cells, and CD8+CD161+TCR Vδ2 T cells in children with T1DM with and without a history of DKA. F2. Histogram showing seropositivity for different numbers of diabetes-associated autoantibodies in children with T1DM with and without a history of DKA.
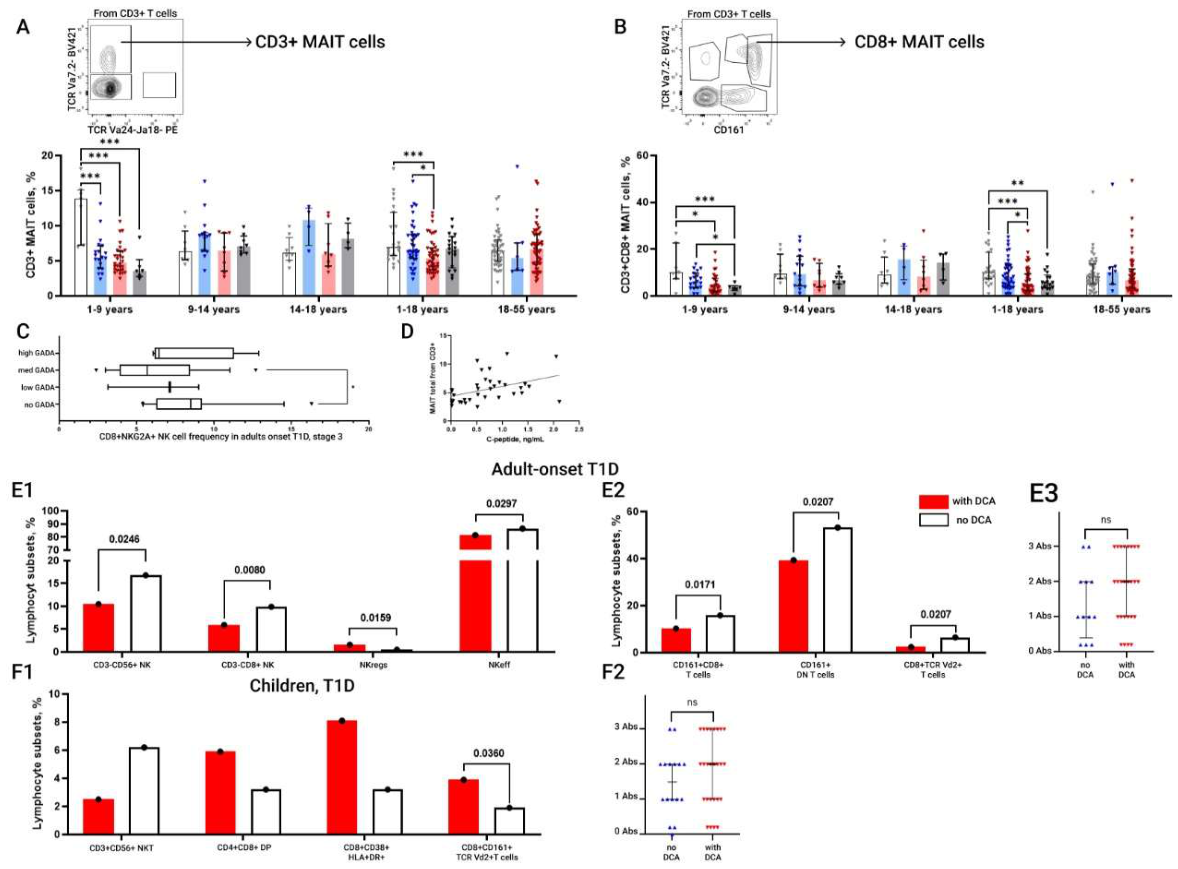
Figure 8.
Immunophenotypes identified across different patient groups.
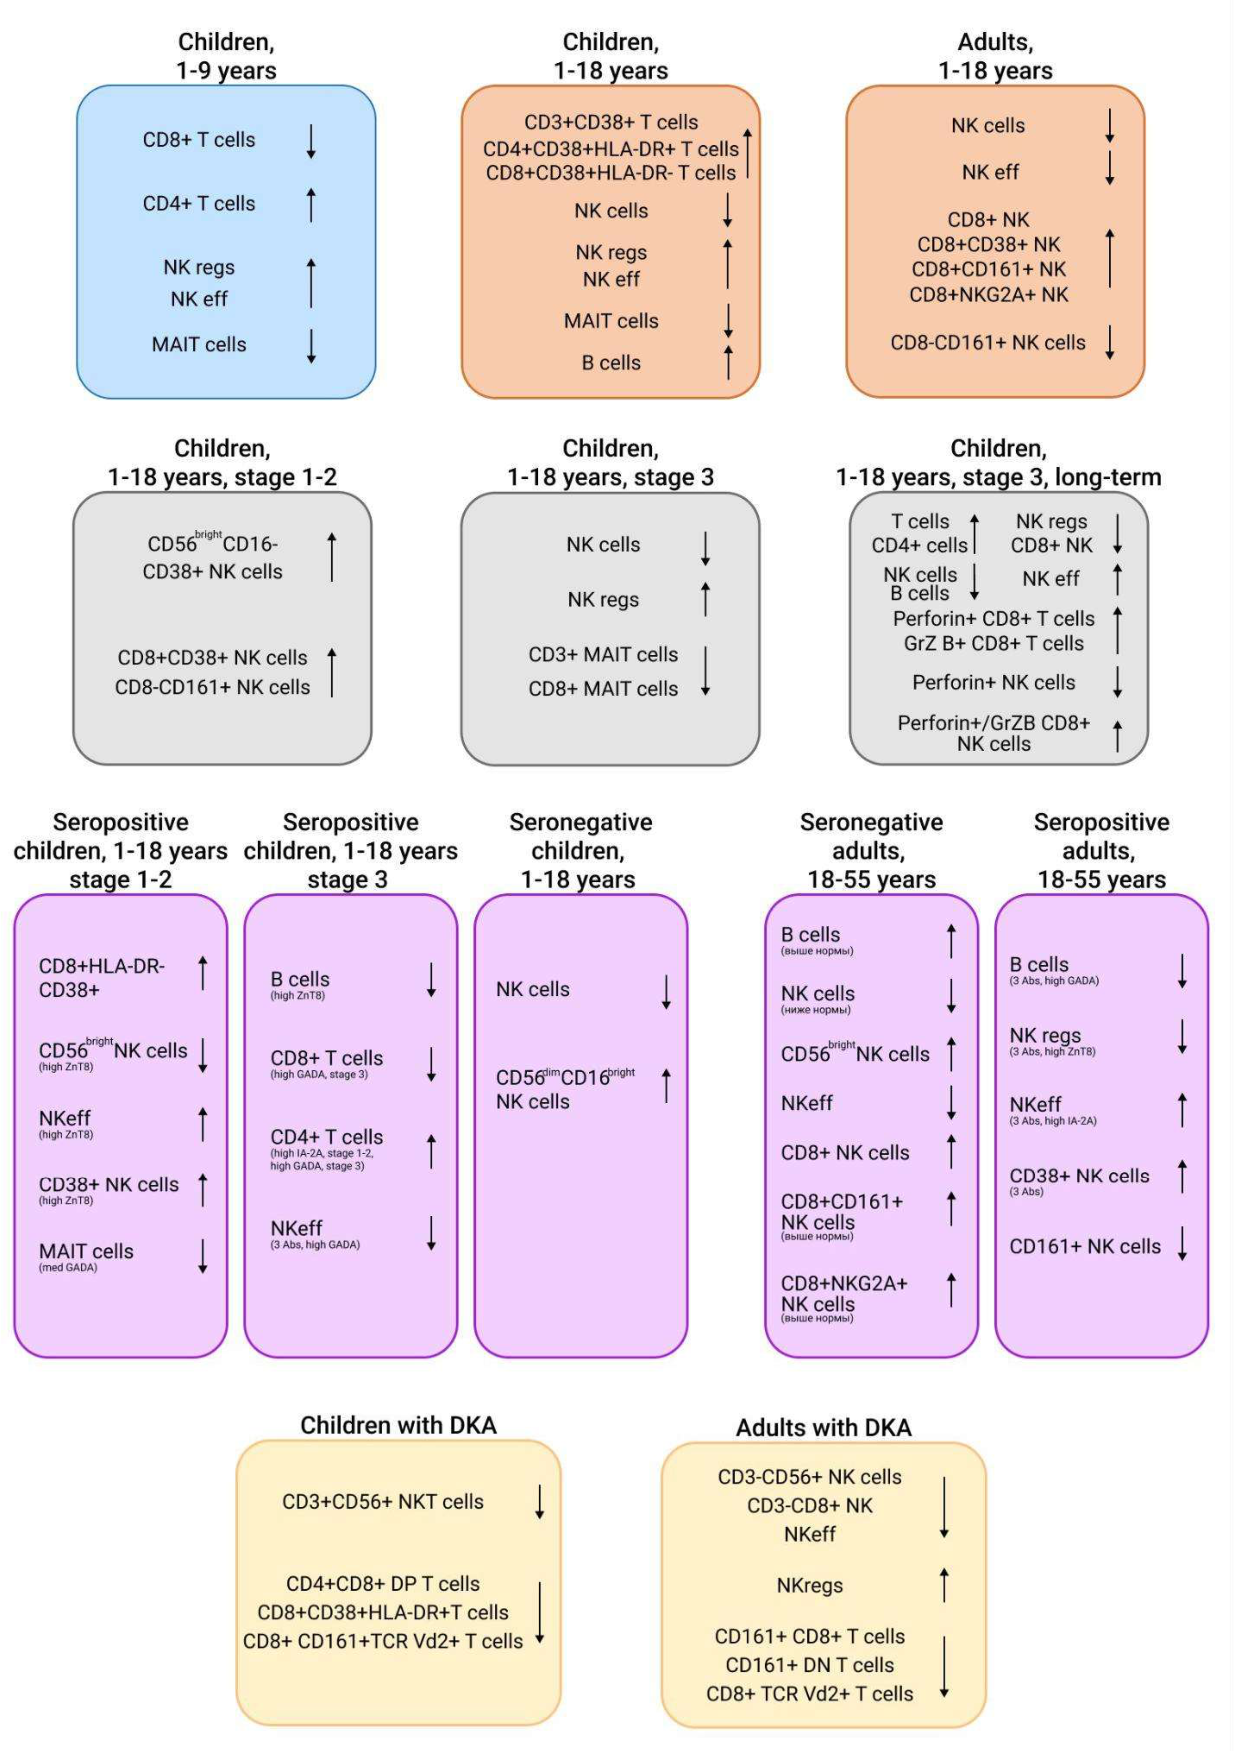

Table 1.
Clinical and laboratory characteristics of the study groups.
| Parameter | Reference range | HD, 1-18 years (n=23) |
T1DM, stage 1-2, 1-18 years (n=40) |
T1DM, stage 3, disease duration <1 year, 1-18 years (n=49) | T1DM, stage 3, disease duration >1 year, 1-18 years (n=28) | HD, 18-55 years (n=42) |
T1DM, stage 1-2, 18-55 years (n=7) | T1DM, stage 3, disease duration <1 year, 18-55 years (n=56) |
|---|---|---|---|---|---|---|---|---|
| Age, years | - | 11 [8; 14] | 8 [6; 8] | 7 [4;11.5] # | 11 [7;15] | 28 [24; 37] | 25 [19.5; 32.5] | 27 [20; 31] # |
| Male sex, n (%) | - | 10 (47,6%) | 23 (58%) | 26 (63%) | 13 (46.43%) | 15 (34,9%) | 3 (60%) | 35 (56.5%) |
| BMI, kg/m² | - | - | - | - | 22.86 [20.7; 25.3] | 21.12 [17.6; 21.5] | 22 [19.8; 24.31] | |
| Diabetes duration, months | - | - | - | 2 [1;8] | 40.5 [24.25; 72] | - | - | 2 [1; 6] |
| Glucose, mmol/L | 3.1-6.1 | - | 4.65 [4.2; 5.1] | 6.2 [5.26; 9.55] | 8.38 [5.535; 9.46] | 4.8 [4.3; 5] | 5.1 [4.6; 5.25] | 6.73 [5.8; 8.5] |
| HbA1c, % | 4.0-6.0 | 5.4 [5.2;5.5] | 5.3 [5.2;5.5] | 6.9 [6.15;8.55] ### | 7.65 [7; 9.025] | 5.1 [4.9; 5.3] | 5 [5; 5.8] | 7.25 [6.375; 8.625] ### |
| Insulin, µIU/mL | - | - | - | - | - | 8.1 [6.16; 12.6] | 9.95 [7.68; 11.85] | 5.5 [3.25; 10.075] |
| C-peptide, ng/mL | 1.1-4.4 | - | 1.265 [0.9; 1.7] | 0.67 [0.2395; 1.155] | 0.01 [0.01; 0.6] | 1.885 [1.5; 2.4] | 1.76 [1.3; 2.2] | 1.02 [0.7875; 1.47] ### |
| GADA, U/mL | 0-30 | 0,3550 [0.1; 3.1] | 236 [14.7; 437.5] *** | 32.01 [3.98; 250] ### | 3.39 [0.55; 57.25] | 0.18 [0.1; 1.3] | 250 [243; 269.15] *** | 134.16 [16.35; 250] ### |
| IAA, U/mL | 0-30 | 2.48 [1.478; 4.025] | 1.785 [1.07; 3.738] | 3.64 [2.15; 11.3] | 4.995 [3.12; 12.5] | 2.2 [1.6; 4.4] | 3.3 [2.12; 4.39] | 5.47 [2.94; 8.5] |
| ICA, U/mL | 0-1 | 0.31 [0.23; 0.43] | 0.26 [0.24; 0.31] | 0.33 [0.23; 0.44] | 0.31 [0.23; 0.4] | 0.36 [0.25; 0.46] | 0.32 [0.195; 1.46] | 0.28 [0.23; 0.4] |
| IA-2A, U/mL | 0-10 | 1.385 [0.1; 7.858] | 375 [22.73; 400] *** | 195.6 [1.835; 295.9] ### | 10 [1.15; 88.65] | 1.485 [0.57; 5] | 80.3 [3.96; 260.3]** | 16.98 [1.7; 250] ### |
| ZnT8 antibodies, U/mL | 0-45 | 4.53 [4;9.085] | 327 [7.88; 1936]*** | 306.6 [11.78; 1761] ### | 4.405 [1; 7.81] | 4.83 [3.36; 7.7] | 2000 [1019.22; 2000] *** | 147.095 [5.8; 2000] ### |
Notes to Table 1. Data are presented as Medians [Q1; Q3] for quantitative variables and as n (%) for categorical variables. Statistically significant differences are shown in bold. HD, healthy donors; T1D, type 1 diabetes; BMI, body mass index; HbA1c, glycated hemoglobin; HDL, high-density lipoprotein; LDL, low-density lipoprotein; eGFR, estimated glomerular filtration rate; GAD, glutamic acid decarboxylase; IAA, insulin autoantibodies; ICA, islet cell antibodies; IA-2, insulinoma-associated antigen 2; ZnT8, zinc transporter 8. p-values were taken from the provided Prism output. Significant differences are indicated in bold and by the following symbols: * - p-value between HD and T1D, стадия 1-2. * - p-value < 0.05, ** - p-value < 0.005, *** - p-value < 0.0001; # - p-value between HD and T1D, # - p-value < 0.05, ## - p-value < 0.005, ### - p-value < 0.0001;.
Disclaimer/Publisher’s Note: The statements, opinions and data contained in all publications are solely those of the individual author(s) and contributor(s) and not of MDPI and/or the editor(s). MDPI and/or the editor(s) disclaim responsibility for any injury to people or property resulting from any ideas, methods, instructions or products referred to in the content. |
© 2026 by the authors. Licensee MDPI, Basel, Switzerland. This article is an open access article distributed under the terms and conditions of the Creative Commons Attribution (CC BY) license (http://creativecommons.org/licenses/by/4.0/).
Copyright: This open access article is published under a Creative Commons CC BY 4.0 license, which permit the free download, distribution, and reuse, provided that the author and preprint are cited in any reuse.