

Submitted:
20 October 2026
Posted:
21 October 2026
You are already at the latest version
Abstract
Reliable prediction of the transient temperature field is essential for controlling melt-pool geometry, cooling rate, microstructure, and ultimately part quality in directed energy deposition-laser beam (DED-LB). Conventional gaussian double ellipsoidal (GDE) heat source model, developed largely for welding and coaxial configurations, cannot capture the asymmetric energy input of an off-axis beam or the homogenising effect of the powder stream of a top-hat laser profile. This study proposes a modified double-ellipsoidal heat source that combines a top-hat energy distribution with an explicit geometric correction for off-axis laser. The model was numerically implemented in Abaqus (an FEA software) using a DFLUX subroutine and progressive element activation, and validated against single track deposition of 316L stainless steel (SS316L) on a G250 mild steel substrate (3.3 kW, 2000 mm min⁻¹, 25° laser beam inclination). The numerical predictions were validated using in-situ infrared thermography, an embedded thermocouple, and metallographic measurements of the deposited track. Compared with the conventional Gaussian double-ellipsoidal model, the proposed top-hat double-ellipsoidal formulation more accurately reproduced the experimentally observed asymmetric and elongated melt-pool morphology. In particular, the predicted transverse melt-pool width differed from the experimental measurement by only 6%, compared with a 17% deviation for the conventional model, while melt-pool depth errors remained within 7–9%. Peak surface and subsurface temperatures deviated from measurements by 8.9% and 2.4%, respectively, and liquidus–solidus cooling rates along the track agreed within 10%. These results demonstrate that the proposed model provides an efficient and physically representative approach for simulating thermal fields in off-axis DED-LB and offers a useful foundation for process optimisation, multi-track deposition analysis, and thermal–microstructural property prediction.
Keywords:
additive manufacturing
; DED-LB
; FEA
; top-hat energy distribution
; SS316L
; in-situ thermal monitoring
; melt pool morphology
; cooling rate
1. Introduction
From electric vehicles to aerospace and biomedicine, metal additive manufacturing (MAM) is transforming high-end manufacturing sectors. By overcoming the design limitations of conventional manufacturing, it enables greater geometric freedom, reduces material waste, accelerates prototyping, and allows multiple components to be consolidated into a single part [1]. The rapid growth of the global MAM market is evidenced by its projected growth from USD 6.68 billion in 2025 to USD 23.58 billion by 2035, at a CAGR of 13.44%. [2].
Directed energy deposition (DED) distinguishes itself from other MAM processes through its ability to produce large-scale components, repair existing parts, and fabricate functionally graded materials through the layer-by-layer deposition of metal. Unlike powder bed fusion (PBF) methods, which are constrained by build chamber dimensions and are primarily suited for small-to-medium components, DED offers considerable flexibility in processing scale, material selection, and deposition strategy [3,4]. DED-LB [5] employs a concentrated laser beam (as heat source) to melt powder or wire feedstock onto a substrate, forming a metallurgical bond between the successive layers.
Powder delivery nozzles in DED-LB are predominantly categorized by feed orientation into off-axis and coaxial designs. The latter encompasses continuous coaxial, discrete coaxial, and central-feed configurations with an annular heat source [6]. Coaxial systems deliver powder symmetrically around the laser beam through a conical nozzle, whereas off-axis configurations employ a separate nozzle positioned at an angle to the laser axis. Although coaxial feeding can provide greater process consistency when depositing complex geometries, off-axis configurations offer simpler nozzle designs, improved accessibility for in-situ monitoring, and greater flexibility in controlling the material-feed direction [7]. Off-axis DED-LB is a well-established technique, with applications demonstrated in the deposition of AISI 431 martensitic stainless steel [8] and multilayer SS316L builds, including investigations into the effect of oblique laser incidence on residual stress [9].
SS316L, an austenitic stainless steel, is extensively used in DED owing to its excellent weldability, high corrosion resistance, and favourable mechanical properties. Its stable austenitic structure and low carbon content limit solidification cracking and sensitisation during the rapid thermal cycling characteristic of MAM processes [10,11]. DED fabricated SS316L generally achieves yield strengths of 400–500 MPa, and tensile strengths of 600–700 MPa [12]. However, these properties are highly sensitive to thermal history, which is governed by the heat input characteristics and deposition strategy [13,14]. Consequently, reliable prediction of the transient temperature field is essential for understanding and controlling DED-LB processes [15,16].
Various modelling strategies are employed to predict thermal behaviour, inherently balancing physical accuracy against computational expense. Analytical moving-source solutions based on Rosenthal [17] and Rykalin [18] , offer closed-form estimates of temperature distribution but rely on simplifying assumptions that limit their accuracy for the nonlinear, multi-physics conditions of DED-LB. Computational fluid dynamics (CFD) approaches address this limitation by explicitly resolving melt-pool fluid flow, marangoni convection, and solidification behaviour in greater physical detail [19]. However, the rigorous spatial and temporal discretization required to resolve free surface and multiphase dynamics imposes prohibitive computational costs, limiting their feasibility for full-scale, multi-track, or multi-layer components [20,21]. FEA modeling approach offers a practical balance between accuracy and cost, making it the most widely used approach for MAM process simulation [19,22].
In a typical FEA formulation, the laser is represented as a moving heat source, while material addition is captured through progressive element activation or an equivalent deposition strategy [22]. Among available heat source formulations, the double-ellipsoidal model proposed by Goldak et al. [23], has become one of the most widely adopted approaches for thermal modeling in welding and MAM. Its appeal lies in accounting for energy penetration into the substrate while offering four calibratable geometric parameters (a, b, , ) that can be tuned to match experimentally observed melt pool dimensions. Given this flexibility, researchers have modified the Goldak model in several ways to extend it beyond arc welding. Some studies reshaped the ellipsoids elongating the source and averaging it over time to speed up computation in DED wall builds [24], or using double-bi-ellipsoidal shapes to better capture deep, full-penetration welds [25]. Others modified the energy distribution itself adding a laser-penetration parameter to more realistically represent absorbed energy [26]. Despite this extensive adaptation, the majority of these modifications retain the model’s underlying Gaussian spatial energy distribution, in which intensity is assumed to decay exponentially from the beam centre [23]. This assumption works well for many conventional laser beams, but it breaks down for high-power lasers, where beam-shaping optics create a more uniform, top-hat intensity profile instead [27,28]. Unlike a Gaussian beam, a top-hat beam delivers nearly constant energy across its width with a sharp cut-off at the edges producing noticeably different thermal gradients and melt-pool shapes [28,29].
Off-axis deposition adds a layer of complexity that conventional asymmetric thermo-mechanical modeling frameworks do not fully capture [22]. The off-axis configuration also causes variable powder catchment efficiency and localised, non-uniform energy absorption, further departing from the assumptions built into classical heat source models and necessitating generalized, tilt-adapted formulations [30,31].
Despite the development of various thermal models for DED, significant challenges remain in accurately representing top-hat beam profiles and off-axis deposition configurations. This study addresses that gap by developing a modified double-ellipsoidal heat source with a top-hat energy distribution to represent off-axis energy deposition. The resulting finite element framework was verified using real-time, in-situ thermal measurements obtained during single-track deposition of SS316L.
2. Materials and Methods
2.1. Experimental Setup and Single Track Deposition
Single-track deposition experiments were conducted using gas-atomised commercial-grade SS316L powder with a particle size distribution of 53–106 µm delivered at a feed rate of 50 g min⁻¹ on a G250 mild-steel substrate. The chemical compositions (% wt) of cladding and substrate materials are given in Table 1. Depositions were performed on a proprietary DED-LB system equipped with five degrees of freedom and a near-infrared diode laser with a maximum output of 16 kW . The laser delivered a uniform top-hat intensity distribution and was characterised by a focal distance of 500 mm, a rayleigh length (depth of focus) of 47.5 mm, and a circular spot diameter of 4.8 mm. An off-axis, oblique-incidence configuration was adopted, in which the laser head was tilted within the plane (X-Z) of the cladding direction, inclined approximately 25° from the vertical (Z-axis), while the powder delivery nozzle remained along the Z-axis (Figure 1 ).
Single-track deposition was performed using a top-hat laser beam with a diameter of mm, a laser power of kW, and a scanning speed of 2000 mm . Under these parameters, stable and continuous tracks were obtained with minimal spatter, no deep vapour cavity was observed, and no evidence of keyhole-mode melting [9]. All these indicate that the melt pool was operated predominantly in the conduction mode. Single track was deposited over a length of 40 mm. Prior to deposition, the substrate was preheated to . The thermal response during deposition was monitored using a short-wavelength (500–540 nm spectral range) infrared camera Optris PI 05M (Optris GmbH, Berlin, Germany) operating at a frame rate of 80 Hz [34] . This short-wavelength detection band was selected to minimise the sensitivity of the temperature measurement to uncertainty in surface emissivity. Under Wien’s approximation to Planck’s law, the relative temperature error caused by an emissivity error, which is proportional to the sensing wavelength [35]. Shorter wavelengths therefore reduce this error, which is particularly beneficial for reflective metallic melt pools [36]. Preliminary calibration of the thermal imaging camera was performed using an SS316L block placed inside a muffle furnace capable of reaching 1850 °C, under a continuous argon gas shield. The block temperature was measured with B-type thermocouples, which can read up to for short durations, and the camera was calibrated over a range of to in increments . Benchmarking camera measurements against reference thermocouple readings during steady-state temperature levels demonstrated that an effective emissivity setting of yielded the closest agreement with actual surface temperatures. Consequently, an effective emissivity of was adopted for all subsequent in-situ DED-LB experiments to maintain measurement consistency.
In parallel, a K-type thermocouple was embedded laterally through the side of the substrate, with the sensing junction positioned approximately 6 mm below the top surface and at the longitudinal midpoint of the 40 mm deposition track (Figure 1). The measured subsurface temperature history was used for validation of the thermal model by comparing the experimentally measured temperature profile with the corresponding simulated temperature evolution at the thermocouple location.
2.2. Sample Preparation
Following deposition, each single-track specimen was removed from the circular substrate as a rectangular block. The specimens were then sectioned at plane C (Figure 2(a)), approximately 15 mm from the start of the 40 mm track, using a Struers diamond saw. The cut was made perpendicular to the scanning direction to obtain representative transverse cross-sections of the deposited tracks. The sectioning location was selected away from both track ends to minimise the influence of start-up and shut-down thermal transients. During laser activation, the initially cold substrate progressively heats up, causing the melt-pool geometry to evolve. Furthermore, power ramp-down and a shortened trailing conduction path near the end of the track can alter melt-pool morphology. Previous in-situ infrared observations have shown that these transient effects are limited to a small part of the track, while the steady-state region generally occupies about of the deposited length [37]. Therefore, sectioning at 15 mm places plane c within the quasi-steady-state region, ensuring that the measured track geometry is representative of the bulk deposition condition rather than end-effect artefacts.
The resulting cross-sections were hot-mounted in resin and prepared metallographically through successive grinding and polishing stages, following the recommended procedure for stainless steels [38]. This preparation produced a smooth and polished surface suitable for subsequent microstructural examination.
Optical micrographs of the polished cross-sections were acquired using an Olympus DSX1000 optical microscope under bright-field illumination. Images were captured at a magnification of 10× and stitched together to generate a panoramic mosaic of each cross-section, from which track width and height were measured. To characterise the as-deposited geometry, the region of the track outlined by the dashed box in Figure 2(a) was also scanned using the DSX1000 as an optical profilometry system, which reconstructs a 3D height map from images captured at incremental focal positions (Figure 2(b)). Five evenly spaced line profiles perpendicular to the scanning direction were extracted from this map, and the track width and height were measured from each. These values were combined with the cross-sectional measurements to calculate the average track width and height.
3. FEA Modeling
3.1. Boundary Conditions
The transient thermal response of the deposited track and substrate during DED-LB is described by a three-dimensional, nonlinear heat conduction equation as follows [39]:
Here, T denotes temperature, while , , are the temperature-dependent density , specific heat , and thermal conductivity thermal conductivity , respectively. The term represents the volumetric heat input , and H accounts for the latent-heat contribution.
Since the substrate is preheated to prior to deposition, the initial condition is defined separately for the substrate and for each deposited track, given by equations. (2) and (3) respectively.
where is the substrate preheating temperature ( or ) and is the ambient temperature (assumed or ) at . Heat is transferred within the material by conduction and dissipated through convection and radiation at the free surfaces of the active elements. The corresponding surface energy balance is expressed in Eq. (4).
The coefficients h and denote the convective heat transfer coefficient (W ) and surface emissivity, respectively. The Stefan–Boltzmann constant is = W ), while represents the unit vector normal to the surface.
3.2. Volumetric Heat Source
3.2.1. Gaussian-Double Ellipsoidal Heat Source
The seminal work by Goldak [23] introduced the double ellipsoidal heat source model, which has become the de facto standard for thermal simulations of welding and additive manufacturing.
The absorbed heat input Q from the laser beam,
where denotes the laser absorptivity and P represents the incident laser power. This model assumes a gaussian distribution of energy within each semi ellipsoid region (Figure 3), capturing the asymmetric thermal field induced by the relative motion between the heat source and workpiece. A front ellipsoid in the direction of travel and a rear ellipsoid trailing behind, with the volumetric heat flux expressed as:
where a, b, and are the transverse, depth, front, and rear semi-axes, respectively, and + = 2 partition the total heat input between the two ellipsoids in proportion to their longitudinal extent:
3.2.2. Modified Heat Source Model with off-Axis Top-Hat Energy Distribution
While the Gaussian profile is suitable for highly focused keyhole-mode regimes, powder fed DED-LB process exhibits pronounced beam homogenization and scattering due to the intersecting powder stream [40]. This interaction generates a uniform energy distribution across the melt pool surface. To capture this physical behaviour, the spatial decay is replaced with a top-hat distribution bounded by the double-ellipsoidal geometry. Using the Heaviside step function , the volumetric heat flux is formulated as:
where the normalized ellipsoidal coordinate is defined as:
The Heaviside function evaluates to unity when (inside the ellipsoid) and zero otherwise. The additional condition (equivalently ) restricts the heat source to the material domain, assuming the top surface is at . For the top-hat distribution to satisfy energy conservation, the uniform power densities and must be determined such that the total heat input equals the absorbed laser power. The volume of a half-ellipsoid is given by:
Therefore, the power densities are calculated as:
Substituting the fraction expressions from Equation (3):
which gives equal power densities
This is in contrast to the Gaussian model where the peak intensities differ between front and rear ellipsoids even with the same total power fraction.
Off-axis L-DED configurations employ either a powder delivery nozzle oriented perpendicular to the substrate and a laser head inclined at an angle , or the reverse arrangement [6]. When the laser is tilted by angle on the plane, the effective geometry of the heat source is modified as shown in Figure 4. The elongation applies to the longitudinal parameters along X ( and ) by the factor 1/ cos, while the transverse half-width along Y (a) remains unchanged. The depth parameter, b (Z-direction) is effectively reduced by the factor cos because the beam travels at an angle through the material.
The effective parameters are therefore:
For a deposition track along the positive X-axis with constant travel speed v, the coordinates of the moving beam center at process time t are given by:
The relative local coordinates in the moving reference frame are defined as:
Incorporating the off-axis geometric corrections, the local normalized distance function is expressed piecewise as:
The complete volumetric heat source function implemented in the finite element framework is therefore:
3.3. Numerical Model and Assumptions
A three-dimensional transient thermal model of single-track () DED-LB deposition of SS316L on a mild steel (G250) substrate () was developed in and solved using the implicit heat transfer solver of Abaqus 2026 (Figure 5). Thermal properties of SS316L are given in Table 2 and Table 3. Eight-node linear diffusive heat transfer elements (DC3D8) were used with nodal temperature as the sole degree of freedom as these type of elements are well suited for resolving the thermal gradients developed during the deposition process [39,41].
The moving heat source was incorporated via a user-defined DFLUX subroutine, while continuous material addition was simulated using progressive element activation via the Abaqus AM Modeler module [43] driven by a kinematic event series and dynamic surface boundary conditions. To balance computational efficiency with the accurate resolution of steep thermal gradients, a non-uniform spatial discretization scheme was adopted. Specifically, a fine mesh size of approximately mm was applied to the deposition bead and the underlying substrate down to a depth of 6 mm corresponding to the location of the thermocouple while the peripheral and lower substrate regions transitioned to a coarser 2 mm mesh (Figure 5).
4. Results
4.1. Melt Pool Morphology and Geometric Validation
The resulting melt pool was validated by finite element predictions against in situ thermal camera image and experimental clad track dimensions at a steady-state deposition length of 20 mm. The simulated melt-pool boundary was defined by the liquidus isotherm of SS316L() .
The experimental thermal camera recording (Figure 6(a)) depicts an asymmetric teardrop shaped melt pool characterized by a blunt, rounded leading edge at the heat source location and an elongated, gradually tapering trailing tail. This morphology is reproduced with high fidelity by the THDE model (Figure 6(c)), which predicts a similarly extended rear zone and flattened leading boundary. The GDE model (Figure 6(b)), in contrast, yields a markedly more rounded and symmetric pool outline, compressing the trailing region and failing to capture the elongated tail evident experimentally.
In addition to the top-view morphology, the transverse cross sectional geometry of the deposited track was examined to provide a quantitative, dimension-resolved validation of the two heat source formulations. Figure 7 compares the experimentally observed cross-section, obtained from the mid-point metallographic sections described in Section 2.2, against the corresponding simulated cross-section predicted by the THDE model. The grey region denotes the region above the liquidus temperature ( °C) and thus represents the predicted fusion boundary.
Quantitative evaluation via the parity plot (Figure 8) corroborates this morphological divergence across spatial dimensions. While both formulations adequately resolve vertical conductive heat transfer into the substrate predicting melt pool height within a (GDE) and (THDE) error margin within the parity corridor. A stark contrast arises in transverse width prediction. The proposed THDE model demonstrates high predictive fidelity with an error of only ( predicted vs. experimental), aligning closely with the ideal parity line. Conversely, the conventional GDE model underpredicts track width () significantly produced deviation.
4.2. Melt-Pool Peak Temperature
The recorded peak temperature of °C lies within the instrument’s calibrated operating range of 900– °C and is subject to the stated accuracy of for measurements above °C. Since the measured temperature is sufficiently distant from both the lower calibration threshold and the upper measurement limit, the reading is not expected to be affected by range-clipping artefacts. To validate the thermal model, the simulated peak surface temperature was extracted from the finite element analysis (FEA) model at the spatial node and time increment corresponding most closely to the experimental hot spot location (Figure 9). The predicted peak temperature was °C, corresponding to an absolute deviation of °C and a relative error of with respect to the experimental measurement.
4.3. Temperature Profile
The transient temperature history experienced during DED-Lb is a key process factor, as it governs the local thermal cycle, cooling rate, and consequently the resulting microstructure, residual stress , and bonding quality between the deposited track and the substrate. The temperature measured by the embedded thermocouple was compared with the corresponding nodal temperature (NT11) from simulation, as shown in Figure 10.
Both profiles exhibit the characteristic thermal response of a passing heat source. They show a rapid temperature rise as the laser approaches, followed by a gradual decay as it moves away. The simulation predicts a peak temperature of °C against an experimentally measured peak of °C a deviation of only °C ( ) , indicating that the FEA model captures the local thermal cycle with good accuracy.
4.4. Cooling Rate
Cooling rate is another key thermal parameter in DED-LB, as it directly affects solidification behaviour, microstructural evolution and consequently, the mechanical properties of the deposited material. To evaluate the spatial variation of the cooling rate, three transverse measurement lines, A, B and C, were defined at deposition lengths of 10, 20 and 30 mm respectively as shown in Figure 11(a). Surface temperature histories were extracted from the infrared thermography data at four distinct points along each line, with corresponding nodal temperature histories retrieved from identical locations in the finite element analysis (FEA) model, as shown in Figure 11(b). At each location, the liquidus-solidus (1450–1420 °C) cooling rate was computed at all four points from both experimental measurements and numerical simulations, and the resulting mean value was adopted for comparative analysis, as depicted in Figure 11(c). Both datasets show a slight decrease in cooling rate along the deposition track. The simulation predicts mean cooling rates of at A, at B and at C, and the corresponding experimental values are , and . This trend is consistent with progressive heat accumulation during single-track deposition. As the laser advances, heat from the preceding section raises the local substrate and deposited-material temperature. The resulting reduction in the local temperature gradient lowers the conductive heat-extraction rate. Heat accumulation in DED is commonly associated with lower cooling rates, as the surrounding material becomes progressively preheated [44]. Although the simulation slightly underpredicted the experimental values, the relative deviations were within 10% at all three locations.
5. Discussion
The experimental and numerical results presented in Section 4 that span melt-pool geometry, peak surface temperature, subsurface temperature history, and spatial cooling rate distribution provide converging evidence for the physical basis and predictive capacity of the proposed THDE heat source model. The morphological comparison provides the clearest evidence of the importance of the assumed energy distribution. The conventional GDEmodel concentrates energy near the beam centre, with the heat flux decreasing rapidly towards the source boundary. This distribution limits lateral melting and fails to reproduce the elongated, comet-like melt-pool morphology observed experimentally. In contrast, THDE model applies a near-uniform heat flux across the effective beam footprint. This assumption is consistent with beam homogenisation and attenuation caused by interaction with the powder stream in powder-fed DED-LB [40]. Consequently, the THDE model more effectively reproduces the broad leading region and extended trailing thermal wake observed by in-situ infrared thermography. This improvement is confirmed by the parity analysis in Figure 8. Although both formulations predict the melt-pool depth with acceptable accuracy, with errors of 7–9%, the THDE model reduces the transverse width error from 17% for the GDE model to approximately 4%.
Furthermore, peak-temperature comparison provides an independent validation under the most extreme temperature and gradient conditions present in the process. The predicted surface peak differed from the infrared measurement by . This deviation is most likely due to inehrent errors in the IR measurement itself. Changes in surface emissivity, oxidation, melt-pool fluctuations and interference from the powder stream all together can alter the measured radiative signal, and none of these is resolved by the conduction-based FEA model. Such effects could be reduced through integrating multi-wavelength pyrometry to account for dynamic surface changes. On the numerical side, implementing coupled CFD or powder-interaction algorithms would enable more accurate capture of melt-pool fluid flow and plume interference. These improvements are proposed for future work. Overall, the results suggest that the model captures heat conduction in the substrate more accurately than transient surface behaviour. In contrast, the subsurface temperature showed a peak temperature deviation of only . The FEA model assumed a uniform substrate temperature of 100°C, while the thermocouple measured approximately °C at 6 mm below the surface. Since deposition began when the surface was close to 100°C, a temperature gradient may have existed through the substrate, contributing to the difference between the measured and simulated subsurface temperatures.
Finally, spatial cooling rate analysis across locations A, B, and C revealed a close agreement between simulation and the infrared measurements. The measured cooling rates, at roughly -, fall within the range - reported for DED [45], which supports the physical consistency of both experimental and numerical results. The maximum cooling rate occurs at location A, characterized by a colder substrate and steeper thermal gradients, before decreasing toward C as progressive heat accumulation occurs in the substrate and deposited track. The deviation peaks at location A ( ), driven by high sensitivity to rapid melt-pool fluctuations, powder-stream variations, and optical measurement limits. . The simulation’s slight underprediction is likely due to these experimental constraints alongside idealized boundary conditions in the conduction-based model . Overall, the numerical model successfully captures both the magnitude and spatial evolution of the cooling rate.
Overall, the combination of melt-pool geometry, infrared thermography, subsurface temperature profile, and cooling rate comparisons provide multi-level validation of the proposed model. In this off-axis arrangement, the inclined laser beam introduces geometric asymmetry by elongating the heat source along the travel direction and compressing its depth independently of the beam’s energy distribution. The top-hat formulation effectively represents this distributed energy input through a uniform density, while the geometric correction independently accounts for the directional inclination asymmetry.
6. Conclusions
This study developed and experimentally validated a modified double-ellipsoidal heat source model, incorporating a top-hat spatial energy distribution and an explicit geometric correction for off-axis, oblique-incidence beam delivery, for FEA simulation of DED-LB of SSS316L. The model was validated against in-situ infrared thermal imaging, an embedded subsurface thermocouple, and post-process melt pool cross sectional geometry during single track deposition on a mild-steel substrate. The principal findings are as follows:
- The proposed model reproduced the asymmetric, elongated melt-pool shape observed experimentally with substantially higher fidelity than the conventional GDE model, reducing the transverse-width prediction error from (GDE) to (THDE), while both models predicted melt-pool depth to within 7–9%.
- The model predicted a peak melt pool temperature within of the in-situ infrared measurement, a reasonable outcome given the transient emissivity, oxidation, and melt-pool surface effects inherent to this measurement.
- The simulated and measured temperature profiles at an embedded thermocouple location agreed closely, with peak temperatures differing by only , confirming that the model accurately captures the local thermal cycle and bulk conductive heat transfer into the substrate.
- Across the liquidus–solidus temperature range, the mean cooling rates, averaged over four locations spaced 10 mm apart along the deposition track , decreased from 1922 to experimentally and from 1744 to in the simulation, with deviations remaining within .
Future work should extend the present validation to multi-track and multi-layer deposition, where cumulative heat accumulation and thermal interactions between successive layers play a progressively greater role in residual stress development and dimensional accuracy as build size increases. The evolving thermal history could be captured using embedded thermocouples at selected locations, supplemented by infrared thermography to monitor surface temperatures between successive passes. Furthermore, residual stresses in completed parts can be evaluated using X-ray diffraction (XRD), while dimensional accuracy and distortion can be assessed via 3D optical scanning or coordinate measuring machine (CMM) techniques. Correlating predicted thermal histories with post-process microstructural and mechanical property characterisation would further strengthen the application of the model to process-parameter optimisation in industrial off-axis DED-LB systems.
Author Contributions
Conceptualization, A.T. and M.U.; Methodology, A.T.; Formal analysis, A.T. and J.K.; Investigation, A.T. and J.K.; Data curation, A.T.; Writing—original draft, A.T.; Writing—review and editing , C.H., T.S. P.K., and M.U.; Visualization, A.T.; Supervision, J.K., C.H., T.S., S.S., P.K. and M.U.; funding acquisition, C.H.; All authors have read and agreed to the published version of the manuscript.
Funding
This research was partially funded by The Innovative Launch, Automation, Novel Materials, Communications, and Hypersonics—University Trailblazer Program (iLAuNCH)—the funding scheme supported by the Department of Education of the Australian Government.
Data Availability Statement
The data supporting the findings of this study are available from the corresponding author upon request.
Acknowledgments
We acknowledge the use of facilities, scientific and technical assistance of Adelaide Microscopy at Adelaide University, a Microscopy Australia (ROR: 042mm0k03) facility enabled by NCRIS. This work used the NCRIS and Government of South Australia enabled Australian National Fabrication Facility - South Australian Node (ANFF-SA).
Conflicts of Interest
Author Amanullah Tomal was a PhD student of Adelaide Uiversity. Author Thomas Schläfer and Surinder Singh were employed by the company LaserBond Ltd. The remaining authors declare that the research was conducted in the absence of any commercial or financial relationships that could be construed as a potential conflict of interest.
Abbreviations
The following abbreviations are used in this manuscript:
| MAM | Metal additive manufacturing |
| CAGR | Compound annual growth rate |
| DED-LB | Directed energy deposition-laser beam |
| PBF | Powder bed fusion |
| GDE | Gaussian double ellipsoidal |
| THDE | Top-hat double ellipsoidal |
| FEA | Finite element analysis |
| CFD | Computational fluid dynamics |
References
- Liu, T.S.; Chen, P.; Qiu, F.; Yang, H.Y.; Jin, N.T.Y.; Chew, Y.; Wang, D.; Li, R.; Jiang, Q.C.; Tan, C. Review on laser directed energy deposited aluminum alloys. Int. J. Extrem. Manuf. 2024, 6, 022004. [Google Scholar] [CrossRef]
- Metal Additive Manufacturing Market Companies, Size & Trends 2026-2035. Available online: https://www.precedenceresearch.com/metal-additive-manufacturing-market (accessed on 22 September 2026).
- Piscopo, G.; Atzeni, E.; Saboori, A.; Salmi, A. An Overview of the Process Mechanisms in the Laser Powder Directed Energy Deposition. Appl. Sci. 2022, 13. [Google Scholar] [CrossRef]
- Thompson, S.M.; Bian, L.; Shamsaei, N.; Yadollahi, A. An overview of Direct Laser Deposition for additive manufacturing; Part I: Transport phenomena, modeling and diagnostics. Addit. Manuf. 2015, 8, 36–62. [Google Scholar] [CrossRef]
- ISO, B. ASTM 52900: 2021 Additive Manufacturing—General Principles—Fundamentals and Vocabulary; International Organization for Standardization. Geneva, Switzerland, 2021.
- Singh, A.; Kapil, S.; Das, M. A comprehensive review of the methods and mechanisms for powder feedstock handling in directed energy deposition. Addit. Manuf. 2020, 35, 101388. [Google Scholar] [CrossRef]
- Guner, A.; Bidare, P.; Jiménez, A.; Dimov, S.; Essa, K. Nozzle Designs in Powder-Based Direct Laser Deposition: A Review. Int. J. Precis. Eng. Manuf. 2022, 23, 1077–1094. [Google Scholar] [CrossRef]
- Hatem, A.; Schulz, C.; Schlaefer, T.; Boobhun, J.T.; Stanford, N.; Hall, C. Influence of laser absorption by water- and gas-atomised powder feedstock on Laser Metal Deposition of AISI 431 stainless steel. Addit. Manuf. 2021, 47, 102242. [Google Scholar] [CrossRef]
- Hatem, A.; Roccisano, A.; Schulz, C.; Schlaefer, T.; Luzin, V.; Salvemini, F.; Meghwal, A.; Ang, A.S.M.; Hall, C. Effect of off-axis laser incidence on residual stress in laser-based directed energy deposition of 316L stainless steel. J. Laser Appl. 2026, 38, 022002. [Google Scholar] [CrossRef]
- Aziz, U.; McAfee, M.; Manolakis, I.; Timmons, N.; Tormey, D. A Review of Optimization of Additively Manufactured 316/316L Stainless Steel Process Parameters, Post-Processing Strategies, and Defect Mitigation. Materials 2025, 18. [Google Scholar] [CrossRef] [PubMed]
- DeNonno, O.; Saville, A.; Benzing, J.; Klemm-Toole, J.; Yu, Z. Solidification behavior and texture of 316L austenitic stainless steel by laser wire directed energy deposition. Mater. Charact. 2024, 211, 113916. [Google Scholar] [CrossRef]
- Duan, X.; Yang, X. Achieving enhanced strength and ductility in 316L stainless steel via wire arc additive manufacturing using pulsed arc plasma. Mater. Sci. Eng. A 2023, 867, 144711. [Google Scholar] [CrossRef]
- Chen, Z.; Zhang, Z.; Yang, Y.; Xiao, G.; Yi, M.; Zhou, T.; Xu, C. Influence of interlayer dwell time on microstructure and mechanical properties additively manufactured 316L stainless steel by laser directed energy deposition. J. Mater. Res. Technol. 2025, 34, 1304–1312. [Google Scholar] [CrossRef]
- Kiran, A.; Li, Y.; Koukolíková, M.; Brázda, M.; Hodek, J.; Urbánek, M.; Džugan, J.; Raghavan, S.; Odehnal, J. Elevated Temperature Baseplate Effect on Microstructure, Mechanical Properties, and Thermal Stress Evaluation by Numerical Simulation for Austenite Stainless Steel 316L Fabricated by Directed Energy Deposition. Materials 2022, 15. [Google Scholar] [CrossRef] [PubMed]
- Qin, J.; Taraphdar, P.; Sun, Y.; Wainwright, J.; Lai, W.J.; Feng, S.; Ding, J.; Williams, S. Knowledge-based bidirectional thermal variable modelling for directed energy deposition additive manufacturing. Virtual Phys. Prototyp. 2024, 19, e2397008. [Google Scholar] [CrossRef]
- Nie, Y.; Qin, C.; Tang, Q.; Wang, B.; Wu, H.; Song, J.; Li, K. Numerical simulation of heat and mass transfer in laser directed energy deposition. Opt. Laser Technol. 2024, 176, 111024. [Google Scholar] [CrossRef]
- Rosenthal, D. The Theory of Moving Sources of Heat and Its Application to Metal Treatments. Trans. Am. Soc. Mech. Eng. 1946, 68, 849–865. [Google Scholar] [CrossRef]
- Rykalin, N. Calculation of heat flow in welding; Paley, Z.; Adams, C.M., Jr., Translators; 1951; pp. 212–350. [Google Scholar]
- Wei, H.L.; Mukherjee, T.; Zhang, W.; Zuback, J.S.; Knapp, G.L.; De, A.; DebRoy, T. Mechanistic models for additive manufacturing of metallic components. Prog. Mater. Sci. 2021, 116, 100703. [Google Scholar] [CrossRef]
- Cook, P.S.; Murphy, A.B. Simulation of melt pool behaviour during additive manufacturing: Underlying physics and progress. Addit. Manuf. 2020, 31, 100909. [Google Scholar] [CrossRef]
- Bayat, M.; Dong, W.; Thorborg, J.; To, A.C.; Hattel, J.H. A review of multi-scale and multi-physics simulations of metal additive manufacturing processes with focus on modeling strategies. Addit. Manuf. 2021, 47, 102278. [Google Scholar] [CrossRef]
- Stender, M.E.; Beghini, L.L.; Sugar, J.D.; Veilleux, M.G.; Subia, S.R.; Smith, T.R.; Marchi, C.W.S.; Brown, A.A.; Dagel, D.J. A thermal-mechanical finite element workflow for directed energy deposition additive manufacturing process modeling. Addit. Manuf. 2018, 21, 556–566. [Google Scholar] [CrossRef]
- Goldak, J.; Chakravarti, A.; Bibby, M. A new finite element model for welding heat sources. Metall. Trans. B 1984, 15, 299–305. [Google Scholar] [CrossRef]
- Nain, V.; Engel, T.; Carin, M.; Boisselier, D.; Seguy, L. Development of an Elongated Ellipsoid Heat Source Model to Reduce Computation Time for Directed Energy Deposition Process. Front. Mater. 2021, 8. [Google Scholar] [CrossRef]
- Giarollo, D.F.; Mazzaferro, C.C.P.; Mazzaferro, J.A.E. Comparison between two heat source models for wire-arc additive manufacturing using GMAW process. J. Braz. Soc. Mech. Sci. Eng. 2021, 44, 7. [Google Scholar] [CrossRef]
- Cheng, J.; Huo, Y.; Fernandez-Zelaia, P.; Hu, X.; Li, M.; Sun, X. A Gaussian Process-Based extended Goldak heat source model for finite element simulation of laser powder bed fusion additive manufacturing process. Comput. Mater. Sci. 2024, 244, 113185. [Google Scholar] [CrossRef]
- Chen, B.; Bian, Y.; Li, Z.; Dong, B.; Li, S.; Tian, C.; He, X.; Yu, G. Effect of Laser Beam Profile on Thermal Transfer, Fluid Flow and Solidification Parameters during Laser-Based Directed Energy Deposition of Inconel 718. Materials 2023, 16. [Google Scholar] [CrossRef] [PubMed]
- Yuan, W.; Chen, H.; Li, S.; Heng, Y.; Yin, S.; Wei, Q. Understanding of adopting flat-top laser in laser powder bed fusion processed Inconel 718 alloy: simulation of single-track scanning and experiment. J. Mater. Res. Technol. 2022, 16, 1388–1401. [Google Scholar] [CrossRef]
- Ebrahimi, A.; Sattari, M.; Babu, A.; Sood, A.; Römer, G.W.R.B.E.; Hermans, M.J.M. Revealing the effects of laser beam shaping on melt pool behaviour in conduction-mode laser melting. J. Mater. Res. Technol. 2023, 27, 3955–3967. [Google Scholar] [CrossRef]
- Meena, A.; Andersson Lassila, A.; Lonn, D.; Salomonsson, K.; Wang, W.; Nielsen, C.V.; Bayat, M. The effect of laser off-axis angle on the formation of porosities, fluid flow and keyhole formation of an aluminum alloy (AA1050) in the laser welding process. Opt. Laser Technol. 2025, 184, 112534. [Google Scholar] [CrossRef]
- Li, R.; Xiong, J. A numerical prediction of residual stress for a thin-walled part with geometrical features fabricated by GMA-based additive manufacturing. Rapid Prototyp. J. 2019, 26, 299–308. [Google Scholar] [CrossRef]
- Hatem, A.; Schulz, C.; Schlaefer, T.; Stanford, N.; Roccisano, A.; Hall, C. The Microstructural Effects of Laser Metal Deposition on Pitting Corrosion of AISI 316L, AISI 431 and SAF 2507 Stainless Steels. In Proceedings of the ACA Corrosion & Prevention 2022, 2022. Conference paper, Paper 220.
- Uddin, M.; Santifoller, R.; Hall, C.; Schlaefer, T. A Grinding-Burnishing Approach to Enhancing Surface Integrity, Tribological, and Corrosion Behavior of Laser-Cladded AISI 431 Alloys. J. Manuf. Sci. Eng. 2022, 144, 071003. [Google Scholar] [CrossRef]
- Optris GmbH. Optris PI 05M: Technical Data Sheet. 2026. Available online: https://optris.com/products/thermal-cameras/precision-line/pi-05m/ (accessed on 30 September 2026).
- DeWitt, D.P.; Nutter, G.D. Theory and practice of radiation thermometry; John Wiley & Sons, 1991. [Google Scholar]
- Hu, D.; Kovacevic, R. Sensing, modeling and control for laser-based additive manufacturing. Int. J. Mach. Tools Manuf. 2003, 43, 51–60. [Google Scholar] [CrossRef]
- Zhang, J.; Shang, X.; Wei, Q.; Talbot, A.; Lyu, T.; Khanna, S.; Liu, B.; Jan, E.; Shao, C.; Wang, H.; et al. Mechanism and quantification of melt pool morphology evolution in single-track fabrication by laser directed energy deposition. J. Manuf. Process. 2025, 156, 556–568. [Google Scholar] [CrossRef]
- Standards Australia. AS/NZS 3678:2011; Structural steel - Hot-rolled plates, floorplates and slabs. 2011.
- Rong, P.; Bai, Q.; Yin, M.; Li, W.; Song, Y.; Zheng, F. Thermal mechanical modeling and residual stress prediction for laser direct energy deposition of 30CrNi2MoVA steel considering solid-state phase transformation. J. Mater. Res. Technol. 2024, 30, 7727–7740. [Google Scholar] [CrossRef]
- Jiazhu, W.; Liu, T.; Chen, H.; Li, F.; Wei, H.; Zhang, Y. Simulation of laser attenuation and heat transport during direct metal deposition considering beam profile. J. Mater. Process. Technol. 2019, 270, 92–105. [Google Scholar] [CrossRef]
- Chen, W.; Xu, L.; Han, Y.; Zhao, L.; Jing, H. Control of residual stress in metal additive manufacturing by low-temperature solid-state phase transformation: An experimental and numerical study. Addit. Manuf. 2021, 42, 102016. [Google Scholar] [CrossRef]
- Essongue, S.; Nain, V.; Carin, M. Efficient thermal modeling of laser directed energy deposition using the forward Euler scheme: Methodology, merits and limitations. Finite Elem. Anal. Des. 2024, 242, 104270. [Google Scholar] [CrossRef]
- An, N.; Yang, G.; Yang, K.; Wang, J.; Li, M.; Zhou, J. Implementation of Abaqus user subroutines and plugin for thermal analysis of powder-bed electron-beam-melting additive manufacturing process. Mater. Today Commun. 2021, 27, 102307. [Google Scholar] [CrossRef]
- de Peindray d’Ambelle, L.; Moussaoui, K.; Mabru, C. Impact of geometrical defects on solidification behavior and microstructure in 316L single-bead walls produced by LP-DED: an in situ IR thermography approach. Prog. Addit. Manuf. 2026, 11, 7015–7041. [Google Scholar] [CrossRef]
- Saboori, A.; Aversa, A.; Bosio, F.; Bassini, E.; Librera, E.; De Chirico, M.; Biamino, S.; Ugues, D.; Fino, P.; Lombardi, M. An investigation on the effect of powder recycling on the microstructure and mechanical properties of AISI 316L produced by Directed Energy Deposition. Mater. Sci. Eng. A 2019, 766, 138360. [Google Scholar] [CrossRef]
Figure 1.
(a) Experimental setup, (b) schematic of off-axis deposition
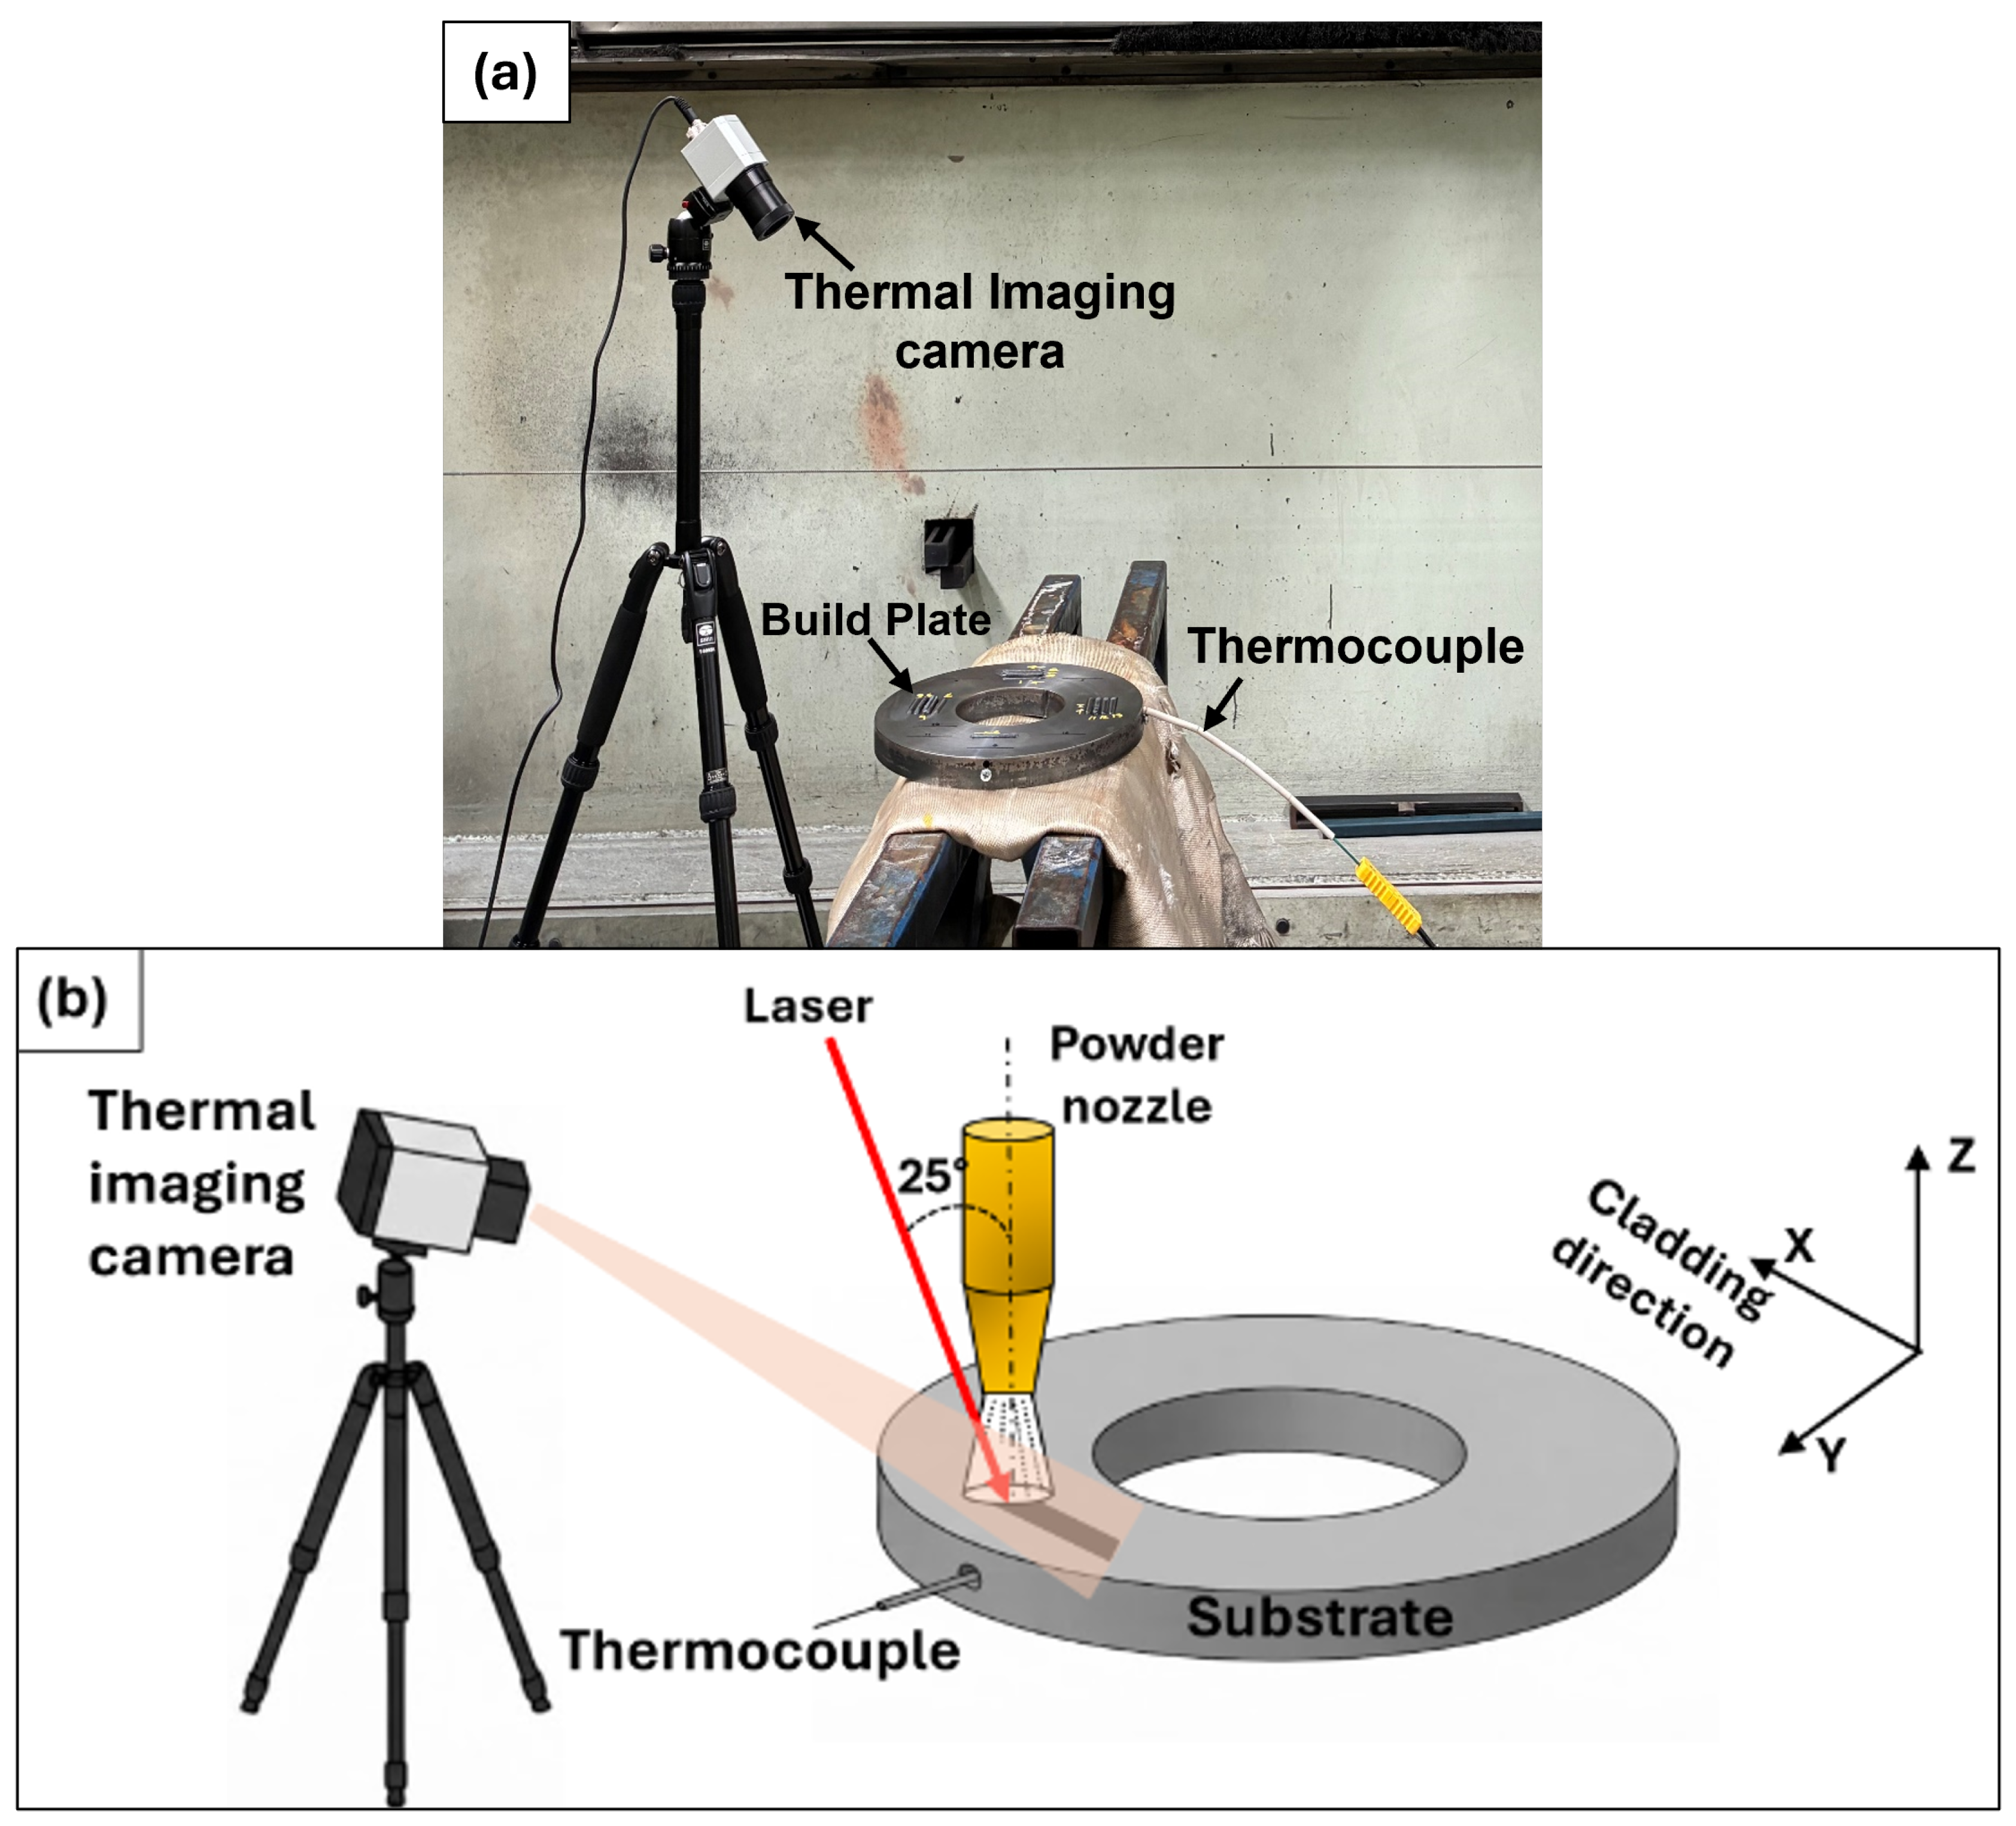
Figure 2.
(a) Single-track with cross-section plane (C, 5 mm from the start of deposition) , (b) optical image (left) and 3D height map (right) of the scanned region (dashed box in (a)), with width and height averaged from five line profiles (1-5) perpendicular to the scan direction. )
Figure 2.
(a) Single-track with cross-section plane (C, 5 mm from the start of deposition) , (b) optical image (left) and 3D height map (right) of the scanned region (dashed box in (a)), with width and height averaged from five line profiles (1-5) perpendicular to the scan direction. )
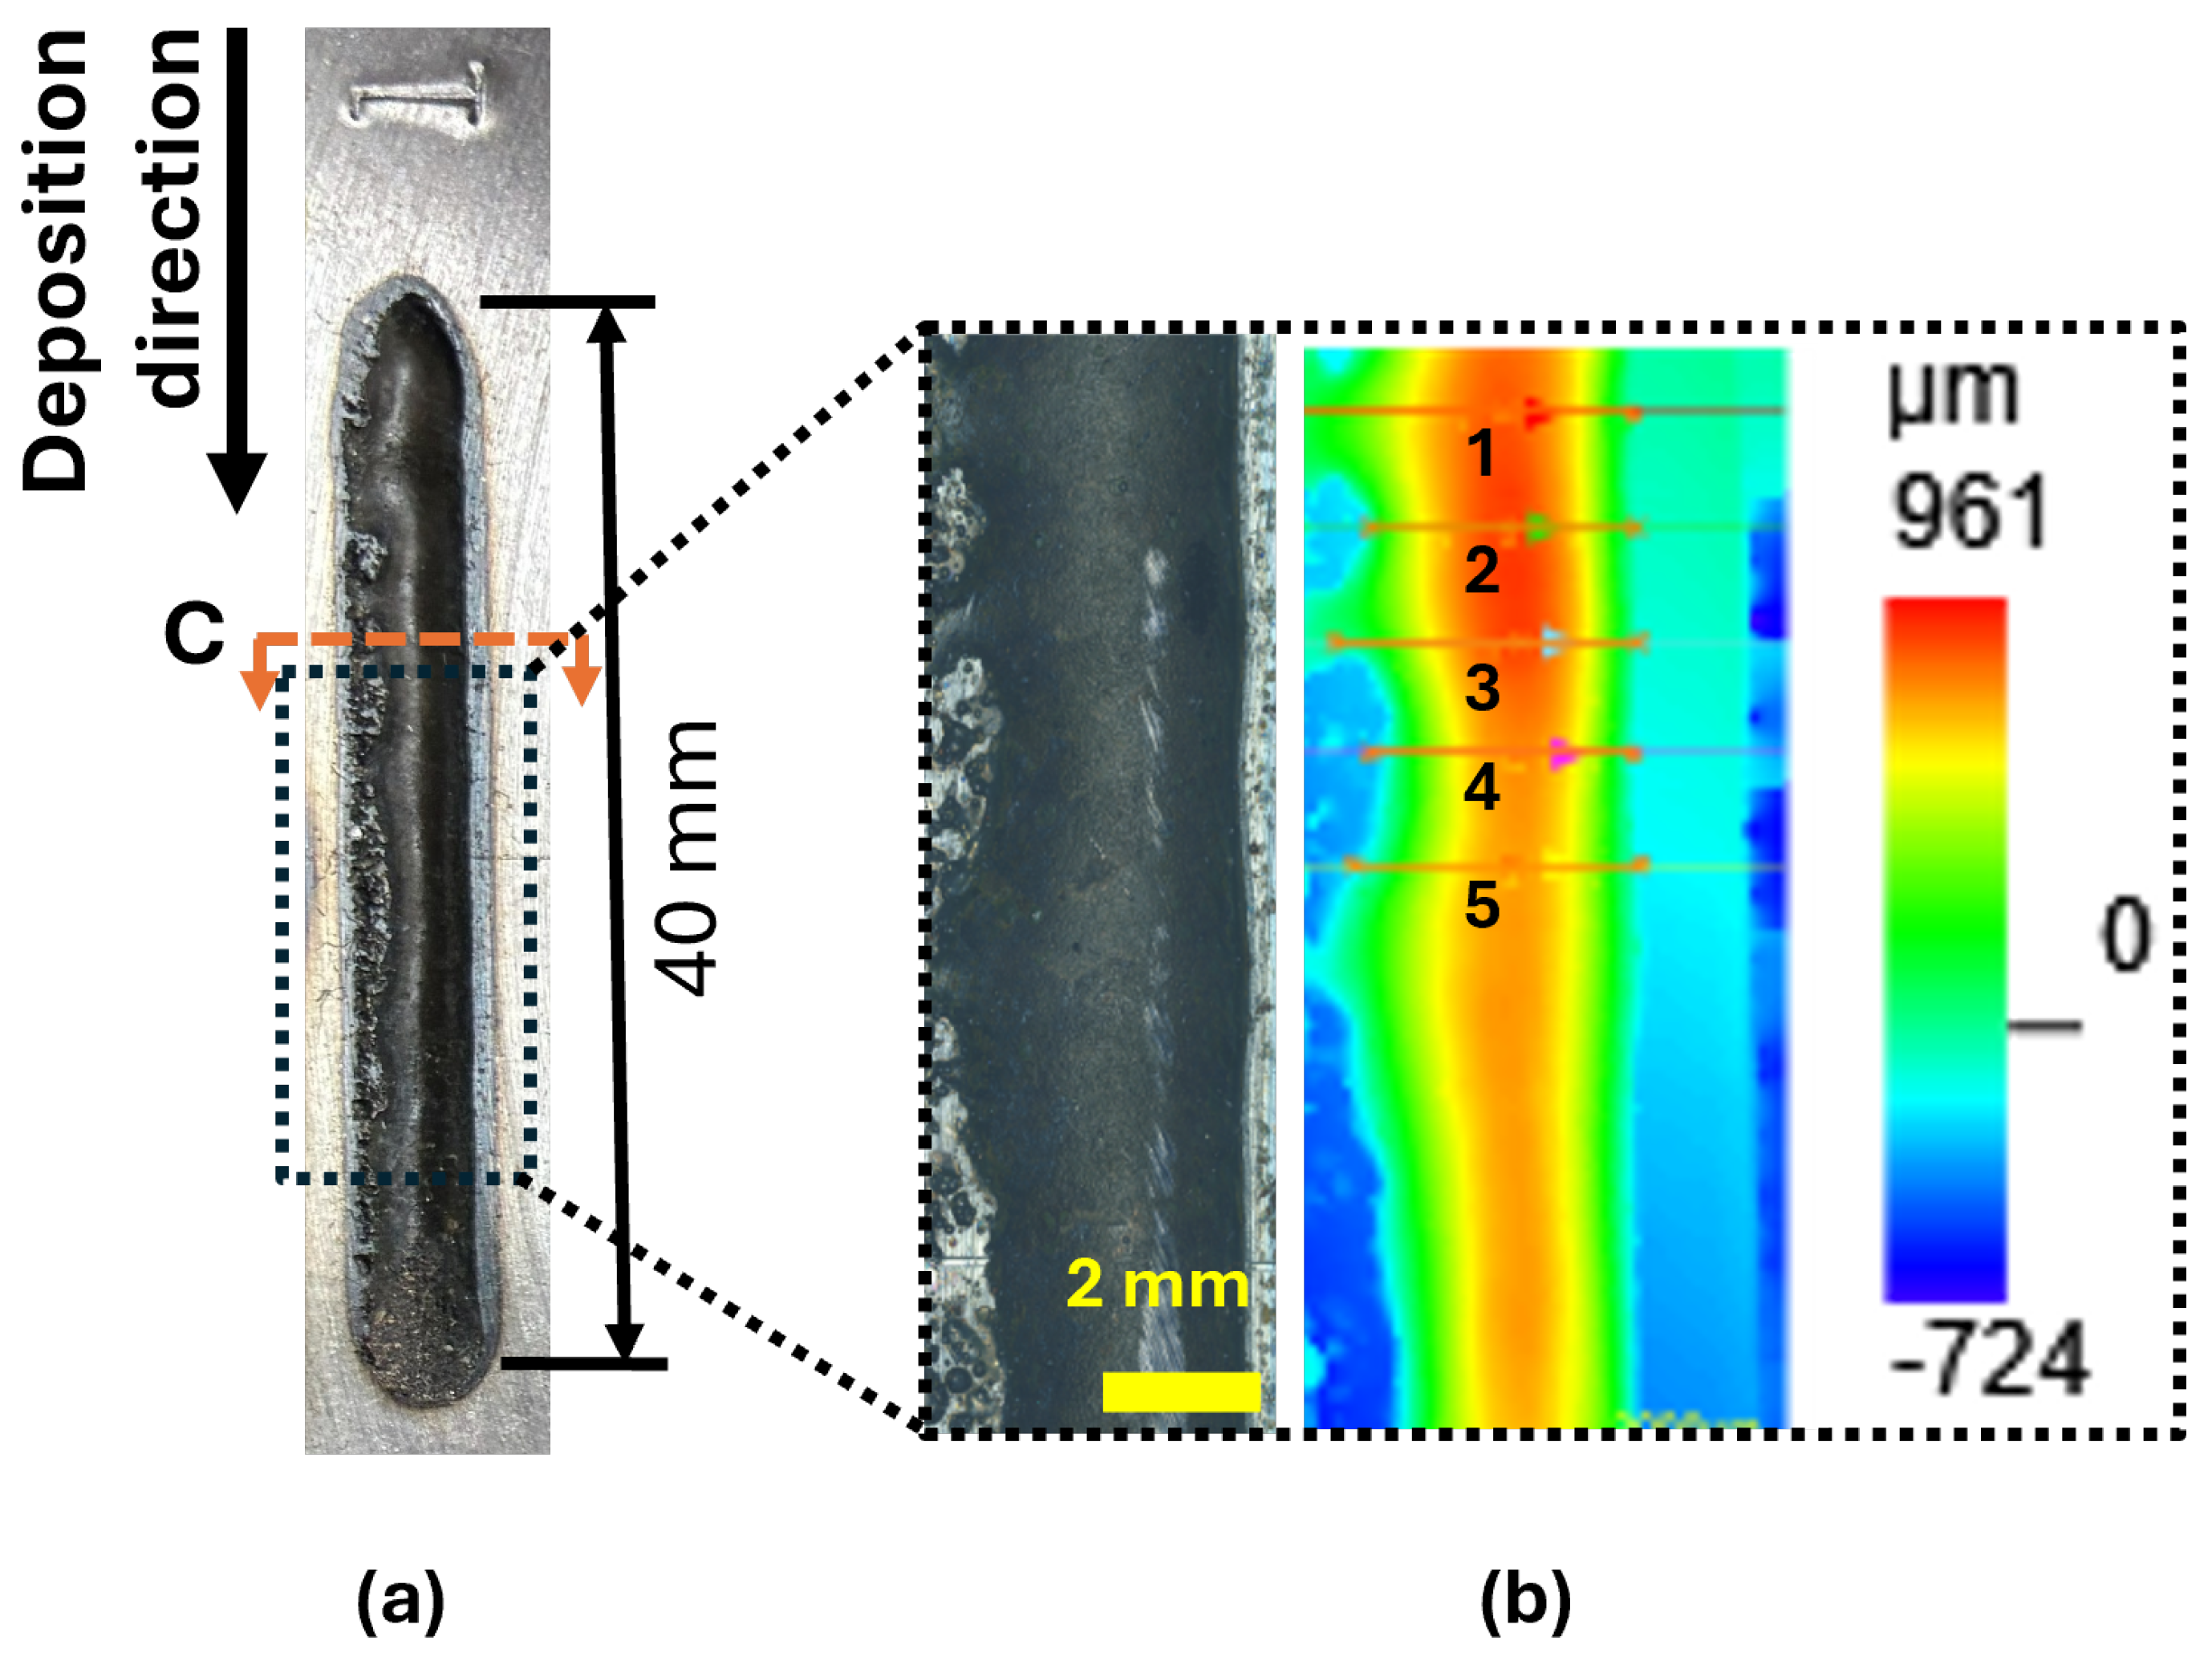
Figure 3.
Gaussian double ellipsoidal or GOLDAK heat source .
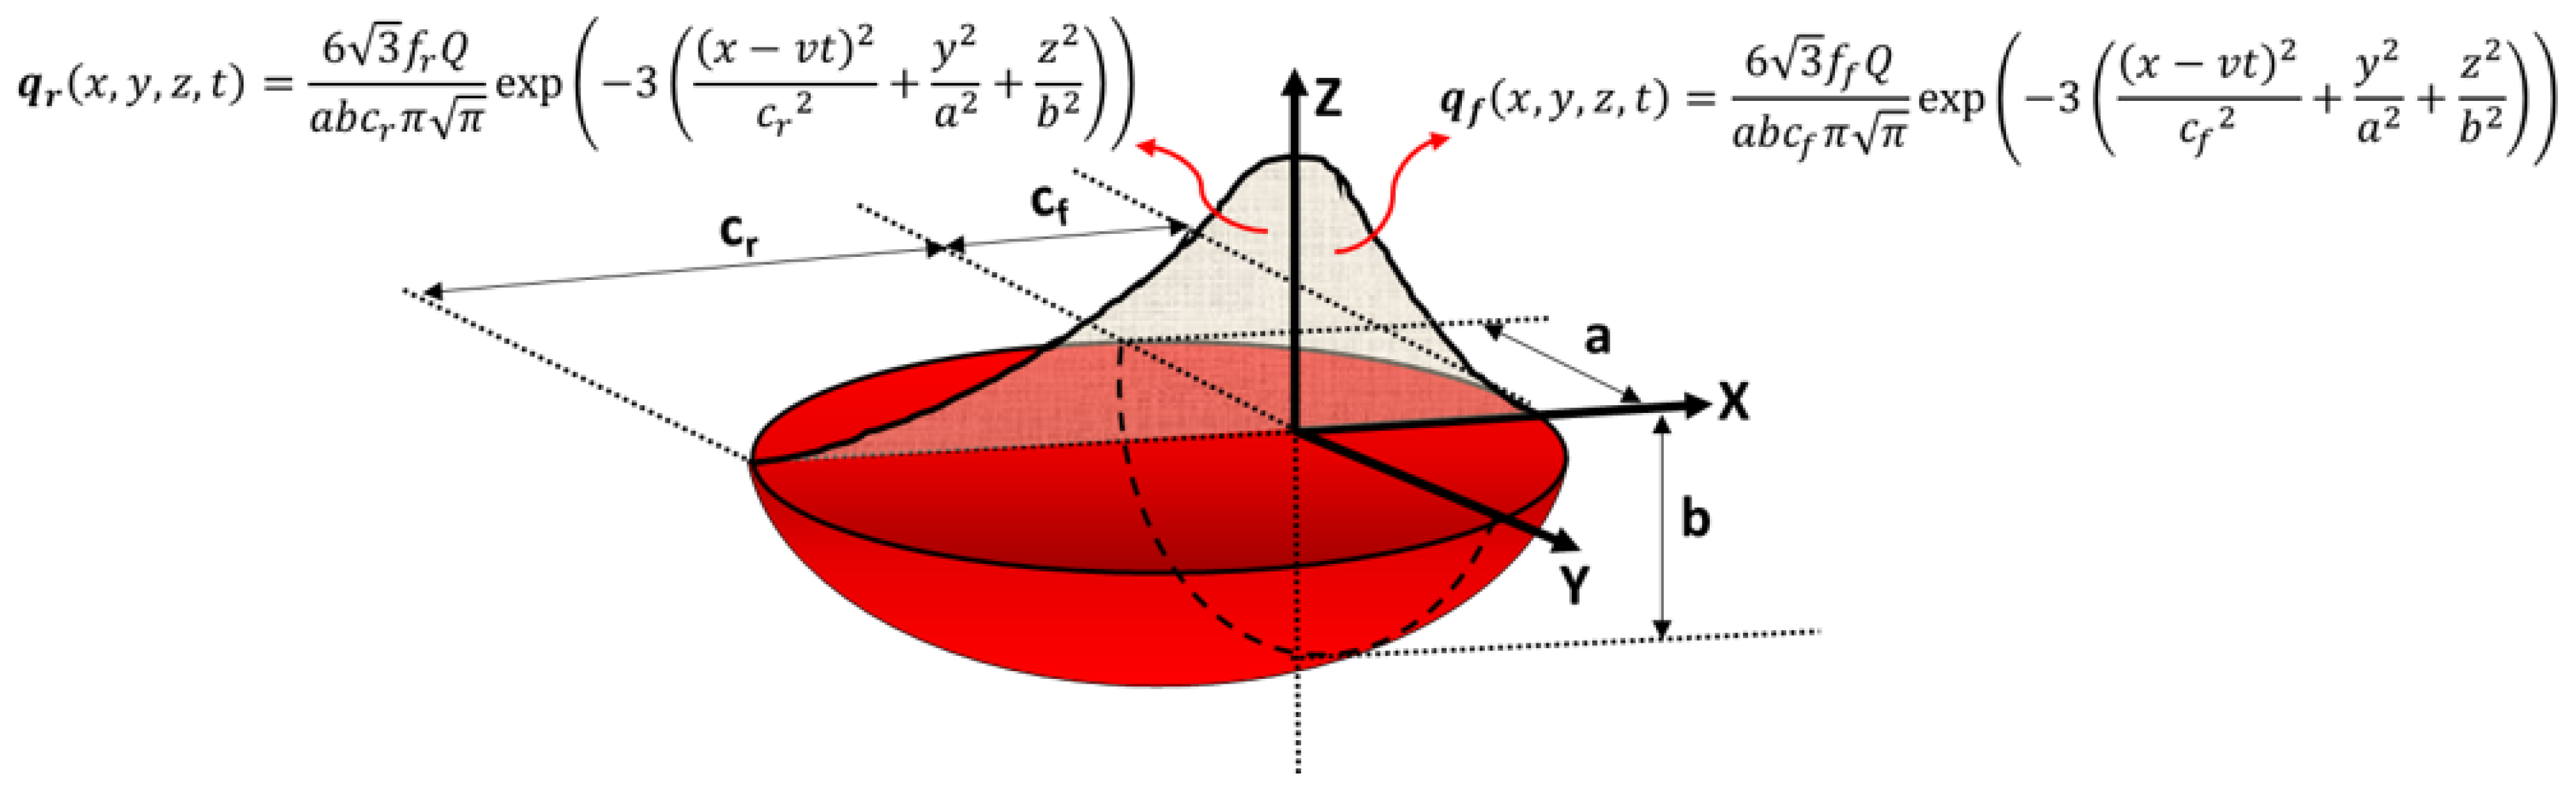
Figure 4.
(a) Top-Hat double ellipsoidal heat source (b) Off-axis effect on melt pool geometry.
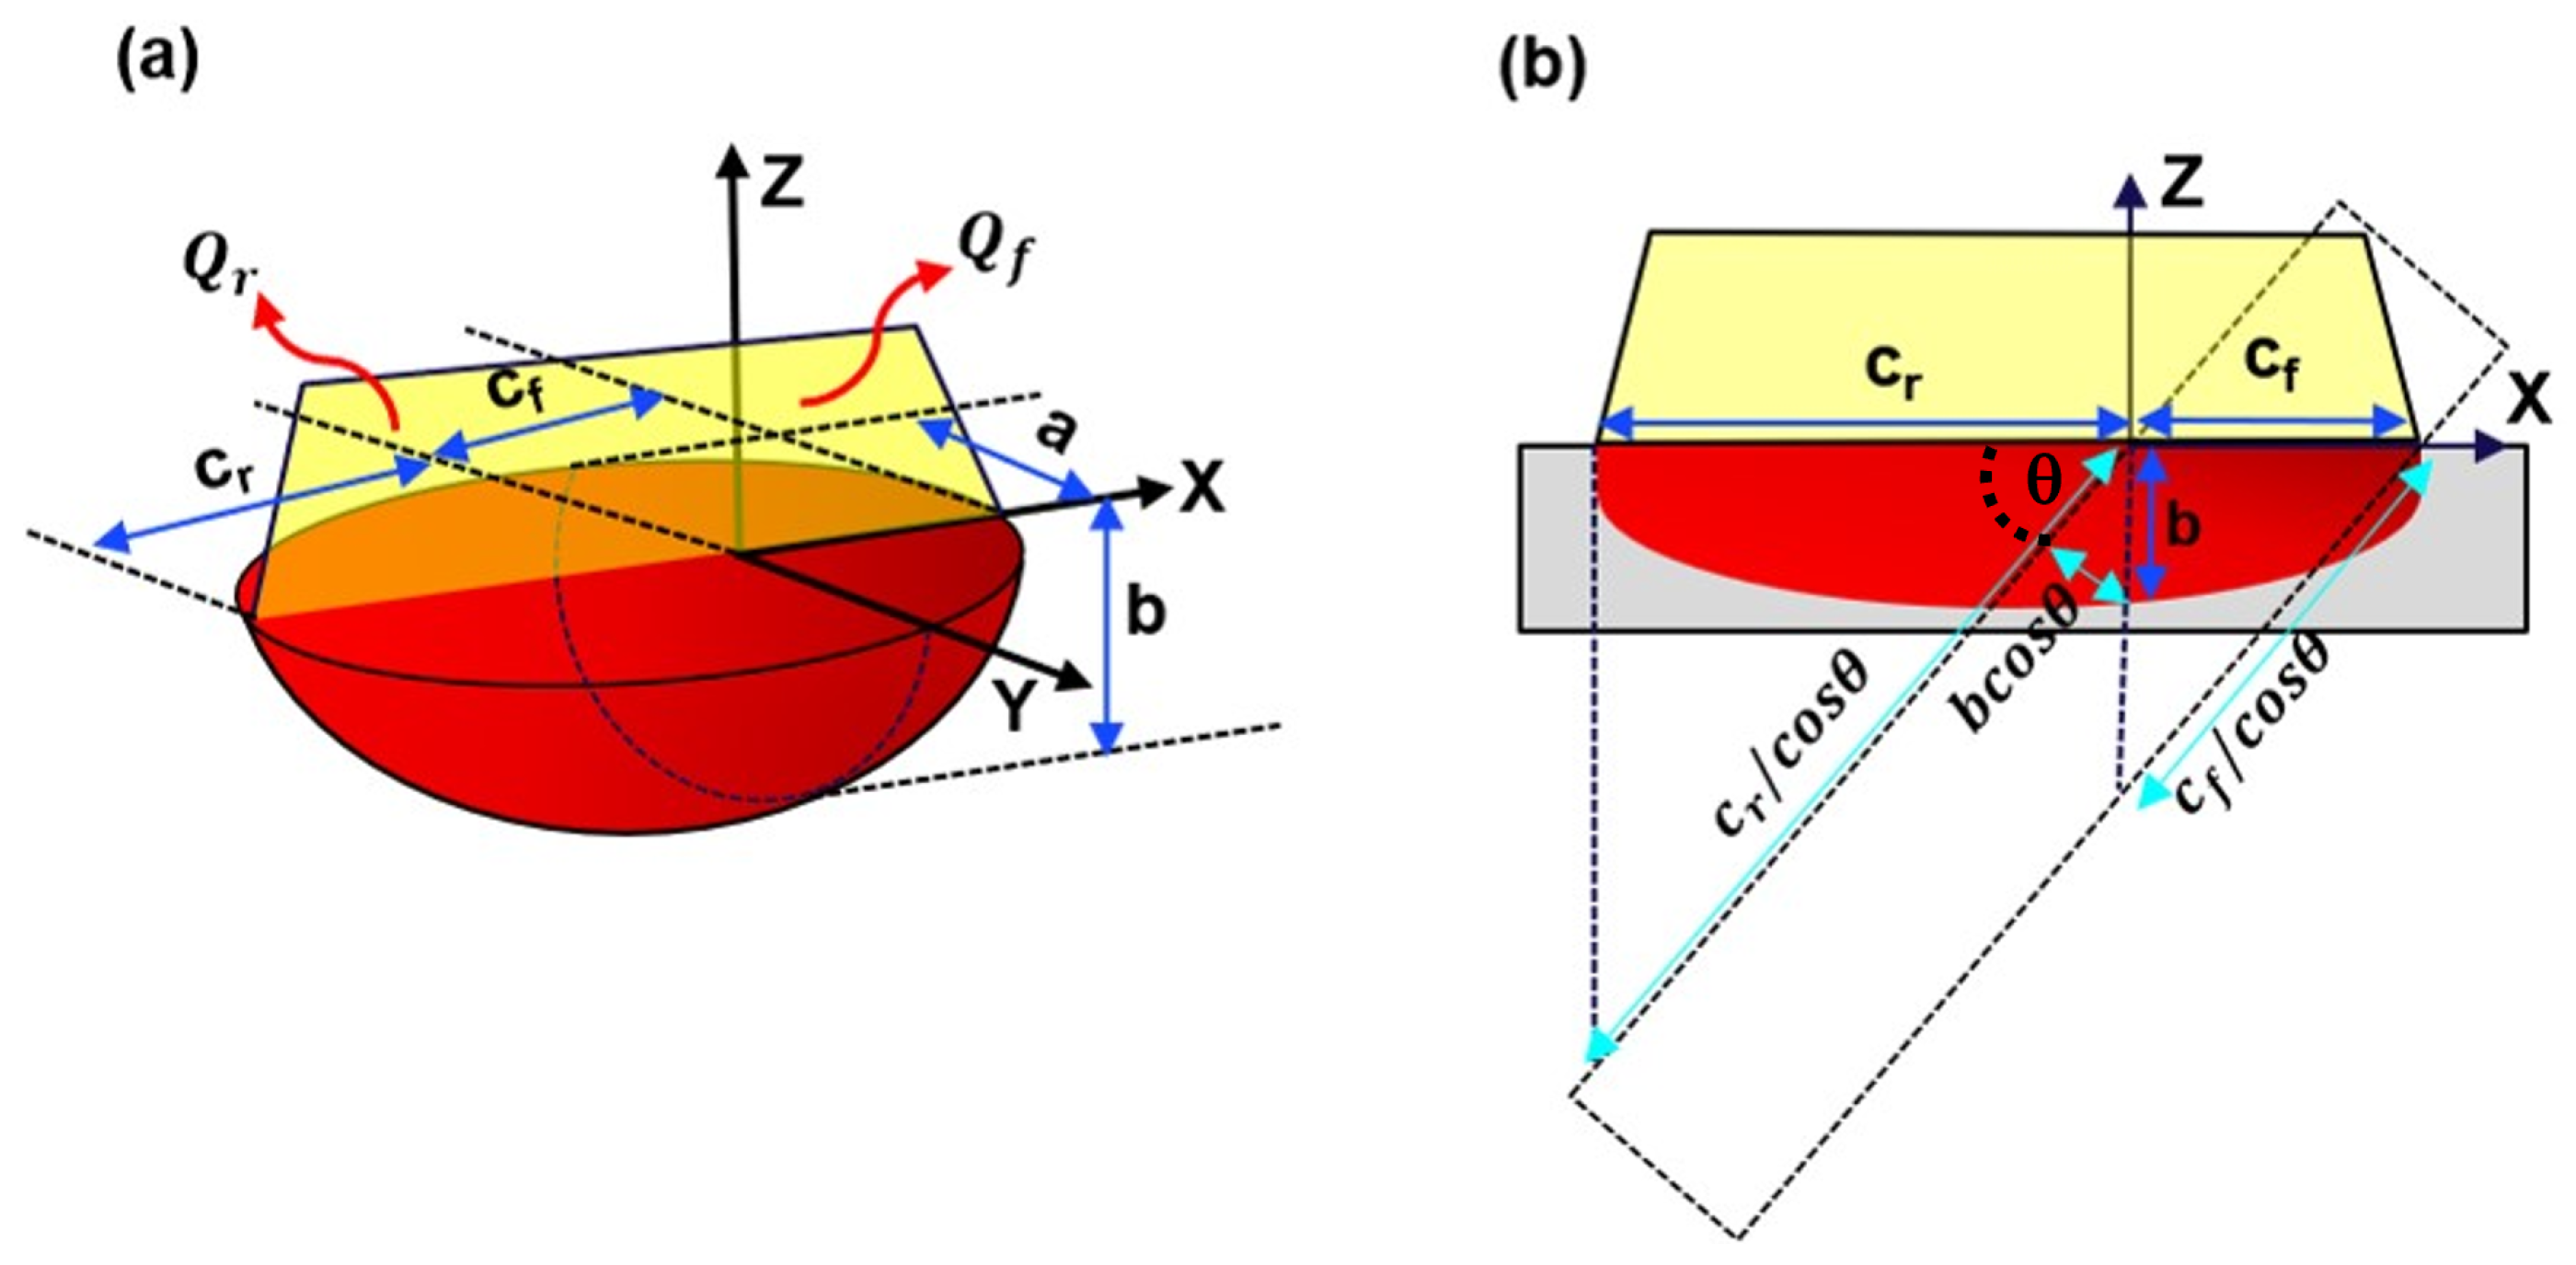
Figure 5.
FEA Model
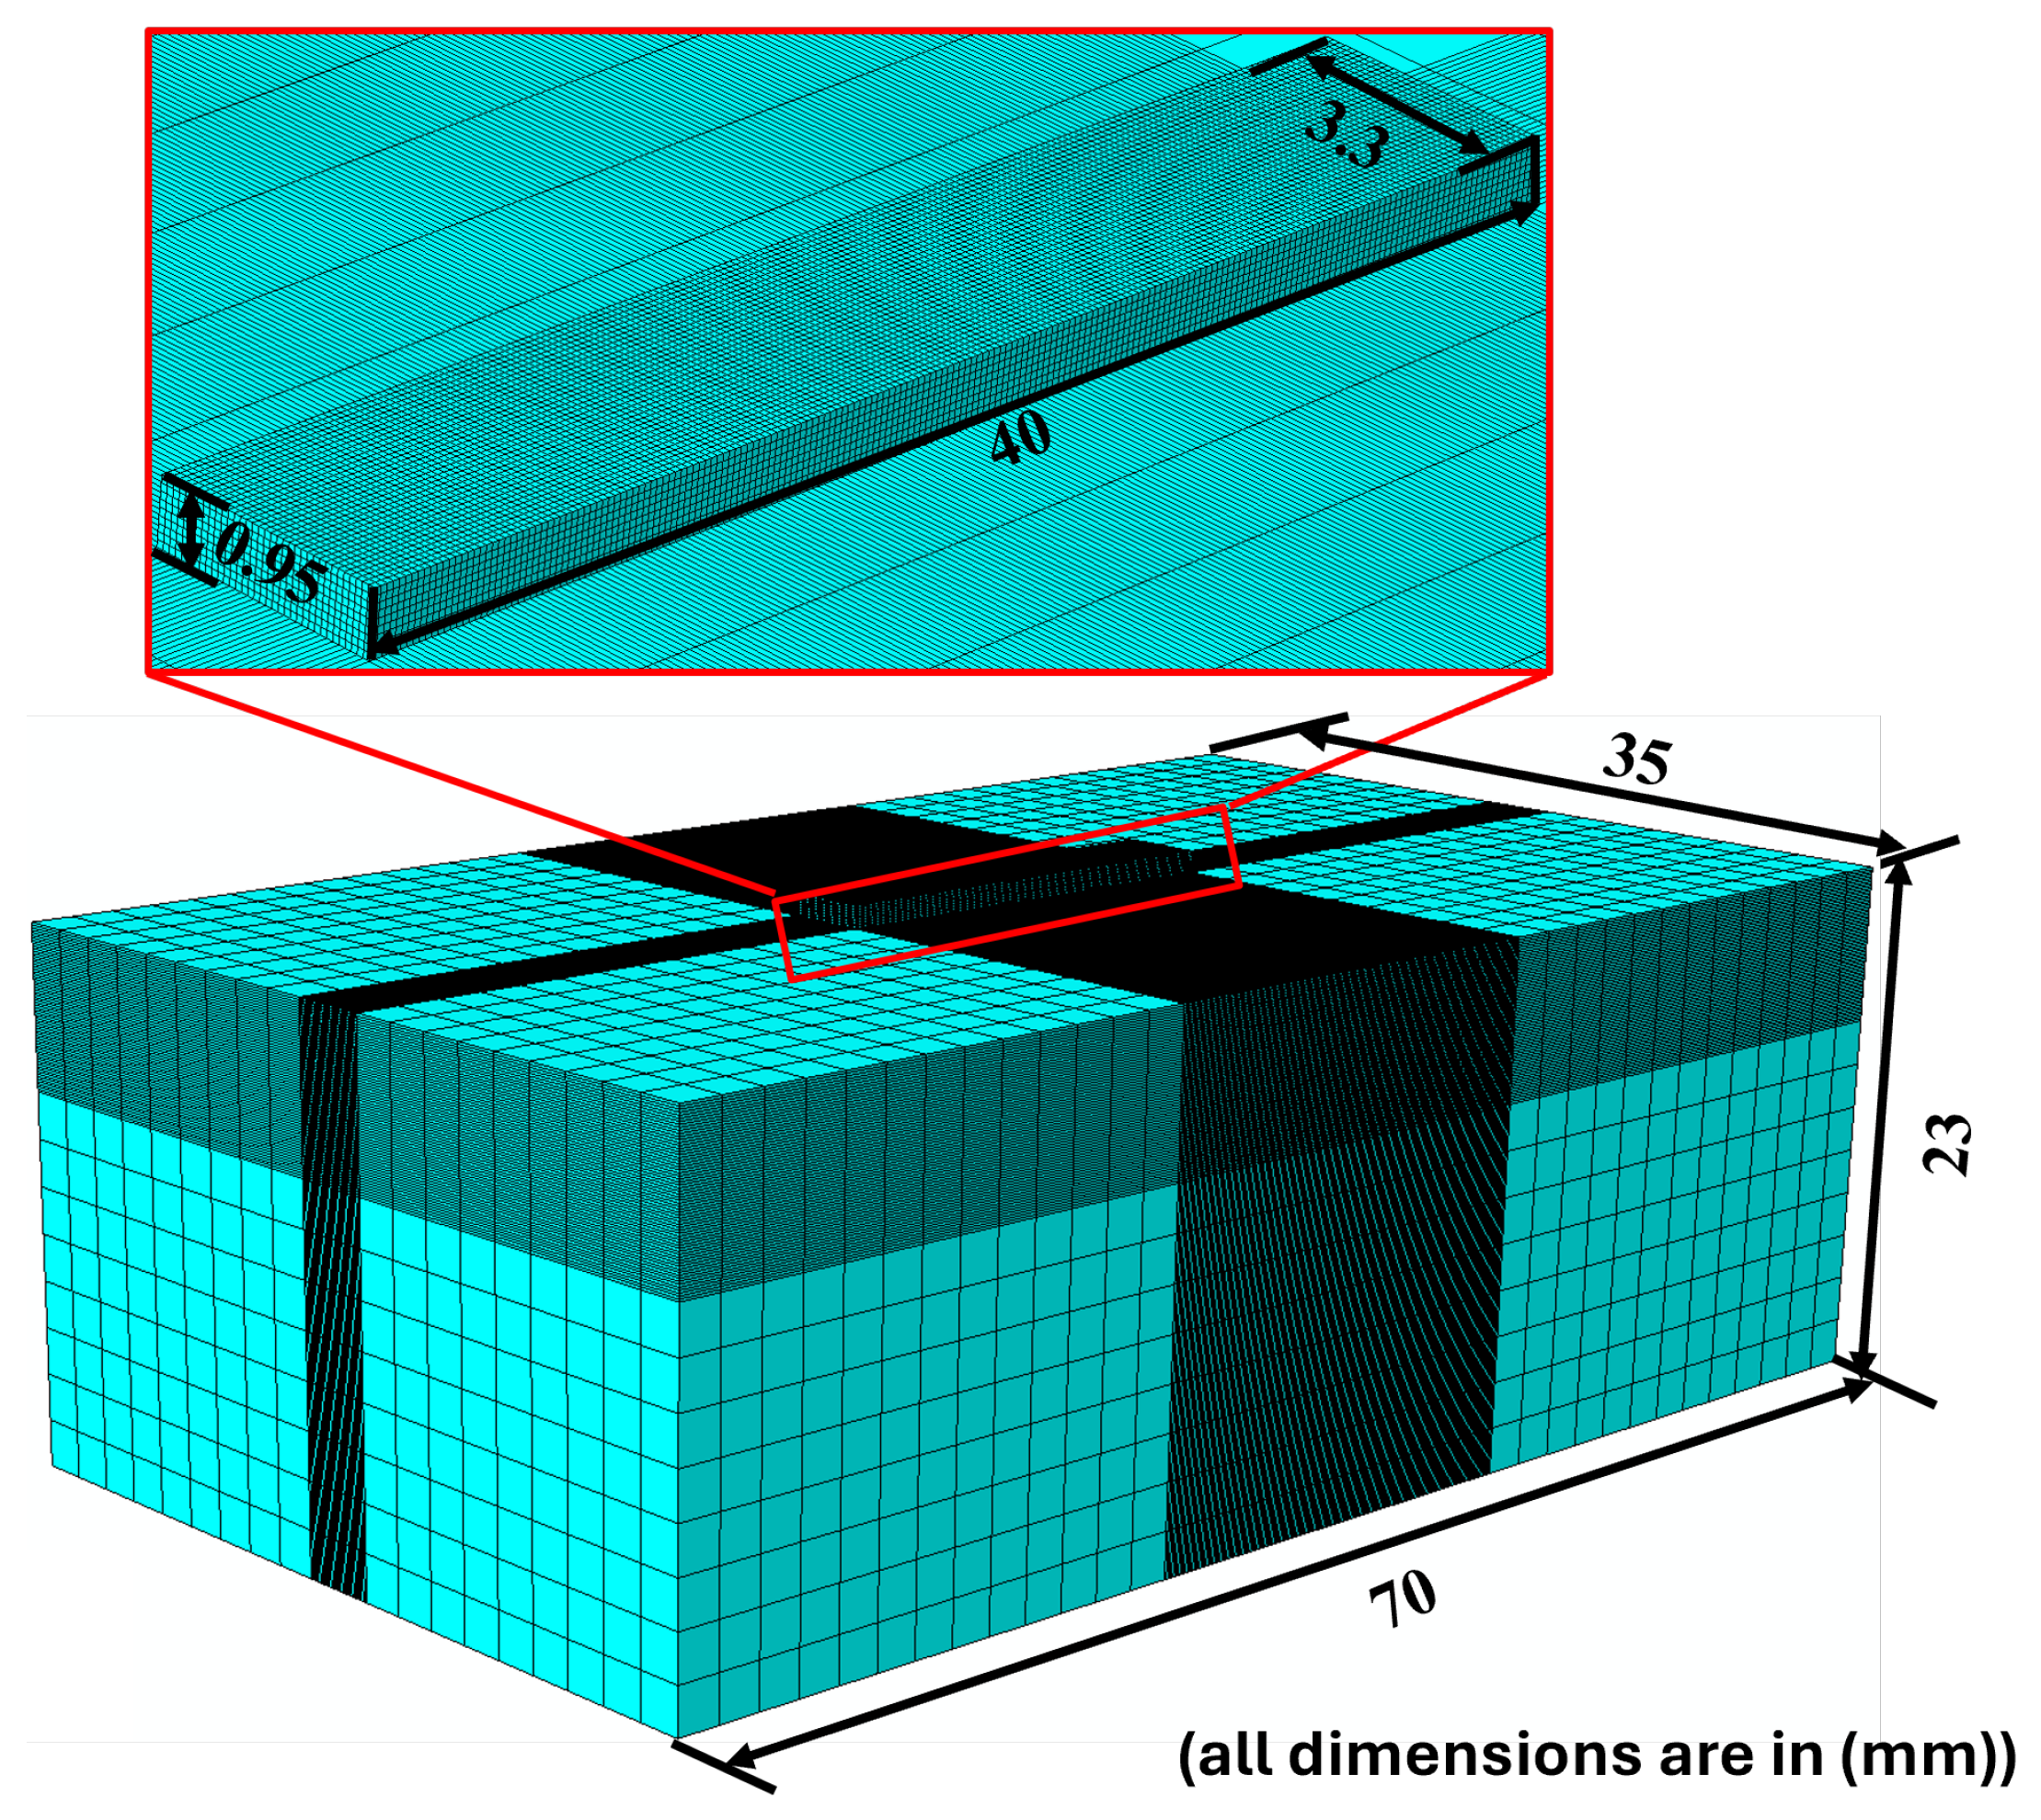
Figure 6.
Melt pool shape from (a) Thermal imaging camera; from simulation using (b) GDE heat source and (c) THDE heat source
Figure 6.
Melt pool shape from (a) Thermal imaging camera; from simulation using (b) GDE heat source and (c) THDE heat source
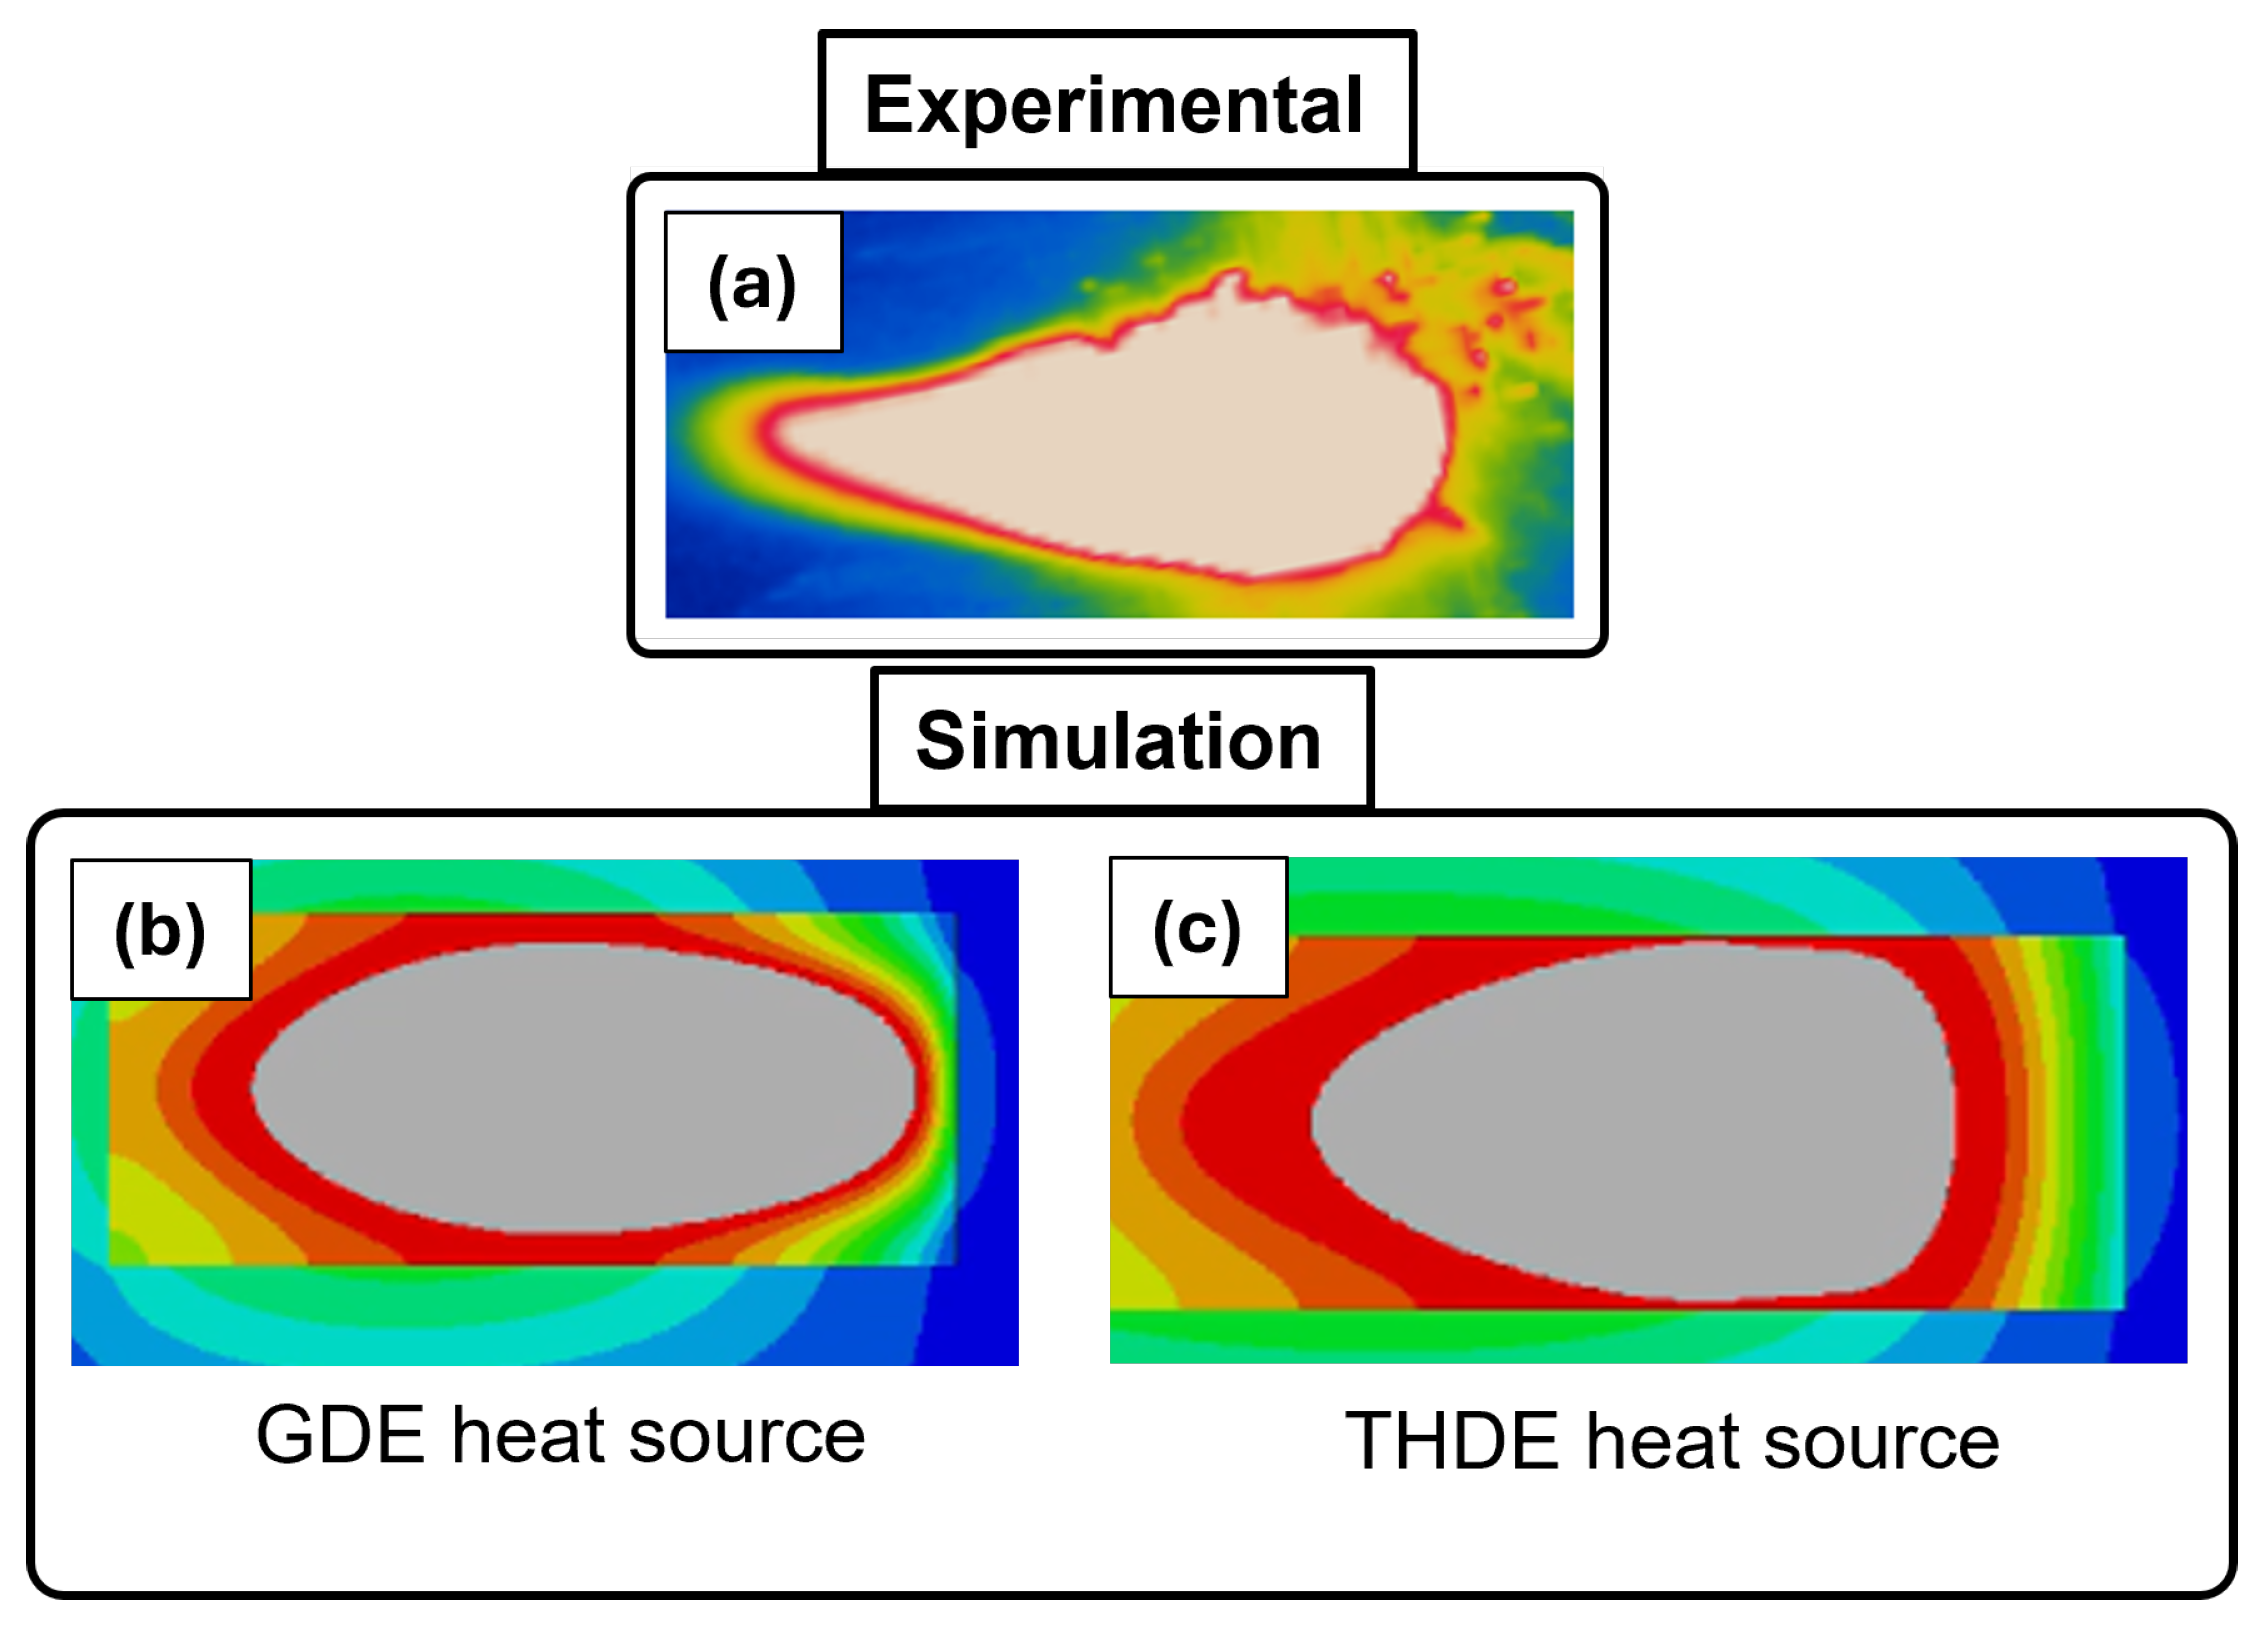
Figure 7.
Cross section of deposited track (a) experimental (b) simulated using THDE model
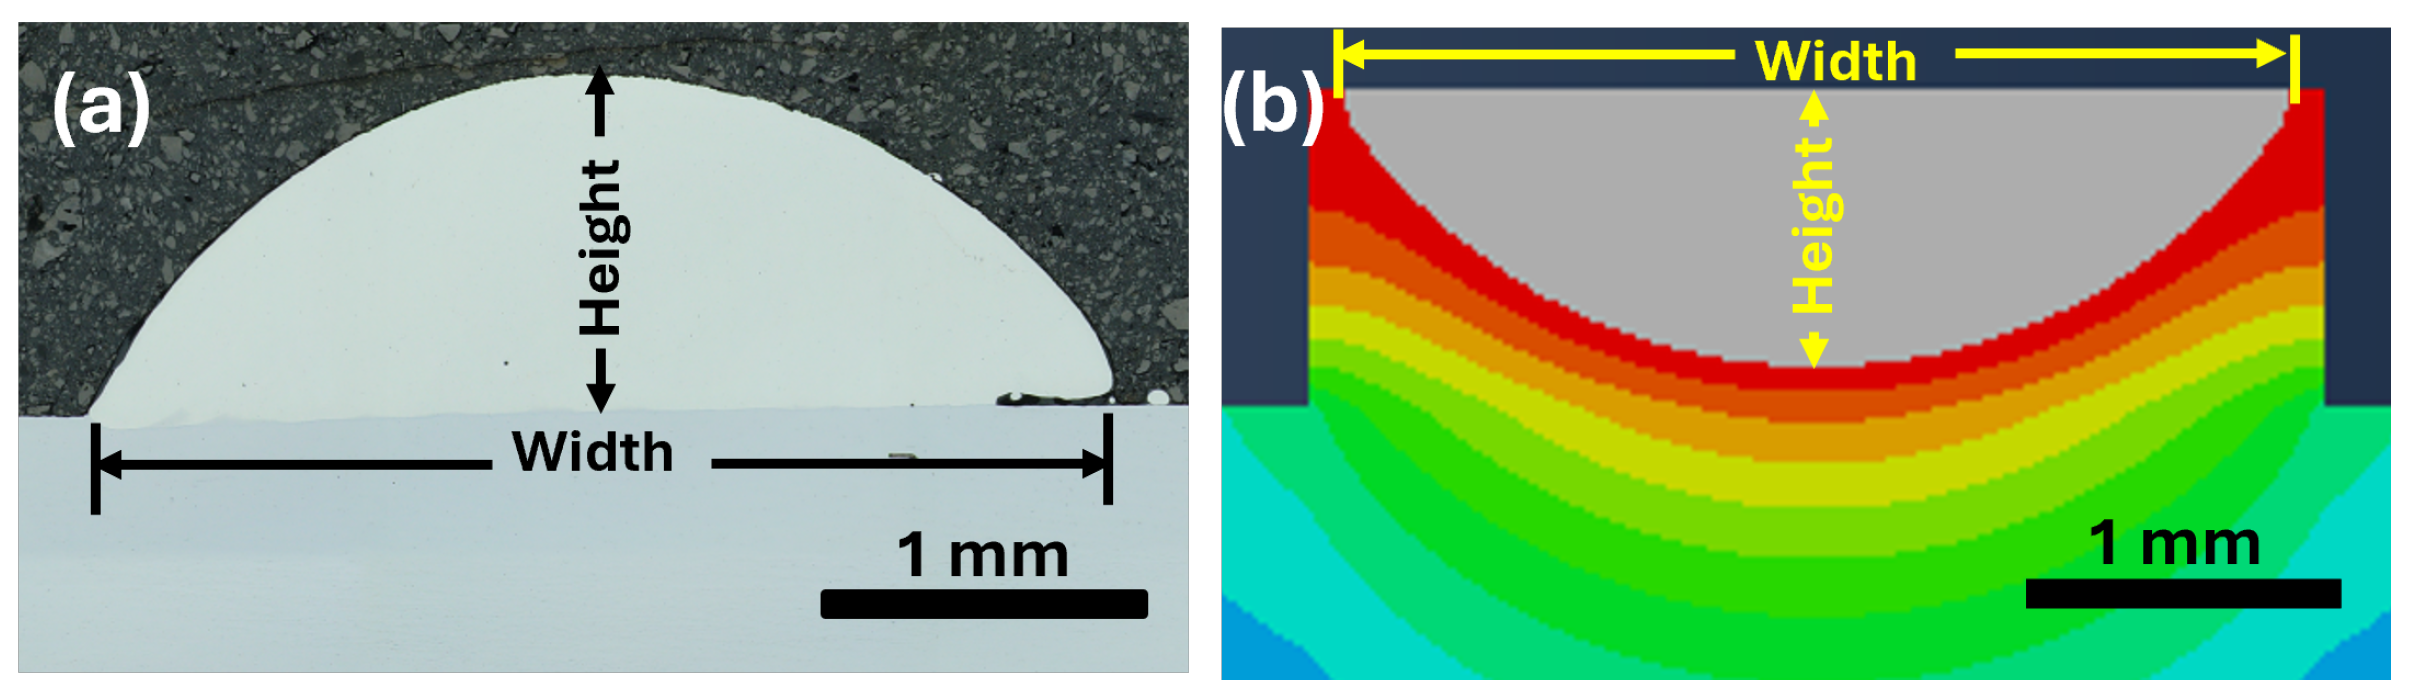
Figure 8.
Parity plot of melt pool geometry
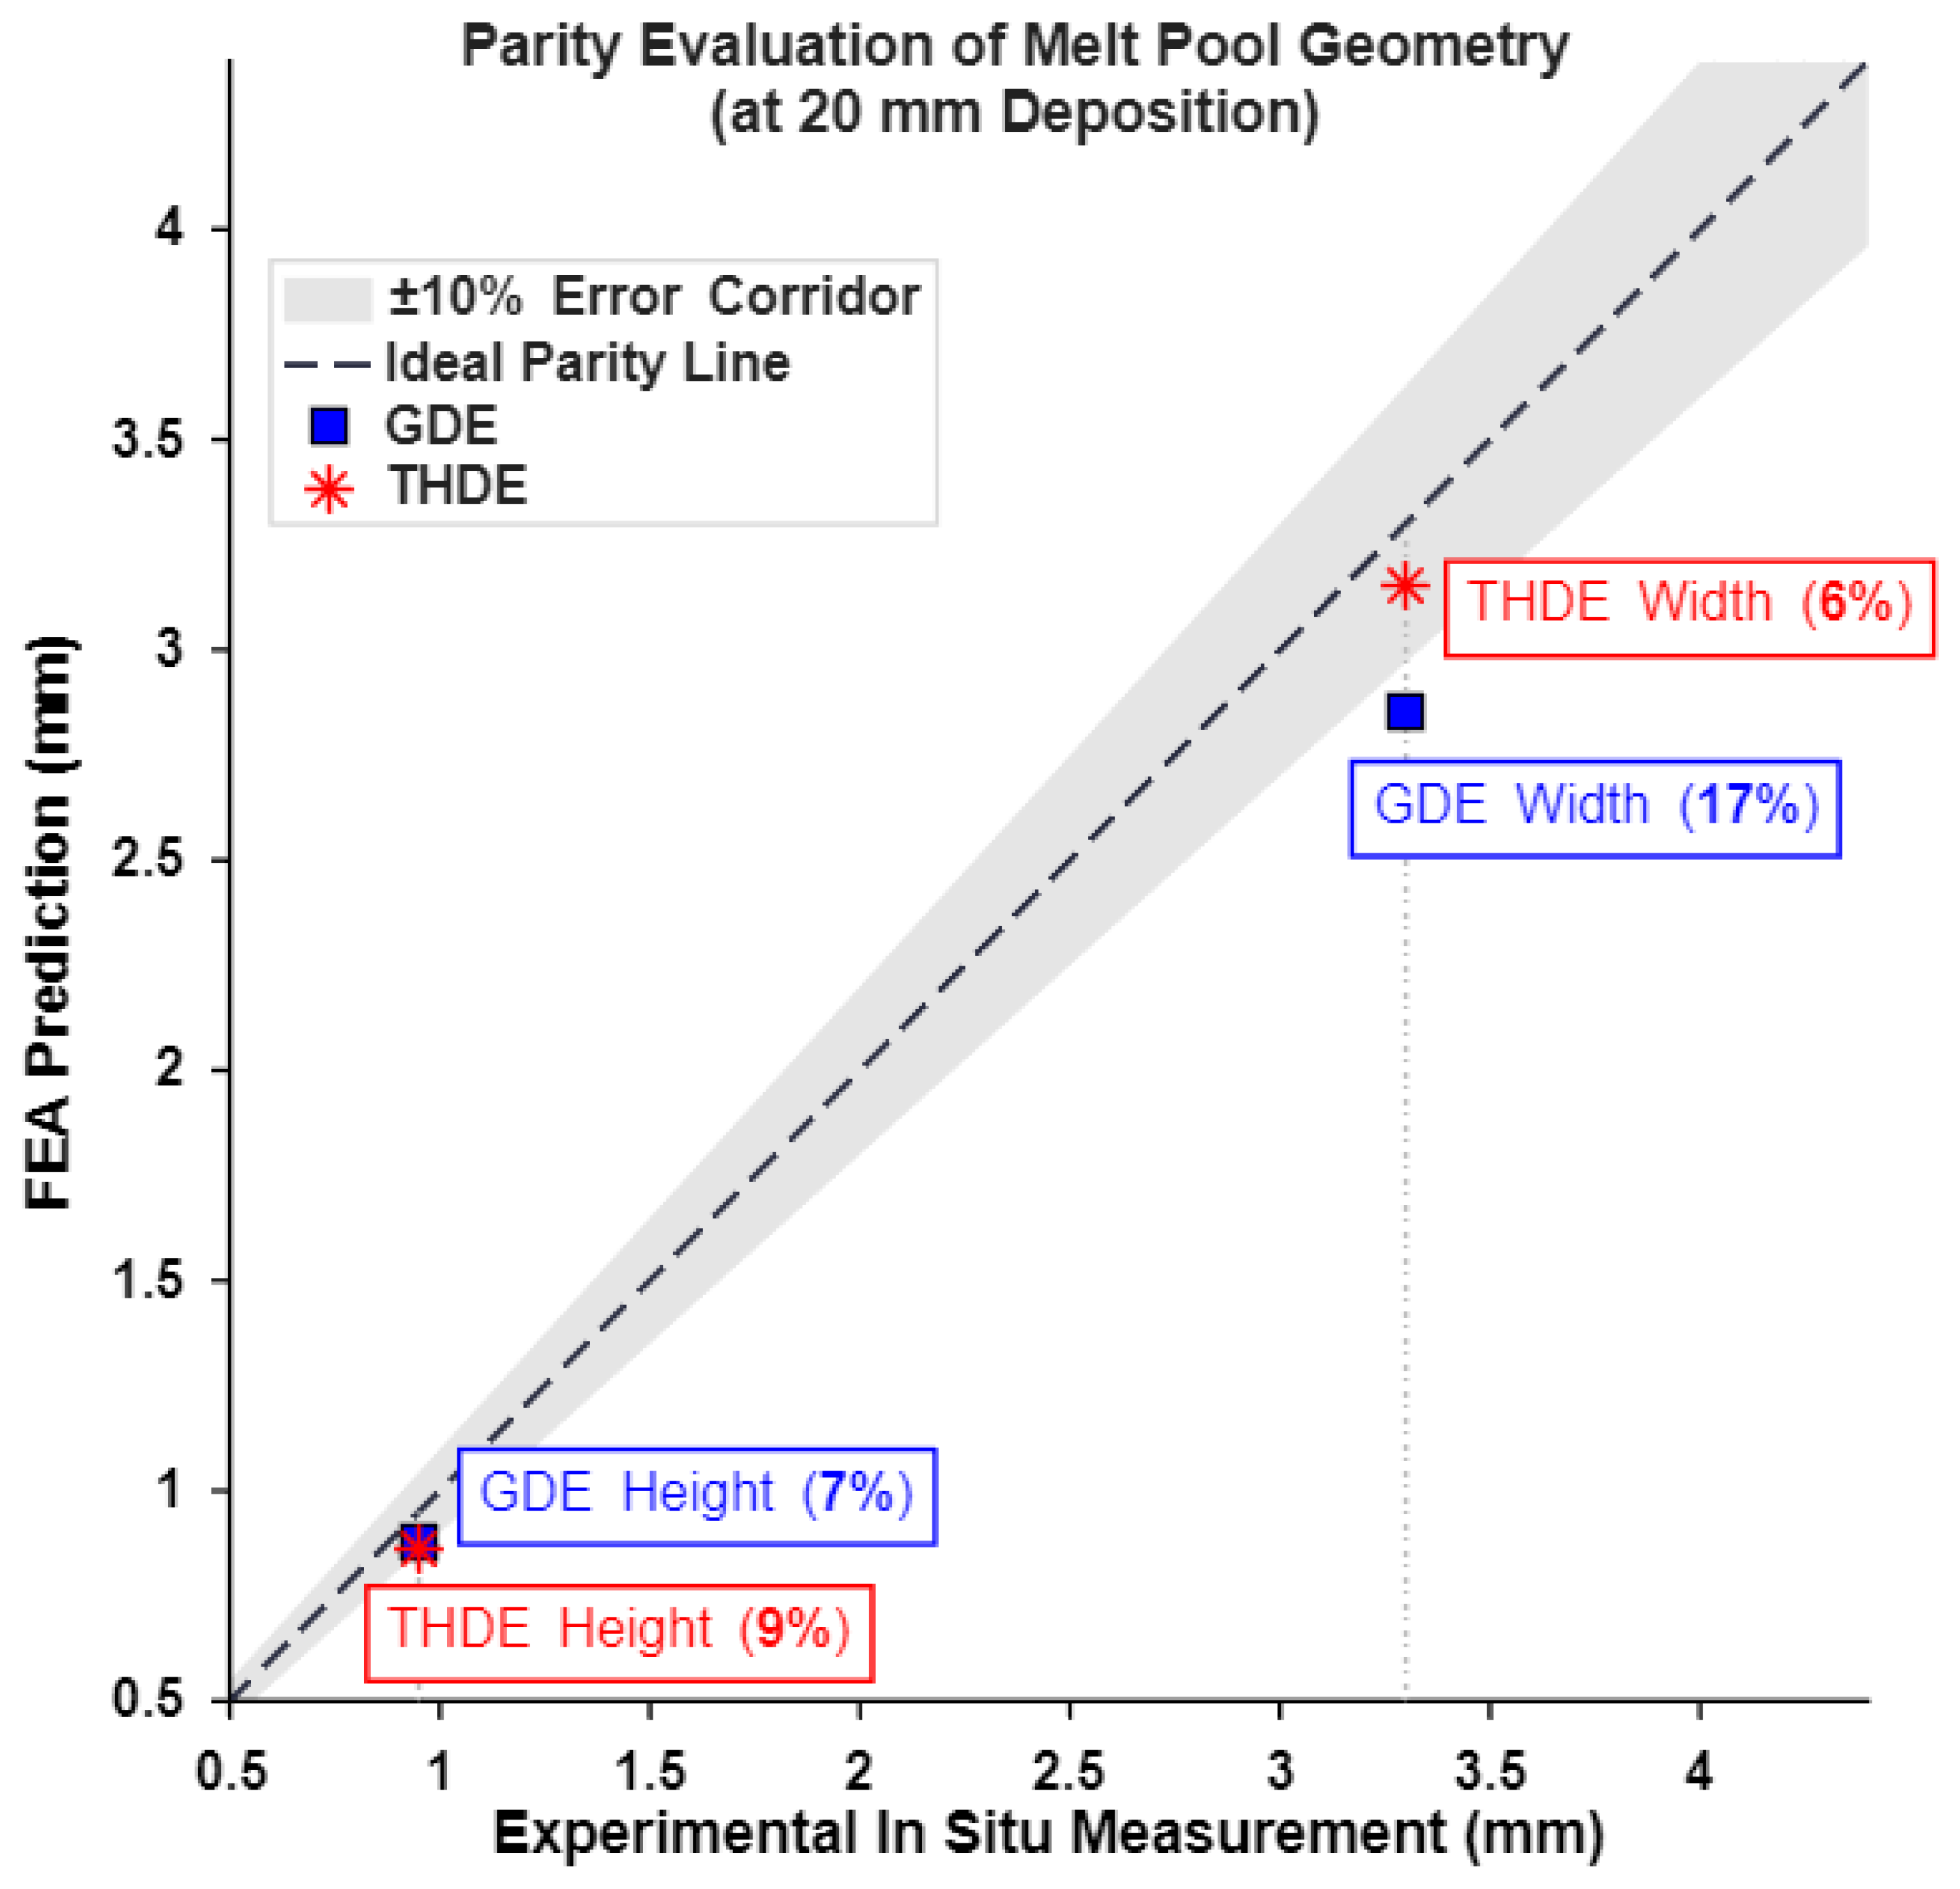
Figure 9.
Melt-pool peak temperature (a) In-situ (b) simulation
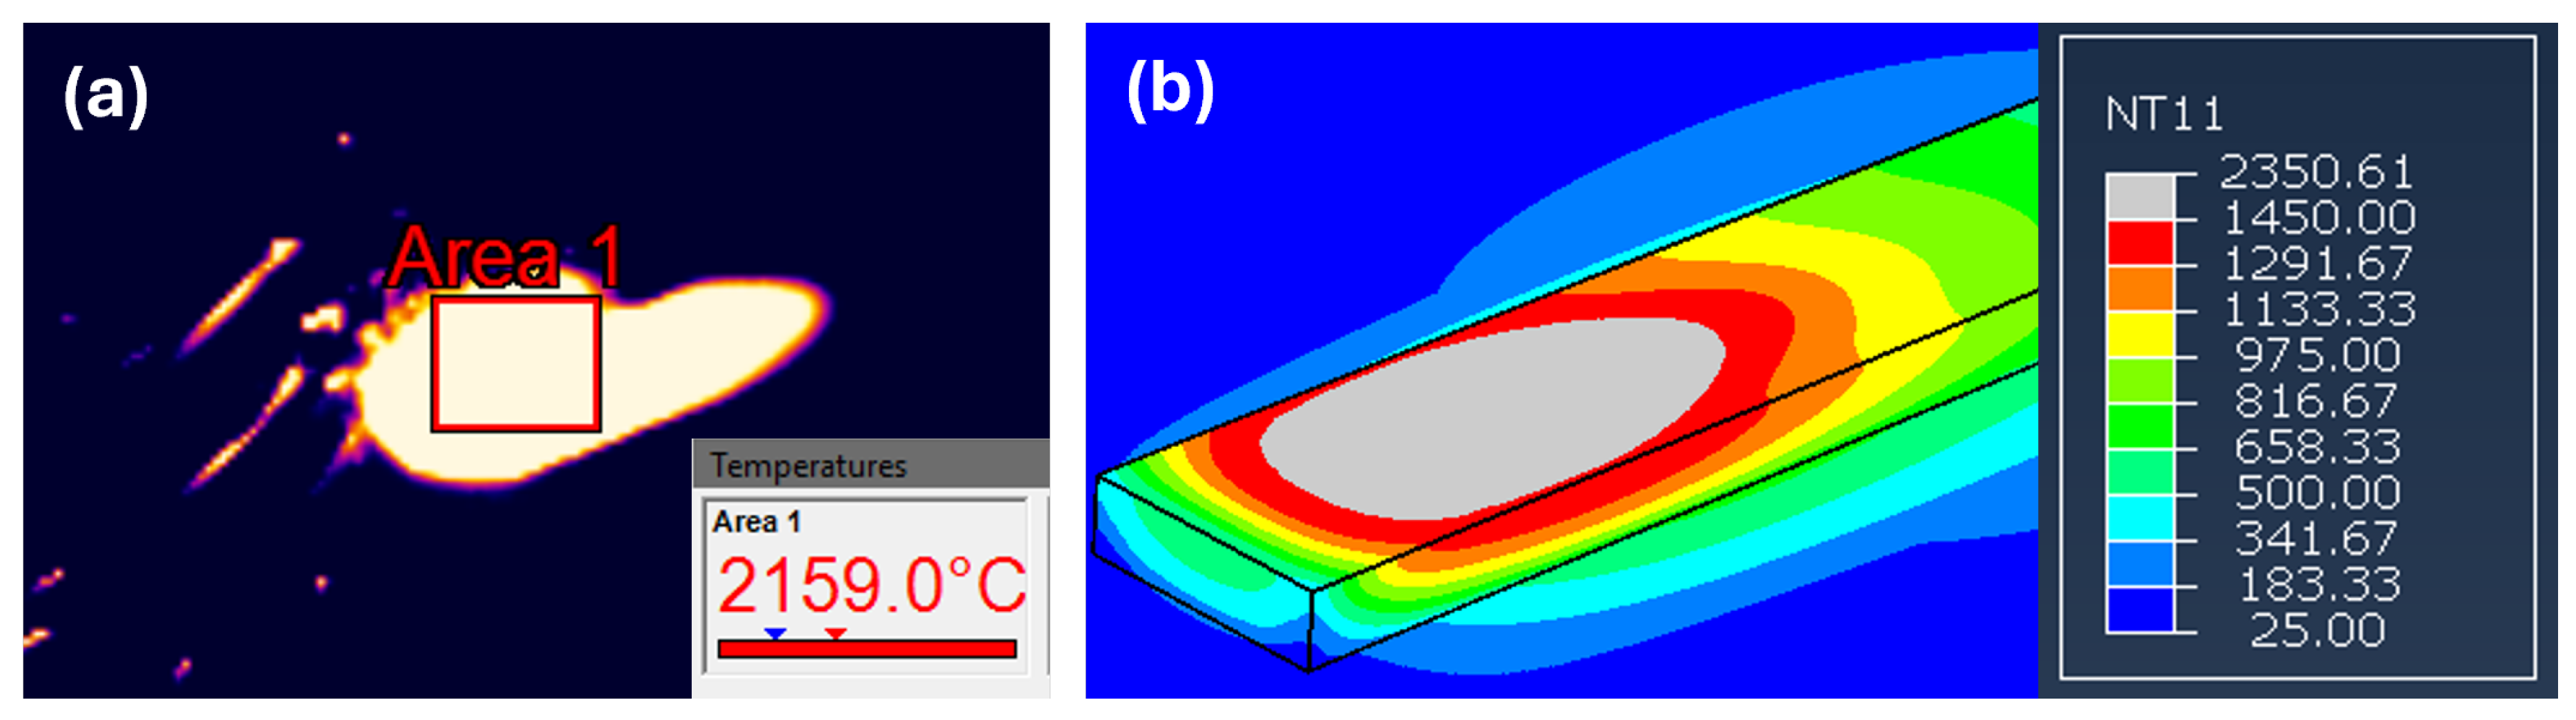
Figure 10.
(a) Temperature profile during single track deposition (b) embedded thermocouple location (up) and corresponsing node in FEA simulation (bottom)
Figure 10.
(a) Temperature profile during single track deposition (b) embedded thermocouple location (up) and corresponsing node in FEA simulation (bottom)
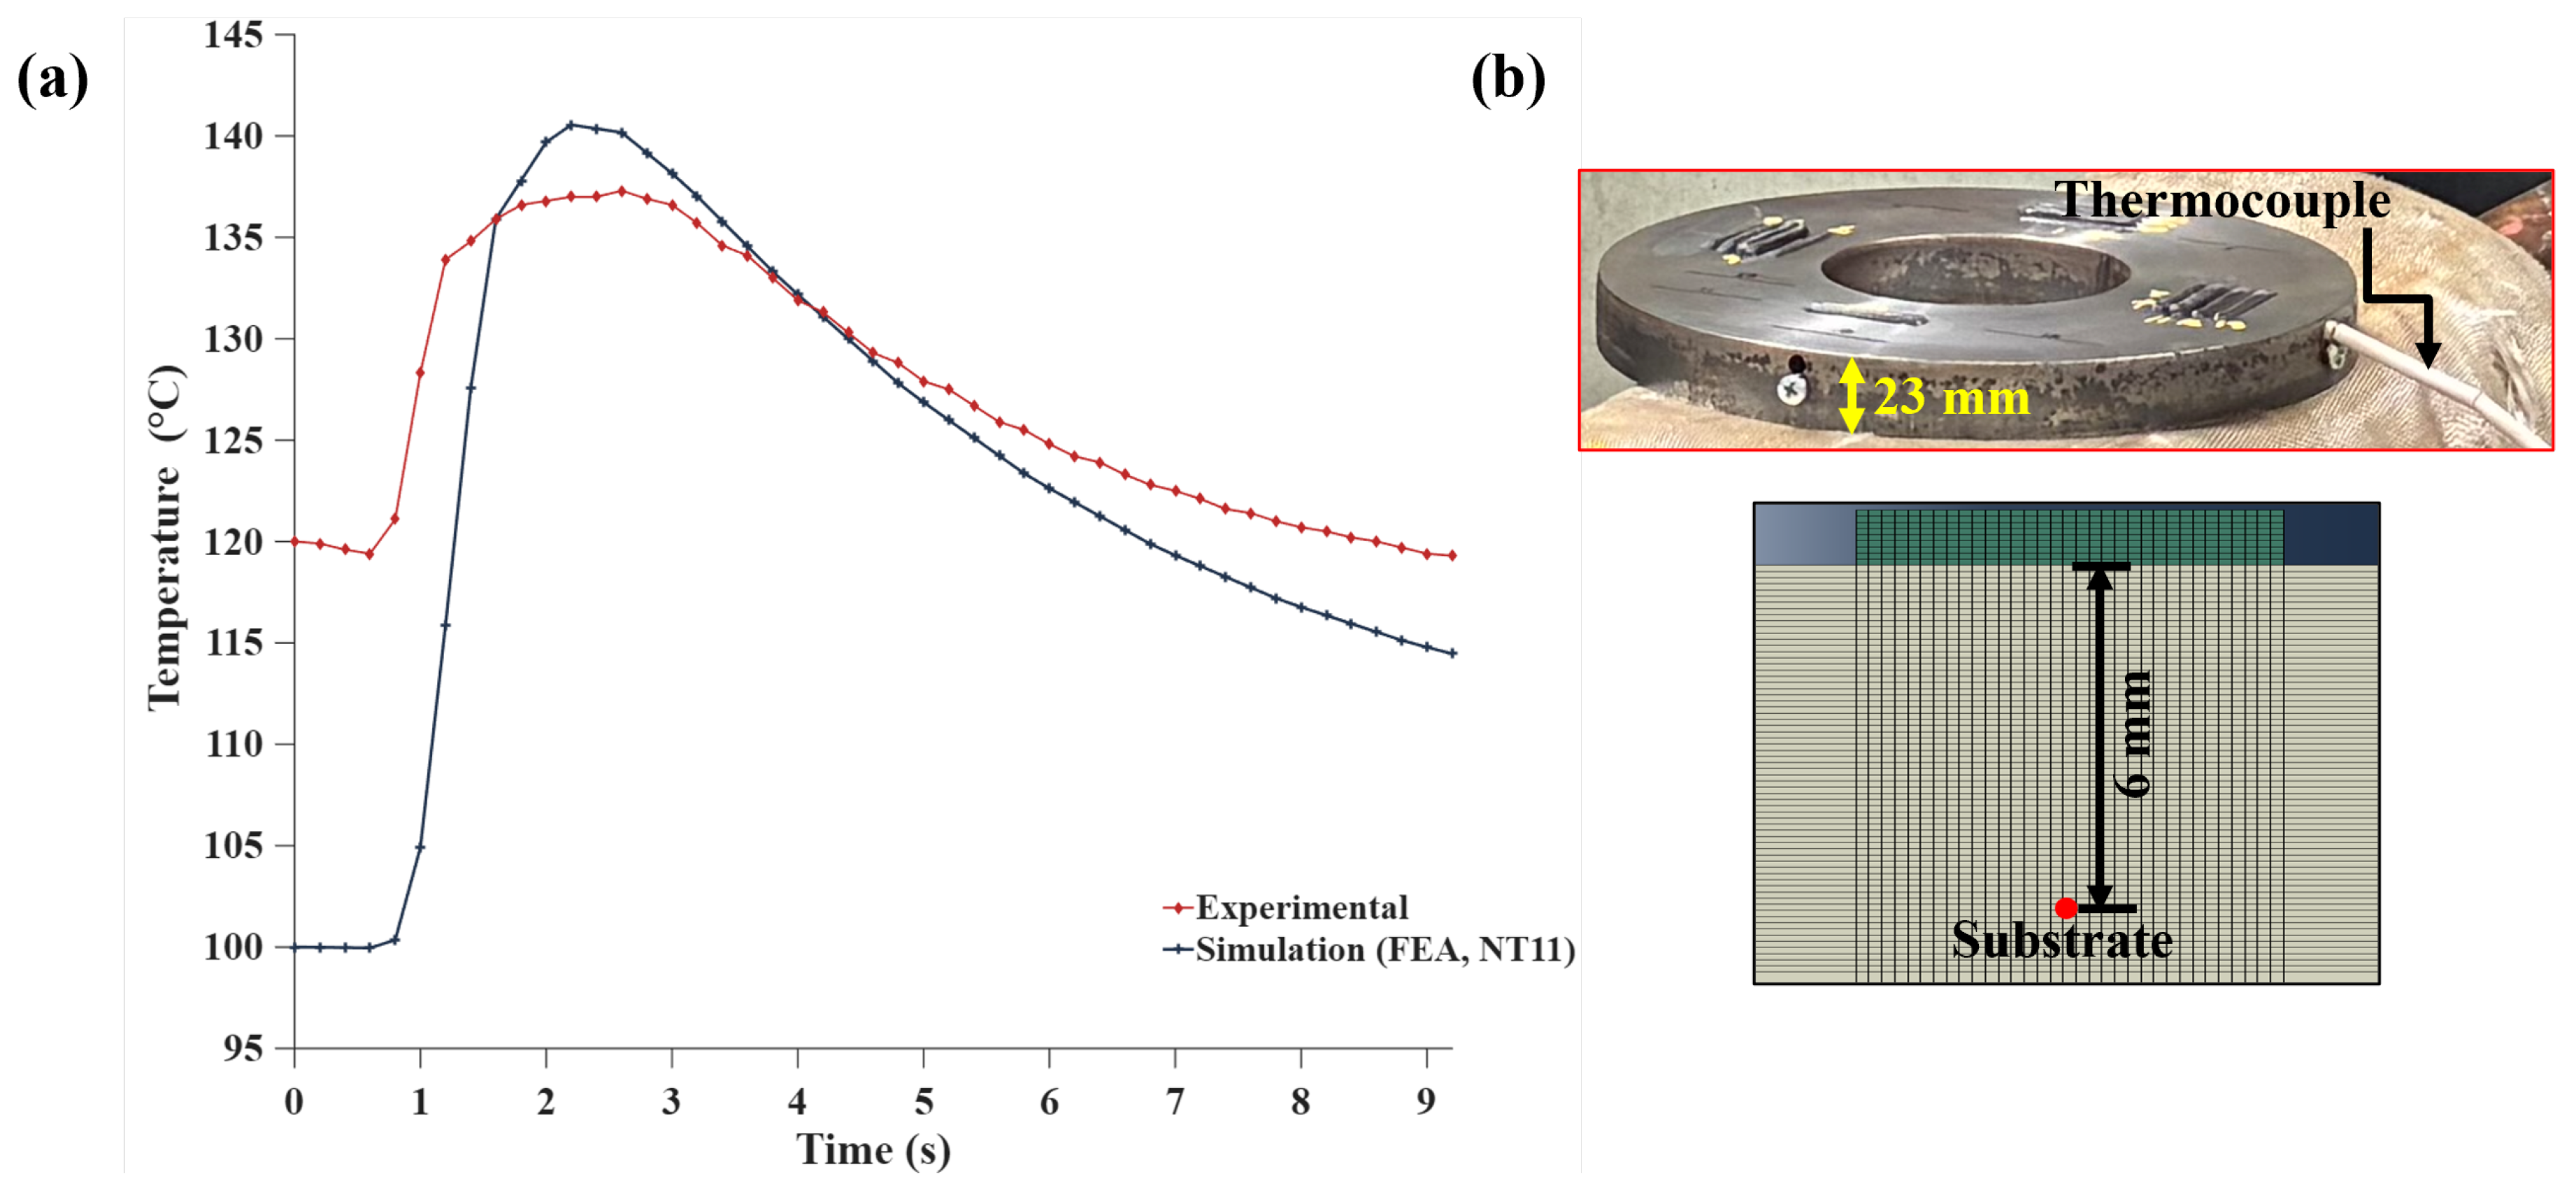
Figure 11.
Spatial cooling-rate analysis along the deposition track: (a) infrared thermograph showing transverse measurement lines A, B and C spaced 10 mm apart; (b) corresponding FEA temperature contour with the nodal extraction lines and the deposition direction; (c) comparison of the experimental and simulated mean liquidus–solidus cooling rates across locations A, B and C
Figure 11.
Spatial cooling-rate analysis along the deposition track: (a) infrared thermograph showing transverse measurement lines A, B and C spaced 10 mm apart; (b) corresponding FEA temperature contour with the nodal extraction lines and the deposition direction; (c) comparison of the experimental and simulated mean liquidus–solidus cooling rates across locations A, B and C
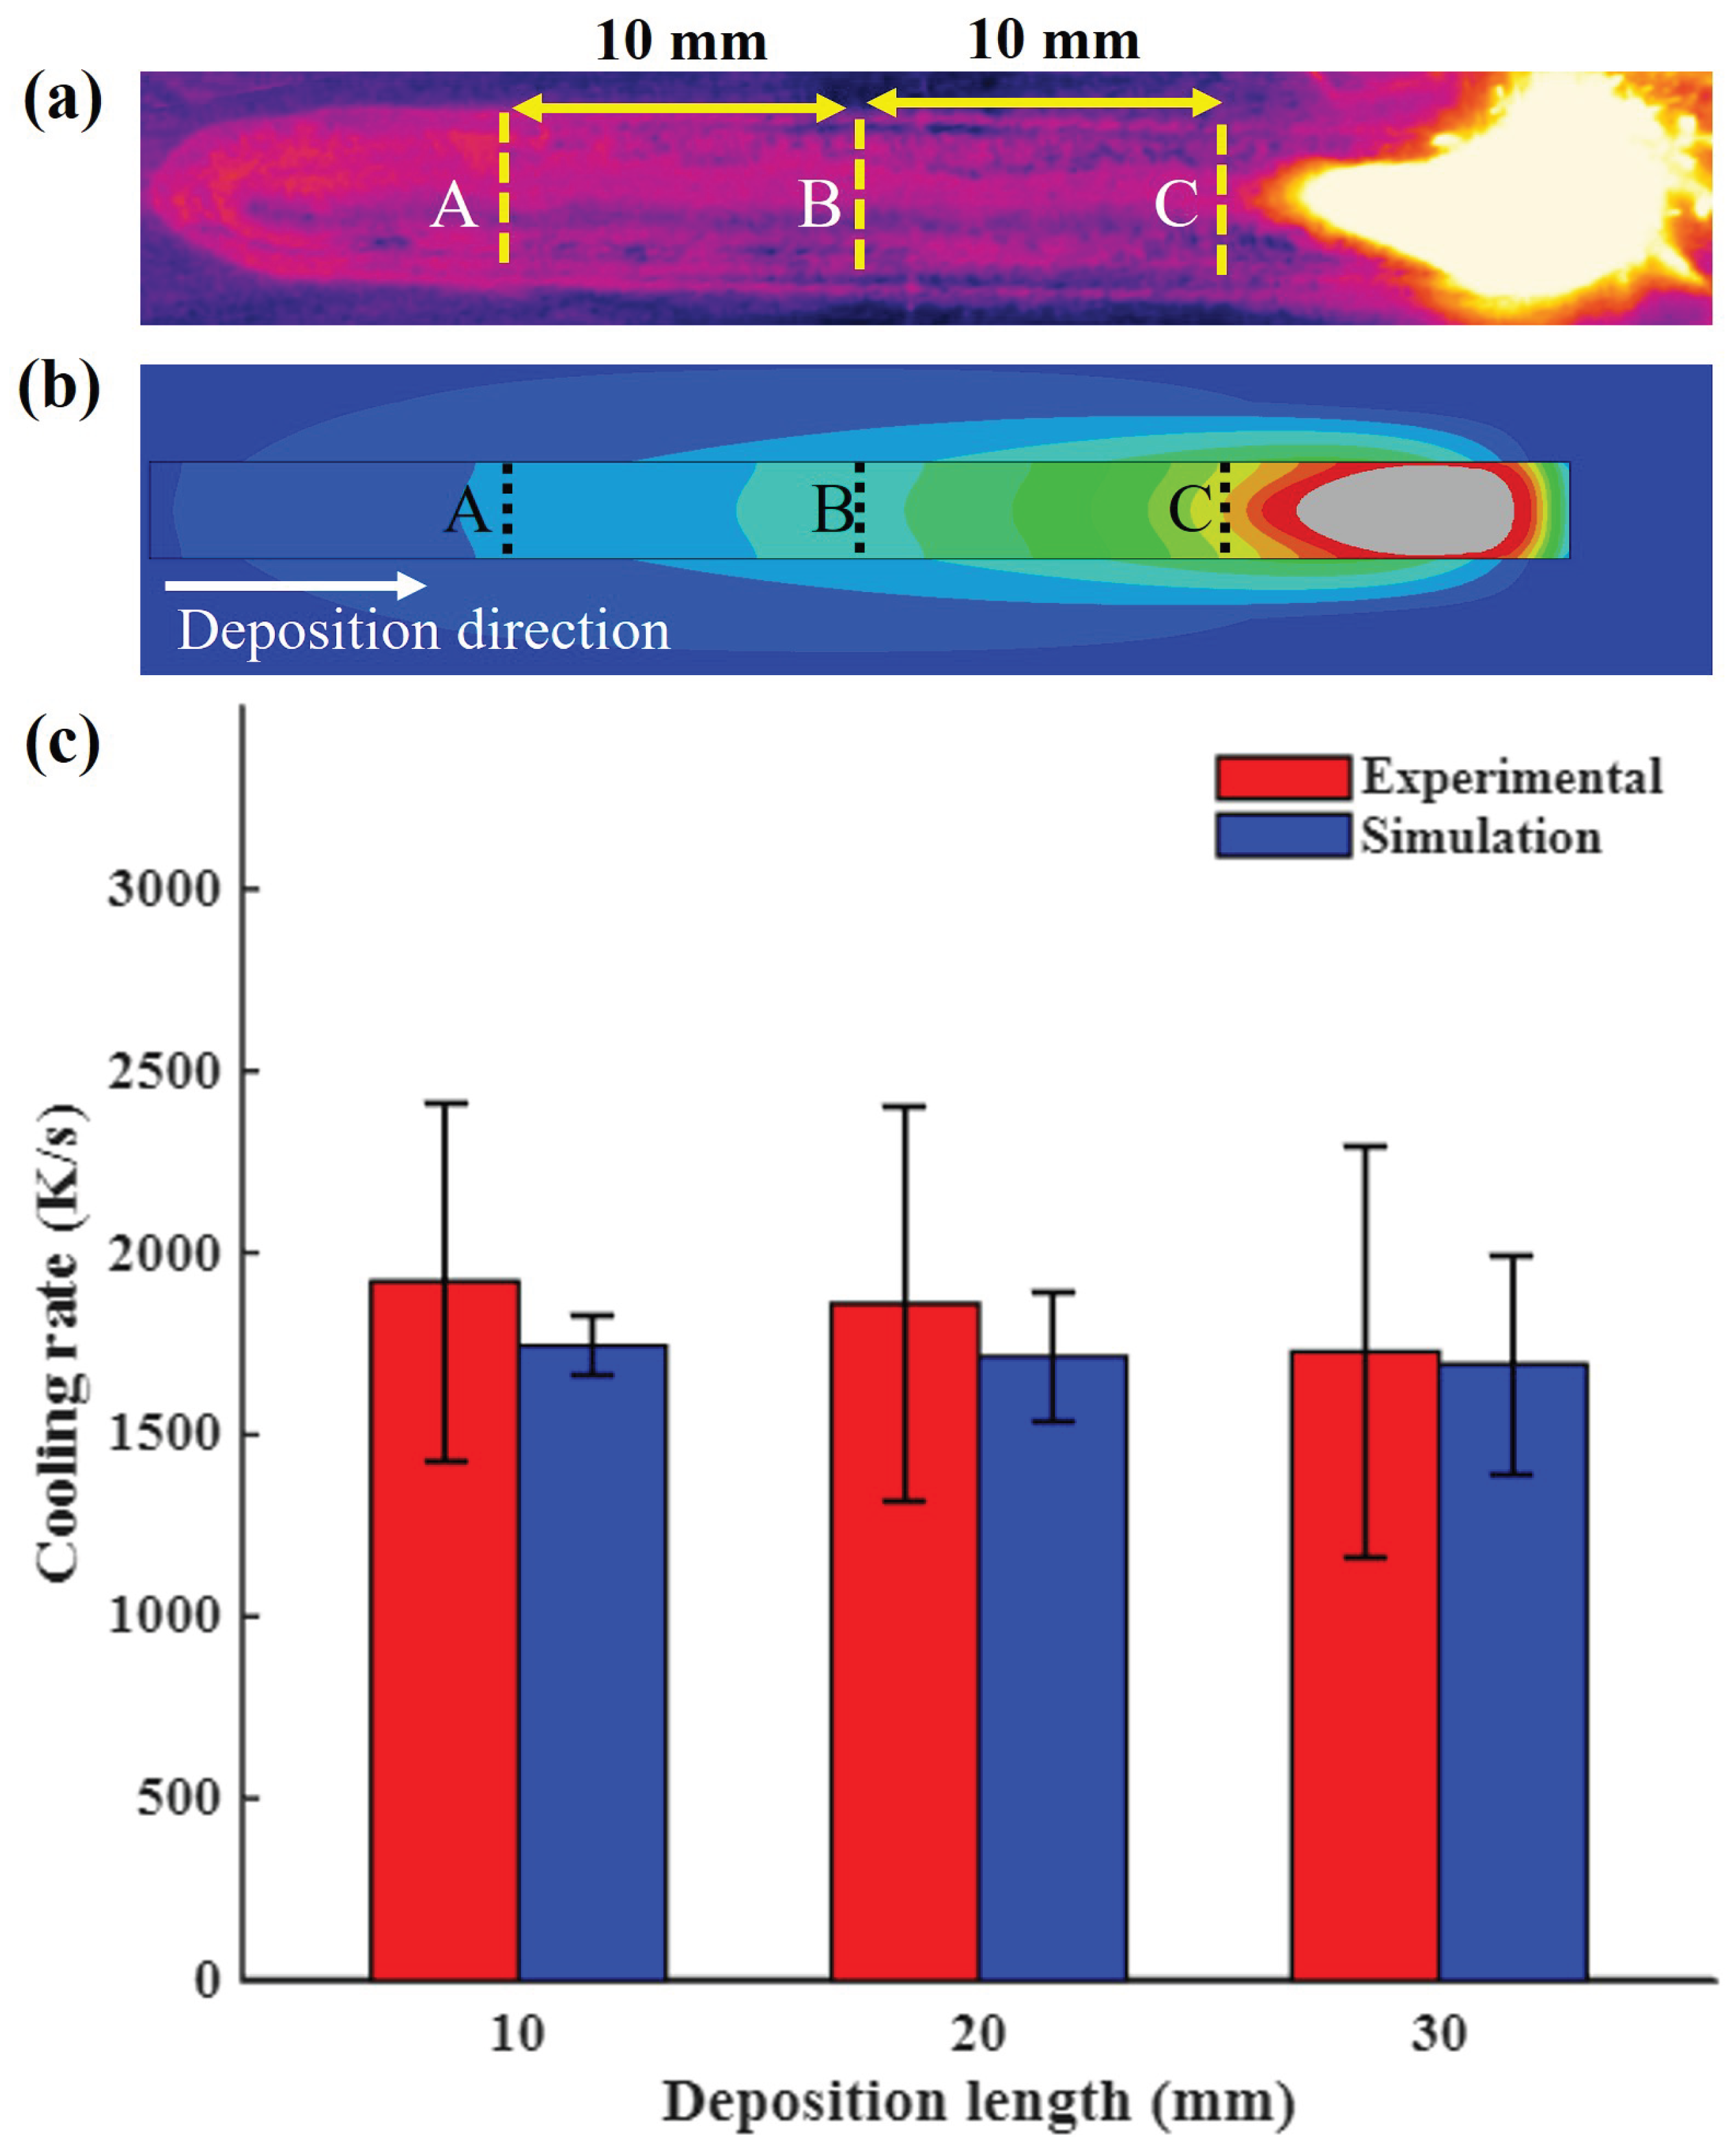

Table 1.
Chemical compositions (wt.%) of the laser-cladded (SS316L) [32] and substrate (G250) [33] materials
| Material | Fe | Cr | Ni | Mo | Mn | C | Si | P | S | Al | N |
|---|---|---|---|---|---|---|---|---|---|---|---|
| SS316L | Bal. | 16.4 | 12.6 | 2.4 | 1.5 | 0.01 | 0.6 | — | — | — | 0.1 |
| G250 | Bal. | — | — | — | 0.25 | 0.07 | 0.03 | 0.02 | 0.02 | 0.07 | — |
Table 2.
Temperature-independent thermophysical properties of SS316L [42].
Table 2.
Temperature-independent thermophysical properties of SS316L [42].
| Specific Latent Heat | Solidus Temperature | Liquidus Temperature | Density |
|---|---|---|---|
| H (kJ ) | (°C) | (°C) | (kg ) |
| 256.4 | 1420 | 1450 | 7800 |
Table 3.
Temperature-dependent thermophysical properties of SS316L [42].
Table 3.
Temperature-dependent thermophysical properties of SS316L [42].
| Temperature | Thermal Conductivity | Specific Heat |
|---|---|---|
| T (°C) | k (W.. ) | (J.. ) |
| 20 | 14 | 450 |
| 100 | 15.1 | 490 |
| 200 | 16.4 | 522 |
| 300 | 17.8 | 545 |
| 400 | 19.1 | 555 |
| 500 | 20.5 | 566 |
| 600 | 21.8 | 583 |
| 700 | 23.2 | 600 |
| 800 | 24 | 614 |
| 900 | 25.9 | 629 |
| 1000 | 27 | 643 |
| 1100 | 28.6 | 657 |
| 1200 | 29.9 | 671 |
| 1300 | 31.3 | 686 |
| 1400 | 32.6 | 700 |
| 1500 | 34.25 | 715 |
Disclaimer/Publisher’s Note: The statements, opinions and data contained in all publications are solely those of the individual author(s) and contributor(s) and not of MDPI and/or the editor(s). MDPI and/or the editor(s) disclaim responsibility for any injury to people or property resulting from any ideas, methods, instructions or products referred to in the content. |
© 2026 by the authors. Licensee MDPI, Basel, Switzerland. This article is an open access article distributed under the terms and conditions of the Creative Commons Attribution (CC BY) license (http://creativecommons.org/licenses/by/4.0/).
Copyright: This open access article is published under a Creative Commons CC BY 4.0 license, which permit the free download, distribution, and reuse, provided that the author and preprint are cited in any reuse.