

Submitted:
19 October 2026
Posted:
21 October 2026
You are already at the latest version
Abstract
Published database comparisons typically cover engine pairs, conflate the engine effect with the schema effect, and compare queries that do not compute the same result. We present StreamCart, a benchmark built on a realistic e-commerce workload, and use it to decompose performance across six systems, PostgreSQL as an optimized relational baseline and five specialized engines (MongoDB, Cassandra, Neo4j, Elasticsearch, TimescaleDB), each implemented at a naive migration level and at an engine-optimized level, eleven configurations in all. Result equivalence for the claim-bearing analytics queries is verified row by row against the relational reference. Across seven read query classes, no naive implementation outperforms the baseline on any query, and no single engine dominates, with the classes splitting between PostgreSQL, optimized Elasticsearch, and optimized MongoDB. Schema design emerges as a factor on par with engine choice, improving performance by up to 3892 times on Cassandra and 137 times on Elasticsearch, where load-time denormalization lets the optimized form outperform PostgreSQL by 15.8 and 6.3 times on identical results, while a single omitted uniqueness constraint reduced Neo4j write throughput a hundredfold. Concurrent write throughput spans roughly two orders of magnitude (165 to 12,603 events per second). All code, data, and raw timings are public.
Keywords:
database benchmarking
; NoSQL
; relational databases
; schema design
; performance evaluation
; e-commerce
; Elasticsearch
; PostgreSQL
1. Introduction
Relational database systems remain the default persistence choice for business applications [1], and for good reasons, a mature optimizer, declarative querying, and decades of operational practice. At the same time, two decades of specialized engines, document, wide-column, graph, search, and time-series systems, have been built on the argument that one size no longer fits all [2]. For a practitioner building a data-intensive platform, the question is rarely ideological. It is whether migrating a concrete workload to a specialized engine will pay for itself, and under what conditions.
The published evidence answers this question poorly, for three reasons developed in Section 2. Most comparisons cover two or three systems under narrow workloads, so results do not compose across studies. Measured differences almost always mix two distinct causes, the architecture of the engine and the quality of the schema written for it, so a reader cannot tell whether a reported speedup comes from the technology or from the redesign that accompanied its adoption. And the compared queries frequently do not perform the same work, which makes headline ratios unverifiable. The practical consequence is that technology choices continue to be made on defaults, familiarity, or vendor benchmarks.
This paper addresses the question with a controlled decomposition. A single logical schema, derived from a realistic e-commerce domain with subscriptions, marketplace transactions, sessions, and a clickstream, is implemented in PostgreSQL as a deliberately well-optimized baseline and then carried into five specialized engines at two levels, a naive port that preserves the relational organization and an optimized redesign built around each engine’s native strengths. The difference between a naive implementation and the baseline isolates the engine effect, and the difference between the optimized and naive levels on the same engine isolates the schema effect. Seven read query classes, a concurrent write benchmark, and a scalability experiment cover the access patterns of the domain, and for the two revenue analytics queries every configuration is required to return the complete relational result, with equivalence verified row by row.
The study evaluates the five hypotheses of the underlying experimental design. H1 (schema optimization effect), the optimized schema yields significantly lower latency than the naive implementation across all evaluated systems. H2 (architecture-workload alignment), specialized engines outperform the relational baseline on workloads aligned with their data model. H3 (naive migration penalty), a naive relational-style implementation inside a specialized engine does not outperform the relational baseline. H4 (scalability differences), systems optimized for distributed, append-heavy workloads, such as Cassandra and Elasticsearch, exhibit a lower rate of latency growth with dataset size than the relational baseline. H5 (workload sensitivity), engines exhibit significantly different performance profiles by workload type, with rankings diverging between analytical reads and concurrent writes.
The contributions are threefold. First, a decomposition methodology that separates the engine effect from the schema effect under a unified logical schema, with row-level result-equivalence verification for the claim-bearing queries, a control that, to our knowledge, published multi-engine comparisons do not enforce. Second, a fully public experimental artifact, the StreamCart benchmark, comprising data generators, loaders, drivers, the timing harness, every raw timing, and the equivalence checks, deposited with the exact datasets used. Third, an empirical characterization of six widely deployed systems that quantifies an asymmetric decision cost. The penalty for using a specialized engine outside its favorable pattern reaches several orders of magnitude, the advantage inside the pattern is real but bounded and purchased through load-time denormalization, and a single physical design decision, an omitted uniqueness constraint, changed write throughput a hundredfold.
The remainder of the paper is organized as follows. Section 2 positions the study against prior work. Section 3 presents the materials and methods, the benchmark design, the execution harness, and the workloads. Section 4 reports the results, Section 5 discusses the hypotheses and practical implications, Section 6 examines threats to validity, and Section 7 concludes.
2. Related Work
The argument that specialized architectures outperform general-purpose relational systems inside their niches is foundational. Stonebraker et al. demonstrated gains approaching two orders of magnitude for purpose-built engines and declared the end of one-size-fits-all [2], a trajectory that has since produced mature document, wide-column, graph, search, and time-series systems, each embodying different positions in the consistency and availability trade-off space [3]. Surveys of the resulting landscape catalog capabilities and data models [4,5], and selection frameworks such as Mowgli attempt to guide engine choice systematically [6]. What this literature establishes is diversity; what it does not establish is a controlled account of when the specialized choice pays. Three gaps motivate the present study.
The first gap is pairwise scope. The dominant experimental pattern compares two or three systems under one workload. Recent examples include relational versus graph comparisons centered on Neo4j [7,8], evaluations within a single family, such as document stores [9] or graph databases [10], assessments of SQL and NoSQL systems on a specific dataset [11], and consistency-focused studies of distributed NoSQL deployments [12]. Individually rigorous, these studies do not compose. Engines are measured on different hardware, different datasets, and different query semantics, so a practitioner cannot derive a cross-family ranking for a mixed workload from them, and multi-model evaluations have explicitly argued that holistic, same-conditions comparison is the missing instrument [5]. StreamCart places six engines and eleven configurations under one harness, one dataset, and one statistical protocol.
The second gap is the conflation of engine and schema. Migration studies typically redesign the data model while changing the engine, so the reported difference bundles both causes. The size of the bundled term is known to be large. Indexing and physical design alone can shift performance by three orders of magnitude within a single engine [7], denormalization decisions dominate many relational-versus-columnar comparisons [13], and a line of work on benchmark fairness has shown that headline NoSQL advantages often dissolve once the relational side is competently configured, pointing to default settings and simplistic implementations as the real cause [14]. Dedicated design methodologies acknowledge this dependence explicitly, from query-driven modeling for wide-column stores [15] to cost-based automated schema advisors for NoSQL applications [16]. These observations imply that engine rankings derived from single-schema studies are not interpretable, yet the two factors are rarely measured separately. The two-level design used here, a naive port and an engine-optimized redesign under a fixed logical schema, turns the schema effect from a confounder into a measured quantity.
The third gap is workload realism and result equivalence. Standard suites remain invaluable for what they target, OLTP transaction mixes in TPC-C and its successors [17] and tunable key-value operation mixes in YCSB [18] and its extensions [12], but their abstractions fit poorly the mixed access patterns of a modern application, a limitation documented both for classic TPC-style workloads [19] and for cloud-serving benchmarks whose operations do not exercise joins, aggregations, or text relevance at all [20]. The subtler problem is semantic. When each engine answers a simplified version of the question that suits it, reported ratios compare different work, and the fairness literature shows how easily such comparisons mislead [14]. StreamCart addresses both aspects, deriving its eight workloads from the access patterns of one coherent domain and defining the expected output of the claim-bearing analytics queries once, as the full relational result, with row-level equivalence verified programmatically against the baseline, within a documented monetary tolerance. We are not aware of a published multi-engine comparison that enforces this control.
In summary, prior work establishes that specialized engines can win inside their niches [2], that physical and schema design is a first-order factor [7,13,14,15,16], and that existing benchmarks measure either narrow pairs or abstract operation mixes [8,9,10,11,12,18,19,20]. The present study contributes the controlled decomposition that connects these threads, six engines, two schema levels, one realistic workload, and verified result equivalence.
3. Materials and Methods
This section describes the experimental domain, the unified schema strategy that separates the engine effect from the schema effect, the execution environment and timing harness, the statistical procedure, and the three workloads. The benchmark, which we refer to as StreamCart, is fully public, including generators, loaders, drivers, raw timings, and the result-equivalence checks (see the Data Availability Statement).
3.1. Experimental Domain and Dataset
The benchmark models a digital commerce platform that combines two revenue streams, recurring software subscriptions and a marketplace for digital and physical products. Users subscribe to one of several tiers with historically versioned pricing, sellers list products, and marketplace transactions generate orders with associated invoices, while subscription renewals produce recurring billing records. The platform also records behavioral data. Sessions capture an active user connection together with a denormalized snapshot of the shopping cart, and events form an append-only clickstream of page views, searches, product views, cart activity, and purchases.
This domain was selected because it concentrates several distinct access patterns inside one system that is immediately recognizable to practitioners in e-commerce and digital business. Transactional records follow classic relational workloads, product discovery requires full-text search, session handling requires low-latency key-value access, the event stream forms a large time series, and co-purchase relationships are naturally graph-structured. The relational schema comprises twelve tables in three logical groups, core entities (users, seller profiles, subscription tiers, tier pricing, subscriptions, products), transactional entities (invoices, invoice lines, orders, order items), and behavioral entities (sessions, events).
The dataset is synthetic, generated with Faker and NumPy under a fixed seed (42); production data was not an option under GDPR constraints, and a synthetic corpus allows full publication. Generation follows realism-oriented rules, user registrations follow a logistic growth curve, product popularity follows a long-tail distribution, and co-purchase behavior clusters products into groups that yield meaningful recommendation queries [21]. The platform timeline spans 1 January 2024 to 31 December 2025. Table 1 summarizes the dataset; a separate file of exactly 1,000,000 events with the same schema serves as identical input for the write-throughput benchmark.
One reproducibility nuance deserves explicit statement. The generators are seeded, but primary keys use uuid4 and session tokens use a cryptographic generator, so a regenerated dataset is statistically identical rather than byte-identical. The exact CSV files used in every reported run are therefore deposited, together with the code and all raw timings, in the Zenodo archive referenced in the Data Availability Statement, which restores exact reproducibility without relying on regeneration.
3.2. Unified Schema Strategy and Implementation Levels
Benchmark results typically conflate two causes, the efficiency of the engine and the quality of the schema, so that measured performance is in effect the sum of an engine term and a schema term. To separate the two, a single logical schema is first implemented in PostgreSQL and then carried into every specialized engine at two deliberately different levels of adaptation.
The relational baseline is implemented as a well-optimized PostgreSQL 16 schema rather than a naive starting point. Every foreign key and high-selectivity filter column is covered by a B-tree index (for example a composite index on user and timestamp for the events table), partial unique indexes enforce business rules without indexing irrelevant rows, semi-structured attributes are stored as JSONB with GIN indexes, the products table maintains a precomputed tsvector through a trigger for full-text search, and selective denormalization is applied where joins would be prohibitive at scale, such as the cart snapshot stored inside sessions. Two reasons justify this choice. Standard relational optimization gains are already well documented and are not the object of study here, and more importantly, comparing optimized specialized schemas against an unoptimized relational baseline would bias the experiment in favor of the specialized systems by mixing the benefit of engine specialization with the penalty of poor relational design.
The naive level ports the relational schema into each specialized engine with the minimum changes required to function, tables become collections, wide-column tables, or node and relationship sets, but the normalized, join-dependent organization is preserved. Because the logical schema is held fixed, differences against the baseline at this level reflect primarily engine architecture. The asymmetry of comparing a tuned relational baseline with an untuned port is intentional. Tuning the naive schema would require exactly the engine-native features that the naive level is defined to exclude, while stripping the baseline of its indexes would manufacture an artificial advantage for the specialized engines. The comparison therefore answers the question a practitioner actually faces, namely how a competently run relational system compares with a specialized engine adopted by direct migration, and any advantage observed for a specialized engine at this level is measured against a baseline deliberately made difficult to beat.
The optimized level redesigns each implementation around the native strengths of its engine, and the difference between the naive and optimized levels on the same engine isolates the gain attributable to schema design alone. Eleven configurations result, the PostgreSQL baseline plus naive and optimized variants of five specialized systems.
3.3. Engine-Specific Schema Transformations
MongoDB. Invoice lines are embedded inside invoices and order items inside orders, removing join work entirely for document retrieval. Frequently co-accessed data such as customer details and product attributes exist as embedded snapshots, cart contents and event metadata are stored as native documents that can be queried and indexed without application-level deserialization, and compound indexes follow the query access patterns, for instance user identifier combined with timestamp. Figure 1 shows the optimized document model.
Cassandra. The optimized design is query-first, in line with the established query-driven modeling methodology for Cassandra [15]. Each table is shaped around one access pattern with its partition key aligned to that pattern, and every join, aggregation, or temporal attribution is precomputed at load time, so that queries run against a single partition or a small number of parallel partitions with no runtime filtering. Figure 2 maps each read query to its dedicated table.
Neo4j. The optimized graph keeps the original entity and relationship structure while adding native indexes and precomputed relationships for the hot paths, most prominently an ALSO_BOUGHT edge that links a product directly to every product purchased together with it, which turns the recommendation query into a single-hop traversal.
Elasticsearch. Relational data becomes search-oriented indexes with custom analyzers (tokenization, normalization, synonym expansion, stemming) for relevance-ranked retrieval, and related records such as invoice lines and cart items are nested inside their parent documents. In addition, the optimized indices resolve subscription-tier membership and the price in effect at invoice time during loading, so that the two revenue analytics queries described in Section 3.7 execute as a single server-side aggregation instead of a client-side join. This load-time attribution is itself verified against the relational source, as described below.
TimescaleDB. The baseline schema is extended with hypertables and tuned chunk intervals for the temporal tables, continuous aggregates that precompute daily revenue per tier, and columnar compression for historical data, which favors large temporal scans at a potential cost for random point access.
The complete schema definitions for all eleven configurations, including index and analyzer settings, are available in the repository.
3.4. Experimental Environment
All experiments ran on one workstation (Windows 11 Pro, six-core Intel i7-9750H, 24 GB RAM, 500 GB NVMe SSD) with every database deployed as a single-node Docker container defined in one Compose file. Engine versions were PostgreSQL 16, MongoDB 7.0, Apache Cassandra 4.1, Neo4j 5.18 Community, Elasticsearch 8.13.0, and TimescaleDB (pg16 image). Engines were measured one at a time, with unused containers stopped, because the full set exceeds the memory of the Docker virtual machine; Neo4j in particular runs as two containers (naive and optimized) with heap and page cache fixed explicitly at 3 GB each, since automatic sizing proved unstable under concurrent writes. PostgreSQL accepted up to 110 connections to accommodate the concurrent workloads, Elasticsearch ran with security disabled for local execution, and benchmark connections disabled JIT compilation and raised working memory to 64 MB to remove compilation noise and sort spills from the measurements. The harness runs on Python 3.11.9, with all client-library versions pinned in the repository’s requirements lock.
3.5. Execution Harness and the Timed Region
Every benchmark runs through one Python harness. Each measurement consists of 10 untimed warm-up executions followed by 1000 timed iterations, with latency taken as the wall-clock time from query submission to complete result materialization, captured with a sub-millisecond performance counter. For concurrent workloads the harness launches worker threads that enter the measured phase together on a synchronization barrier. Identifier pools and date ranges are prepared before timing begins and random sampling from these pools adds no measurable overhead to the timed phase.
The timed region deserves an explicit definition, because several engines complete part of the computation in the client. Anything a driver performs inside the measured call, including client-side joins, aggregation, gap filling, and rolling averages, is part of the reported latency; only one-off preparation is excluded. The harness writes every individual timing to JSON together with run metadata, and all raw distributions are published, so every statistic below can be recomputed independently.
3.6. Statistical Analysis
Latency percentiles (p50, p95, p99) are computed with the nearest-rank method. Because benchmark latency distributions are right-skewed, every pairwise comparison is evaluated with Welch’s t-test at α = 0.05, which does not assume equal variances, together with Cliff’s delta as a non-parametric effect size, using the conventional thresholds of negligible (|δ| < 0.147), small (< 0.33), medium (< 0.474), and large (≥ 0.474). A difference is reported as meaningful only when it is both statistically significant and at least small in effect size.
3.7. Read Workload and Result Equivalence
The read workload consists of seven query classes that cover the access patterns of the domain, summarized in Table 2. Every query runs on all eleven configurations, including engines for which it is a poor architectural fit, precisely because the cost of using a system outside its intended pattern is one of the quantities under study.
For Q1 and Q7, the two analytics queries, the expected output is defined once, as the full PostgreSQL result. Q1 returns revenue per month, per tier, and per price in effect at invoice time, with invoice counts, over the trailing twelve months; Q7 returns daily revenue per tier over a 183-day window, gap-filled so that every day and tier combination is present, together with a seven-day rolling average. Every engine, at both levels, returns this complete result; where an engine lacks the server-side machinery, the driver completes the computation in the client, inside the timed region, as defined in Section 3.5. One documented simplification applies, the naive Cassandra implementation of Q1 attributes the price at the window start rather than per invoice, which is value-identical here because the only price change in the dataset predates every window used.
Result equivalence is not assumed but verified. A published check runs Q1 and Q7 on PostgreSQL and, over identical windows, on Elasticsearch (both queries, both levels) and Neo4j (Q7, both levels), comparing the result sets row by row and requiring the key sets (months or days, tiers, prices, counts) to match exactly and monetary values to agree within 0.05 USD, a tolerance needed because Elasticsearch stores amounts as 32-bit floats. The check passes in every covered case, across three randomized Q7 windows, and the Elasticsearch load-time tier attribution was additionally validated against the relational source on all 724,237 invoices with zero mismatches. For the remaining engines, the full result is computed either server-side (TimescaleDB on both queries, MongoDB on Q7) or in the client inside the timed region (Cassandra on both queries, MongoDB and Neo4j on Q1), with all code public in the companion repository.
Because Q1 depends on the wall clock through its trailing twelve-month window, the verification runs and the re-measured Elasticsearch configurations pin its evaluation instant to that of the PostgreSQL baseline run, so the claim-bearing comparison answers the identical question. The remaining main-run measurements evaluated Q1 at their own execution time, within a span of a few days; since the dataset ends on 31 December 2025, the resulting windows differ only in a few days of data at the trailing edge, a divergence that is negligible for the reported latencies and is documented here for exactness.
Q5 is the one query whose semantics intentionally differ across engines. The logical intent, retrieve and rank products matching a text term, is held constant, but a substring scan, a tsvector ranking, and an analyzer-based stemmed search are not identical computations, and the cross-engine Q5 comparison should be read as the cost of native text search in each system rather than as identical work at different speeds.
3.8. Write-Throughput Benchmark (Q8)
The write benchmark measures concurrent ingestion of the fixed one-million-event file at 10, 50, and 100 threads, with each thread issuing single-record inserts over a contiguous, non-overlapping slice of the input. Single-record insertion was chosen over batching because it reflects event-driven applications that persist interactions as they occur, and because micro-batching is an application-level optimization whose inclusion would confound the engine effect with application design. Q8 therefore has a single level per engine. Reported metrics are throughput in events per second and insert-latency percentiles, and a run is accepted only when all one million operations complete without errors. In Neo4j, inserts use MERGE on the event identifier under a uniqueness constraint, the practical equivalent of an indexed primary-key insert, and the staging label is verified empty before every run.
3.9. Scalability Experiment
The scalability experiment repeats the read workload at 10% and 50% of the dataset, built by proportional, temporally consistent sampling, with the 100% results as reference, and reports the growth factor, the ratio of p50 latency at full scale to reduced scale. Two protocol notes apply. The reduced-scale cutoff dates differ slightly between two engine groups for historical reasons and are reported with the data, and the naive Cassandra variant of Q6 uses 30 iterations with 2 warm-ups at reduced scales because each call is a multi-minute full scan. Q1 is excluded from the scalability analysis altogether, because its trailing twelve-month window interacts with the reduced-scale cutoffs in a way that produced empty or non-comparable windows across engines; the exclusion and its mechanism are detailed in Section 6, and Q2 to Q7 are unaffected.
4. Results
This section presents the measurements across the eleven configurations, organized by the two factors under study. Section 4.1 gives the overall latency picture, Section 4.2 and Section 4.3 isolate the engine effect and the schema effect, Section 4.4 reports write throughput, and Section 4.5 reports scalability. All pairwise statements of difference were validated with Welch’s t-test at α = 0.05 and Cliff’s delta on the full latency distributions, as defined in Section 3.6. In the heatmaps that follow, blue-red maps mark the slower side in red, the schema-effect map marks optimization gains in green and regressions in purple, and every comparative map is centered at parity.
4.1. Results Overview
Table 3 reports the median (p50) latency of every configuration on the seven read queries, and Figure 3 presents the same data as a heatmap on a logarithmic color scale, since the values span five orders of magnitude, from close to one millisecond to beyond two minutes.
Three patterns are visible immediately. First, naive Cassandra is an extreme outlier, with Q6 exceeding two minutes because a partition-ignorant port forces full scans over more than six million rows. Second, the only configurations that beat the baseline do so strictly inside their native patterns, and under result-equivalent queries this now holds for the optimized level only; Elasticsearch outperforms PostgreSQL on the two revenue analytics queries (Q1, Q7) exclusively in its optimized form, while MongoDB does so on document retrieval and session lookup (Q2, Q3). Third, the gap between the naive and optimized levels differs drastically across engines, from negligible on most MongoDB queries to several orders of magnitude on Cassandra and, with equivalent queries, on the two Elasticsearch analytics queries. No single system leads overall; the seven query classes split between three engines, with PostgreSQL fastest on Q4, Q5, and Q6, Elasticsearch (o) on Q1 and Q7, and MongoDB (o) on Q2 and Q3.
4.2. Engine Effect
The engine effect compares each naive implementation against the PostgreSQL baseline under an identical logical schema; Figure 4a shows the effect sizes and Figure 5 the p50 ratios. The result is uniform. Every naive configuration is slower than the baseline on every query, with large effect sizes throughout, and the single negative delta in the panel (TimescaleDB on Q1, δ = −0.10) falls below the negligibility threshold. Hypothesis H3, that a relational-style implementation inside a non-relational engine does not outperform an optimized relational baseline, is therefore supported without exceptions.
The magnitude of the penalty, however, is anything but uniform. Cassandra suffers the most, between 22× (Q1) and roughly 90,000× (Q6), because any query that does not align with a predefined partition key degenerates into a cluster-wide scan. Neo4j pays between 1.6× and 30×, with the largest penalties on search and analytics that traverse nodes sequentially, and even cheap operations carry a constant protocol overhead. Elasticsearch, once its analytics queries compute the full result, is 8.7× slower than the baseline on Q1 and 9.8× on Q7, in addition to penalties between 5.9× and 103× elsewhere; the apparent naive-Elasticsearch advantage reported in earlier versions of this experiment disappeared once result equivalence was enforced. MongoDB shows the mildest and most workload-dependent penalties, from 1.2× on the time-ordered scan to 14.5× on the gap-filled rolling aggregate, since simple lookups execute much as they would relationally while analytical pipelines emulate joins expensively. TimescaleDB, as a PostgreSQL extension, essentially matches the baseline outside time-series work and pays a small overhead elsewhere.
4.3. Schema Effect
The schema effect compares the optimized against the naive level within each engine, query logic unchanged; Figure 6 shows the ratios and Figure 4b the effect sizes. Cassandra again defines the extreme, with improvements on every query, from 3.6× to 3892× (Q6), obtained by replacing full scans with partition-bound retrieval, which confirms that its efficiency depends almost entirely on query-first schema design. Under equivalent queries, Elasticsearch now provides the second-largest schema effects in the study. Resolving tier membership and historical pricing at load time and executing a single server-side aggregation accelerates Q1 by 137× and Q7 by 61× over the naive implementation that performs the same computation client-side, alongside the previously observed gains on document retrieval (53.7× on Q2) and session lookup (8.1× on Q3).
MongoDB benefits where document embedding removes multi-step access, 3.8× on Q2 and 6.6× on Q3, while its aggregation-heavy queries barely move, since their cost is dominated by pipeline execution rather than data layout. TimescaleDB shows the clearest trade-off in the study. Continuous aggregates and compression improve the temporal analytics (1.7× on Q1, 1.4× on Q7), but Q2 falls to 0.1× after optimization, a tenfold regression consistent with the decompression cost that columnar storage imposes on point lookups, a mechanism we state as a hypothesis and leave for targeted verification. Neo4j improves sharply only where a precomputed structure matches the query, 20.4× on search via a native full-text index, regresses mildly on three queries whose access paths gained relationship hops, and on Q7 the two levels execute the same server-side Cypher statement, so their distributions are statistically indistinguishable (Welch p = 0.053, δ = 0.006, negligible), a schema effect of 1.0 by construction.
Figure 4c completes the picture by comparing each optimized implementation directly against the baseline. The configurations that significantly outperform PostgreSQL are confined to their native patterns, Elasticsearch on the two analytics queries (15.8× on Q1 and 6.3× on Q7, both p < 0.001 with |δ| = 1.00), MongoDB on document and session retrieval, and TimescaleDB on the temporal analytics it extends PostgreSQL for; everywhere else the optimized specialized systems remain at or behind the baseline. The cost of the wrong choice is therefore asymmetric. A specialized engine outside its favorable pattern can be far slower than a well-tuned relational system, while its advantage inside the pattern, though real, is bounded and purchased through load-time denormalization.
4.4. Write Throughput
The write benchmark measures concurrent single-record ingestion of one million events at 10, 50, and 100 threads, as defined in Section 3.8. Table 4 reports the full metrics, Figure 7 the throughput curves, and Figure 8 the tail latencies.
PostgreSQL achieves the highest throughput and scales near-linearly from 1533 to 12,603 events per second, with a median latency that remains stable between 5.8 and 7.4 ms across all concurrency levels. TimescaleDB follows at 6987 events per second, inheriting the PostgreSQL write path with additional hypertable routing cost at high concurrency. MongoDB plateaus around 3860 events per second beyond 10 threads, a ceiling consistent with coordination inside the storage engine, where document-level locking admits parallel inserts but journal commits serialize coarsely under many threads [22]. Cassandra grows moderately from 2475 to 4074 events per second, its single-node deployment leaving most of its distributed write path unused. Elasticsearch scales proportionally with concurrency, from 165 to 1401 events per second, but every insert carries the cost of indexing and refresh, visible in per-operation latencies an order of magnitude above the relational engines. Neo4j reaches 868 events per second at 10 threads, peaks at 1602 at 50, and declines slightly to 1515 at 100, placing it in the same band as Elasticsearch rather than orders of magnitude below the field. Across all engines, write throughput spans roughly two orders of magnitude, from 165 to 12,603 events per second.
The Neo4j result corrects an earlier measurement and carries a finding of its own. A previous version of the write driver used MERGE on the event identifier without a uniqueness constraint, which forced a label scan on every insert and capped throughput at 9 to 18 events per second; adding the constraint, the practical equivalent of declaring a primary key, raised throughput by roughly two orders of magnitude. A single omitted physical design declaration thus produced a larger performance difference than the choice between most engine pairs in Table 4, which is the central thesis of this study restated in the write path.
4.5. Scalability
The scalability experiment reruns the read workload at 10% and 50% of the dataset and reports the growth factor, the ratio of p50 latency at full scale to reduced scale, for Q2 to Q7; Q1 is excluded for the protocol reason given in Section 3.9. Figure 9 shows the growth factors for all eleven configurations.
Elasticsearch in its optimized form remains the most scale-stable configuration in the study, and under result-equivalent queries this stability is now measured on identical work; its Q7 grows by only 1.05× while the dataset grows tenfold, with every other query at or below 1.2×, reflecting an execution model whose cost follows query structure more than data volume. The naive Elasticsearch level, which performs the same analytics client-side, grows by 2.03× on Q7, still sublinear but no longer flat. Cassandra’s optimized implementation holds latency effectively constant on point lookups and partition-bound queries regardless of scale, while its cross-partition aggregation grows by 10.7×, the price of touching many partitions. MongoDB degrades most, its analytical pipeline growing by 24× to 27× on Q7 across the tenfold increase, indicating that aggregation-based execution scales poorly as inputs grow, and Neo4j’s equivalent Q7 grows by 3.7× to 3.8× at both levels, sublinear but visible. PostgreSQL maintains stable performance on indexed operations, with growth between 1.0× and 1.6× outside the analytics and 3.0× on the rolling aggregate, driven by result-set size rather than structural inefficiency, and TimescaleDB follows the same profile with continuous aggregates damping the growth of the temporal analytics.
A small number of points show latency decreasing at larger scale. These are attributable to query-plan changes at different data volumes and to the independent sampling of identifier pools at each scale, remain localized and small against the order-of-magnitude differences that drive the conclusions, and do not affect the overall findings.
5. Discussion
5.1. Hypothesis Evaluation
H1, the schema optimization effect, is partially supported, because its universal quantifier is too strong. Optimization produces large, statistically significant improvements wherever the redesign aligns with the query pattern, up to 3892 times on Cassandra, 137 and 61 times on the two Elasticsearch analytics queries, 20.4 times on Neo4j search, yet it is not beneficial for every system on every query. The TimescaleDB point-lookup regression to 0.1 times, consistent with decompression overhead at point lookups, a mechanism we state as a hypothesis pending targeted verification, the mild Neo4j regressions on queries whose access paths gained relationship hops, and the by-construction null effect on Neo4j Q7 show that optimization toward one pattern can tax or bypass another. Schema optimization is powerful but directional, not a free lunch.
H2, architecture-workload alignment, is partially supported, a more conservative verdict than preliminary analyses of this experiment suggested. Where alignment pays, it pays substantially, optimized MongoDB leads document and session retrieval, optimized Elasticsearch returns the full analytics results 15.8 and 6.3 times faster than the baseline through load-time denormalization, and TimescaleDB outpaces plain PostgreSQL on the temporal analytics it extends it for. Alignment, however, proved necessary rather than sufficient at this scale. Neo4j does not beat the baseline on its aligned traversal query (2.69 versus 1.39 ms), Cassandra does not on the time-ordered scan (31.1 versus 1.34 ms), and Elasticsearch does not on relevance-ranked search itself (48.8 versus 8.09 ms), where PostgreSQL’s native full-text machinery wins outright. A well-indexed relational system closes several of the gaps that specialized engines are presumed to own, and no single system dominates overall. The sharpened verdict is itself a product of the result-equivalence control introduced in Section 3.7, which replaced a permissive preliminary reading with one measured on identical work.
H3, the naive migration penalty, is supported without exceptions, across all 35 engine-query cells and with large effect sizes throughout. This is the study’s most decision-relevant finding, because the naive level models exactly what a direct migration produces. The earlier apparent counterexample, naive Elasticsearch on the analytics queries, was an artifact of non-equivalent queries and disappeared once equivalence was enforced, which is itself instructive about the published evidence this hypothesis confronts.
H4, scalability differences, is partially supported on the six queries retained in the scalability analysis, and the growth factors make the boundary precise. Elasticsearch behaves as hypothesized, growing by at most 1.2 times in optimized form and 2.0 times naive while the baseline grows by 2.5 times on search and 3.0 times on the rolling aggregate. Cassandra satisfies the hypothesis only on partition-aligned access, where latency is effectively scale-constant, while its cross-partition aggregation grows by 10.7 times, more than three times the baseline’s worst growth. The append-heavy advantage is therefore real but conditional on the access path, not a property of the engine as such.
H5, workload sensitivity, is supported. Performance rankings diverge sharply between analytical reads and concurrent writes, the read leaders reorder completely under Q8, and Elasticsearch is simultaneously the fastest configuration on the two analytics queries and the throughput floor of the write benchmark, with PostgreSQL at the opposite corner. A corollary strengthens the hypothesis. Q8 runs on a single schema level per engine, yet throughput spans roughly two orders of magnitude with qualitatively different scaling shapes, and the one intervention that moved a write result by a hundredfold was a physical declaration, a uniqueness constraint, rather than a schema redesign, indicating that write-side profiles track engine architecture and physical design more than data modeling.
5.2. Practical Implications
Three implications follow for practitioners. First, choose by dominant access pattern, not by category momentum. A well-indexed relational system is the strongest generalist in this study, fastest on three of seven read classes and on concurrent writes, and never catastrophically slow, whereas every specialized engine exhibits at least one failure mode outside its pattern, with penalties that reach four to five orders of magnitude in the worst cells. The expected cost of a wrong specialized choice is therefore much larger than the expected gain of a right one, an asymmetry that should anchor migration decisions.
Second, treat schema and physical design as a first-class optimization lever, co-equal with engine choice. Within single engines, design decisions moved performance by factors that exceed most engine-to-engine gaps, three orders of magnitude on Cassandra, two on Elasticsearch, a hundredfold on Neo4j writes from one uniqueness constraint. Where specialized engines beat the relational baseline on identical work, the mechanism is load-time denormalization, precomputing joins, attributions, and aggregation-friendly layouts when data arrives. That advantage is real, 15.8 and 6.3 times on the two analytics queries here, but it is bounded, it is purchased with ingestion-time work and data duplication, and the same study shows the cost of the pattern when it is absent or misaligned.
Third, demand result equivalence from benchmarks before trusting their ratios. The largest single correction in this study, an apparent 12-fold Elasticsearch advantage that became a 9-fold deficit at the naive level, came not from re-measurement but from making every engine compute the same answer. Comparisons that do not state and verify what each system actually returns should be read as measurements of different questions.
6. Threats to Validity
Single-node deployment is the principal external threat. All engines ran as single Docker containers on one workstation, which serves the goal of isolating engine and schema effects under identical resources but systematically disadvantages systems designed for distributed operation. Cassandra is the clearest case, since partitioning, replication, and coordinator parallelism are its core mechanisms, and its results here should be read strictly as single-node behavior, likewise the concurrency ceilings observed for every engine. Conclusions about distributed deployments do not follow from these data.
The dataset is synthetic. Generation follows realism-oriented distributions, but synthetic data cannot reproduce the full irregularity of production workloads, and absolute latencies should be treated as environment-specific. The mitigation is transparency rather than claim, the exact datasets, every raw timing, and the full toolchain are deposited, so the experiment is repeatable and extensible with other data.
Result equivalence is verified row by row for the configurations that carry the paper’s comparative claims, Elasticsearch on both analytics queries and Neo4j on the rolling-revenue query, with load-time attribution checked against the relational source on all 724,237 invoices. For the remaining engines the drivers compute the full result client-side inside the timed region with the code public, and an extension of the verification script to those engines is provided in the repository for independent execution. Q5 intentionally compares native text-search semantics rather than identical computations and is labeled as such.
Two measurement choices are conservative by construction. JVM-based engines received the same warm-up budget as the others, which, if anything, understates their steady-state performance, and Neo4j writes use MERGE under a uniqueness constraint, the closest available analog of a keyed insert, which carries a documented residual asymmetry against the plain INSERT used elsewhere. Finally, the Q1 window is defined relative to the wall clock; the verification and the re-measured Elasticsearch runs pin its evaluation instant to the baseline run, the original runs evaluated it at execution time within a few days of one another, and the scalability analysis excludes Q1 altogether for the window artifact described in Section 3.9.
7. Conclusions and Future Work
Does adopting a specialized database yield a performance gain? The answer this study supports is conditional in a way that defaults and category labels do not capture. Migrating a relational schema as-is never paid, on any query, against a competently optimized PostgreSQL baseline. Redesigning for the engine paid dramatically, but only inside each engine’s favorable pattern, where optimized Elasticsearch returned the full relational analytics result 15.8 and 6.3 times faster through load-time denormalization, and optimized MongoDB led document and session retrieval, while outside those patterns the same engines trailed the baseline by up to several orders of magnitude. Across all of it, design decisions within an engine, partition-aligned tables, embedded documents, precomputed relationships, one uniqueness constraint, moved performance by factors as large as the differences between engines, which is the study’s central message. The engine-versus-schema question resolves to both, measured separately, with schema effects that practitioners control directly and often underweight.
The study’s boundaries define its future work. The single-node design should be extended to clustered deployments, where Cassandra’s architecture in particular can express its intended strengths, and the synthetic workload should be complemented with production traces. The result-equivalence verification, enforced here for the claim-bearing queries, should be extended programmatically to every engine and query, and the released artifact is structured to make that extension a small step. Two directions follow naturally from the findings, polyglot architectures that route each access pattern to its best engine under a quantified cost model, and automated schema optimization in the line of cost-based schema advisors [16], searching the design spaces whose manual exploration produced the largest effects measured here.
Author Contributions
Conceptualization, I.H.; methodology, I.-M.F. and I.H.; software, I.-M.F.; investigation, I.-M.F.; data curation, I.-M.F.; writing, original draft preparation, I.-M.F.; writing, review and editing, I.H.; visualization, I.-M.F.; supervision, I.H. All authors have read and agreed to the published version of the manuscript.
Funding
This research received no external funding.
Institutional Review Board Statement
Not applicable.
Informed Consent Statement
Not applicable.
Data Availability Statement
The complete benchmark, including the data generators, loaders, benchmark drivers, timing harness, all raw timings, and the result-equivalence checks, is openly available at https://github.com/ionuthrubaru/harness-benchmark; a versioned snapshot of the repository, together with the exact input datasets used in the reported runs, is archived on Zenodo (https://doi.org/10.5281/zenodo.23332009).
Acknowledgments
This article is derived from the first author’s master’s dissertation, defended at the Faculty of Economics and Business Administration, Alexandru Ioan Cuza University of Iași, in July 2026. During the preparation of this manuscript, the authors used Claude Fable 5 (Anthropic; claude.ai interface, October 2026) for drafting support and figure generation; the authors have reviewed and edited all output and take full responsibility for the content of this publication.
Conflicts of Interest
The authors declare no conflicts of interest.
References
- Codd, E.F. A Relational Model of Data for Large Shared Data Banks. Commun. ACM 1970, 13, 377–387. [Google Scholar] [CrossRef]
- Stonebraker, M.; Madden, S.; Abadi, D.J.; Harizopoulos, S.; Hachem, N.; Helland, P. The End of an Architectural Era (It’s Time for a Complete Rewrite). In Proceedings of the 33rd International Conference on Very Large Data Bases (VLDB), Vienna, Austria, 23–27 September 2007; pp. 1150–1160. [Google Scholar]
- Brewer, E. Towards Robust Distributed Systems. In Proceedings of the 19th Annual ACM Symposium on Principles of Distributed Computing (PODC), Portland, OR, USA, 2000. [Google Scholar] [CrossRef]
- Lourenço, J.; Cabral, B.; Bernardino, J.; Vieira, M. Comparing NoSQL Databases with a Relational Database: Performance and Space. Serv. Trans. Big Data 2015, 2, 1–14. [Google Scholar] [CrossRef]
- Zhang, C.; Lu, J. Holistic Evaluation in Multi-Model Databases Benchmarking. Distrib. Parallel Databases 2019, 39, 1–33. [Google Scholar] [CrossRef]
- Seybold, D.; Keppler, M.; Gründler, D.; Domaschka, J. Mowgli: Finding Your Way in the DBMS Jungle. In Proceedings of the 2019 ACM/SPEC International Conference on Performance Engineering (ICPE), Mumbai, India, 2019; pp. 321–332. [Google Scholar] [CrossRef]
- Kotiranta, P.; Junkkari, M.; Nummenmaa, J. Performance of Graph and Relational Databases in Complex Queries. Appl. Sci. 2022, 12, 6490. [Google Scholar] [CrossRef]
- Lupu, E.; Olteanu, A.; Ionita, A.D. Concurrent Access Performance Comparison Between Relational Databases and Graph NoSQL Databases for Complex Algorithms. Appl. Sci. 2024, 14, 9867. [Google Scholar] [CrossRef]
- Carvalho, I.M.; Sá, F.S.; Bernardino, J. Performance Evaluation of NoSQL Document Databases: Couchbase, CouchDB, and MongoDB. Algorithms 2023, 16, 78. [Google Scholar] [CrossRef]
- Monteiro, J.; Sá, F.; Bernardino, J. Experimental Evaluation of Graph Databases: JanusGraph, Nebula Graph, Neo4j, and TigerGraph. Appl. Sci. 2023, 13, 5770. [Google Scholar] [CrossRef]
- Antas, J.; Silva, R.R.; Bernardino, J. Assessment of SQL and NoSQL Systems to Store and Mine COVID-19 Data. Computers 2022, 11, 29. [Google Scholar] [CrossRef]
- Ferreira, S.; Mendonça, J.; Nogueira, B.; Tiengo, W.; Andrade, E. Benchmarking Consistency Levels of Cloud-Distributed NoSQL Databases Using YCSB. IEEE Access 2025, 13, 63428–63438. [Google Scholar] [CrossRef]
- Torres, L.; Rezende, G.K.; Oyamada, M.S.; Boscarioli, C. Evaluating the Impact of Data Modeling on OLAP Applications. In Proceedings of the XLIV Latin American Computer Conference (CLEI), 2018; pp. 456–465. [Google Scholar] [CrossRef]
- Hohenstein, U.; Jergler, M. Database Performance Comparisons: An Inspection of Fairness. In Proceedings of the 8th International Conference on Data Science, Technology and Applications (DATA), Prague, Czech Republic, 2019; Volume 1, pp. 243–250. [Google Scholar] [CrossRef]
- Chebotko, A.; Kashlev, A.; Lu, S. A Big Data Modeling Methodology for Apache Cassandra. In Proceedings of the 2015 IEEE International Congress on Big Data, New York, NY, USA, 27 June–2 July 2015; pp. 238–245. [Google Scholar]
- Mior, M.J.; Salem, K.; Aboulnaga, A.; Liu, R. NoSE: Schema Design for NoSQL Applications. IEEE Trans. Knowl. Data Eng. 2017, 29, 2275–2289. [Google Scholar] [CrossRef]
- Curino, C.; Difallah, D.E.; Pavlo, A.; Cudré-Mauroux, P. Benchmarking OLTP/Web Databases in the Cloud: The OLTP-Bench Framework. In Proceedings of the 4th International Workshop on Cloud Data Management (CloudDB), 2012; pp. 17–20. [Google Scholar] [CrossRef]
- Cooper, B.F.; Silberstein, A.; Tam, E.; Ramakrishnan, R.; Sears, R. Benchmarking Cloud Serving Systems with YCSB. In Proceedings of the 1st ACM Symposium on Cloud Computing (SoCC), Indianapolis, IN, USA, 10–11 June 2010; pp. 143–154. [Google Scholar] [CrossRef]
- Chen, Y.; Raab, F.; Katz, R.H. From TPC-C to Big Data Benchmarks: A Functional Workload Model; Technical Report UCB/EECS-2012-174; University of California: Berkeley, CA, USA, 2012. [Google Scholar]
- van Wouw, S.; Viña, J.; Iosup, A.; Epema, D. An Empirical Performance Evaluation of Distributed SQL Query Engines. arXiv 2015, arXiv:1401.2081. [Google Scholar]
- Kholod, M.; Mokrenko, N. Market Basket Analysis Using Rule-Based Algorithms and Data Mining Techniques. 2024. [Google Scholar] [CrossRef]
- MongoDB; Inc. WiredTiger Storage Engine. Available online: https://www.mongodb.com/docs/manual/core/wiredtiger/ (accessed on 4 October 2026).
Figure 1.
Optimized MongoDB document model, with invoice lines and order items embedded in their parents and denormalized snapshots of co-accessed data.
Figure 1.
Optimized MongoDB document model, with invoice lines and order items embedded in their parents and denormalized snapshots of co-accessed data.
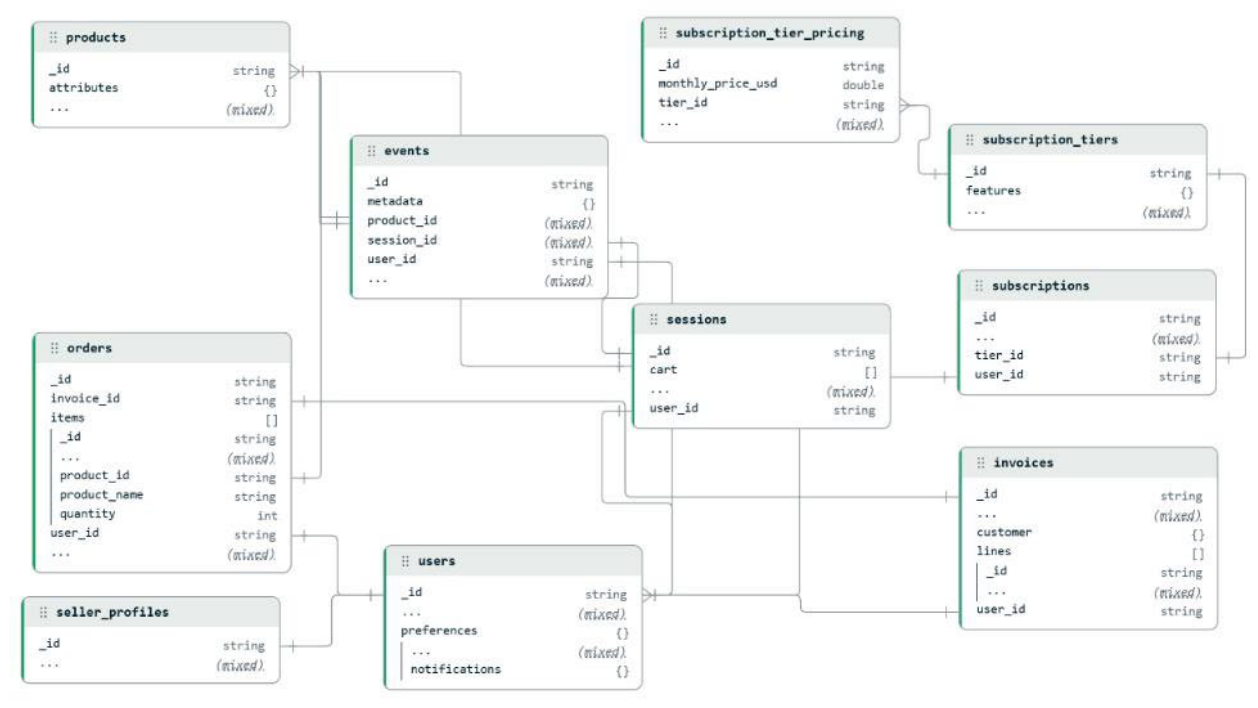
Figure 2.
Cassandra query-first schema, one table per read query, with partition keys aligned to the access patterns.
Figure 2.
Cassandra query-first schema, one table per read query, with partition keys aligned to the access patterns.
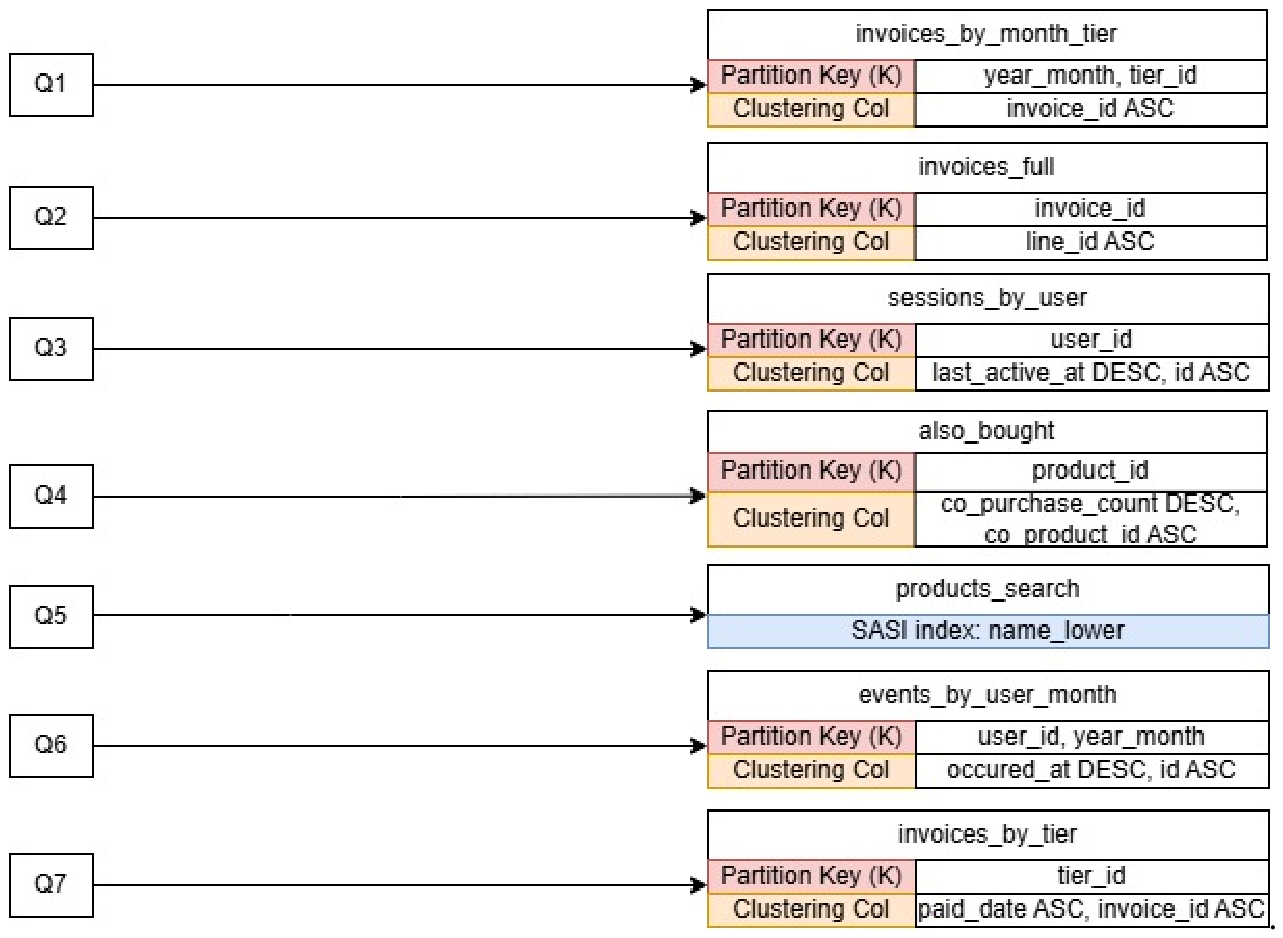
Figure 3.
p50 latency by configuration and query (ms, logarithmic color scale).
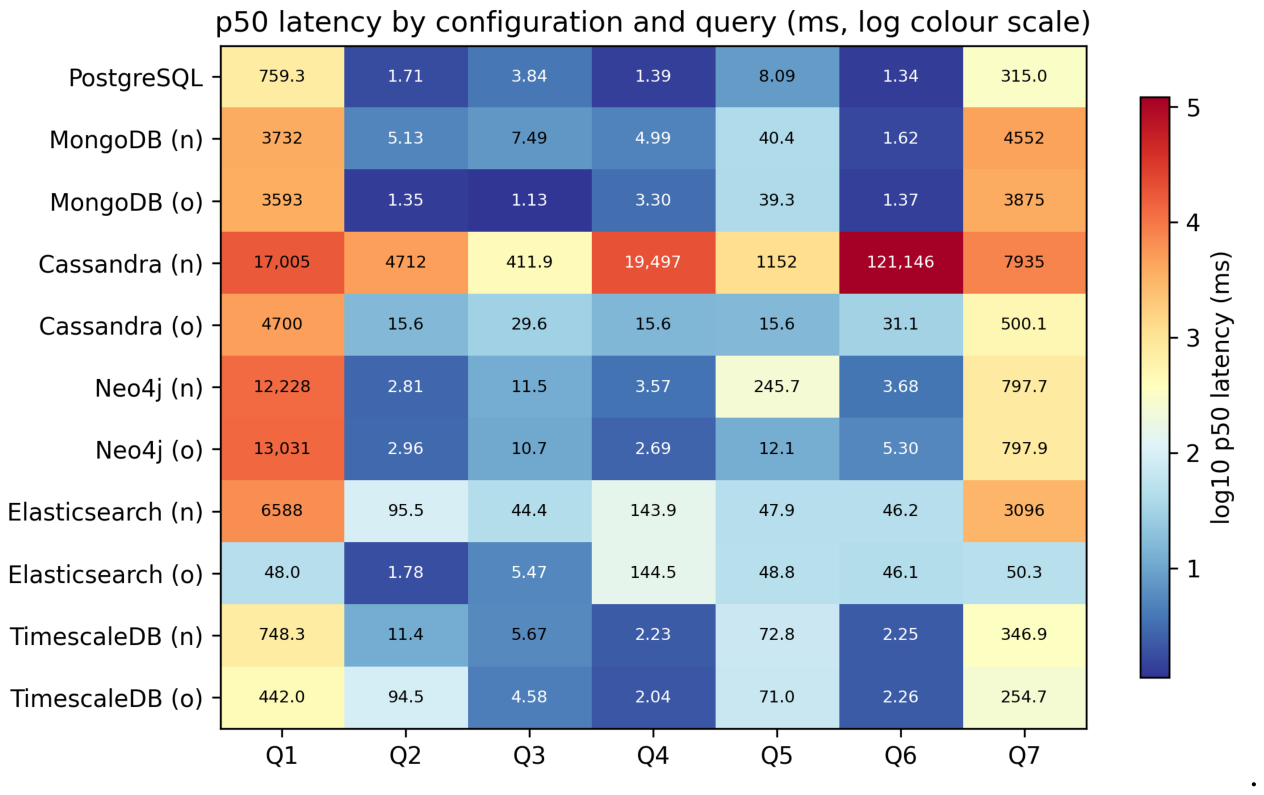
Figure 4.
Cliff’s delta for all engine-query pairs: (a) naive vs. PostgreSQL; (b) optimized vs. naive; (c) optimized vs. PostgreSQL. Positive values indicate the first distribution is slower; the letter codes give the Cliff magnitude (L large, M medium, S small, N negligible).
Figure 4.
Cliff’s delta for all engine-query pairs: (a) naive vs. PostgreSQL; (b) optimized vs. naive; (c) optimized vs. PostgreSQL. Positive values indicate the first distribution is slower; the letter codes give the Cliff magnitude (L large, M medium, S small, N negligible).
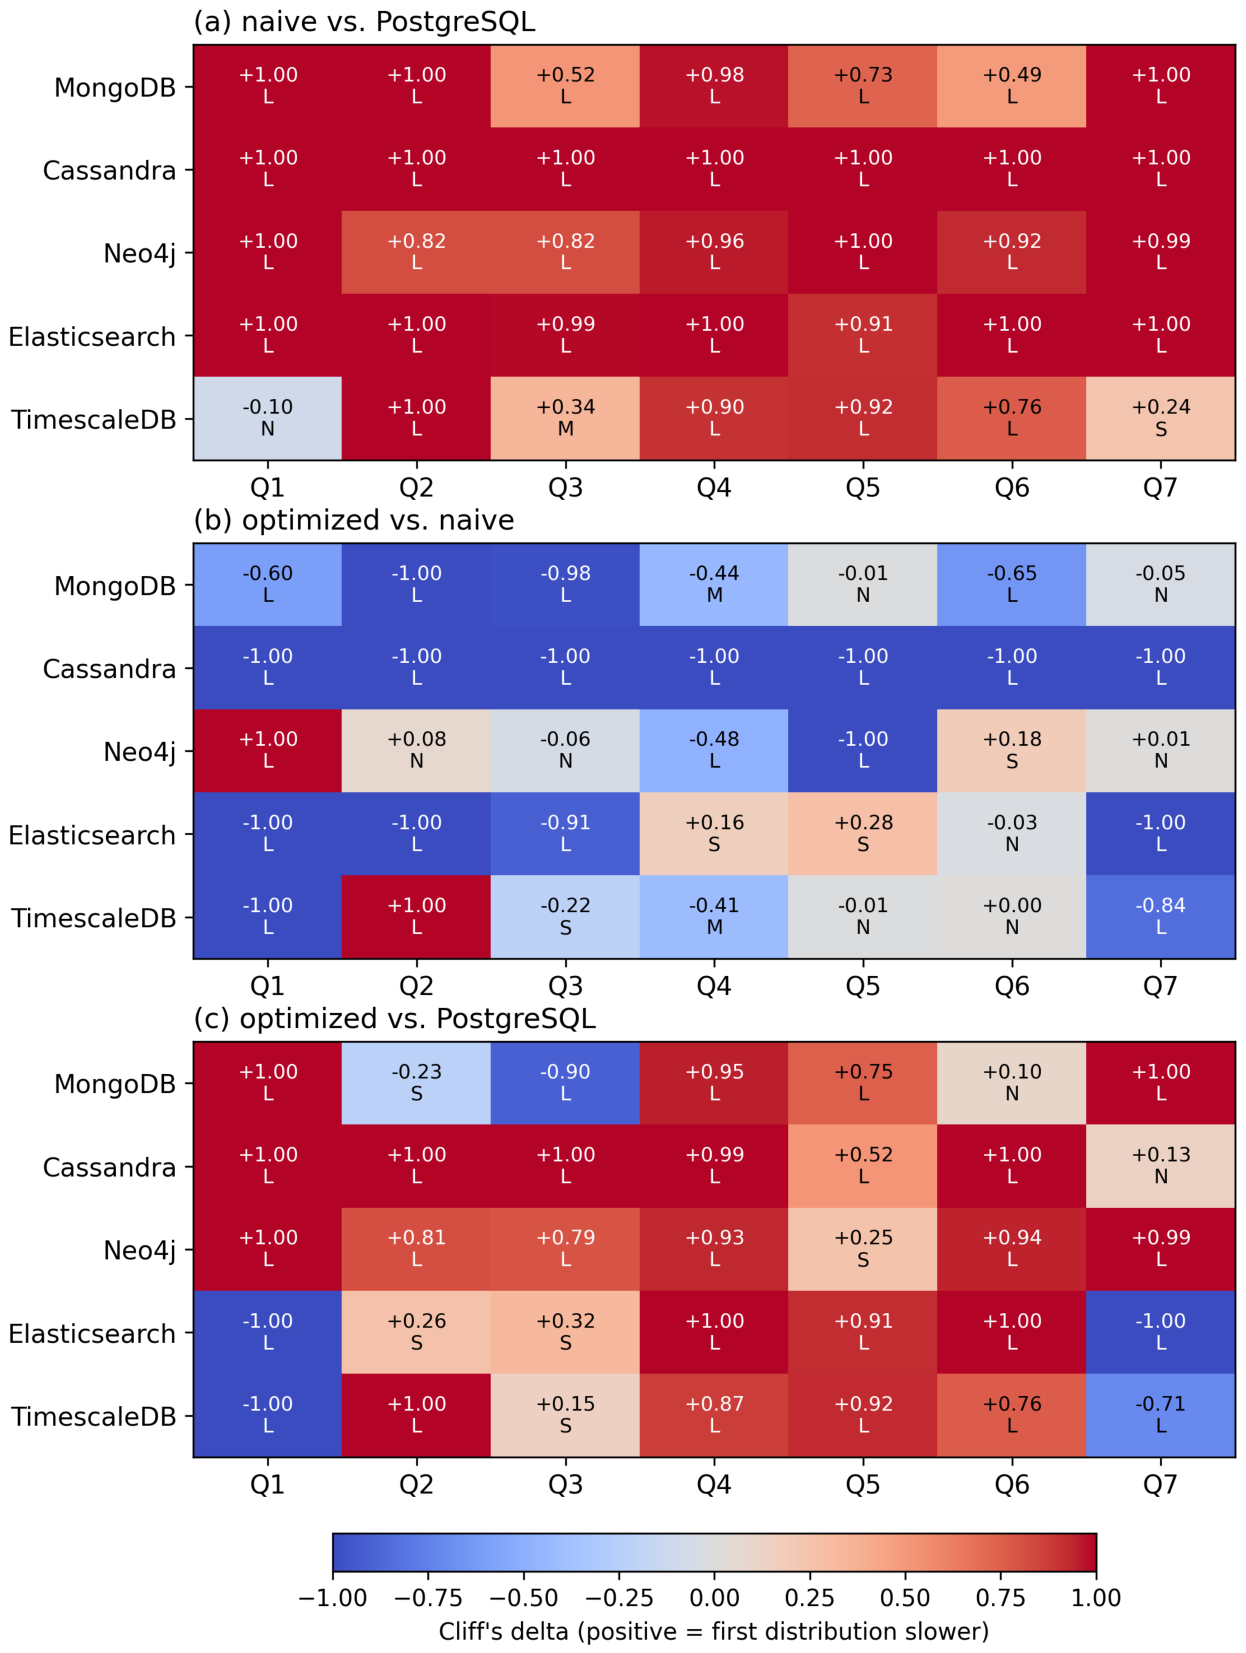
Figure 5.
Engine effect, p50 naive over p50 PostgreSQL; values above 1 indicate PostgreSQL is faster; red marks the naive implementation slower, blue faster, centered at parity (log color scale).
Figure 5.
Engine effect, p50 naive over p50 PostgreSQL; values above 1 indicate PostgreSQL is faster; red marks the naive implementation slower, blue faster, centered at parity (log color scale).
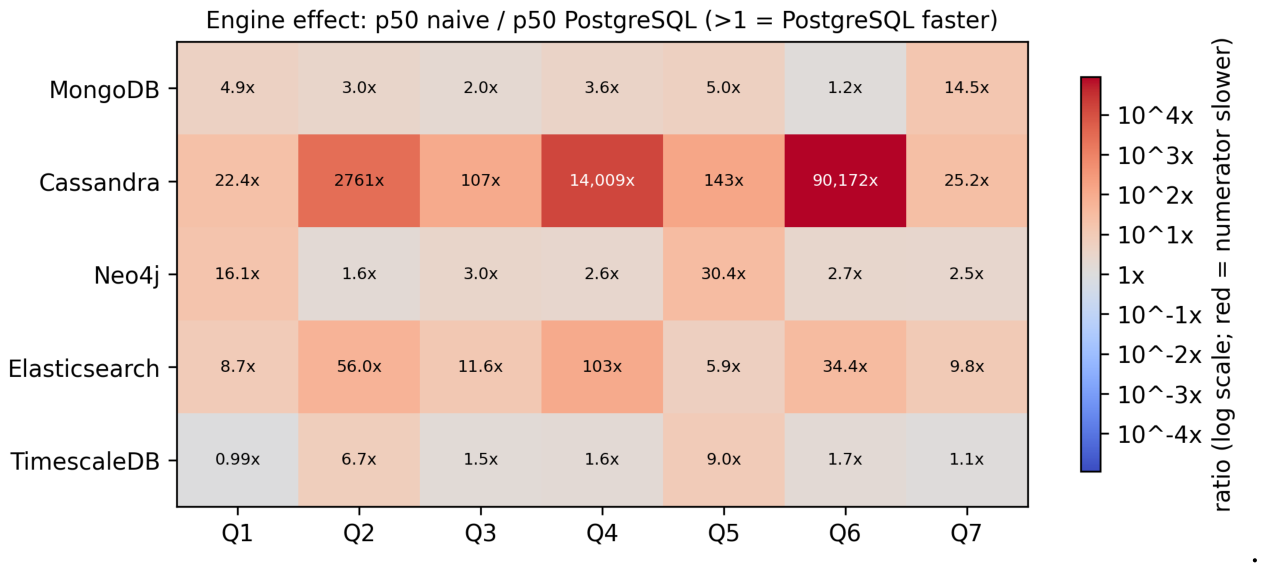
Figure 6.
Schema effect, p50 naive over p50 optimized; values above 1 indicate the optimization is faster; green marks an optimization gain and purple a regression (log color scale, centered at parity).
Figure 6.
Schema effect, p50 naive over p50 optimized; values above 1 indicate the optimization is faster; green marks an optimization gain and purple a regression (log color scale, centered at parity).
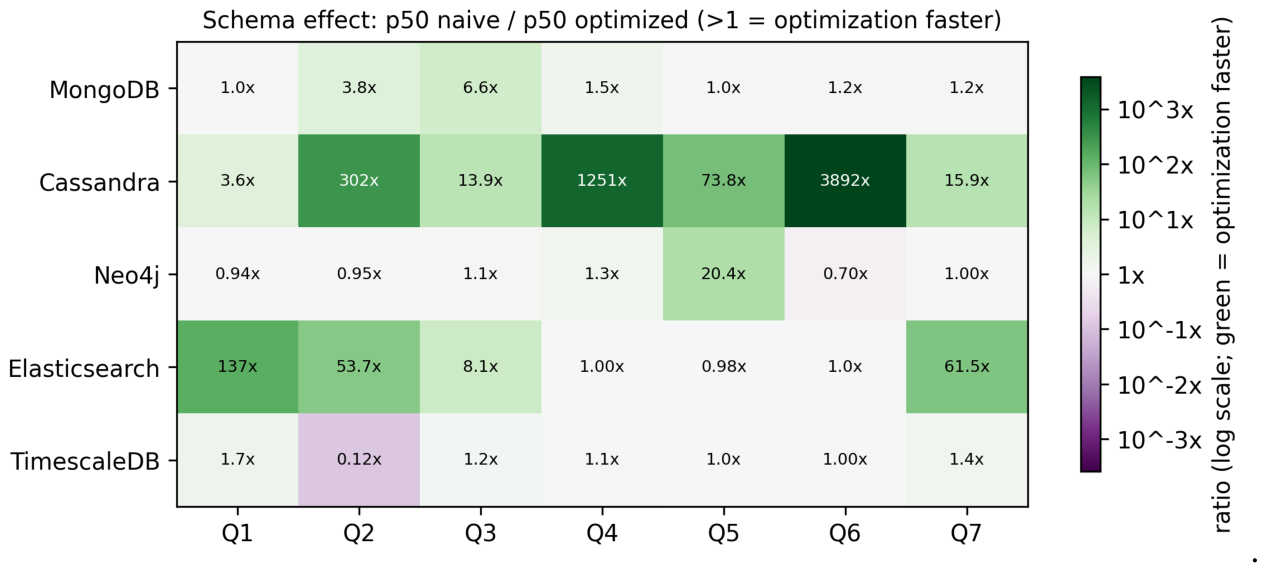
Figure 7.
Q8 write throughput versus concurrency, 1,000,000 single-record inserts (log scale); the end labels give the 100-thread throughput of each engine.
Figure 7.
Q8 write throughput versus concurrency, 1,000,000 single-record inserts (log scale); the end labels give the 100-thread throughput of each engine.
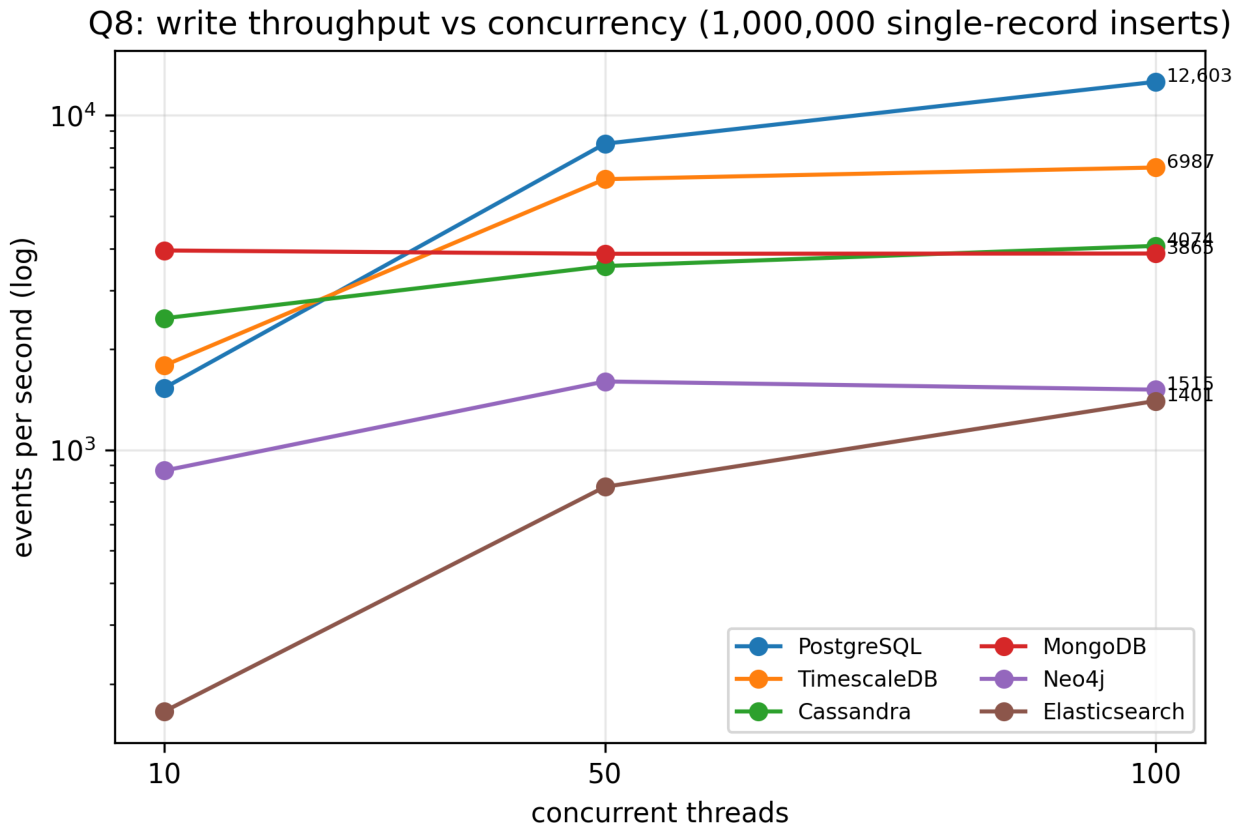
Figure 8.
Q8 p99 insert latency by engine and concurrency (ms, log scale).
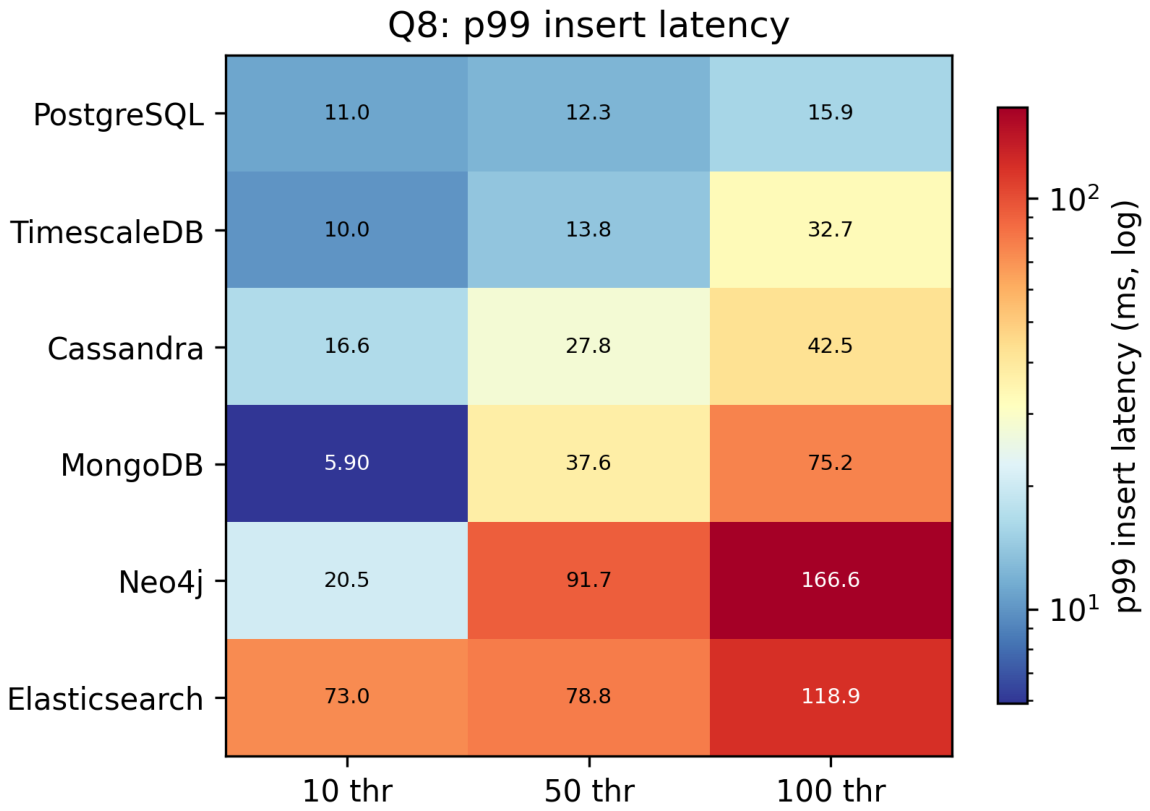
Figure 9.
Scalability growth factor, p50 at 100% over p50 at 10%, for Q2–Q7; Q1 excluded (Section 3.9). The color encodes the growth factor on a log scale, centered at parity, red for higher growth and blue for lower.
Figure 9.
Scalability growth factor, p50 at 100% over p50 at 10%, for Q2–Q7; Q1 excluded (Section 3.9). The color encodes the growth factor on a log scale, centered at parity, red for higher growth and blue for lower.
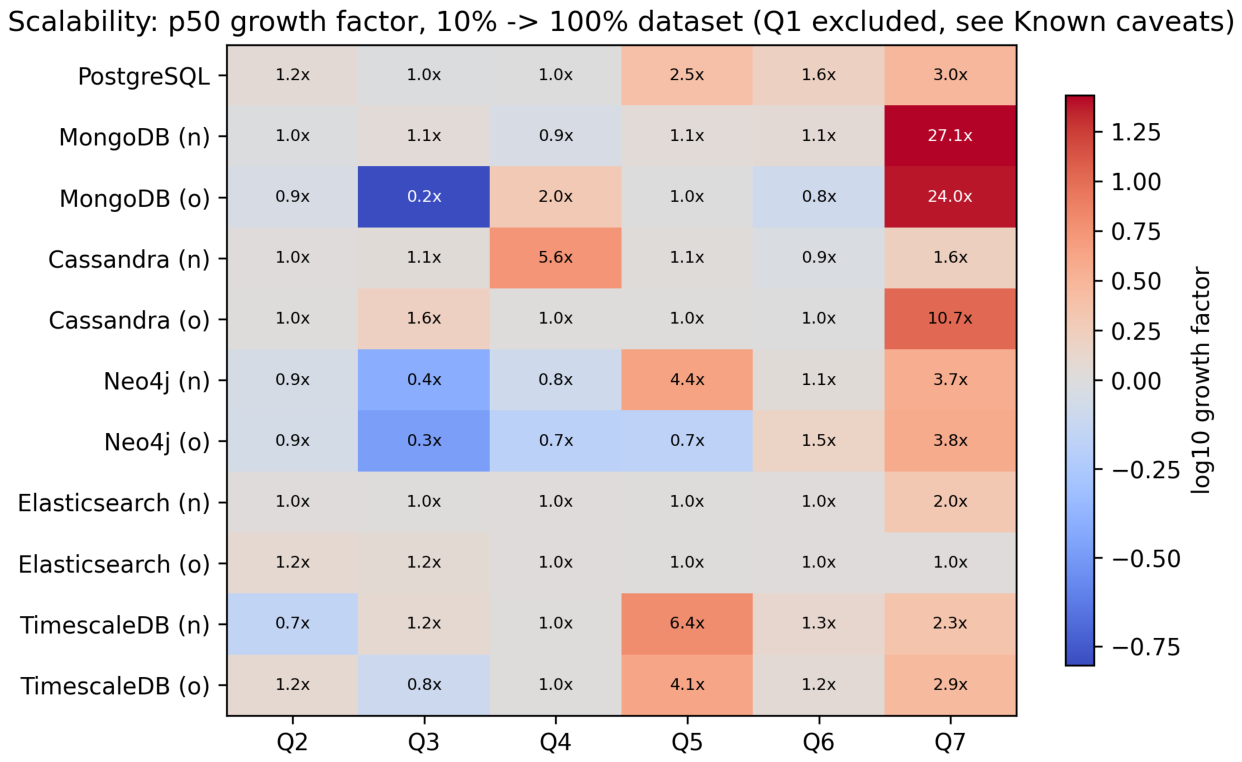

Table 1.
Synthetic dataset size.
| Table | Records |
| Users | 100,000 |
| Seller profiles | 8000 |
| Subscription tiers | 3 |
| Subscription tier pricing | 5 |
| Subscriptions | 49,632 |
| Products | 50,000 |
| Invoices | 724,237 |
| Invoice lines | 1,154,786 |
| Orders | 500,000 |
| Order items | 930,549 |
| Sessions | 10,000 |
| Events | 6,321,941 |
Table 2.
Read workload design.
| Query | Description | Workload type |
| Q1 | Monthly revenue by subscription tier over the last 12 months, including marketplace purchases, using the price in effect at invoice time | Relational, analytical (temporal joins, aggregation) |
| Q2 | Full invoice retrieval with customer, line items, and product details | Document, aggregation |
| Q3 | Active user session with full cart contents under concurrent access | Key-value, low-latency retrieval |
| Q4 | Top-10 related products by co-purchase for a given product | Graph traversal |
| Q5 | Full-text product search with relevance ranking | Search, information retrieval |
| Q6 | All events of a user in a 30-day window, time-ordered | Wide-column, time-series scan |
| Q7 | Seven-day rolling average of daily revenue per tier over six months, gap-filled | Rolling aggregate, time series |
Table 3.
p50 latency summary (ms); (n) and (o) denote the naive and optimized levels.
| Database | Q1 | Q2 | Q3 | Q4 | Q5 | Q6 | Q7 |
| PostgreSQL | 759.31 | 1.71 | 3.84 | 1.39 | 8.09 | 1.34 | 314.96 |
| MongoDB (n) | 3731.58 | 5.13 | 7.49 | 4.99 | 40.36 | 1.62 | 4551.84 |
| MongoDB (o) | 3593.32 | 1.35 | 1.13 | 3.30 | 39.34 | 1.37 | 3874.68 |
| Cassandra (n) | 17,004.75 | 4711.98 | 411.90 | 19,497.30 | 1152.42 | 121,146.20 | 7934.91 |
| Cassandra (o) | 4699.60 | 15.62 | 29.56 | 15.58 | 15.62 | 31.12 | 500.13 |
| Neo4j (n) | 12,228.10 | 2.81 | 11.51 | 3.57 | 245.66 | 3.68 | 797.68 |
| Neo4j (o) | 13,030.63 | 2.96 | 10.66 | 2.69 | 12.05 | 5.30 | 797.92 |
| Elasticsearch (n) | 6588.24 | 95.50 | 44.39 | 143.88 | 47.92 | 46.22 | 3096.50 |
| Elasticsearch (o) | 47.96 | 1.78 | 5.47 | 144.53 | 48.81 | 46.07 | 50.33 |
| TimescaleDB (n) | 748.31 | 11.44 | 5.67 | 2.23 | 72.75 | 2.25 | 346.91 |
| TimescaleDB (o) | 442.00 | 94.51 | 4.58 | 2.04 | 70.95 | 2.26 | 254.71 |
Table 4.
Q8 write throughput and insert latency by concurrency level.
| Database | Threads | Throughput (eps) | p50 (ms) | p95 (ms) | p99 (ms) | Wall time (s) |
| PostgreSQL | 10 | 1532.8 | 7.0 | 8.7 | 11.0 | 652.4 |
| 50 | 8230.1 | 5.8 | 9.1 | 12.3 | 121.5 | |
| 100 | 12,602.5 | 7.4 | 12.6 | 15.9 | 79.3 | |
| TimescaleDB | 10 | 1788.8 | 6.2 | 7.9 | 10.0 | 559.0 |
| 50 | 6448.3 | 7.1 | 11.3 | 13.8 | 155.1 | |
| 100 | 6987.1 | 12.8 | 24.2 | 32.7 | 143.1 | |
| Cassandra | 10 | 2475.2 | 3.0 | 13.2 | 16.6 | 404.0 |
| 50 | 3545.9 | 11.7 | 20.7 | 27.8 | 282.0 | |
| 100 | 4074.1 | 20.6 | 33.1 | 42.5 | 245.5 | |
| MongoDB | 10 | 3947.5 | 2.3 | 4.5 | 5.9 | 253.3 |
| 50 | 3858.7 | 11.4 | 27.7 | 37.6 | 259.2 | |
| 100 | 3865.0 | 22.6 | 55.4 | 75.2 | 258.7 | |
| Neo4j | 10 | 867.6 | 10.9 | 17.1 | 20.5 | 1152.7 |
| 50 | 1602.3 | 28.2 | 57.4 | 91.7 | 624.1 | |
| 100 | 1514.5 | 59.9 | 125.0 | 166.6 | 660.3 | |
| Elasticsearch | 10 | 165.4 | 59.7 | 68.6 | 73.0 | 6044.8 |
| 50 | 775.8 | 64.6 | 72.8 | 78.8 | 1289.1 | |
| 100 | 1400.8 | 68.6 | 91.4 | 118.9 | 713.9 |
Disclaimer/Publisher’s Note: The statements, opinions and data contained in all publications are solely those of the individual author(s) and contributor(s) and not of MDPI and/or the editor(s). MDPI and/or the editor(s) disclaim responsibility for any injury to people or property resulting from any ideas, methods, instructions or products referred to in the content. |
© 2026 by the authors. Licensee MDPI, Basel, Switzerland. This article is an open access article distributed under the terms and conditions of the Creative Commons Attribution (CC BY) license.
Copyright: This open access article is published under a Creative Commons CC BY 4.0 license, which permit the free download, distribution, and reuse, provided that the author and preprint are cited in any reuse.