

Submitted:
19 October 2026
Posted:
20 October 2026
You are already at the latest version
Abstract
Background/Objectives: Dietary mineral deficiencies rarely occur singly, yet most experimental work on the testis has used single-nutrient designs and endpoints, such as sperm number, that cannot tell where spermatogenesis fails. We asked whether isolated deficiency of magnesium, iron, selenium and zinc interrupts spermatogenesis at different stages and whether combined deficiency exceeds the effect of any single element. Methods: Outbred male rats were fed certified purified diets on a common base for twelve weeks from the age of three months: control, magnesium-, iron-, selenium-, zinc- and combined-deficient (six groups, n = 15 each). Testes were examined at six months by morphometry, a stage-resolved census of germ cells per tubule profile with three transition ratios, Johnsen scoring, van Gieson histochemistry and imprint cytology. Results: Every deficiency thinned the spermatogenic epithelium and reduced luminal spermatozoa, but the step affected differed. Selenium restriction lowered the spermatid-to-spermatocyte ratio to 4.05 against 4.98 in controls while sparing the adjacent transitions, a block at meiotic exit. Zinc restriction left that ratio unchanged (5.00) but reduced the spermatozoa-to-spermatid ratio to 1.45 against 1.68, a post-meiotic block, and spared spermatogonia. Magnesium and iron restriction suppressed all germ cell classes in proportion. Combined deficiency lowered two transitions at once and produced the steepest losses: spermatids fell 40.4%, the Johnsen score fell from 10 to 7.4 and Leydig cell density fell 24.5%, against at most 9.0% for any single element. Conclusions: The four deficiencies leave distinguishable structural signatures that sperm number alone does not reveal. Combined deficiency exceeds every single element, markedly so in the Leydig cell compartment, which argues for correcting concurrent deficiencies together rather than one at a time.
Keywords:
micronutrient deficiency
; spermatogenesis
; testicular morphometry
; Johnsen score
; germ cell transition ratios
; zinc
; selenium
; magnesium
; iron
; combined deficiency
; rat
1. Introduction
Mineral deficiencies rarely occur one at a time. A modelling analysis of usual dietary intakes across 185 countries estimated that billions of people fall below requirements for several minerals simultaneously, and that inadequate magnesium and zinc intakes are more prevalent among men than among women within the same country and age stratum [1]. The clustering has a mechanism. Cereal-dominated diets with limited animal-source foods deliver several minerals in parallel deficit, and phytate inhibits the absorption of zinc, iron and magnesium within the same meal [2]. Experimental nutrition, however, has been built almost entirely around single-nutrient designs. This leaves open a question with direct bearing on intervention policy: when several minerals are deficient together, does the damage simply add up, or does it exceed what single-nutrient repletion would prevent?
The seminiferous epithelium is a sensitive place to ask. It sustains one of the highest mitotic rates in the adult body, depends on continuous mitochondrial ATP supply, and carries an exceptionally high content of polyunsaturated membrane lipids. The four minerals examined here reach it by distinct routes. Zinc governs germ cell differentiation and Leydig cell steroidogenesis, and even marginal restriction raises germ cell apoptosis and disorganizes the epithelium [3,4,5]. Selenium acts through selenoproteins, principally selenoprotein P and the mitochondrial form of glutathione peroxidase 4, which is concentrated in late spermatids and in the midpiece of the mature spermatozoon; dietary selenium restriction lowers testicular nuclear Gpx4 mRNA and degrades sperm quality [6,7]. Iron deficiency lowers circulating testosterone, suppresses steroidogenic enzymes and reduces seminiferous tubule diameter [8,9]. For magnesium the evidence is largely clinical: serum magnesium correlates with sperm concentration and progressive motility in infertile men [10]. Because the entry points differ, the four deficiencies would not be expected to damage the tissue identically. This has not been tested, since no study has compared them head to head on a common diet base, nor combined them.
Distinguishing them requires an endpoint with more resolution than tubule diameter or sperm count. Spermatogenesis proceeds through an ordered sequence of cell classes, and an insult that halts one transition leaves a characteristic imprint on the relative abundance of the classes that follow. Counting each germ cell class within the same tubule profile therefore localizes the point of arrest, while the Johnsen score [11] summarizes the most advanced stage reached. Adding quantification of the interstitial compartment and of peritubular and interstitial collagen captures the stromal response alongside the germinal one.
Within the same alimentary deficiency model, organ-specific morphological responses have been documented in the thyroid gland under selenium restriction [12], in the thymus and spleen [13] in the myocardium [14] and in the kidney [15], showing that one dietary manipulation produces distinct, tissue-dependent outcomes. Here we asked two questions of the testis: whether each of the four deficiencies arrests rat spermatogenesis at a different point, and whether combined deficiency exceeds what any single element produces alone.
2. Materials and Methods
2.1. Animals, Housing and Ethics
The study is reported in accordance with the ARRIVE 2.0 guidelines [16]. All procedures were approved by the Local Ethics Committee of Abu Ali ibn Sino Bukhara State Medical Institute (protocol No. 5 of 27 November 2024) and conducted in accordance with Directive 2010/63/EU [17].
One hundred and five outbred male white rats aged 12 weeks (body weight 108.6 ± 1.78 g at entry) were housed in the institutional vivarium under a 12 h light/dark cycle at 23 °C and 40 to 60% relative humidity. Animals were acclimatized for two weeks on standard chow with distilled water ad libitum and screened for somatic and infectious disease before allocation. Rats aged 3 and 6 months correspond approximately to human ages of 13 and 18 years [18,19], so the 6-month endpoint represents a sexually mature animal with fully established spermatogenesis.
Animals were assigned to the six groups at the same time from a single cohort of identical age and source, matched for entry body weight and housed under identical conditions. Formal randomization was not applied, and histological assessment was not blinded to group allocation. Both points are addressed in the Discussion.
2.2. Diets and Experimental Design
Purified diets were supplied as 10 mm pellets by Altromin Spezialfutter GmbH & Co. KG (Lage, Germany; batch certificate No. 36/2024), based on casein and egg protein. The certified mineral content of each diet is given in Table 1.
Fifteen rats were euthanized at 3 months to establish a baseline reference point. The remaining 90 formed six groups of 15: control, magnesium-deficient, iron-deficient, selenium-deficient, zinc-deficient and combined-deficient (magnesium, iron, selenium and zinc). Diets and distilled water were provided ad libitum for twelve weeks, a period previously shown to be sufficient to establish alimentary micronutrient deficiency in the rat [20,21].
Each deficient diet supplied its target element well below the established requirement of the laboratory rat [22]. Because the diets were commercial formulations rather than compounded in house, minerals other than the target element were not fully matched across groups. Two differences deserve note. The combined-deficiency diet contained 97.7 mg/kg magnesium, about 1.8-fold more than the isolated magnesium-deficient diet, so the combined group was the less magnesium-restricted of the two. The selenium-deficient diet contained 46.99 mg/kg zinc against 29.30 mg/kg in the control diet.
2.3. Euthanasia and Tissue Collection
Body weight was recorded on a DELI KIP-5 balance (Deli Group, Ningbo, China) before euthanasia. Animals were euthanized at 6 months of age in the morning after an overnight fast. Each rat was placed in a closed glass chamber containing cotton wool soaked in diethyl ether and kept covered for 2 min, after which decapitation was performed manually. The same procedure was used for the baseline group at 3 months. Testes were excised while moist, weighed on a JW-1 balance (Acom Inc., Pocheon, Republic of Korea; e = 0.02 g) and measured.
2.4. Histology, Histochemistry and Imprint Cytology
Testes were fixed in 10% buffered formalin for 24 h, washed in running water for 3 h, dehydrated through graded ethanol (50, 60, 70, 80, 96% and absolute), cleared in xylene, held in a saturated solution of paraffin in xylene at 37 °C and embedded in paraffin (Biovitrum, St. Petersburg, Russia) at 56 °C. Serial 3 µm sections were cut on a Reichert-Jung 2040 microtome (Leica, Wetzlar, Germany), mounted on Standard Grade slides (Citotest Labware Manufacturing, Haimen, China) and stained with hematoxylin and eosin, or by the van Gieson method for collagen.
Collagen distribution was assessed on van Gieson sections of all groups. In addition, the collagen fraction of a representative field from each group was quantified by color thresholding in QuPath v0.5.1 [23]. These fractions describe one field per group and were not replicated across animals, so they are reported descriptively and were not tested statistically.
For imprint cytology, a 1.0 × 1.0 cm fragment of testis was pressed onto a clean slide, air-dried, fixed in methanol and stained by the Romanowsky–Giemsa method. Germ cells at successive stages were identified and counted in a standardized field, with mature spermatozoa scored separately, as a cell-level check on the section-based census.
2.5. Morphometry and Stage-Resolved Germ Cell Census
Morphometry was performed on a CX40 microscope (Sunny Optical Technology, Ningbo, China) with integrated digital morphometric software, following the protocol established for 6-month-old rat testis in this laboratory [24,25,26].
Tubular parameters comprised tunica albuginea thickness (µm), tubule profiles per ×100 field, tubule cross-sectional area, luminal area and spermatogenic epithelium area (µm2), and epithelium thickness (µm). The cellular census, recorded per tubule profile, comprised Sertoli cells, spermatogonia, spermatocytes, round spermatids and luminal spermatozoa, together with the cross-sectional area of each germ cell class. Interstitial parameters comprised interstitial area (µm2), the proportion of the field occupied by interstitium, and Leydig cell number per 104 µm2 of interstitium.
To localize the point at which spermatogenesis was interrupted, three transition ratios were derived per animal from the census: spermatocytes to spermatogonia (entry into meiosis), spermatids to spermatocytes (completion of meiosis) and spermatozoa to spermatids (spermiogenesis and spermiation). Spermatogenesis was additionally scored by the Johnsen method [11] with the modification of Aafjes et al. [27], averaged over ten fields at ×400.
2.6. Statistical Analysis
Analyses were performed in IBM SPSS Statistics v23 (IBM Corp., Armonk, NY, USA) and Microsoft Excel. Normality was assessed by the Shapiro–Wilk test together with skewness and kurtosis. Normally distributed variables are presented as mean ± standard error of the mean (SEM); each deficient group was compared with the 6-month control by Student's t-test, and non-normal variables by the Mann–Whitney U-test. Two-sided p < 0.05 was considered significant. Transition ratios and the Johnsen score are reported as group means and were not tested separately. To compare combined with single deficiency, the percentage change in the combined group was set against the largest single-deficiency change and against the arithmetic sum of the four single-deficiency changes.
3. Results
3.1. Animals and Diets
All animals completed the twelve-week feeding period. Testis weight and gross dimensions did not differ from control in any deficient group, so the changes described below were confined to the microscopic level.
3.2. Reference Values at Three and Six Months
Between 3 and 6 months the control testis completed its maturation. Tubule cross-sectional area rose from 5.3 ± 0.21 to 5.9 ± 0.16 ×104 µm2 and luminal area from 6.7 ± 0.68 to 8.4 ± 0.23 ×103 µm2; spermatogonia per profile rose from 11.3 ± 0.58 to 13.1 ± 0.26 and their cross-sectional area from 77.8 ± 2.90 to 85.2 ± 1.72 µm2 (all p < 0.05). Luminal spermatozoa, few in number at 3 months, reached 398.6 ± 8.85 per profile at 6 months (p < 0.001). Sertoli cell number, spermatocyte and spermatid counts, tunica albuginea thickness and Leydig cell density did not change (Supplementary Table S1).
At six months the control testis showed the picture expected of a fully mature animal (Figure 1A). The tunica albuginea measured 117.6 ± 3.58 µm with evenly oriented fibres. A single ×100 field contained 10.3 ± 0.31 tubule profiles, with interstitial partitions occupying 14.3 ± 0.40% of the field. Epithelial thickness was 88.8 ± 2.74 µm. Per tubule profile we counted 9.8 ± 0.30 Sertoli cells, 13.1 ± 0.26 spermatogonia, 47.7 ± 1.06 spermatocytes and 237.5 ± 5.87 round spermatids, with 398.6 ± 8.85 spermatozoa in the lumen. Leydig cells numbered 27.70 ± 0.79 per 104 µm2. Every tubule scored 10 on the Johnsen scale. These values served as the reference for all comparisons (Table 2).
3.3. Tubular Architecture
Epithelial thinning was the most consistent finding and separated the groups cleanly (Table 2; Figure 1). Magnesium and iron restriction reduced thickness to 78.1 ± 2.01 µm and 77.2 ± 2.48 µm, selenium and zinc restriction to 70.2 ± 2.09 µm and 69.2 ± 1.69 µm, and combined restriction to 58.6 ± 2.04 µm, a loss of one third.
Epithelial area behaved differently from thickness. It fell under magnesium and combined restriction but was unchanged under iron, selenium and zinc. In the zinc group the area was identical to control at 4.6 ± 0.12 ×104 µm2 while thickness dropped by 22%, so the epithelium had spread thinner over a larger tubule rather than lost bulk.
Luminal area rose in every group. Zinc produced the widest lumina at 11.2 ± 0.27 ×103 µm2, 33% above control, followed by magnesium at 10.8 ± 0.32 and the combined group at 10.5 ± 0.33. Selenium gave the smallest rise. Tubule profile counts per field fell from 10.3 to between 8.9 and 9.7, which reflects tubule enlargement rather than tubule loss. The tunica albuginea thickened in four of the five groups, reaching 138.4 ± 4.17 µm under combined restriction; the increase in the zinc group did not reach significance.
3.4. Where Spermatogenesis Was Interrupted
Every deficient group lost germ cells, which on its own says only that output was suppressed. The transition ratios locate the step affected (Figure 2A).
Selenium restriction lowered the spermatid-to-spermatocyte ratio to 4.05 against 4.98 in controls, the largest fall recorded for a single deficiency, while leaving the earlier and later transitions near normal. Cells entered meiosis in near-normal numbers and fewer emerged from it.
Zinc restriction produced the opposite pattern. Its spermatid-to-spermatocyte ratio was 5.00, indistinguishable from control, but the spermatozoa-to-spermatid ratio fell to 1.45 against 1.68. Spermatids formed normally and fewer completed spermiogenesis and spermiation. This group had the fewest luminal spermatozoa of any single deficiency, 295.5 ± 7.54, despite carrying more spermatids than the selenium group. Its spermatogonial count was unchanged, so the proliferative compartment was spared.
Iron restriction left the spermatocyte count statistically unchanged at 45.3 ± 1.38 while significantly reducing spermatids and spermatozoa, so its losses accumulated after meiotic entry. Magnesium restriction reduced every germ cell class, with all three ratios within 10% of control, consistent with general suppression rather than a discrete block.
The combined group was the only one in which two transitions fell together. Both the spermatocyte-to-spermatogonia ratio, at 3.23, and the spermatid-to-spermatocyte ratio, at 4.18, dropped below control, and spermatids fell by 40.4%, the steepest single loss in the study.
Sertoli cell counts remained between 9.0 and 9.7 against 9.8 in controls, with no group reaching significance. The cross-sectional areas of spermatogonia, spermatocytes and round spermatids did not change significantly in any group (Supplementary Table S2), so the losses were in cell number rather than in cell size.
3.5. Interstitium and Leydig Cells
Interstitial area rose in every group, from 4.7 ± 0.10 ×105 µm2 in controls to between 5.2 and 5.6 ×105 µm2, and the proportion of the field occupied by interstitium rose in parallel, reaching 17.5 ± 0.48% under combined restriction. Leydig cell density fell by 8 to 9% under magnesium, iron and selenium restriction, while the zinc group value did not reach significance. The combined group fell to 20.9 ± 0.37 per 104 µm2, 24.5% below control and roughly three times the largest single-deficiency reduction. Leydig cytoplasm appeared pale throughout, with focal vacuolation in the iron and selenium groups.
3.6. Collagen Distribution
Van Gieson staining of control testes showed collagen confined to the interstitium in an even distribution, with peritubular density at physiological levels and intact tubular basement membranes (Figure 2B). All deficient groups showed increased interstitial collagen with uneven peritubular distribution. Basement membrane thickening with loss of clear demarcation was most evident under magnesium restriction (Figure 2C), and collagen accumulation around Leydig cells was seen under magnesium and combined restriction (Figure 2D).
Digital quantification of one representative field per group gave the same ordering. Collagen occupied 3.7% of the field in the control, 5.2% under iron restriction, 5.9% under magnesium, 6.7% under selenium, 7.2% under zinc and 9.1% under combined restriction (Table 2). Iron produced the smallest increase and zinc the largest of the single deficiencies, an ordering that differs from that of germ cell loss, where selenium outranked zinc for spermatid depletion. Because these values derive from single fields, they indicate direction and order rather than magnitude.
3.7. Imprint Cytology
Imprint preparations gave a cell-level picture consistent with the sections. In the standardized control field, mature spermatozoa made up 37% of the cells counted (10 of 27). The proportion fell to 29.4% under magnesium, 31.3% under iron, 30.0% under selenium and 27.8% under zinc restriction, and to 21.1% under combined restriction (Supplementary Table S2). As with collagen, these are single-field counts and are reported descriptively.
3.8. Johnsen Score and Combined Versus Single Deficiency
Johnsen scores fell from 10 in controls to 9.3 under iron restriction, 9.1 under magnesium, 9.0 under selenium, 8.5 under zinc and 7.4 under combined restriction, an ordering that matches that of luminal spermatozoa counts.
On every parameter the combined group was worse than the worst single deficiency. Luminal spermatozoa fell by 34.4% against 25.9% for zinc, spermatids by 40.4% against 29.0% for selenium, and epithelial thickness by 34.0% against 22.1% for zinc. Leydig cells stand apart: the largest single-deficiency reduction was 9.0%, whereas combined restriction produced 24.5%.
The combined deficits were nonetheless smaller than the arithmetic sum of the four single deficits. Summing the individual reductions in luminal spermatozoa gives 82.5% against an observed 34.4%. Combined deficiency therefore exceeded any single element without reaching strict additivity, and did so although the combined diet was less magnesium-restricted than the isolated magnesium diet.
4. Discussion
Four dietary deficiencies, imposed on a common diet base and assessed by the same observer with the same instrument, produced four different testicular phenotypes. The distinction is not one of severity alone. Selenium and zinc restriction reduced luminal spermatozoa by similar amounts, 19.7% and 25.9%, yet arrived there by opposite routes. Selenium blocked meiotic exit while sparing spermiogenesis; zinc left meiosis intact and blocked the post-meiotic transition. A study reporting only sperm counts would have called these two deficiencies equivalent.
The zinc phenotype fits what is known of the element's distribution in the maturing germ cell. Zinc participates in chromatin condensation and in the structural maturation that converts a round spermatid into a motile cell, and it is concentrated in the developing spermatid and in the outer dense fibres of the flagellum [4]. A restriction that leaves spermatid formation untouched while impairing the steps that follow is consistent with that role. Our data also narrow a claim often made for zinc: the spermatogonial compartment was numerically unaffected, so the deficit lies in differentiation rather than in proliferation.
The selenium phenotype is less easily reconciled with the literature. GPX4 is concentrated in late spermatids and in the midpiece of the mature spermatozoon, and dietary selenium restriction lowers testicular nuclear Gpx4 mRNA in parallel with falling sperm quality [6,7], which predicts a post-meiotic lesion. We observed the opposite: a fall in the spermatid-to-spermatocyte ratio with a preserved, indeed slightly elevated, spermatozoa-to-spermatid ratio. Selenium restriction of this duration may act earlier than GPX4-dependent spermiogenesis, perhaps through selenoproteins expressed in spermatocytes, and there is precedent for selenium acting on differentiation at the tubular level through altered c-Jun and c-Fos expression [28]. An alternative reading is that the elevated terminal ratio reflects survivorship among a reduced spermatid pool rather than preserved spermiogenic efficiency. Selenium deficiency also produces multiple structural defects in epididymal spermatozoa [29], so a normal ratio of luminal spermatozoa to spermatids does not imply that those spermatozoa are functionally intact.
Magnesium and iron restriction produced proportional reductions across all germ cell classes, with transition ratios close to control. For iron this is consistent with reduced steroidogenic support and lower intratesticular androgen availability [8,9], which would depress output without arresting a specific step. The magnesium group showed the most pronounced basement membrane and peritubular collagen changes, raising the possibility that part of its germ cell loss is secondary to alteration of the peritubular compartment.
Interstitial collagen followed the germinal rather than the interstitial-cell pattern. Its rise under combined restriction, 146% above control in the quantified field, was roughly half the arithmetic sum of the four single-deficiency increases, the same proportion seen for germ cell loss. Fibrotic remodelling therefore appears to track the severity of the overall dietary insult rather than to depend on any one element.
Combined deficiency was worse than any single element on every parameter, but the deficits were far below the arithmetic sum of the individual effects. Describing the interaction as synergistic would overstate it for most endpoints. Leydig cell density is the exception. A 24.5% reduction against a maximum of 9.0% for any single element is difficult to explain additively, and suggests that the interstitial compartment is more vulnerable to concurrent restriction than the germinal epithelium is. The distinction matters for supplementation policy. If the germinal response to combined deficiency is largely explained by its strongest single component, correcting that component may recover most of the loss. If the interstitial response is not, steroidogenic recovery may require correcting all deficient elements together.
One feature of the design strengthens rather than weakens this comparison. The combined diet supplied 97.7 mg/kg magnesium against 54 mg/kg in the isolated magnesium diet, so the combined group was the less magnesium-restricted of the two. The greater injury in that group arose despite, not because of, its magnesium exposure.
Several limitations qualify these findings. Deficiency status was established from certified diet composition and feeding duration rather than from measured tissue or plasma mineral concentrations. Each deficient diet supplied its target element at a small fraction of the requirement, and the changes were element-specific in a pattern that a nonspecific dietary insult would not produce, but direct biochemical confirmation was not available for this report and the depletion achieved in each animal cannot be stated. Animals were allocated by matching for age and entry body weight rather than by formal randomization, and histological assessment was not blinded; both depart from current recommendations and may introduce bias, although the quantitative nature of the endpoints limits its likely size. Anaesthesia before decapitation was induced with diethyl ether, which current guidance no longer recommends, and depth of anaesthesia was not formally assessed. Body weight was recorded before euthanasia, but group-level values were not retained and are not reported. Food intake was not recorded and no pair-fed control was included, so a contribution of reduced energy intake cannot be excluded, which is a material limitation in a dietary restriction study. The collagen fractions and imprint cytology counts derive from one field per group and carry no measure of dispersion. Hormone concentrations were not measured, which limits interpretation of the Leydig cell findings. Immunohistochemical characterization of proliferative and apoptotic regulation was outside the scope of this report; a combined morphometric and immunohistochemical approach of the kind recently applied to chronic remodelling of the human palatine tonsil [30] is the natural next step for the deficient testis. Assessment was made at a single time point, so the order in which the changes developed is unknown. Finally, the commercial diets differed in minerals other than the target element, as set out in Table 1.
5. Conclusions
Isolated deficiency of magnesium, iron, selenium and zinc interrupts rat spermatogenesis at different points, and stage-resolved germ cell counting distinguishes them where sperm number alone does not: selenium at meiotic exit, zinc after meiosis, magnesium and iron by proportional suppression of all classes. Combined deficiency exceeds any single element throughout and most markedly in the Leydig cell compartment, which fell by 24.5% against at most 9.0% for a single element. In populations where several minerals are deficient together, the steroidogenic compartment may therefore not recover with single-nutrient repletion, and supplementation strategies should be tested accordingly.
Supplementary Materials
The following supporting information can be downloaded at the website of this paper posted on Preprints.org.
Author Contributions
Conceptualization, Ravshan Radjabovich Baymuradov, Shukhrat Jumayevich Teshayev and Mashrab Rustamovich Turdiev; Methodology, Shukhrat Jumayevich Teshayev; Investigation, Ravshan Radjabovich Baymuradov, Shukhrat Jumayevich Teshayev and Mashrab Rustamovich Turdiev; Resources, Mansur Makhmudovich Tolibov; Data curation, Mansur Makhmudovich Tolibov; Writing – original draft, Ravshan Radjabovich Baymuradov and Mashrab Rustamovich Turdiev; Writing – review & editing, Shukhrat Jumayevich Teshayev, Mansur Makhmudovich Tolibov and Mashrab Rustamovich Turdiev; Visualization, Ravshan Radjabovich Baymuradov; Supervision, Mansur Makhmudovich Tolibov; Project administration, Mashrab Rustamovich Turdiev. All authors have read and agreed to the published version of the manuscript.
Funding
This research received no external funding.
Institutional Review Board Statement
Informed Consent Statement
Not applicable.
Data Availability Statement
The original contributions presented in this study are included in the article/supplementary material. Further inquiries can be directed to the corresponding author.
Conflicts of Interest
The authors declare no conflict of interest.
References
- Passarelli, S.; Free, C.M.; Shepon, A.; Beal, T.; Batis, C.; Golden, C.D. Global estimation of dietary micronutrient inadequacies: a modelling analysis. Lancet Glob. Health 2024, 12, e1590–e1599. [Google Scholar] [CrossRef] [PubMed]
- Richards, J.D.; Cori, H.; Rahn, M.; Finn, K.; Bárcena, J.; Kanellopoulos, A.K.; Péter, S.; Spooren, A. Micronutrient bioavailability: concepts, influencing factors, and strategies for improvement. Front. Nutr. 2025, 12, 1646750. [Google Scholar] [CrossRef] [PubMed]
- Chen, Y.; Yang, J.; Wang, Y.; Yang, M.; Guo, M. Zinc deficiency promotes testicular cell apoptosis in mice. Biol. Trace Elem. Res. 2020, 195, 142–149. [Google Scholar] [CrossRef] [PubMed]
- Marín de Jesús, S.; Vigueras-Villaseñor, R.M.; Cortés-Barberena, E.; Hernández-Rodriguez, J.; Montes, S.; Arrieta-Cruz, I.; Pérez-Aguirre, S.G.; Bonilla-Jaime, H.; Limón-Morales, O.; Arteaga-Silva, M. Zinc and its impact on the function of the testicle and epididymis. Int. J. Mol. Sci. 2024, 25, 8991. [Google Scholar] [CrossRef] [PubMed]
- Zeng, X.; Wang, Z.; Yu, L.; Wang, L.; Liu, Y.; Chen, Y.; Wang, C. Zinc supplementation reduces testicular cell apoptosis in mice and improves spermatogenic dysfunction caused by marginal zinc deficiency. Biol. Trace Elem. Res. 2024, 202, 1656–1668. [Google Scholar] [CrossRef] [PubMed]
- Qazi, I.H.; Angel, C.; Yang, H.; Zoidis, E.; Pan, B.; Wu, Z.; Ming, Z.; Zeng, C.-J.; Meng, Q.; Han, H.; Zhou, G. Role of selenium and selenoproteins in male reproductive function: a review of past and present evidences. Antioxidants 2019, 8, 268. [Google Scholar] [CrossRef] [PubMed]
- Zhou, J.-C.; Zheng, S.; Mo, J.; Liang, X.; Xu, Y.; Zhang, H.; Gong, C.; Liu, X.-L.; Lei, X.G. Dietary selenium deficiency or excess reduces sperm quality and testicular mRNA abundance of nuclear glutathione peroxidase 4 in rats. J. Nutr. 2017, 147, 1947–1953. [Google Scholar] [CrossRef] [PubMed]
- Tsao, C.-W.; Liao, Y.-R.; Chang, T.-C.; Liew, Y.-F.; Liu, C.-Y. Effects of iron supplementation on testicular function and spermatogenesis of iron-deficient rats. Nutrients 2022, 14, 2063. [Google Scholar] [CrossRef] [PubMed]
- Harrer, A.; Meyron-Holtz, E.G.; Meinhardt, A. The role of iron in normal and impaired testicular function. Andrology 2025. [Google Scholar] [CrossRef] [PubMed]
- Yahyavi, S.K.; Probst-Drejer, B.; Poulsen, N.N.; Jorsal, M.J.; Juul, A.; Jørgensen, N.; et al. Serum magnesium is linked with sperm concentration, motile sperm count and serum anti-Müllerian hormone in infertile men. Reprod. Biomed. Online 2026, 52, 105232. [Google Scholar] [CrossRef] [PubMed]
- Johnsen, S.G. Testicular biopsy score count: a method for registration of spermatogenesis in human testes. Normal values and results in 335 hypogonadal males. Hormones 1970, 1, 2–25. [Google Scholar] [CrossRef] [PubMed]
- Aslanov, O.G.; Baymuradov, R.R. Morphological and morphometric characteristics of the thyroid gland in white rats under selenium deficiency. Am. J. Med. Med. Sci. 2025, 15, 4321–4324. [Google Scholar]
- Turdiyev, M.R. Comparative Characteristics of Morphological and Morphometric Parameters of the Spleen and Thymus under Normal Conditions and Alimentary Microelementosis. DSc Thesis Abstract, Bukhara State Medical Institute, Bukhara, Uzbekistan, 2025. [Google Scholar]
- Kim, I.L.; Radjabov, A.B. Comparative characteristics of cardiac morphology in experimental modelling of different forms of alimentary microelementosis. In Proceedings of the Republican Scientific and Practical Conference, Bukhara, Uzbekistan, 2026; pp. 36–38. [Google Scholar]
- Baymuradov, R.; Teshaev, Sh. E-cadherin expression in kidney tissue in different types of alimentary microelementosis. Neonatol. Khir. Perinat. Med. (In Ukrainian) 2026, 16, 190–198. [Google Scholar] [CrossRef]
- Percie du Sert, N.; Hurst, V.; Ahluwalia, A.; Alam, S.; Avey, M.T.; Baker, M.; et al. The ARRIVE guidelines 2.0: updated guidelines for reporting animal research. PLoS Biol. 2020, 18, e3000410. [Google Scholar] [CrossRef] [PubMed]
- European Parliament and Council Directive 2010/63/EU of 22 September 2010 on the protection of animals used for scientific purposes. Off. J. Eur. Union 2010, L276, 33–79.
- Sengupta, P. The laboratory rat: relating its age with human's. Int. J. Prev. Med. 2013, 4, 624–630. [Google Scholar] [PubMed]
- Ghasemi, A.; Jeddi, S.; Kashfi, K. The laboratory rat: age and body weight matter. EXCLI J. 2021, 20, 1431–1445. [Google Scholar] [CrossRef] [PubMed]
- Qiao, L.; Guo, Z.; Liu, H.; Liu, J.; Lin, X.; Deng, H.; Liu, X.; Zhao, Y.; Xiao, X.; Lei, J.; Han, J. Protective effect of mitophagy regulated by mTOR signaling pathway in liver fibrosis associated with selenium. Nutrients 2022, 14, 2410. [Google Scholar] [CrossRef] [PubMed]
- Liu, H.; Lin, X.; Chilufya, M.M.; Qiao, L.; Bao, M.; Wen, X.; et al. Synergistic effects of T-2 toxin and selenium deficiency exacerbate renal fibrosis through modulation of the ERα/PI3K/Akt signaling pathway. Ecotoxicol. Environ. Saf. 2024, 269, 115748. [Google Scholar] [CrossRef] [PubMed]
- National Research Council Nutrient Requirements of Laboratory Animals, 4th rev. ed.; National Academies Press: Washington, DC, USA, 1995. [CrossRef] [PubMed]
- Bankhead, P.; Loughrey, M.B.; Fernández, J.A.; Dombrowski, Y.; McArt, D.G.; Dunne, P.D.; et al. QuPath: open source software for digital pathology image analysis. Sci. Rep. 2017, 7, 16878. [Google Scholar] [CrossRef] [PubMed]
- Baymuradov, R.R.; Kamalova, S.M.; Temirova, N.R.; Asadova, N.K. Morphometric parameters of the testis of 6-month-old rats in the norm and under radiation exposure. J. Adv. Zool. 2023, 44, 2167–2171. [Google Scholar] [CrossRef]
- Teshaev, S.J.; Baymuradov, R.R.; Khamidova, N.K.; Khasanova, D.A. Morphological parameters of rat testes in normal conditions, with the background of chronic radiating disease and under the influence of an antiseptic stimulator. Int. J. Pharm. Res. 2020, 12. [Google Scholar] [CrossRef]
- Teshaev, S.J.; Baimuradov, R.R. Morphological parameters of testicles of 90-day-old rats in normal state and under the influence of biostimulator on the background of radiation exposure. Russ. J. Oper. Surg. Clin. Anat. (In Russian) 2020, 4, 22–26. [Google Scholar] [CrossRef]
- Aafjes, J.H.; van der Vijver, J.C.; Schenck, P.E. Value of a testicular biopsy rating for prognosis in oligozoospermia. Br. Med. J. 1978, 1, 289–290. [Google Scholar] [CrossRef] [PubMed]
- Shalini, S.; Bansal, M.P. Role of selenium in spermatogenesis: differential expression of cjun and cfos in tubular cells of mice testis. Mol. Cell. Biochem. 2006, 292, 27–38. [Google Scholar] [CrossRef] [PubMed]
- Shalini, S.; Bansal, M.P. Dietary selenium deficiency as well as excess supplementation induces multiple defects in mouse epididymal spermatozoa: understanding the role of selenium in male fertility. Int. J. Androl. 2008, 31, 438–449. [Google Scholar] [CrossRef] [PubMed]
- Alimova, N.; Khasanova, D.; Dustova, N.; Asadova, N. Morphometric and immunohistochemical reorganisation of the palatine tonsil in chronic tonsillitis and its response to combined ozone-ultrasound therapy. Front. Surg. 2026, 13, 1878051. [Google Scholar] [CrossRef] [PubMed]
Figure 1.
Seminiferous epithelium of the six-month-old rat testis, hematoxylin and eosin. (A) Control, ×400: 1, seminiferous tubule; 2, myoid cell layer; 3, spermatogonial nuclei; 4, spermatogenic epithelium; 5, spermatozoa; 6, blood vessel. (B) Magnesium-deficient, ×100: 1, thickened tunica albuginea; 2, widened tubular lumina; 3, thinned spermatogenic epithelium; 4, loosened cell layers; 5, reduced number of germ cells. (C) Iron-deficient, ×100: 1, tubular dilatation with widened lumina; 2, thinned, dystrophic epithelium; 3, reduced germ cells; 4, reduced luminal spermatozoa. (D) Selenium-deficient, ×400: 1, thickened tunica albuginea with stromal densification; 2, thinned epithelium with reduced cell density; 3, reduced germ cells; 4, widened lumen; 5, peritubular densification and early interstitial remodelling. (E) Zinc-deficient, ×40: 1, marked tubular dilatation; 2, thinned epithelium; 3, reduced germ cells with disrupted layering; 4, sharply reduced luminal spermatozoa. (F) Combined deficiency, ×100: labels as in (E). Original magnifications differ between panels, as indicated.
Figure 1.
Seminiferous epithelium of the six-month-old rat testis, hematoxylin and eosin. (A) Control, ×400: 1, seminiferous tubule; 2, myoid cell layer; 3, spermatogonial nuclei; 4, spermatogenic epithelium; 5, spermatozoa; 6, blood vessel. (B) Magnesium-deficient, ×100: 1, thickened tunica albuginea; 2, widened tubular lumina; 3, thinned spermatogenic epithelium; 4, loosened cell layers; 5, reduced number of germ cells. (C) Iron-deficient, ×100: 1, tubular dilatation with widened lumina; 2, thinned, dystrophic epithelium; 3, reduced germ cells; 4, reduced luminal spermatozoa. (D) Selenium-deficient, ×400: 1, thickened tunica albuginea with stromal densification; 2, thinned epithelium with reduced cell density; 3, reduced germ cells; 4, widened lumen; 5, peritubular densification and early interstitial remodelling. (E) Zinc-deficient, ×40: 1, marked tubular dilatation; 2, thinned epithelium; 3, reduced germ cells with disrupted layering; 4, sharply reduced luminal spermatozoa. (F) Combined deficiency, ×100: labels as in (E). Original magnifications differ between panels, as indicated.
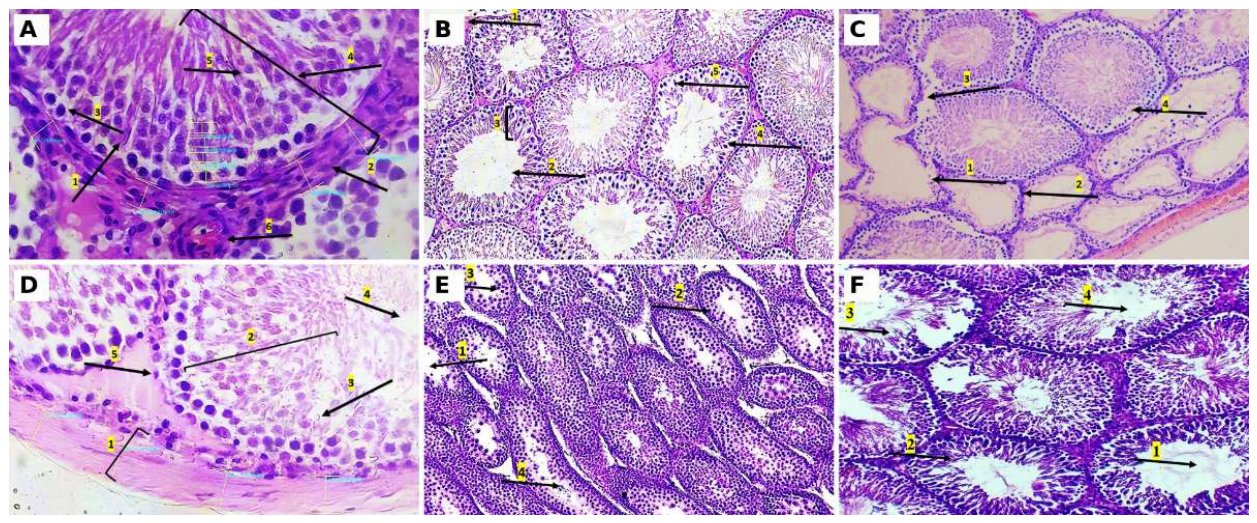
Figure 2.
Transition ratios and collagen distribution. (A) Spermatocyte-to-spermatogonia, spermatid-to-spermatocyte and spermatozoa-to-spermatid ratios by group (group means of per-animal values); the dashed line marks the control value of each ratio, and the red bars mark the single deficiency with the largest departure from control in that panel. (B–D) Van Gieson staining for collagen (red) at six months: (B) control, with collagen confined to an evenly distributed interstitium; (C) magnesium-deficient, with basement membrane thickening and uneven peritubular collagen; (D) combined deficiency, with collagen accumulation around Leydig cells.
Figure 2.
Transition ratios and collagen distribution. (A) Spermatocyte-to-spermatogonia, spermatid-to-spermatocyte and spermatozoa-to-spermatid ratios by group (group means of per-animal values); the dashed line marks the control value of each ratio, and the red bars mark the single deficiency with the largest departure from control in that panel. (B–D) Van Gieson staining for collagen (red) at six months: (B) control, with collagen confined to an evenly distributed interstitium; (C) magnesium-deficient, with basement membrane thickening and uneven peritubular collagen; (D) combined deficiency, with collagen accumulation around Leydig cells.
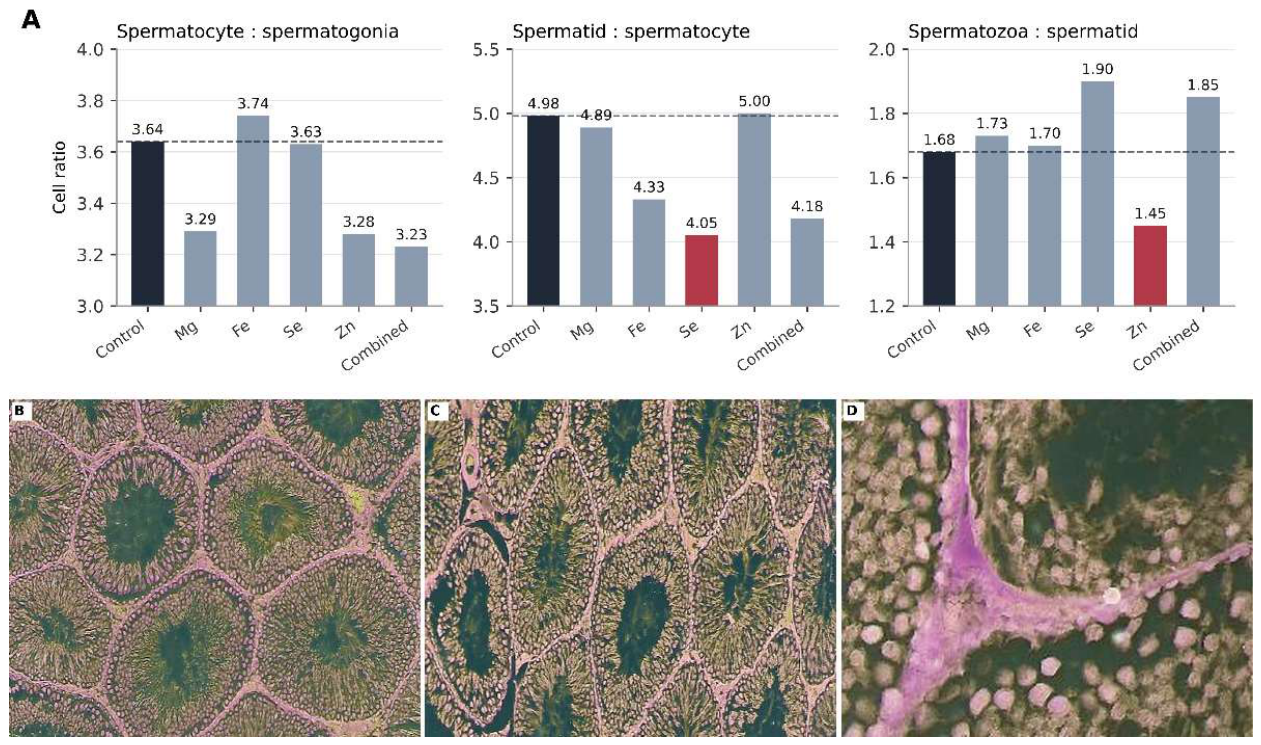

Table 1.
Certified mineral content of the experimental diets (mg/kg). The target element of each deficient diet is shown in bold.
Table 1.
Certified mineral content of the experimental diets (mg/kg). The target element of each deficient diet is shown in bold.
| Diet | Group | Mg | Fe | Zn | Se |
|---|---|---|---|---|---|
| C1000 | Control | 684 | 178.58 | 29.30 | 0.33 |
| C1035 | Mg-deficient | 54 | 180.14 | 28.60 | 0.61 |
| C1038 | Fe-deficient | 669 | 5.16 | 28.46 | 0.60 |
| C1045 | Se-deficient | 773 | 179.02 | 46.99 | 0.03 |
| C1040 | Zn-deficient | 716 | 178.61 | 2.06 | 0.53 |
| C1035 modified | Combined | 97.71 | 3.82 | 2.02 | 0.035 |
Values are from the manufacturer's batch certificate (Altromin, certificate No. 36/2024).
Table 2.
Testicular morphometry and transition ratios at six months (mean ± SEM, n = 15 per group).
| Parameter | Control | Mg | Fe | Se | Zn | Combined |
|---|---|---|---|---|---|---|
| Tunica albuginea, µm | 117.6±3.58 | 132.2±2.61b | 128.0±3.13a | 134.1±3.17b | 126.7±3.53 | 138.4±4.17c |
| Tubule profiles per field | 10.3±0.31 | 8.9±0.24b | 9.7±0.29 | 9.5±0.28 | 9.4±0.27a | 9.1±0.36a |
| Interstitial areas, % of field | 14.3±0.40 | 16.0±0.48b | 15.1±0.30 | 15.6±0.48a | 15.9±0.39b | 17.5±0.48c |
| Tubule cross-section, ×104 µm2 | 5.9±0.16 | 6.3±0.23 | 6.3±0.16 | 6.6±0.16b | 6.6±0.18b | 5.9±0.18 |
| Luminal area, ×103 µm2 | 8.4±0.23 | 10.8±0.32c | 9.7±0.36b | 9.3±0.29a | 11.2±0.27c | 10.5±0.33c |
| Epithelium area, ×104 µm2 | 4.6±0.13 | 4.0±0.12b | 4.7±0.09 | 4.4±0.09 | 4.6±0.12 | 3.9±0.11c |
| Epithelium thickness, µm | 88.8±2.74 | 78.1±2.01b | 77.2±2.48b | 70.2±2.09c | 69.2±1.69c | 58.6±2.04c |
| Sertoli cells per profile | 9.8±0.30 | 9.7±0.29 | 9.0±0.25 | 9.5±0.23 | 9.5±0.21 | 9.2±0.29 |
| Spermatogonia per profile | 13.1±0.26 | 11.4±0.31c | 12.1±0.21b | 11.5±0.39b | 12.4±0.34 | 10.5±0.32c |
| Spermatocytes per profile | 47.7±1.06 | 37.5±0.91c | 45.3±1.38 | 41.7±1.09c | 40.7±0.84c | 33.9±1.21c |
| Round spermatids per profile | 237.5±5.87 | 183.5±2.78c | 196.1±3.59c | 168.7±4.28c | 203.7±3.21c | 141.6±3.88c |
| Spermatozoa per profile | 398.6±8.85 | 316.7±7.25c | 333.2±4.55c | 320.1±7.25c | 295.5±7.54c | 261.4±9.87c |
| Interstitial area, ×105 µm2 | 4.7±0.10 | 5.5±0.15c | 5.2±0.12b | 5.3±0.19a | 5.2±0.12b | 5.6±0.20c |
| Leydig cells per 104 µm2 | 27.70±0.79 | 25.2±0.55a | 25.2±0.46a | 25.5±0.49a | 25.6±0.67 | 20.9±0.37c |
| Collagen area, % of field † | 3.7 | 5.9 | 5.2 | 6.7 | 7.2 | 9.1 |
| Johnsen score ‡ | 10 | 9.1 | 9.3 | 9.0 | 8.5 | 7.4 |
| Spermatocytes : spermatogonia ‡ | 3.64 | 3.29 | 3.74 | 3.63 | 3.28 | 3.23 |
| Spermatids : spermatocytes ‡ | 4.98 | 4.89 | 4.33 | 4.05 | 5.00 | 4.18 |
| Spermatozoa : spermatids ‡ | 1.68 | 1.73 | 1.70 | 1.90 | 1.45 | 1.85 |
a p < 0.05, b p < 0.01, c p < 0.001 versus control (Student's t-test or Mann–Whitney U-test). † Collagen fraction of one representative van Gieson field per group, quantified in QuPath; descriptive, not tested. ‡ Group means of per-animal values; not tested separately.
Disclaimer/Publisher’s Note: The statements, opinions and data contained in all publications are solely those of the individual author(s) and contributor(s) and not of MDPI and/or the editor(s). MDPI and/or the editor(s) disclaim responsibility for any injury to people or property resulting from any ideas, methods, instructions or products referred to in the content. |
© 2026 by the authors. Licensee MDPI, Basel, Switzerland. This article is an open access article distributed under the terms and conditions of the Creative Commons Attribution (CC BY) license (http://creativecommons.org/licenses/by/4.0/).
Copyright: This open access article is published under a Creative Commons CC BY 4.0 license, which permit the free download, distribution, and reuse, provided that the author and preprint are cited in any reuse.