

Submitted:
19 October 2026
Posted:
20 October 2026
You are already at the latest version
Abstract
Robot-hosted quiz games depend on the robot deciding correctly which player buzzed first. Studies of robot games rarely ask how errors in such decisions affect players. We propose the Algorithmic Precision–Motivation Relationship (APMR), a model in which the precision (correctness and timeliness) of a robot's perception shapes interaction coherence, players' appraisals of competence and trust, engagement and, ultimately, motivation. We test its central prediction in a buzzer quiz hosted by a Pepper robot. Two first-responder detectors were compared: a convolutional recurrent neural network with attention (CRNN) and a training-free frequency-domain cross-correlation (CC) method that matches Mel-spectrograms against class templates recorded in the room. Offline, the CRNN was more accurate on matched laboratory data. Under synthetic-to-real transfer, however, its accuracy fell to 0.66, against 0.91 for CC, and CC was about ten times faster (23.4 vs. 226.6 ms). Forty university students, randomly assigned to teams and conditions, then played the same quiz in a between-subjects study, 20 per detector. In live play, CC named the correct first responder in 87% of buzzer events and responded in 28 ms, against 69% and 300 ms for the CRNN. On the Intrinsic Motivation Inventory, players in the CC condition reported higher Interest/Enjoyment (d = 1.62), Effort/Importance (d = 1.90) and Perceived Competence (d = 1.07), and lower Pressure/Tension (d = 0.80). Perceived Choice did not differ (d = 0.21). The results are consistent with APMR's central prediction, although accuracy and speed differed together. Designers of robot-hosted games should treat perception reliability as a game design variable, not only as an engineering metric.
Keywords:
robot-hosted games
; social robots
; first-responder detection
; sound event detection
; cross-correlation
; intrinsic motivation
; fairness
; game-based learning
1. Introduction
Social robots increasingly host games in classrooms, museums and homes. Humanoid platforms such as Pepper act as quiz masters, tutors and game partners, and they are often reported to raise participation and enjoyment [1,2,3,4]. In these roles the robot is not only a social character. It is also the game’s referee: it senses what players do and decides what happens next.
In competitive buzzer games this referee role is unforgiving. The robot must decide, within a fraction of a second, which player pressed first. A wrong call gives a turn to the wrong team, and players notice at once. Games research shows that perceived fairness, competence and a sense of control drive player motivation [5,6]. HRI research shows that visible robot errors lower trust and change how people treat the robot [7,8,9]. Yet studies of robot-hosted games usually vary the robot’s social behaviour, appearance or feedback and assume that its perception works [1,4,10,11].
Sound event detection research has the opposite blind spot. It evaluates detectors with accuracy, latency and robustness on benchmark data [12,13,14,15]. It rarely asks what a detection error does to the person on the other side of the interaction. Deep models such as convolutional and recurrent networks reach very high accuracy on matched data but can degrade under domain shift [14,15]. Template-based cross-correlation methods need no training data and adapt through calibration, which suits structured signals such as electronic buzzers [16,17].
This paper connects the two lines of work. We compare two first-responder detectors inside the same robot-hosted buzzer quiz: a CRNN with attention and a training-free frequency-domain cross-correlation (CC) detector. Everything else in the game stays identical. We ask two questions:
- RQ1. How do the CRNN and the CC detector differ in detection accuracy and latency, offline and during live play?
- RQ2. Do players who experience the more reliable detector report higher intrinsic motivation, as the APMR model predicts?
To frame these questions, we propose the Algorithmic Precision–Motivation Relationship (APMR) model (Section 3). APMR states that reliable, timely perception is an enabling condition for the competence, trust and flow experiences on which motivation in competitive play depends. It builds on our earlier work with this robot quiz [22,23,24,25,26], which developed the detection and feedback design but did not isolate the role of the detector. Here we state the model formally and test its central prediction in a study where only the detector changes.
The paper makes four contributions:
- The APMR model, which links a robot’s perception accuracy to players’ intrinsic motivation through interaction coherence, competence and trust appraisals, and engagement.
- A matched comparison of a CRNN and a training-free frequency-domain cross-correlation detector for first-responder detection, offline and in live play.
- A between-subjects user study (N = 40) that tests APMR’s central prediction, with inferential statistics and effect sizes.
- Design implications for robot-hosted games that treat perception reliability as a game design variable.
2. Background and Related Work
2.1. Robots as Game Hosts
Robots in game-based learning have taken roles as tutors, peers and quiz hosts [1,2,3,4]. Most evaluations manipulate social or pedagogical factors: feedback modality, gestures, embodiment or the robot’s role. Our earlier work with a Pepper-hosted buzzer quiz followed the same pattern. It compared verbal-only and multimodal feedback [22,23,24], tracked multiple players by sound [25], and contrasted robot platforms [26]. These studies held the perception pipeline fixed. The present study does the reverse: it holds the game and the robot’s behaviour fixed and changes only the detector.
2.2. Motivation, Fairness and Competence in Games
Self-Determination Theory (SDT) explains intrinsic motivation through the needs for competence, autonomy and relatedness [18,19,20]. Ryan, Rigby and Przybylski showed that the same needs predict enjoyment and continued play in video games [5]. GameFlow likewise lists clear feedback and a sense of control among the conditions for player enjoyment [6]. In a buzzer quiz, a misattributed press hits these needs directly. The faster player is denied the turn, which undermines competence. The outcome feels arbitrary, which undermines the sense that one’s own actions decide the game. The Intrinsic Motivation Inventory (IMI) operationalises these constructs and has been validated in competitive settings [21].
2.3. Robot Errors and Trust
People notice robot errors quickly and adjust their trust and behaviour accordingly. Salem et al. found that a faulty robot was rated as less reliable and trustworthy [7]. Mirnig et al. showed that people react to erroneous social robots in socially meaningful ways [8]. A meta-analysis identified robot performance as the strongest predictor of trust in human–robot interaction [9]. Trust in robots also changes dynamically with experience [10]. In a competitive game, each error is public and affects a specific player, so its consequences are likely to be stronger than in a cooperative task.
2.4. Learned Versus Template-Based Sound Event Detection
Deep architectures dominate sound event detection benchmarks [12,13]. Convolutional recurrent networks combine local time–frequency features with temporal context and can model event order. Their accuracy, however, depends on how closely deployment conditions match training data. Room acoustics, microphone placement and background noise can cause marked degradation [14,15]. Inference cost is also a concern on robot hardware [14]. Template-based cross-correlation compares incoming audio with stored references [16,17]. It needs no training, its decisions are interpretable through correlation peaks, and a short recording in the target room recalibrates it. Its weakness is variable sounds that do not match a template. Electronic buzzers emit near-identical signals on every press, which makes them a good fit for templates.
3. The Algorithmic Precision–Motivation Relationship (APMR) Model
We propose APMR to explain how the accuracy of a robot’s perception reaches the player’s motivation. The model applies to time-critical, competitive interactions in which the robot rules on player actions and its errors are visible. It links five constructs in a chain (Figure 1). Table 1 defines each one and shows how this study operationalises it.
3.1. Propositions
APMR makes three propositions.
- P1. Precision enables coherence. Correct and timely perception keeps the game state consistent with what players did. Each error breaks this consistency in a way all players can see.
- P2. Coherence supports appraisals. When the robot reliably rewards the fastest player, players attribute outcomes to their own skill, which supports competence. Players also come to trust the robot as a fair referee. Repeated wrong calls do the opposite.
3.2. Boundary Conditions
APMR treats precision as an enabling condition, not a sufficient one. A perfectly accurate robot can still host a dull game, and feedback design, social presence and content also matter. The model concerns interactions where perception errors have visible consequences for a specific player. It does not claim that precision determines motivation in every interaction.
3.3. Hypotheses Tested in This Study
This study tests the overall prediction that follows from P1–P3. It does not test the intermediate links one by one.
H1.
In live play, the detector with the better offline transfer accuracy will identify the first responder more accurately.
H2.
Players who experience the more accurate detector will report more positive scores on the IMI subscales: higher Interest/Enjoyment, Perceived Competence, Effort/Importance and Perceived Choice, and lower Pressure/Tension. In this study the more accurate detector was also the faster one, so H2 concerns precision in APMR’s sense (correctness and timeliness together).
4. System and Detection Methods
4.1. The Robot-Hosted Buzzer Quiz
A Pepper robot hosts a team quiz (Figure 2 and Figure 3). Pepper reads each multiple-choice question aloud and shows the options on its chest tablet. Teams press physical electronic buzzers, each with a distinct sound. A single USB microphone captures the room audio. The detector decides which team pressed first, or whether the presses tied. Pepper announces that team, listens to its spoken answer through its speech recogniser, and gives feedback with speech, gestures, sounds and a scoreboard on the tablet. The detector runs in the Sound Interaction Framework (SIF) on an external workstation and sends its decision to Pepper over WebSocket. Only the detector module differs between the two study conditions.
4.2. Detection Task
The detector solves a three-way decision for each pair of competing buzzers: A first, B first or tie. A tie covers presses that overlap so closely that their order cannot be told apart; both teams are then invited to answer. Audio is sampled at 22.05 kHz, 16-bit, mono. All signals are trimmed of silence and z-score normalised before feature extraction. Mel-spectrograms use 128 Mel bands, a 512-sample window and a 256-sample hop (about 11.6 ms per frame). Both detectors take the same Mel-spectrogram input.
4.3. CRNN with Attention
The learned detector is a convolutional recurrent neural network with temporal attention. Its input is a normalised Mel-spectrogram of 128 × 107 (Mel bands × frames). Two convolutional blocks (32 and 64 filters, 3 × 3 kernels, ReLU, 2 × 2 max-pooling) extract local time–frequency features. The output is reshaped into 26 time steps and projected to 64 dimensions by a time-distributed dense layer. An LSTM with 64 units models temporal context. A dense scoring layer assigns an attention weight to each LSTM output, and the weighted sum forms a context vector. Two dense layers (64 and 32 units, with dropout) and a softmax output give the three class probabilities. The network has 189,380 trainable parameters. It was trained with Adam (learning rate 0.001), categorical cross-entropy, batch size 16 and up to 50 epochs with early stopping on validation accuracy.
The CRNN was trained on laboratory recordings: 600 single presses of four buzzer types (150 each), recorded at 1–2 m and five angles in a 35 m2 room with everyday background sound. Overlapping examples were built by mixing pairs at offsets of 0, 0.05, 0.1, 0.2, 0.3, 0.4 and 0.5 s (1,950 mixtures in total). The trained model was deployed in the study rooms without retraining. This mirrors how a learned detector is typically shipped with a game.
4.4. Frequency-Domain Cross-Correlation Detector
The CC detector needs no training. Before each session, the operator records one reference template per output class in the room: team A pressing first, team B pressing first, and both teams pressing together. This takes about a minute.
Let S (f, n) be the z-scored Mel-spectrogram of the incoming segment and Tk (f, n) the template of class k, with f the Mel band and n the frame. The correlation is computed along time only, summing over Mel bands:
The class score is the peak over lags, scaled to the range 0–1 by a reference value:
Rref is the peak score of a clean template matched against itself in the calibration recordings. The predicted class is the one with the highest scaled score. If no score exceeds the threshold θ = 0.78 (a raw score of 7,000), the segment is rejected as silence or noise. The order of the presses is carried by the templates themselves: the A-first and B-first templates differ in which buzzer’s spectral pattern starts first, and the correlation selects the closer match. Figure 4 shows one decision, and Table 2 gives example scores.
4.5. Offline Benchmark
Before the user study, we benchmarked both detectors on the laboratory dataset (Section 4.3) on a workstation with an Intel Core i7 (12th gen), 32 GB RAM and an NVIDIA RTX 3060. Accuracies are means of five runs. Latency covers waveform loading, feature extraction, normalisation and prediction. For generalisation, models were trained on synthetic mixtures and tested on real recordings with naturally varying delays (synthetic → real), or trained and tested on real recordings (real → real).

Table 3.
Offline benchmark of the two detectors. Best value per row in bold.
| Measure | CRNN + attention | Cross-correlation |
| Accuracy, single presses (%) | 99.8 | 97.5 |
| Accuracy, near-simultaneous presses, 0.05–0.5 s (%) | 98.6 | 90.7 |
| Accuracy, simultaneous presses / tie (%) | 55.5 | 81.9 |
| Overall mean accuracy (%) | 84.4 | 90.0 |
| Synthetic → real accuracy | 0.66 | 0.91 |
| Real → real accuracy | 0.98 | 0.95 |
| Single presses with Gaussian noise, 5–25 dB SNR | 0.25–0.30 | ≈ 0.97 |
| Overlapping presses with Gaussian noise, 5–25 dB SNR | 0.70–0.76 | 0.64–0.70 |
| Mean end-to-end latency (ms) | 226.6 | 23.4 |
| 95th-percentile latency (ms) | 362.9 | 45.6 |
| Training data needed | 1,950+ labelled clips | One reference recording per class |
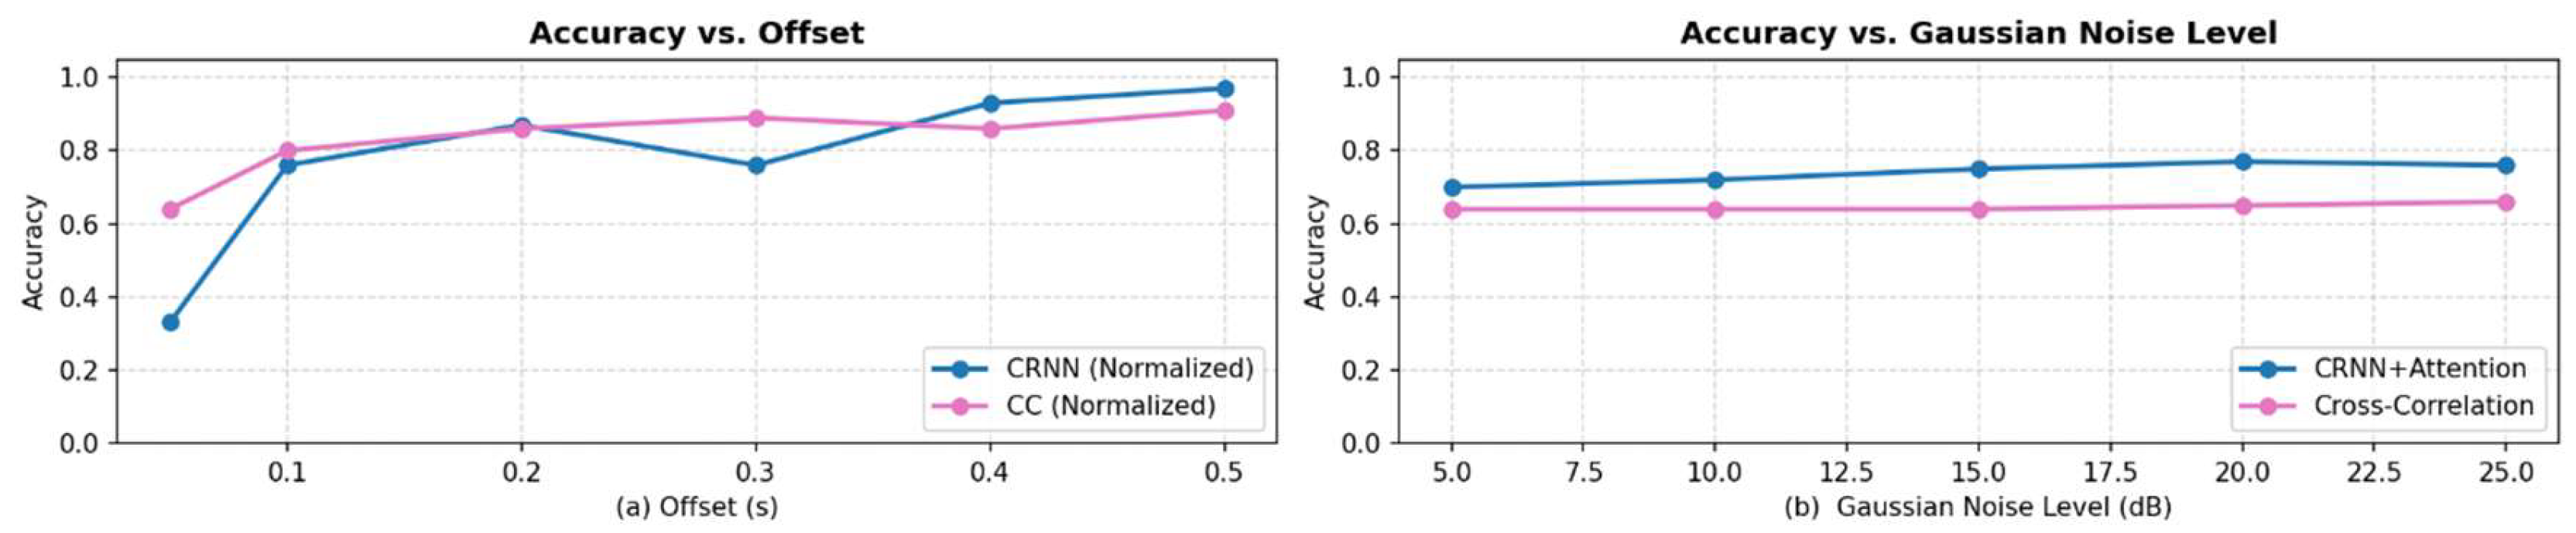
The two detectors have opposite profiles. On matched data the CRNN is as accurate or better, except for ties. Under domain shift it loses a third of its accuracy, while CC holds at 0.91. CC is also about ten times faster, which matters for a game where players expect the robot to react at once. The CRNN keeps an advantage for overlapping presses in heavy noise. The user study tests which profile serves players better in a real room.
Figure 5.
Offline behaviour of the two detectors. (a) Accuracy for near-simultaneous presses as a function of the offset between presses (0.05–0.5 s). (b) Accuracy under additive Gaussian noise (5–25 dB SNR), for single and overlapping presses.
Figure 5.
Offline behaviour of the two detectors. (a) Accuracy for near-simultaneous presses as a function of the offset between presses (0.05–0.5 s). (b) Accuracy under additive Gaussian noise (5–25 dB SNR), for single and overlapping presses.
5. User Study Method
5.1. Design
The study used a between-subjects design with one factor, the detector (CRNN vs. CC). Questions, scoring rules, robot dialogue, gestures, sounds, tablet interface, room layout and session length were identical in both conditions. Both detectors were the versions described in Section 4, without changes. Participants were randomly assigned to teams, and teams to conditions. The four sessions ran one after another in the alternating order CRNN, CC, CRNN, CC.
5.2. Participants
Forty adult university students at the Berliner Hochschule für Technik (BHT) took part voluntarily, 20 per condition. To keep participation anonymous, no personal or demographic data were collected. No participant took part in both conditions. Participation did not affect course grades.
5.3. Procedure
Participants were randomly assigned to teams of five, giving eight teams, four per condition. Two teams of the same condition played against each other in each session, giving two sessions per condition. The four sessions ran in the alternating order CRNN, CC, CRNN, CC. Each session began with an explanation of the rules and a practice round. Pepper then ran the quiz autonomously: it read questions, detected the first responder, checked answers, updated scores and gave feedback. After the session, each participant completed the questionnaire individually, before a debriefing.
5.4. Measures
The system logged every detector decision with a timestamp. Detection accuracy is the share of buzzer events where the announced first responder (or tie) matched ground truth. Latency is the time from the buzzer press to Pepper’s announcement of the first responder. We used five IMI subscales [21]: Interest/Enjoyment, Perceived Competence, Effort/Importance, Perceived Choice and Pressure/Tension. Items were rated on a 5-point Likert scale. Pressure/Tension was reverse-scored, so higher values mean more positive experience on every subscale.
5.5. Analysis
We compared the conditions on each subscale with Welch’s t-test, which does not assume equal variances. Effect sizes are Cohen’s d with pooled standard deviation and approximate 95% confidence intervals. To control the familywise error rate across five subscales, p-values were Holm-adjusted. The significance level was α = .05. Participants played in teams within two sessions per condition (alternating in time), so responses within a session may not be independent. With only two sessions per condition, a multilevel model with session as a random effect cannot be estimated reliably. We therefore report the session structure as a limitation.
5.6. Ethics
The study took place at Berliner Hochschule für Technik (BHT). Under BHT’s institutional rules, anonymous, non-invasive questionnaire studies with adult participants do not require formal approval by an ethics committee. No personal data were collected. Questionnaires were anonymous and held no names, contact details or demographic information. Participants were adults and taking part was voluntary and anonymous. Completing the questionnaire was taken as consent.
6. Results
6.1. Detection Performance in Live Play
During play, CC identified the first responder correctly in 87% of buzzer events, against 69% for the CRNN (Table 4). The CRNN’s live accuracy is close to its synthetic → real accuracy in the offline benchmark (0.66). This suggests that the gap mainly reflects domain shift between the laboratory and the study rooms. CC’s live accuracy (87%) is somewhat below its offline transfer result (91%).
Live response latency also differed (Table 4): 300 ms for the CRNN and 28 ms for CC. Both values lie close to the offline end-to-end latencies (226.6 and 23.4 ms, Table 3), so the detectors’ own computation accounts for most of the delay and the rest of the pipeline adds little. A press was therefore answered after about a third of a second in the CRNN condition and almost at once in the CC condition. Players in the two conditions thus experienced two differences: how often the robot named the right team, and how quickly it did so.
6.2. Intrinsic Motivation
Players in the CC condition scored higher on four of the five IMI subscales (Table 5). The largest effects were for Effort/Importance (d = 1.90) and Interest/Enjoyment (d = 1.62). Perceived Competence (d = 1.07) and reversed Pressure/Tension (d = 0.80) also differed significantly after Holm correction. Perceived Choice did not differ (d = 0.21, p = .51).
Figure 6.
IMI subscale means with 95% confidence intervals for the CRNN and CC conditions (n = 20 each; Pressure/Tension reverse-scored). Asterisks mark Holm-adjusted significant differences.
Figure 6.
IMI subscale means with 95% confidence intervals for the CRNN and CC conditions (n = 20 each; Pressure/Tension reverse-scored). Asterisks mark Holm-adjusted significant differences.
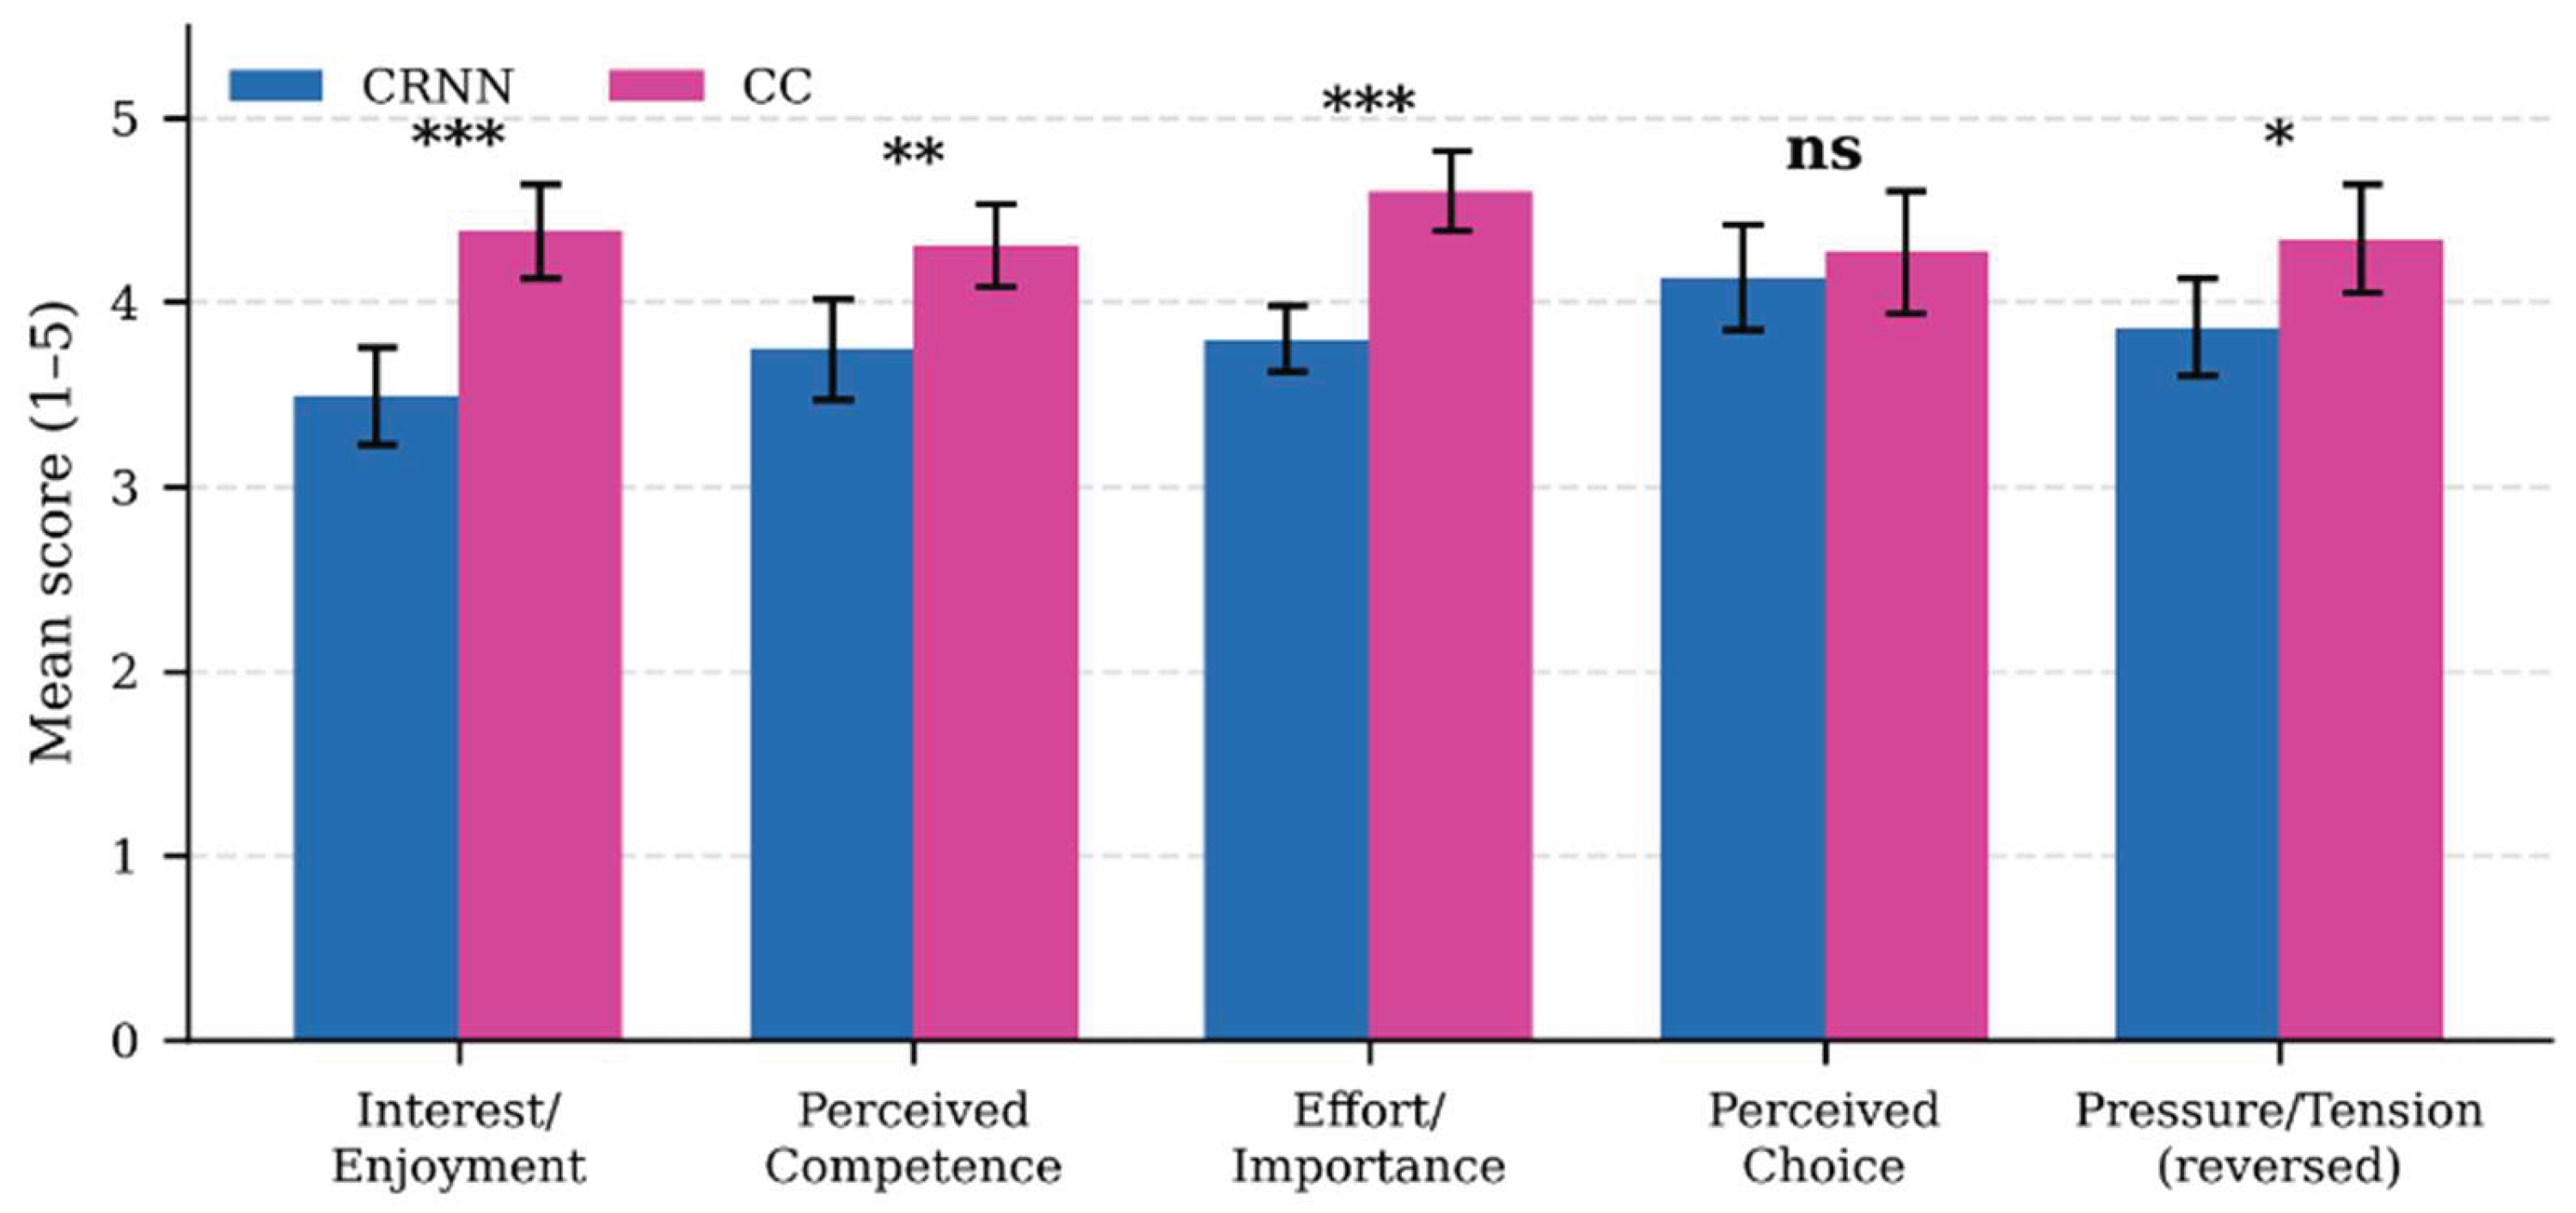
The pattern of effects is uneven. The subscales tied to the game’s outcome (enjoyment, competence and effort) moved most. Perceived Choice concerns freedom in how to take part, and it did not move. This fits the expectation that a misattributed press hurts the experience of being rewarded for one’s own speed, not the sense of being free to join.
7. Discussion
7.1. Detection Reliability Shaped the Player Experience
The game, robot and questions were identical, yet players in the two conditions reported clearly different experiences. Players could perceive two differences between the detectors: how often the robot named the right team (87% against 69% of presses) and how fast it answered (28 ms against 300 ms). The two differ in the same direction, so this study cannot say how much each contributed. The motivation differences point to detection reliability in the sense used by APMR, correctness and timeliness together. Accuracy is the more likely driver of the competence and fairness effects: a wrong call takes a turn away from a specific team, whereas a delay of about a third of a second affects every call equally. This remains an interpretation, because the design does not separate the two. In the CRNN condition, almost one press in three went to the wrong team or produced a wrong tie. Over a whole session, that means repeated public mistakes, each one costing a specific team its turn.
The effects sit where SDT and games research predict. Competence suffers when a player who was faster is not rewarded [5,18]. Enjoyment and effort suffer when the game seems arbitrary, because effort no longer decides the result [6]. Pressure rises when players cannot predict how the referee will rule. Perceived Choice concerns the freedom to take part. The detector does not touch that freedom, and the score did not change. This selective pattern makes a general novelty or mood effect a less likely explanation than a specific effect of fairness.
7.2. Implications for the APMR Model
The results support both hypotheses where they matter most for APMR. H1 holds: the detector with better transfer accuracy offline was also more accurate in play. H2 holds for four of five subscales. It fails for Perceived Choice, and this failure is informative. APMR locates the effect of precision in competence, trust and engagement (Table 1). Choice concerns the freedom to take part, which the detector does not touch. The pattern therefore fits the model’s mechanism better than a general halo effect would. The study tests only the overall link in Figure 1. Because the more accurate detector was also the faster one, the test concerns precision as APMR defines it, correctness and timeliness together, and not accuracy alone. Perceived fairness and trust were not measured, and accuracy was measured per condition, not per player. A stronger test would log each player’s experienced error rate, measure fairness and trust directly, and test the mediating links of the chain.
7.3. Design Implications for Robot-Hosted Games
- Treat referee accuracy as a design variable. Where a robot rules on player actions, its error rate belongs in the game design specification, with a target and a test, like any game mechanic.
- Evaluate detectors in the target room. The CRNN looked best on matched laboratory data and worst in play. Offline benchmark accuracy on matched data is a poor guide to the player experience. Transfer accuracy (synthetic → real) predicted live performance much better.
- Prefer calibratable methods for structured signals. When the game controls the sound source, as with buzzers, a template method with a one-minute calibration can beat a learned model that cannot adapt on site. It also explains its decisions through correlation peaks, which helps when players dispute a call.
- Design for disputed calls. Even CC erred on about one press in eight. Games can soften errors through visible replay of the detected order, a tie rule, or a host line that acknowledges uncertainty.
7.4. Limitations
The sample was small: 40 students from one university, in two sessions per condition. Players within a session interacted, so their answers are not fully independent, and the effective sample size is smaller than 40. The effect sizes are large, but their confidence intervals are wide. No demographic data were collected to protect anonymity. We therefore cannot describe the sample by age, gender or prior robot experience, or check that the groups were balanced on these. Participants were randomly assigned to teams and conditions, and the sessions alternated between conditions (CRNN, CC, CRNN, CC) to spread time effects. The order was fixed rather than randomised, and each session ran at its own time, so session-level differences cannot be fully excluded. The two detectors also differed in both accuracy and response time (300 vs. 28 ms), so the study cannot attribute the motivational effects to accuracy alone. The CRNN was deployed without on-site adaptation. A fine-tuned or domain-adapted network might close part of the gap, but would require collecting labelled data in each room. The study measured motivation once, after one session, and only by self-report. Perceived fairness and trust were not measured directly. Finally, the task is narrow: buzzers produce near-identical sounds, which favours template matching. Results may not transfer to variable sounds such as speech or claps.
8. Conclusion
A robot that hosts a competitive game is also its referee, and players feel its mistakes. In a Pepper-hosted buzzer quiz, replacing a laboratory-trained CRNN with a training-free cross-correlation pipeline raised live first-responder accuracy from 69% to 87% and cut response time from 300 to 28 ms. Players with the more reliable detector reported more enjoyment, effort and competence and less pressure, while perceived choice stayed the same. The detector that looked strongest on matched laboratory data was the weaker referee in the room. For designers of robot-hosted games, perception reliability is part of the game experience and should be designed and tested as such. Future work should manipulate accuracy and latency independently, measure perceived fairness and trust directly, log errors per player, include more sessions and settings, and test domain-adapted learned detectors.
References
- Belpaeme, T., Kennedy, J., Ramachandran, A., Scassellati, B., & Tanaka, F. (2018). Social robots for education: A review. Science Robotics, 3(21), eaat5954. [CrossRef]
- Tekerek, M., Beyazaslan, Z., Aydemir, H., & Gök, M. (2026). A systematic literature review and mapping of human–robot interaction in educational contexts. Humanities and Social Sciences Communications, 13, 336. [CrossRef]
- Mubin, O., Stevens, C. J., Shahid, S., Al Mahmud, A., & Dong, J.-J. (2013). A review of the applicability of robots in education. Technology for Education and Learning, 1, 1–7. [CrossRef]
- Nasir, J., Bruno, B., & Dillenbourg, P. (2024). Social robots as skilled ignorant peers for supporting learning. Frontiers in Robotics and AI, 11, 1385780. [CrossRef]
- Ryan, R. M., Rigby, C. S., & Przybylski, A. (2006). The motivational pull of video games: A self-determination theory approach. Motivation and Emotion, 30(4), 344–360. [CrossRef]
- Sweetser, P., & Wyeth, P. (2005). GameFlow: A model for evaluating player enjoyment in games. Computers in Entertainment, 3(3), Article 3. [CrossRef]
- Salem, M., Lakatos, G., Amirabdollahian, F., & Dautenhahn, K. (2015). Would you trust a (faulty) robot? Effects of error, task type and personality on human–robot cooperation and trust. In Proceedings of the 10th ACM/IEEE International Conference on Human–Robot Interaction (pp. 141–148). [CrossRef]
- Mirnig, N., Stollnberger, G., Miksch, M., Stadler, S., Giuliani, M., & Tscheligi, M. (2017). To err is robot: How humans assess and act toward an erroneous social robot. Frontiers in Robotics and AI, 4, 21. [CrossRef]
- Hancock, P. A., Billings, D. R., Schaefer, K. E., Chen, J. Y. C., de Visser, E. J., & Parasuraman, R. (2011). A meta-analysis of factors affecting trust in human–robot interaction. Human Factors, 53(5), 517–527. [CrossRef]
- Alhaji, B., Büttner, S., Sanjay Kumar, S., & Prilla, M. (2025). Trust dynamics in human interaction with an industrial robot. Behaviour & Information Technology, 44(2), 266–288. [CrossRef]
- Tozadore, D. C., & Romero, R. A. F. (2024). Multiuser design of an architecture for social robots in education: Teachers, students, and researchers perspectives. Frontiers in Robotics and AI, 11, 1409671. [CrossRef]
- Virtanen, T., Plumbley, M. D., & Ellis, D. (Eds.). (2018). Computational analysis of sound scenes and events. Springer. [CrossRef]
- Chu, H.-C., Zhang, Y.-L., & Chiang, H.-C. (2023). A CNN sound classification mechanism using data augmentation. Sensors, 23(15), 6972. [CrossRef]
- Mohaimenuzzaman, M., Bergmeir, C., West, I., & Meyer, B. (2023). Environmental sound classification on the edge: A pipeline for deep acoustic networks on extremely resource-constrained devices. Pattern Recognition, 133, 109025. [CrossRef]
- Nogueira, A. F. R., Oliveira, H. S., Machado, J. J. M., & Tavares, J. M. R. S. (2022). Sound classification and processing of urban environments: A systematic literature review. Sensors, 22(22), 8608. [CrossRef]
- Hajihashemi, V., Gharahbagh, A. A., Machado, J. J. M., & Tavares, J. M. R. S. (2024). Audio event detection based on cross correlation in selected frequency bands of spectrogram. In Information Systems and Technologies (WorldCIST 2023), Lecture Notes in Networks and Systems (Vol. 802). Springer. [CrossRef]
- Plenkers, K., Ritter, J. R. R., & Schindler, M. (2013). Low signal-to-noise event detection based on waveform stacking and cross-correlation: Application to a stimulation experiment. Journal of Seismology, 17, 27–49. [CrossRef]
- Ryan, R. M., & Deci, E. L. (2000). Self-determination theory and the facilitation of intrinsic motivation, social development, and well-being. American Psychologist, 55(1), 68–78. [CrossRef]
- Ryan, R. M., & Deci, E. L. (2020). Intrinsic and extrinsic motivation from a self-determination theory perspective: Definitions, theory, practices, and future directions. Contemporary Educational Psychology, 61, 101860. [CrossRef]
- Ryan, R. M. (1982). Control and information in the intrapersonal sphere: An extension of cognitive evaluation theory. Journal of Personality and Social Psychology, 43(3), 450–461. [CrossRef]
- McAuley, E., Duncan, T., & Tammen, V. V. (1989). Psychometric properties of the Intrinsic Motivation Inventory in a competitive sport setting: A confirmatory factor analysis. Research Quarterly for Exercise and Sport, 60(1), 48–58. [CrossRef]
- Tutul, R., Buchem, I., & Pinkwart, N. (2025). Design and evaluation of a sound-driven robot quiz system with fair first-responder detection and gamified multimodal feedback. Robotics, 14(9), 123. [CrossRef]
- Tutul, R., Buchem, I., Jakob, A., & Pinkwart, N. (2026). Evaluating intrinsic motivation in robot-supported quiz-based learning: A comparative study of verbal-only and multimodal feedback with sound input. Acta Informatica Pragensia, 15(1), 109–125. [CrossRef]
- Tutul, R., Buchem, I., Jakob, A., & Pinkwart, N. (2025). Technology acceptance in university robot-supported quiz-based learning: Verbal-only versus multimodal feedback with sound input. IEEE Access, 14, 956–965. [CrossRef]
- Buchem, I., Tutul, R., Jakob, A., & Pinkwart, N. (2023). Non-verbal sound detection by humanoid educational robots in game-based learning: Multiple-talker tracking in a buzzer quiz game with the Pepper robot. In Robotics in Education (RiE 2023), Lecture Notes in Networks and Systems (Vol. 747). Springer. [CrossRef]
- Buchem, I., Bonga, G. A. K., & Tutul, R. (2024). From screens to AI-driven human–robot interaction: Comparing students’ perceptions of the robots Pepper and Furhat for ChatGPT-based exam preparation. In Robotics in Education (RiE 2024), Lecture Notes in Networks and Systems (Vol. 1084). Springer. [CrossRef]
Figure 1.
The Algorithmic Precision–Motivation Relationship (APMR) model. Solid arrow: the overall link from algorithmic precision to motivation tested in this study. Dashed arrows: proposed intermediate links grounded in theory and not measured here.
Figure 1.
The Algorithmic Precision–Motivation Relationship (APMR) model. Solid arrow: the overall link from algorithmic precision to motivation tested in this study. Dashed arrows: proposed intermediate links grounded in theory and not measured here.

Figure 2.
Architecture of the robot-hosted quiz: buzzers, microphone, detector (CRNN or CC), quiz manager and Pepper’s multimodal feedback.
Figure 2.
Architecture of the robot-hosted quiz: buzzers, microphone, detector (CRNN or CC), quiz manager and Pepper’s multimodal feedback.
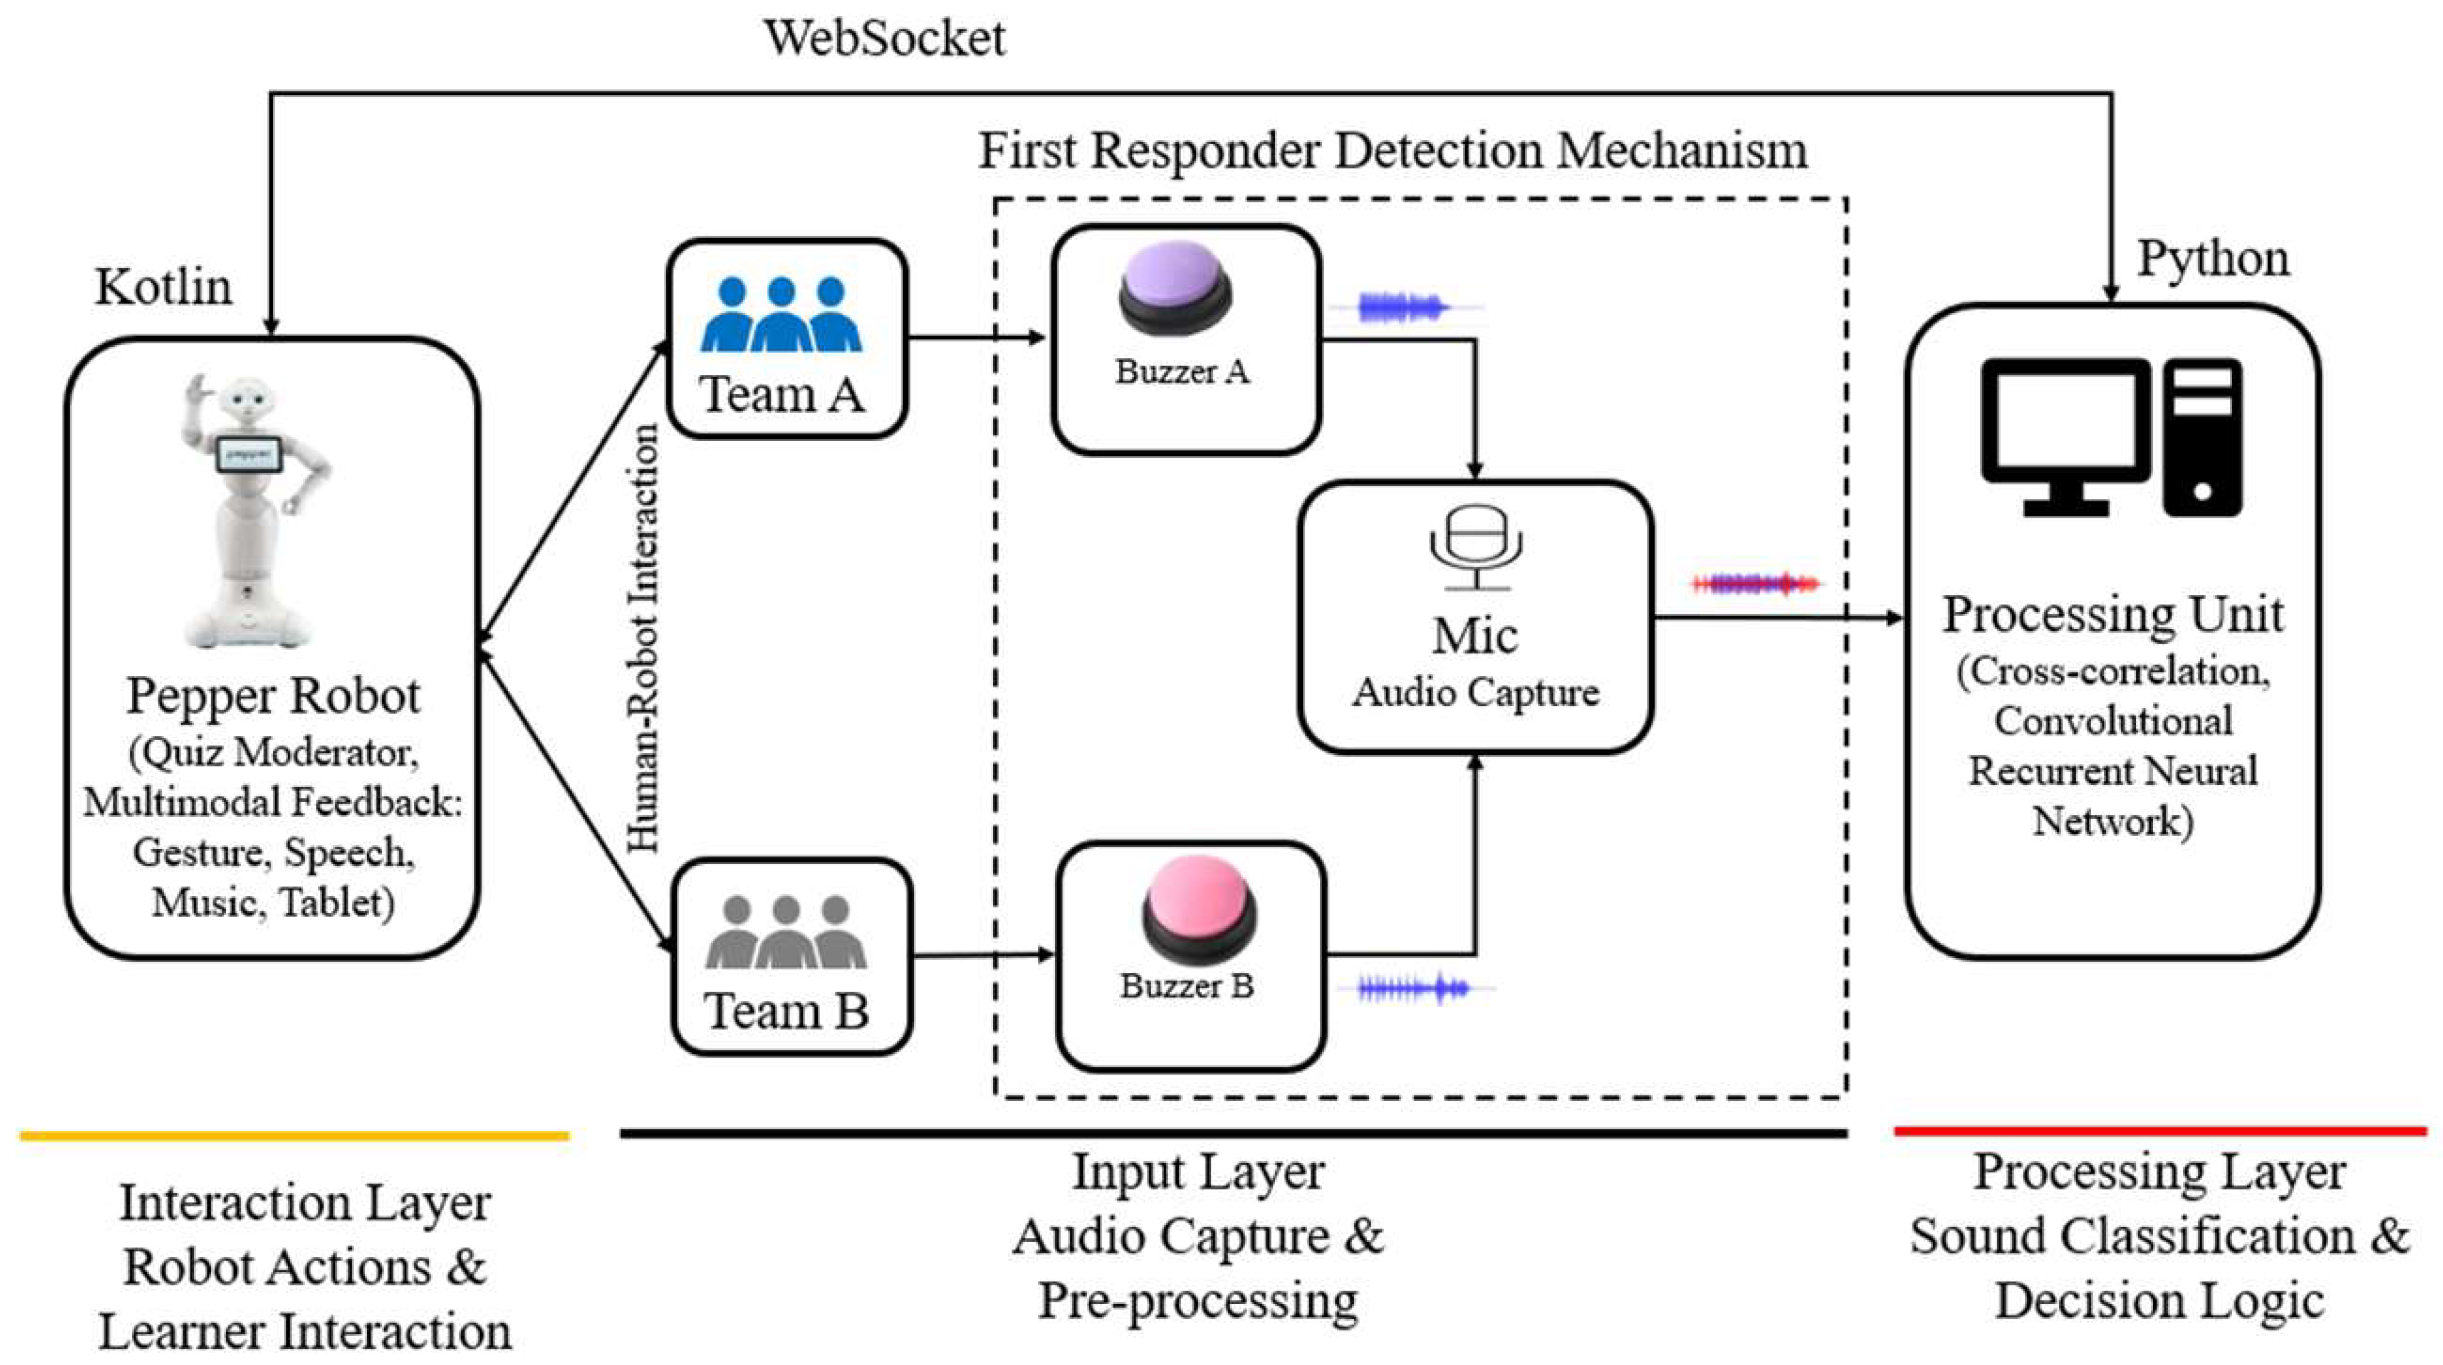
Figure 3.
The quiz setting. Teams at their tables with buzzers; the microphone and Pepper face the teams, and questions are projected and shown on Pepper’s tablet.
Figure 3.
The quiz setting. Teams at their tables with buzzers; the microphone and Pepper face the teams, and questions are projected and shown on Pepper’s tablet.
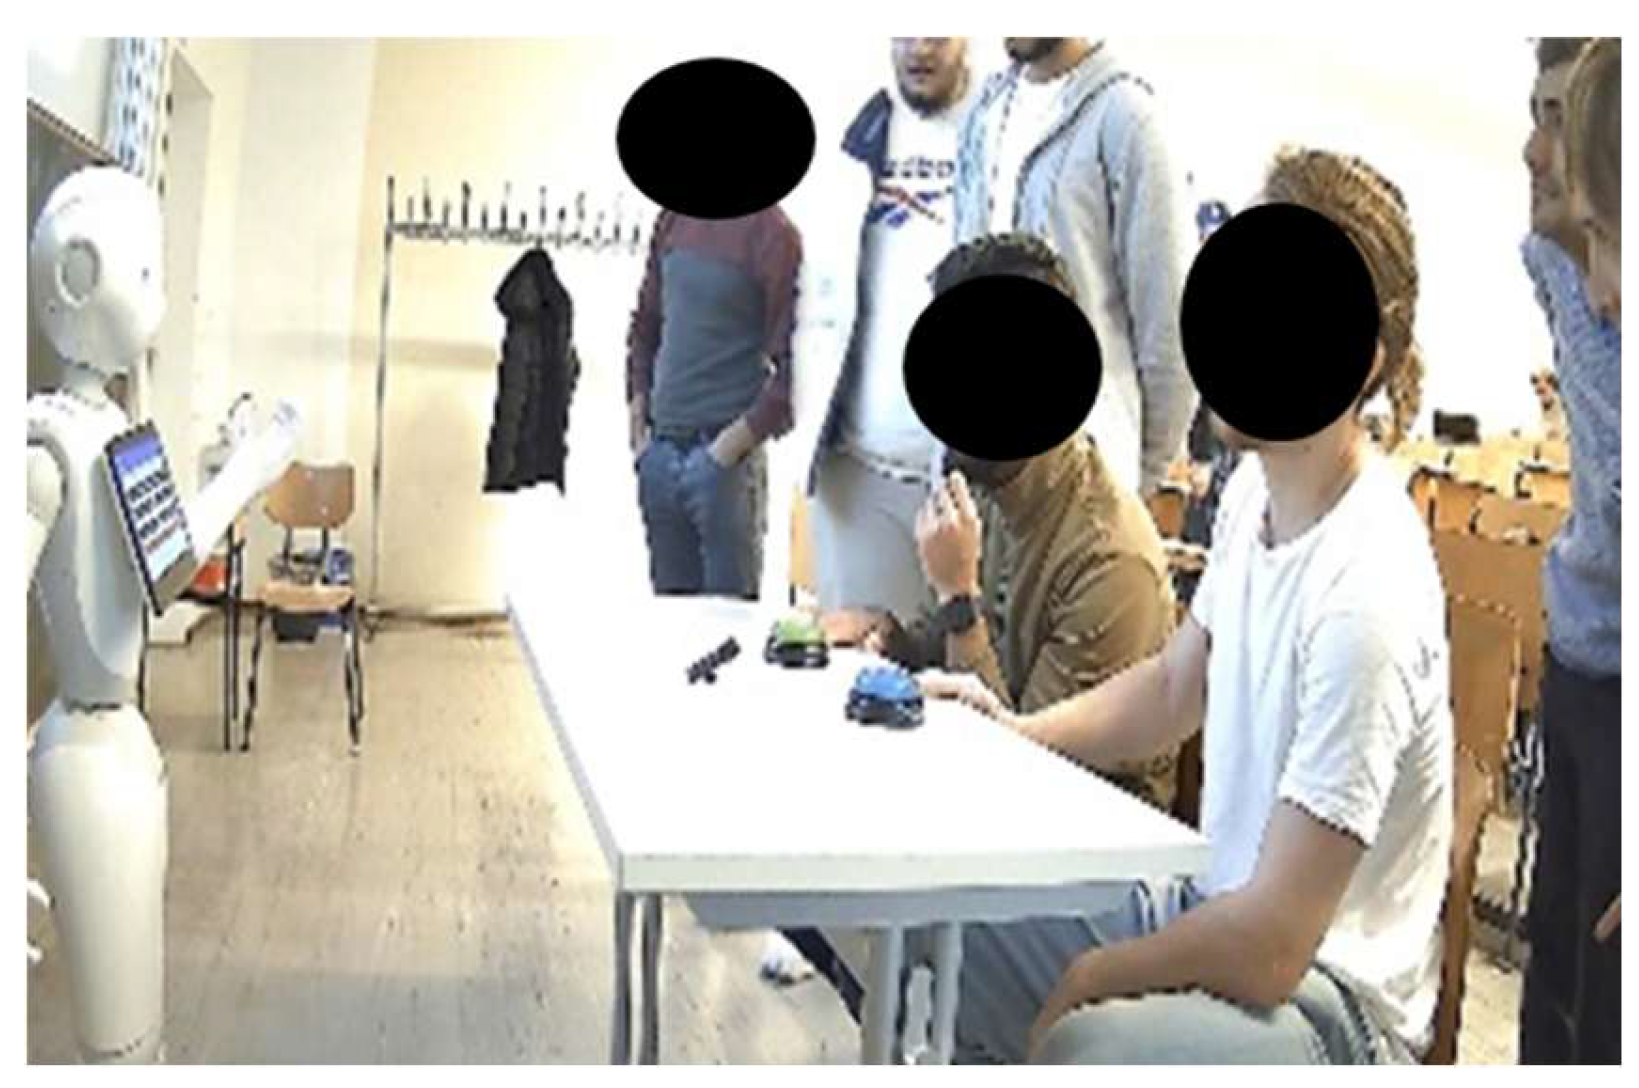
Figure 4.
Cross-correlation decision. The input waveform is converted to a Mel-spectrogram and correlated with the Team A-first, Tie and Team B-first templates. The highest scaled score (Team B first, 8009) decides the first responder; the other scores are 6119 (tie) and 5814 (Team A first).
Figure 4.
Cross-correlation decision. The input waveform is converted to a Mel-spectrogram and correlated with the Team A-first, Tie and Team B-first templates. The highest scaled score (Team B first, 8009) decides the first responder; the other scores are 6119 (tie) and 5814 (Team A first).
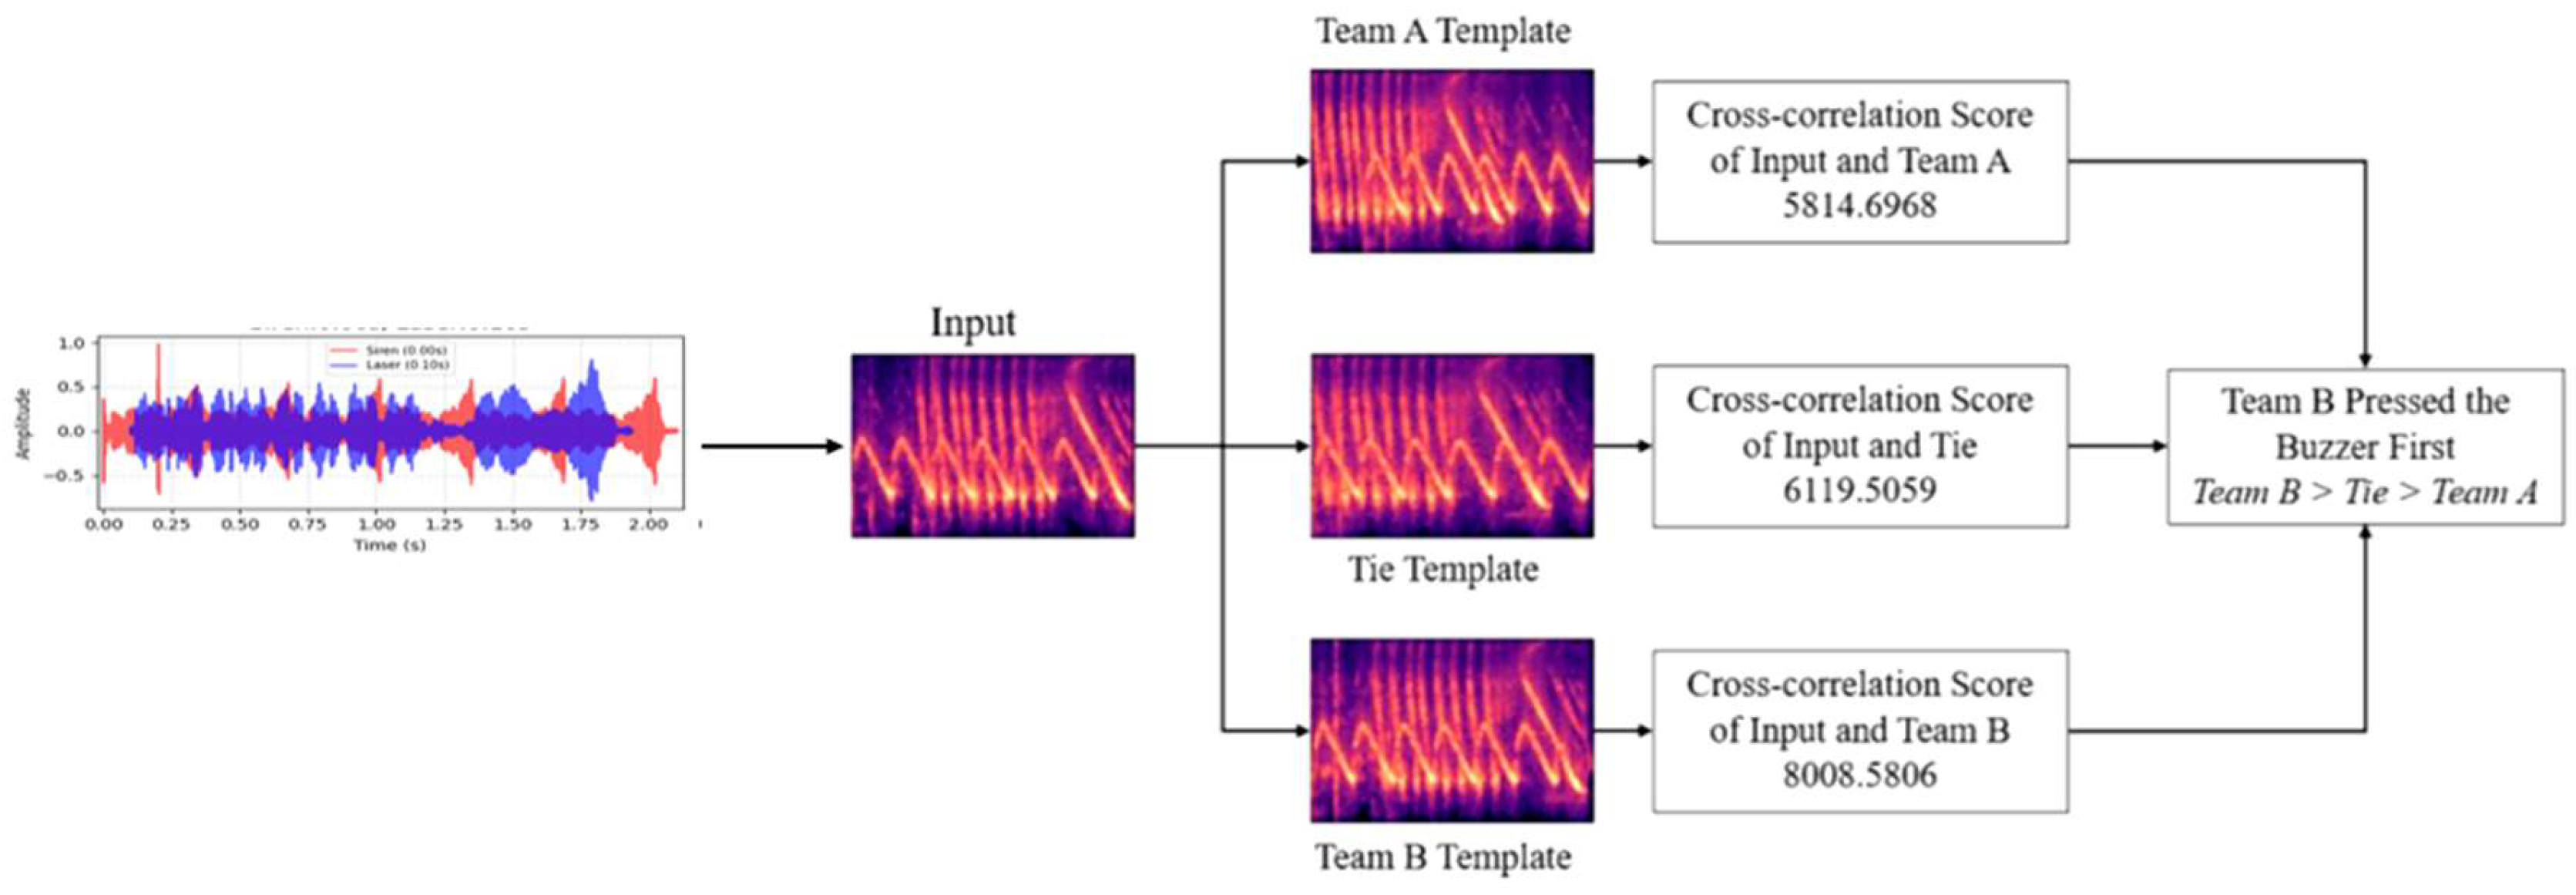
Table 1.
APMR constructs, their theoretical basis and how they are operationalised in this study.
| Construct | Definition | Theoretical basis | Operationalised here |
| Algorithmic precision | Correctness and timeliness of the robot’s perceptual decisions | Trust in automation [9] | Detector (CRNN vs. CC); live first-responder accuracy and latency |
| Interaction synchrony and temporal coherence | Robot responses match player actions, in the right order and without unexplained delay | Responsiveness; GameFlow feedback [6] | Not measured; implied by accuracy |
| Psychological appraisals | Players’ sense of competence (“my speed counts”) and trust in the robot as a fair referee | SDT competence need [18,19]; trust [7,8,9] | IMI Perceived Competence |
| Flow-like engagement | Absorbed, effortful play without disruptive tension | Flow and GameFlow [6] | IMI Effort/Importance, Pressure/Tension |
| Motivation and engagement | Intrinsic motivation for the activity | SDT [18,19,20]; games [5] | IMI Interest/Enjoyment |
Table 2.
Example scores for three overlapping test segments at 0.3 s offset. Raw correlation peaks are shown; the scaled score is the raw score divided by R_ref = 9000. Team A and Team B correspond to the laser and siren buzzers. The highest score in each row is the prediction, and all three predictions are correct.
Table 2.
Example scores for three overlapping test segments at 0.3 s offset. Raw correlation peaks are shown; the scaled score is the raw score divided by R_ref = 9000. Team A and Team B correspond to the laser and siren buzzers. The highest score in each row is the prediction, and all three predictions are correct.
| True class | Score: Team A first | Score: Team B first | Score: tie |
| Team A first | 7,611 | 5,696 | 6,591 |
| Team B first | 5,669 | 8,719 | 6,203 |
| Tie | 6,324 | 5,956 | 8,561 |
Table 4.
Detector performance during the study sessions.
| Measure | CRNN + attention | Cross-correlation |
| First-responder accuracy (%) | 69 | 87 |
| Response latency, press to announcement (ms) | 300 | 28 |
| Training before deployment | Offline, laboratory data | None |
| Calibration before session | None | One reference recording per class (about 1 min) |
Table 5.
IMI subscale scores by condition (n = 20 per group; 5-point scale). Pressure/Tension is reverse-scored, so higher values mean less pressure. Welch’s t-tests; p-values Holm-adjusted across five subscales.
Table 5.
IMI subscale scores by condition (n = 20 per group; 5-point scale). Pressure/Tension is reverse-scored, so higher values mean less pressure. Welch’s t-tests; p-values Holm-adjusted across five subscales.
| Subscale | CRNN M (SD) | CC M (SD) | t (df) | p (Holm) | d [95% CI] |
| Interest/Enjoyment | 3.49 (0.56) | 4.38 (0.54) | 5.12 (37.9) | < .001 | 1.62 [0.90, 2.33] |
| Perceived Competence | 3.74 (0.58) | 4.31 (0.48) | 3.39 (36.7) | .005 | 1.07 [0.41, 1.73] |
| Effort/Importance | 3.80 (0.38) | 4.60 (0.46) | 6.00 (36.7) | < .001 | 1.90 [1.15, 2.64] |
| Perceived Choice | 4.13 (0.61) | 4.27 (0.71) | 0.67 (37.2) | .508 | 0.21 [−0.41, 0.83] |
| Pressure/Tension (reversed) | 3.86 (0.57) | 4.34 (0.63) | 2.53 (37.6) | .032 | 0.80 [0.15, 1.44] |
Disclaimer/Publisher’s Note: The statements, opinions and data contained in all publications are solely those of the individual author(s) and contributor(s) and not of MDPI and/or the editor(s). MDPI and/or the editor(s) disclaim responsibility for any injury to people or property resulting from any ideas, methods, instructions or products referred to in the content. |
© 2026 by the authors. Licensee MDPI, Basel, Switzerland. This article is an open access article distributed under the terms and conditions of the Creative Commons Attribution (CC BY) license (http://creativecommons.org/licenses/by/4.0/).
Copyright: This open access article is published under a Creative Commons CC BY 4.0 license, which permit the free download, distribution, and reuse, provided that the author and preprint are cited in any reuse.