

Submitted:
20 October 2026
Posted:
22 October 2026
Read the latest preprint version here
Abstract
Background. Knowledge-graph models can rank existing drugs for a disease, but their benchmarks mostly reward rediscovering known treatments, and their scores rarely come with evidence a researcher can check. We built OREVID, an open tool that shows a ranked candidate only when an evidence line supports it and reports how often each line was right on held-out data, and compared it with TxGNN on identical data. Methods. The graph combines PrimeKG, Open Targets, STRING and PubTator3 (157,822 nodes, 9.46 million edges). For each disease, 22 degree-weighted metapath features feed a LightGBM LambdaRank model trained with masked neighbourhoods. A candidate is shown only if it is indicated for an ontology-neighbour disease or for a disease sharing at least 3 associated genes (hypergeometric p < 10⁻⁵ over the genes with at least one associated disease). The acceptance criteria for these rules were set in advance; the rules were revised on the hidden-treatment benchmarks and then measured on an external set of approvals not used to choose them. TxGNN was retrained with its official code on the same PrimeKG splits, and all tasks and predictions are released as OREVID-bench. Results. Zero-shot Recall@100 (mean ± SD over five splits) was 0.811 ± 0.042 for OREVID, 0.412 ± 0.042 for TxGNN and 0.358 ± 0.040 for a popularity baseline, with OREVID ahead on every split (paired difference with TxGNN 0.399, 95% CI 0.352–0.443, resampling diseases). On nine disease areas held out it was 0.617 against 0.237, ahead in all nine, although TxGNN had the higher AUPRC in five. Training OREVID without validation labels and excluding diseases where TxGNN outputs constant scores gave 0.809 against 0.421. On 3,718 approvals absent from PrimeKG, Recall@100 was 0.359 against 0.121 (0.367 ± 0.008 against 0.126 ± 0.004 over five training splits), and 0.178 against 0.085 for the 2,719 approvals not obvious from the disease ontology; a logistic regression without the drug-popularity feature and a model without any Open Targets feature (0.348) performed similarly. Of the candidates the website's rules select in this external exam, 12.6% (95% CI 9.8–15.6%, resampling diseases) of direct extensions and 4.3% (3.1–5.6%) of shared-genes candidates were among the unseen approvals, against about 0.07% by chance; random gene sets of the same size selected candidates that were right as often, so the shared genes are not evidence of a shared mechanism. A drug acting on a disease gene, with no other evidence, was right 1.8–3.4% of the time, no better than candidates with no evidence line at all. With the graph and the model rebuilt as known in 2015, the uses that later reached phase 3 or approval had a Recall@100 of 0.322 against 0.174 for popularity (paired difference 0.148, 95% CI 0.123–0.173), a pre-registered test. Conclusions. Reporting the hit rate of each evidence line makes repurposing predictions checkable and shows how low their precision is on approved uses missing from the training graph. Most of the signal comes from the ranking and from what already works in related diseases, not from the specific genes they share. OREVID is a hypothesis generator, not a clinical tool; code, data and benchmark are public (https://orevid.org, doi:10.5281/zenodo.23323226).
Keywords:
drug repurposing
; knowledge graph
; learning to rank
; benchmark
; evidence
; TxGNN
; PrimeKG
Introduction
Repurposing approved or investigational drugs for new diseases can shorten development, because safety and manufacturing are already known [1]. Computational approaches rank candidate drug–disease pairs from heterogeneous biomedical data; knowledge graphs that link drugs, genes, diseases and phenotypes are a common substrate, from metapath-based models such as Project Rephetio [2] to graph neural networks such as TxGNN, trained on the PrimeKG graph [3,4].
Other families of methods have been applied to the same task. Knowledge-graph embeddings such as TransE, ComplEx and RotatE [5,6,7] score triples from learned vectors, but on biomedical graphs their predictions are biased towards high-degree nodes, which favours well-studied drugs [8]. DREAMwalk extends guilt-by-association with random walks across several layers of a biomedical graph [9], and KGML-xDTD combines graph learning with paths found by reinforcement learning that explain each prediction [10]. The ranking model used here is closest to Rephetio's degree-weighted path counts [2]; it differs in training a ranking objective under masked disease neighbourhoods, and in deciding what to display from evidence lines whose hit rates are reported.
Two problems limit how much such predictions can be trusted. First, standard evaluations hide some known indications and check whether the model recovers them. This rewards rediscovery: many held-out diseases have a near-identical neighbour in the ontology with the same drugs, and drugs with many indications score well everywhere. Second, most tools return a score per pair without the evidence behind it, and without saying how often that kind of evidence turns out to be right.
OREVID addresses both. It ranks drugs with an interpretable metapath model, but shows a candidate only when one of a few evidence lines supports it, and reports each line's hit rate on held-out splits and on an external set of approvals that was not used to choose the rules. We report the usual hidden-treatment tests next to this stricter external exam, and we reran TxGNN with its official code on the same data so that the comparison is direct. Tasks, predictions and code are released as a public benchmark, OREVID-bench.
Methods
Figure 1.
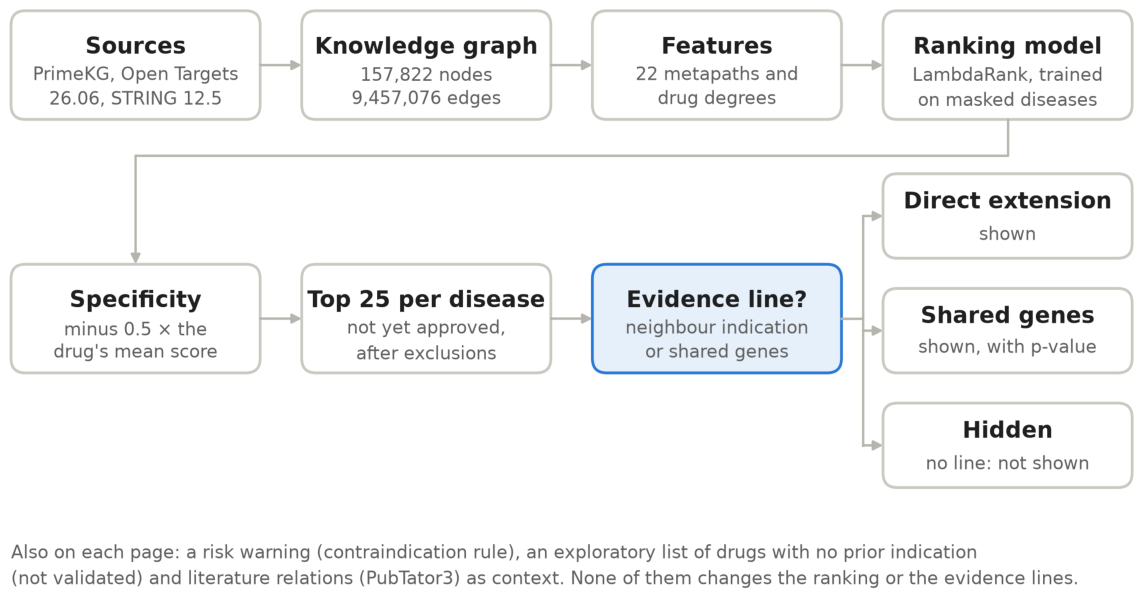
From the sources to a disease page. The model ranks every drug; only the 25 highest-ranked candidates not yet approved are considered, and each is shown only if one of two evidence lines supports it.
Figure 1.
From the sources to a disease page. The model ranks every drug; only the 25 highest-ranked candidates not yet approved are considered, and each is shown only if one of two evidence lines supports it.
Knowledge Graph
The graph merges PrimeKG [4] (Harvard Dataverse, doi:10.7910/DVN/IXA7BM), which aggregates DrugBank [11], SIDER [12], DisGeNET [13], MONDO [14] and other sources, with Open Targets Platform release 26.06 [15] (drug mechanisms with direction from ChEMBL [16], clinical stage and year per drug–disease pair, trials stopped for efficacy or safety, gene–disease evidence by type) and STRING 12.5 [17] (interactions with confidence ≥ 700). The result has 157,822 nodes and 9,457,076 undirected edges. Relations mined from the literature with PubTator3 [18] are shown to users as context but never enter features or evaluation, because «drug treats disease» is the answer being predicted. Release 26.06 of Open Targets was used because in 26.09 multiple sclerosis was merged into a measurement term; the issue was reported upstream. Supplementary Table S1 lists which relations are model features and which are only displayed.
Features and Ranking Model
For each disease, 22 metapath scores are computed for every drug (Supplementary Table S2), for example drug targets a disease gene, drug is indicated for a disease sharing genes or drug is indicated for an ontology neighbour. Paths are counted on degree-normalised adjacency matrices (D⁻⁰·⁵ M D⁻⁰·⁵), so that hub nodes weigh less, as in degree-weighted path counts [2]. The drug's number of indications in the training graph (popularity) and its degrees in five other relations (targets, side effects, drug interactions, contraindications and off-label uses) are added as features. Apart from the training indications, contraindications and off-label uses, no drug–disease relation enters the features: trials, literature-mined relations and Open Targets clinical evidence are excluded, because an equivalent but unmapped disease could carry the answer into the graph.
A LightGBM LambdaRank model [19,20] (300 trees, learning rate 0.05, 31 leaves, at least 50 rows per leaf, L2 regularisation 1) learns to order drugs within each disease from 1,500 training diseases (all positives, 10% of negatives). To train under test-like conditions, five additional rounds each pick 40 seed diseases, hide their neighbourhoods (diseases up to two ontology steps away or with a gene-set Jaccard similarity ≥ 0.5; neighbourhoods of more than 400 diseases are skipped) and add those diseases as training groups. Test diseases never enter training. For display, scores are standardised per disease and reduced by 0.5 times the drug's mean standardised score over 2,000 reference diseases, which removes drugs that rank high everywhere at a cost of about 0.01 in Recall@100. For comparison, a class-balanced logistic regression on the same metapath features, without the popularity feature, was trained on the same rows; it also ranks the exploratory list described below.
Evidence Rules
Of the 25 highest-ranked candidates that are not already approved for the disease, a candidate is shown only if it is indicated for an ontology-neighbour disease («direct extension») or for a disease sharing at least 3 associated genes with a hypergeometric p < 10⁻⁵, the population being the 19,735 genes with at least one associated disease («shared genes»). Every other candidate is hidden. An earlier version also counted the diseases in that population, which made p-values too small; when this was corrected, the threshold was re-matched from 10⁻⁶ to 10⁻⁵ to keep the validated selection (97% agreement on the benchmark and areas; on the external exam 4.3% against 4.2% of candidates correct, with 4% fewer candidates), and all figures here use the corrected test. The acceptance criteria were fixed in advance: an evidence line had to separate correct from incorrect candidates on both the zero-shot benchmark (seeds 1–5) and the nine held-out disease areas, and a filter was applied only if the subset it removed had a hit rate below 5% in both. The rules themselves were revised in three rounds, each evaluated on both datasets, so the areas are not an untouched confirmation set. The external exam was used only as a confirmation set, together with the other splits, for two design decisions (the weight of the specificity correction and the removal of one data source, CTD), and never to choose an evidence rule. Neither decision moved the external result much: with CTD kept, as before the external set was consulted, OREVID's Recall@100 there was 0.352 instead of 0.359 (TxGNN 0.121), and the specificity correction is not applied to the benchmark rankings. A proposed grading of the shown candidates into three levels did not replicate (the first two levels swapped order on the hard area subset, and the third did not reach the threshold) and was dropped. Two filters suggested by an AI agent acting as reviewer (see Use of AI), requiring the drug's target to touch the shared genes and excluding anti-infectives in non-infectious diseases, failed the criterion and were not applied. Whether at least 3 of the shared genes are specific (associated with fewer than 100 diseases) is displayed but not used as a filter: as a filter it failed the same criterion (the subset it would remove was right 9–11% of the time).
Pages also show, under a separate heading, an exploratory list of up to 8 drugs with no recorded indication that act on a disease gene and carry no risk warning, ranked by the model without popularity. Such drugs cannot have either evidence line, and the list is not validated: for correct drugs with no other indication, Precision@K was 0–2% for the models tested (see Novelty).
Candidates are also excluded when the same active moiety is approved under another form (salts, esters, prodrugs, enantiomers), when the drug is contraindicated for the disease, or when it is a diagnostic agent or approved only for veterinary use. Open Targets approvals count as approved only when at least one drug label or regulatory report of approval names a single drug and spells out the disease (not a 1–3 letter abbreviation); the rest are displayed as unconfirmed. Subtypes defined by the absence of a biomarker (16 curated rows: oestrogen and progesterone receptors and HER2 in breast cancer, the BCR-ABL1 fusion, ALK; inherited by the more specific forms) exclude drugs acting on the absent marker: endocrine therapy (ATC L02 except anti-androgens, or drugs targeting ESR1, ESR2 or CYP19A1 that are not cytotoxics) without the oestrogen receptor, and drugs targeting PGR, ERBB2, ABL1 or ALK without those. None of the pairs this removes is an approved indication; a manual check of every removed pair corrected two wrong flags (enzalutamide and estramustine) before the rule was adopted.
A risk warning is a transparent rule, not a model: the drug is contraindicated in more neighbouring or similar diseases than it is indicated for, or it is an immune checkpoint blocker in an autoimmune disease. On already-labelled pairs, 97.4% of those flagged by the first rule are contraindications, against a base rate of 76.7%. This was measured in sample, on pairs that already carry a label. For the 9.7% of pairs in which the drug has no label in any related disease, which is the usual situation of a new candidate, the rule gives no signal.
Benchmark and Evaluation
OREVID-bench reproduces TxGNN's zero-shot («complex disease») split exactly for five seeds (64–71 test diseases each, 335 in total), whose test diseases lose all their drug–disease edges, and nine disease-area splits built from TxGNN's area lists with a fixed seed (345 test diseases). Metrics follow TxGNN's evaluation notebook. AUPRC uses, for each disease, as many negatives as positives, sampled with replacement (seed 42) among drugs with at least one training indication. Recall@100 and Precision@K (K = the number of correct drugs) are computed over all 7,957 drugs, with ties broken at random; with 20 other tie-breaking seeds every reported mean moved by at most 0.014, and OREVID's not at all. A «hard» subset excludes test diseases whose ontology neighbours within two steps already carry at least half of their drugs; this 50% threshold was set by hand. Novelty scenarios restrict candidates to approved drugs, remove the 10% of drugs with most indications, or keep only correct drugs with no other indication. Single-metapath baselines rank drugs by one metapath alone.
TxGNN was retrained with its official code and the hyperparameters of its reproduction script on each split; its zero-shot Recall@100 (0.412) is close to the published value (0.405). To measure the two protocol differences instead of only stating them, OREVID was also trained with training labels only (TxGNN uses validation labels only for early stopping), and metrics were recomputed without the test diseases for which TxGNN outputs the same score for every drug.
The external exam uses 3,718 drug–disease pairs in 645 diseases that are approved according to Open Targets 26.06 but absent from PrimeKG; models are trained on the first zero-shot split, and drugs already related to the disease in PrimeKG are not candidates. A pair is «non-obvious» when PrimeKG does not record the drug as indicated for any disease up to two ontology steps away (2,719 pairs in 563 diseases), and «recent» when its first trial is from 2018 or later (158 pairs in 99 diseases). Hit rates by evidence line are measured among the 25 highest-ranked candidates per disease, with specificity computed over each split's test diseases and without the website's exclusions. On the external exam they were also computed with the website's exact rules (specificity over 2,000 reference diseases of the training graph, and exclusion of other forms of an approved active moiety and of contraindicated, diagnostic and veterinary drugs; Open Targets approvals are not excluded here because they are the answer); both versions agree within their intervals (Supplementary Table S3).
Temporal validation. To test the prediction of later uses, the graph was rebuilt as it was known at a cutoff year: PrimeKG drug–disease edges whose first trial in Open Targets started at or after the cutoff, and Open Targets gene–disease associations first reported after it, were removed, and the model, the popularity baseline and the logistic regression were retrained on that graph. Positives were drug–disease pairs whose first trial started at or after the cutoff and that reached phase 3 or approval by Open Targets 26.06, excluding pairs already linked in the cutoff graph. The 2012 cutoff was used for development and 2015 for confirmation. The decision rule (claim an advantage only if the paired OREVID − popularity difference in Recall@100 at 2015 had a 95% interval excluding 0) and the secondary analyses were registered before running (docs/IMPROVEMENT_PLAN.md).
Statistical Analysis and Software
Zero-shot results are given as mean ± standard deviation over the five seeds, with the paired difference between models per seed. Disease-area results are means over the nine areas; because areas range from 2 to 180 test diseases, means weighted by disease are also given. Confidence intervals for Recall@100 and for differences between models come from a bootstrap that resamples whole diseases (10,000 resamples, within seeds for zero-shot and within areas for the disease areas), so the correct drugs of one disease are never counted as independent. Differences are paired by disease and were also tested with a Wilcoxon signed-rank test on the per-disease differences, Holm-adjusted over 28 comparisons (Supplementary Table S4). Hit rates have 95% intervals from the same disease-level bootstrap. To test whether the shared genes themselves carry information, a permutation test replaced the gene set of every disease with a random set of the same size, drawing genes in proportion to their number of associated diseases, and recomputed the shared-genes section 100 times with the ranking and the drugs' indications unchanged; the criterion fixed in advance required the observed hit rate on the external exam to exceed the 99th percentile of this null. The comparisons of OREVID with TxGNN and with the popularity baseline on Recall@100 are the primary analysis; subsets, novelty scenarios, single metapaths and hit rates by evidence line are exploratory and were not corrected for multiple comparisons. The external exam was repeated with the models trained on each of the five zero-shot splits to estimate its variability between training seeds.
OREVID uses Python 3.12.4, LightGBM 4.7.0, scikit-learn 1.9.1, NumPy 2.4.6, SciPy 1.18.0 and pandas 3.0.3. TxGNN ran in its own environment (Python 3.10, PyTorch 1.13.1 with CUDA 11.6, DGL 0.9.1). Training OREVID's predictor takes about 1 minute on a CPU and all OREVID evaluations about 35 minutes; TxGNN took about 95 minutes per split on one RTX 3060 GPU, about 22 hours for the 14 splits. AI assistance (Claude, Anthropic) was used to write and review code, to support the data analysis and for language editing; the reviews by AI agents and how their suggestions were checked are described under Use of AI in the Declarations. Figure 1, Figure 2, Figure 3 and Figure 4 are drawn with matplotlib by the script evaluation/figures.py in the repository, which reads the result files (benchmark/predictions/*/results.json and docs/EVIDENCE_CI.md), so every plotted number comes from those files.
Results
Comparison with TxGNN
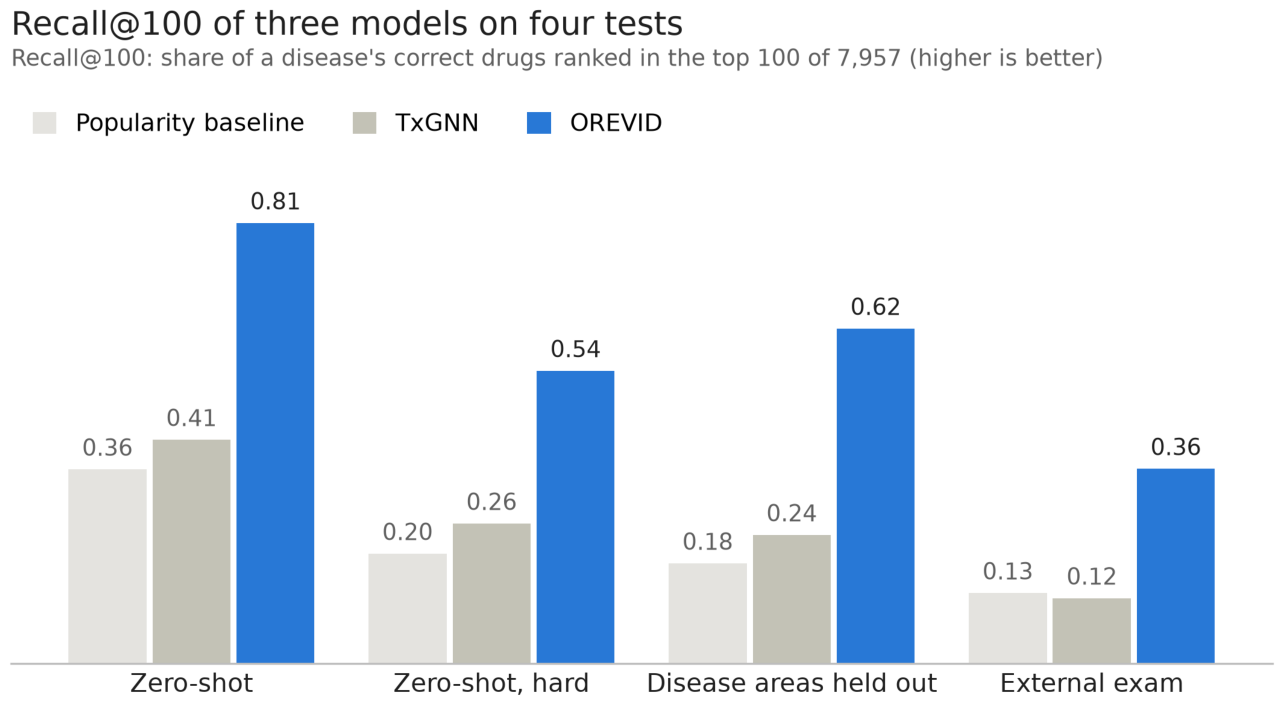
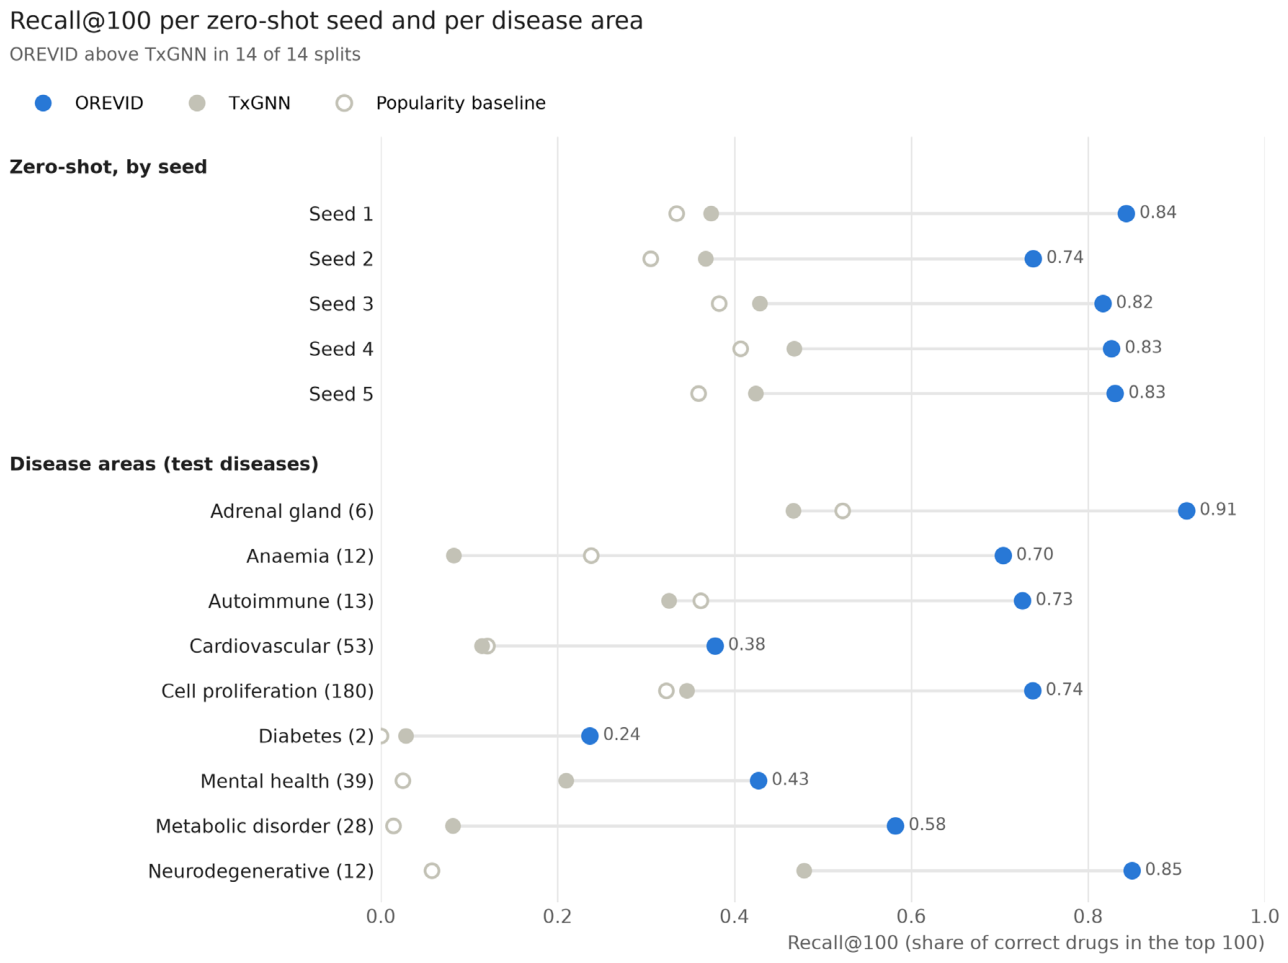
OREVID recovered two to three times as many held-out treatments as TxGNN in every test (Figure 2, Table 1). Resampling whole diseases, the 95% interval of the paired difference in Recall@100 was +0.35 to +0.44 on zero-shot, +0.31 to +0.45 on the areas and +0.21 to +0.27 on the external exam; OREVID was ahead on 63% of zero-shot diseases and behind on 2%, the rest being ties (Supplementary Table S4). On the zero-shot split, Recall@100 was 0.811 ± 0.042 against 0.412 ± 0.042, and OREVID was ahead on each of the five seeds (paired differences 0.36–0.47; on the hard subset 0.539 ± 0.090 against 0.258 ± 0.067, differences 0.21–0.43). On the disease areas it was ahead in all nine (Figure 3, Table 2): 0.617 against 0.237 as a mean of areas, and 0.637 against 0.269 weighted by disease; on the hard area diseases TxGNN (0.141) did no better than the popularity baseline (0.141). Precision@K showed the same pattern (zero-shot 0.573 against 0.079; areas 0.408 against 0.057). AUPRC under TxGNN's protocol, which sets each correct drug against one sampled negative, was closer: 0.952 ± 0.009 against 0.910 ± 0.036 on zero-shot and 0.897 against 0.866 on the areas, and TxGNN had the higher AUPRC in five of the nine areas. TxGNN separates correct drugs from random ones almost as well; OREVID's advantage is in ranking them high among all 7,957 drugs. The popularity baseline, which ignores the disease, reached 0.358 ± 0.040 on zero-shot, slightly below TxGNN, and 0.130 on the external exam, slightly above it (0.121). Per disease, the difference between TxGNN and this baseline was not significant after Holm adjustment in any test except all area diseases (p = 0.047).
Figure 2.
Recall@100 of the popularity baseline, TxGNN and OREVID on four tests. Zero-shot: mean of five seeds; areas: mean of nine areas; external exam: first training split (over five splits, OREVID 0.367 ± 0.008, TxGNN 0.126 ± 0.004).
Figure 2.
Recall@100 of the popularity baseline, TxGNN and OREVID on four tests. Zero-shot: mean of five seeds; areas: mean of nine areas; external exam: first training split (over five splits, OREVID 0.367 ± 0.008, TxGNN 0.126 ± 0.004).
Two further comparisons show where the advantage comes from (Table 1). A logistic regression on the same metapath features without the popularity feature reached 0.781 ± 0.044 on zero-shot and 0.591 on the areas, and on the external exam it matched the full model (0.364 against 0.359; non-obvious pairs 0.193 against 0.178). It changes the learner as well as the feature, so it is not a single-factor ablation, but it shows that the gain over TxGNN does not depend on the popularity feature. Single metapaths alone were weaker (numbers refer to Supplementary Table S2): indication in an ontology neighbour (#6) reached 0.382 on zero-shot and 0.169 on the areas, in a disease up to two ontology steps away (#14) 0.461 and 0.254, and in a disease sharing associated genes (#22) 0.565 and 0.508; a drug whose target, enzyme or transporter is a disease gene (#2) reached 0.093 and 0.117, below the popularity baseline. On the 158 recent approvals (first trial in 2018 or later), Recall@100 was 0.355 for OREVID, 0.119 for TxGNN and 0.097 for the popularity baseline. Open Targets supplies part of the gene–disease features as well as the external labels, but removing every Open Targets feature (PrimeKG genes and targets plus STRING) changed Recall@100 little: 0.802 ± 0.048 on zero-shot, 0.628 on the areas and 0.348 on the external exam (0.351 with PrimeKG alone). A knowledge-graph embedding baseline, RotatE [7] (the best of TransE, ComplEx and RotatE in a pre-registered grid on zero-shot seed 1), reached 0.289 ± 0.058 on zero-shot, below the popularity baseline, 0.219 on the areas and 0.156 on the external exam, where it was above TxGNN (non-obvious approvals 0.127 against 0.085). An ensemble of OREVID and RotatE, chosen on two seeds, did not improve the confirmation tests (seeds 3–5 and the areas).
Removing the two protocol differences did not change the conclusion. Validation labels changed OREVID's Recall@100 by −0.005 to +0.027 depending on the subset (+0.008 on all zero-shot diseases, −0.002 on the areas). Excluding the few diseases where TxGNN gives every drug the same score (8 of 335 zero-shot, 3 of 345 in areas) raised both models slightly. With both differences removed, Recall@100 was 0.809 against 0.421 on zero-shot, 0.528 against 0.275 on its hard subset and 0.627 against 0.238 on the areas.
Figure 3.
Recall@100 of the three models on each zero-shot seed and each disease area. The line joins TxGNN and OREVID on the same split.
Figure 3.
Recall@100 of the three models on each zero-shot seed and each disease area. The line joins TxGNN and OREVID on the same split.
Novelty
In the zero-shot split, the advantage held when candidates were restricted to approved drugs (322 diseases; Recall@100 0.846 against 0.601) and when the 10% of drugs with most indications were removed (242 diseases; 0.742 against 0.289); the disease areas showed the same pattern (0.76 against 0.51, and 0.60 against 0.22). For correct drugs with no other indication, every model did poorly. Only 47 zero-shot diseases have such drugs: on them Recall@100 was 0.167 for OREVID and 0.144 for TxGNN, and Precision@K 0.003 and 0.028; on 127 area diseases, Recall@100 was 0.15 and 0.08. With so few diseases these comparisons are uncertain, and this is the regime where neither approach is useful.
Hit Rates by Evidence Line
Among each disease's 25 highest-ranked candidates, the evidence lines separated correct from incorrect candidates in the same direction on the benchmark, on the area splits and on the external exam (Figure 4; numbers in Supplementary Table S3). A drug acting on a disease-associated gene, with no other line, was correct 1.8–3.4% of the time, no better than candidates with no evidence line at all (1.4–2.4%); shared genes with a disease that has many associated genes, where the overlap did not reach the significance threshold, were correct 0–2.5% of the time. When at least 3 shared genes were specific, shared-genes candidates were correct 30–33% of the time in hidden-treatment tests and 4.8% (95% CI 3.3–6.5%) in the external exam, against 9–11% and 2.8% (1.6–4.2%) otherwise.
Figure 4.
Percentage of candidates that were correct among the 25 highest-ranked per disease, by the section the website's rules assign them to. Benchmark: zero-shot seeds 1–5; areas: nine disease areas; external exam: Open Targets approvals absent from PrimeKG. 95% intervals from a bootstrap that resamples whole diseases.
Figure 4.
Percentage of candidates that were correct among the 25 highest-ranked per disease, by the section the website's rules assign them to. Benchmark: zero-shot seeds 1–5; areas: nine disease areas; external exam: Open Targets approvals absent from PrimeKG. 95% intervals from a bootstrap that resamples whole diseases.
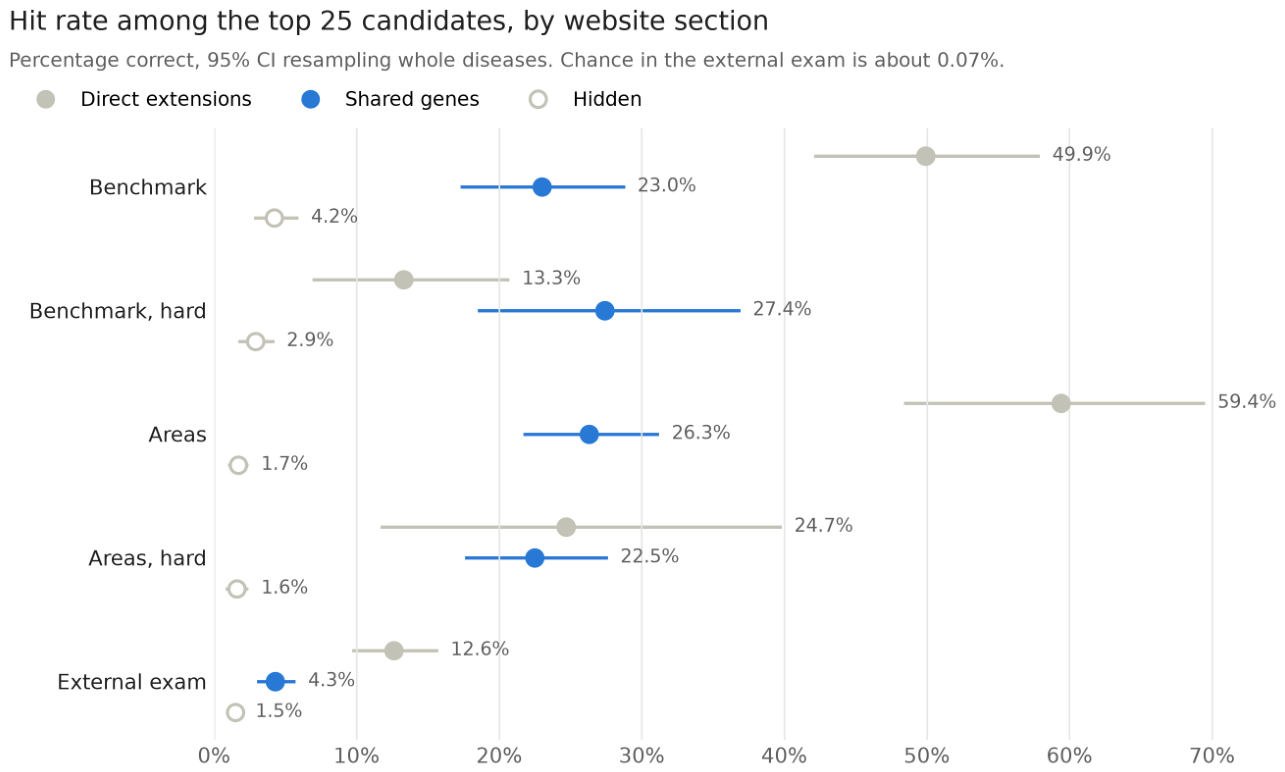
In the external exam, chance would be about 0.07% (on average 5.8 correct drugs among about 7,900 candidates per disease), so shared-genes candidates were enriched about 60-fold, while still being wrong about 24 times in 25.
The shared genes themselves, however, did not carry the signal. In the permutation test, random gene sets of the same size selected fewer candidates (2,253 on average, against 3,936) that were right 4.9% of the time on the external exam (99th percentile 5.3%), against 4.3% for the real shared genes, so the criterion fixed in advance was not met. In further, exploratory comparisons the same held within each range of gene-set size (fewer than 100 genes: 2.7% against a null of 2.1%; 100–499: 5.9% against 5.9%; 500 or more: 4.6% against 4.6%), when at least 3 specific genes were required (4.8% against 5.3%), and on the benchmark in every range of gene-set size (for diseases with fewer than 100 genes, 15.0% against a null of 11.9% and a 99th percentile of 15.6%). The threshold itself was not a sharp optimum: from 2 to 5 genes and p from 10⁻³ to 10⁻⁷, the external hit rate ranged from 3.9% to 4.7% (Supplementary Table S5). The line therefore selects drugs already used in diseases of similar size and research intensity; the genes it lists are context, not evidence of a shared mechanism.
Direct extensions are largely rediscovery. When the disease has no near-identical neighbour (hard subsets), their hit rate falls from 50–59% to 13–25%, close to the shared-genes line, and in the external exam it is 12.6%. The external exam, and especially its non-obvious pairs, is the fairer estimate of how these lines perform for new uses.
Temporal Validation
Rebuilt as known in 2015, OREVID ranked the uses that later reached phase 3 or approval well above popularity (813 test diseases, 2,832 pairs; Recall@100 0.322 against 0.174, paired difference 0.148, 95% CI 0.123–0.173), meeting the pre-registered rule; the development cutoff (2012) gave the same result (0.324 against 0.175). The difference held for pairs with no PrimeKG drug–disease edge of any kind (0.117, 0.093–0.142), for confirmed approvals (0.525 against 0.226) and for a model without any Open Targets feature (0.135), but it was small for non-obvious uses (0.043, 0.022–0.066). Among the 25 highest-ranked drugs per disease, 5.4% of direct extensions, 3.1% of shared-genes candidates and 0.8% of hidden drugs later reached phase 3 or approval, the same ordering as in the external exam. A logistic model that turned section, rank and gene-set size into a calibrated probability improved the Brier score over the section rates by only 2.5% (pre-registered threshold 5%) and is not used.
Examples
Three non-obvious approvals from the external exam were ranked in the top 25 with shared-genes evidence and no indication in an ontology neighbour. Sirolimus ranked first for tuberous sclerosis, through renal cell carcinoma, with which it shares five genes including TSC1 and TSC2 (p = 3.5 × 10⁻⁶). Aripiprazole ranked sixth for Tourette syndrome, through autism spectrum disorder (75 shared genes). Pasireotide ranked 12th for acromegaly, through Cushing syndrome (AIP, GNAS and POMC; p = 3.0 × 10⁻⁸).
The same evidence also fails in recognisable ways. Errors in gene–disease associations propagate: endocarditis carries genes associated with systemic lupus erythematosus in the source data, so antibiotics indicated for endocarditis (imipenem with cilastatin, cefapirin) are shown as candidates for lupus. Comorbidity reads as shared biology: rheumatoid arthritis shares immune genes with Graves disease, which brings the antithyroid drugs carbimazole and methimazole to the rheumatoid arthritis page. Broad-acting drugs recur despite the specificity correction: triamcinolone is shown on 1,218 of the 10,042 pages (12%), mostly rare syndromes whose genes overlap with those of diseases treated with corticosteroids. These cases are kept visible on the pages rather than filtered, and the website asks experts to flag them.
Data Errors Found
Open Targets 26.06 lists 10,215 approved drug–disease pairs that map to the graph. Some label or agency report supports 5,805 of them, but only 5,390 are supported by a report that names a single drug and spells out the disease. Two recurring errors explain part of the rest: substances mentioned in another drug's label (lincomycin marked as approved for multiple sclerosis from the fingolimod label) and abbreviations (the Japanese regulator's «ad» for attention-deficit disorder read as Alzheimer disease). Agreement with PrimeKG's indications, which come from DrugBank, was 25.7% for pairs supported by a label or agency (n = 5,805), 14.4% for pairs supported only by the Therapeutic Target Database (n = 1,599) and 4.2% for pairs supported only by ATC classes (n = 2,482). Both errors were reported to Open Targets.
Website
The website covers the 10,042 PrimeKG diseases with associated genes or phenotypes. A page shows, on average, 1.0 direct extension and 5.1 shared-genes candidates; 39% of diseases show neither (49% show no shared-genes candidate), mostly rare diseases with few associated genes, and the page says so instead of filling the list. Each candidate lists its evidence lines with the shared genes and p-values, the drug's targets and current indications, trials already run for the disease, and links for experts to send feedback, which will be used as new validation data. The exploratory list of drugs with no prior indication is shown separately and labelled as not validated. Pages link each disease to its broader term and its more specific forms, warn when the term is broad (at least 5 more specific forms or 500 associated genes), and mark direct extensions approved for a near-synonym of the disease. For information only, each candidate also shows whether a generic or biosimilar is marketed in the United States (FDA Orange Book and Purple Book) or authorised centrally in the European Union (EMA), and how many trials and articles already cover the pair; those with no trial and at most two articles are marked as underexplored.
Discussion
On identical data and splits, and on the ranking metrics used here, an interpretable metapath model with ranking-aware training recovered two to three times as many held-out treatments as TxGNN, and the gap persisted on whole disease areas, on approvals absent from the training graph and after removing the protocol differences between the two systems. It did not depend on drug popularity: a logistic regression without that feature did as well on the external exam. On AUPRC with sampled negatives the two systems were close, and TxGNN was better in five of nine areas, so the difference lies mainly in how high correct drugs rank against the whole drug list. Most of the signal comes from what already works in related diseases, and the strongest line, indication in an ontology neighbour, is largely rediscovery, as its fall on the hard subsets shows. Mechanistic evidence alone (the drug acts on a disease gene) carried no measurable signal at the top of the ranking, which argues for presenting such links as context rather than as support. Nor did the shared genes: random gene sets of the same size selected candidates that were right as often, so the second evidence line works as a selection of drugs already used in comparable diseases, not as evidence of a shared mechanism.
The practical value of a repurposing tool depends on precision for new indications, and here the numbers are modest. In the external exam about one in eight direct extensions and one in 25 shared-genes candidates was an approved indication; this is a lower bound, since many valid uses are never approved, but it means most candidates will not work. These approvals are missing from PrimeKG but mostly old (median first trial 2008) and may be recorded in other databases, so the exam measures the recovery of known indications absent from the training graph, not discovery; only the 158 recent approvals, the temporal test and the prospective test below come closer to new uses. Publishing these rates next to the optimistic hidden-treatment figures, and hiding candidates whose evidence does not beat chance, is meant to let users calibrate their trust.
Knowledge-graph embeddings were weaker than both TxGNN and the metapath model on the zero-shot split, where a test disease has lost every drug edge and an embedding has little to place it with, but RotatE ranked approvals missing from PrimeKG better than TxGNN, especially non-obvious ones. Only one embedding family was carried beyond the tuning seed (TransE and ComplEx were dominated by RotatE there), and the grid was small, so better-tuned embeddings may do better; OREVID-bench provides the splits, tasks and evaluation script so that other models can be added, and submissions are welcome. The comparison still covers one graph neural network, one embedding model and simple baselines, not every family of methods.
Limitations. All tests use recorded approvals as truth, which favours known treatments and penalises valid uses that were never approved. The external exam is out of sample but not prospective: most of those approvals predate PrimeKG and are simply missing from it. The temporal test removes later trials and associations from the graph, but 80% of PrimeKG indications carry no date and stay in the training graph, so some later knowledge may leak, and its advantage on non-obvious uses was small. The disease areas were used while designing both the model and the evidence rules, so they are not an untouched test set, and the threshold that defines the hard subset (half of the drugs already in a neighbour) was set by hand. Open Targets supplies gene–disease features as well as the external labels, although removing every Open Targets feature changed the external Recall@100 by only 0.011. Errors in the sources propagate, including wrong gene–disease associations and comorbidities that read as shared biology. Subtypes defined by a biomarker are not represented by that marker in the graph; a curated rule removes drugs acting on an absent marker for the listed subtypes (tamoxifen no longer appears for triple-negative breast cancer), but markers outside that list, and subtypes defined by mutations the graph does not encode, can still inherit treatments that cannot work. Broad terms with many associated genes (breast cancer has 1,253) pass the shared-genes test with almost any cancer; their shared-genes candidates were still right more often than hidden ones on the external exam (4.6% against 1.5%), so they are kept, but they may apply only to one subtype, which the pages now say. The risk warning relies on recorded contraindications, gives no signal when the drug has no label in related diseases, and cannot detect opposite mechanisms or class toxicities; the direction of effect of a new drug is not predicted. Drugs with no prior indication remain beyond the reach of every model tested; a pre-registered test of expression-signature reversal (LINCS L1000 consensus signatures against GEO disease signatures, 2,410 drugs and 239 diseases) ranked them at chance at the 2015 cutoff. Three pre-registered replacements for the shared-genes line (shared enriched Reactome pathways, specificity-weighted genes, genetic evidence only) did not beat the permutation null on the external exam either, although pathway overlap selected fewer candidates with a higher hit rate in every test (5.0% against 4.3% on the external exam). Disease-area splits use one seed and approximate TxGNN's, which were drawn without a fixed seed. The reviews that led to some of the website's rules were done by AI agents, not by human experts (see Use of AI).
To address the prospective gap, the rankings and pages of this version were frozen on 12 October 2026: the top 100 drugs for each of the 10,042 diseases, with the section of the website in which each one appears. An analysis plan written before any outcome is known compares the candidates shown with drugs ranked in the top 25 but hidden, and with lower ranks, for new phase 2 or later trials at 12 and 24 months and new approvals at 24 months (docs/PROSPECTIVE_PLAN.md in the repository). The snapshot is archived on Zenodo (doi:10.5281/zenodo.23326593). Expert feedback collected through the website will add a second, independent source of labels.
Supplementary Materials
The following supporting information can be downloaded at the website of this paper posted on Preprints.org.
Funding
None.
Acknowledgments
I thank the authors of PrimeKG and TxGNN for making their data and code public, and the Open Targets team for their response to the reported data issues.
Reference Check
Journal articles were checked against PubMed, and conference papers and the technical report against their publishers' pages, on 12 October 2026.
Conflicts of Interest
The author of this article declares no financial conflict of interest with the content of this article, in compliance with the PCI rule, and no non-financial conflict of interest. The work was done in a personal capacity and is independent of the author's employer.
References
- Pushpakom, S.; et al. Drug repurposing: progress, challenges and recommendations. Nat. Rev. Drug Discov. 2019, 18, 41–58. [Google Scholar] [CrossRef] [PubMed]
- Himmelstein, D.S.; et al. Systematic integration of biomedical knowledge prioritizes drugs for repurposing. eLife 2017, 6, e26726. [Google Scholar] [CrossRef] [PubMed]
- Huang, K.; et al. A foundation model for clinician-centered drug repurposing. Nat. Med. 2024, 30, 3601–3613. [Google Scholar] [CrossRef] [PubMed]
- Chandak, P.; Huang, K.; Zitnik, M. Building a knowledge graph to enable precision medicine. In Sci Data; Harvard Dataverse, 2023; Volume 10, p. 67. [Google Scholar] [CrossRef] [PubMed]
- Bordes, A.; Usunier, N.; Garcia-Durán, A.; Weston, J.; Yakhnenko, O. Translating embeddings for modeling multi-relational data. Adv. Neural Inf. Process. Syst. 26 2013. [Google Scholar]
- Trouillon, T.; Welbl, J.; Riedel, S.; Gaussier, É.; Bouchard, G. Complex embeddings for simple link prediction. In Proceedings of the 33rd International Conference on Machine Learning, PMLR, 2016; 48, pp. 2071–2080. [Google Scholar]
- Sun, Z.; Deng, Z.H.; Nie, J.Y.; Tang, J. RotatE: knowledge graph embedding by relational rotation in complex space. International Conference on Learning Representations (ICLR; 2019. [Google Scholar]
- Bonner, S.; et al. Implications of topological imbalance for representation learning on biomedical knowledge graphs. Brief. Bioinform. 2022, 23, bbac279. [Google Scholar] [CrossRef] [PubMed]
- Bang, D.; et al. Biomedical knowledge graph learning for drug repurposing by extending guilt-by-association to multiple layers. Nat. Commun. 2023, 14, 3570. [Google Scholar] [CrossRef] [PubMed]
- Ma, C.; et al. KGML-xDTD: a knowledge graph-based machine learning framework for drug treatment prediction and mechanism description. GigaScience 2023, 12, giad057. [Google Scholar] [CrossRef] [PubMed]
- Knox, C.; et al. DrugBank 6.0: the DrugBank Knowledgebase for 2024. Nucleic Acids Res. 2024, 52, D1265–D1275. [Google Scholar] [CrossRef] [PubMed]
- Kuhn, M.; et al. The SIDER database of drugs and side effects. Nucleic Acids Res. 2016, 44, D1075–D1079. [Google Scholar] [CrossRef] [PubMed]
- Piñero, J.; et al. The DisGeNET knowledge platform for disease genomics: 2019 update. Nucleic Acids Res. 2020, 48, D845–D855. [Google Scholar] [CrossRef] [PubMed]
- Vasilevsky, N.A.; et al. Mondo: integrating disease terminology across communities. Genetics 2026, 232, 41052288. [Google Scholar] [CrossRef] [PubMed]
- Buniello, A.; et al. Open Targets Platform: facilitating therapeutic hypotheses building in drug discovery. Nucleic Acids Res. 2025, 53, D1467–D1475. [Google Scholar] [CrossRef] [PubMed]
- Zdrazil, B.; et al. The ChEMBL Database in 2023: a drug discovery platform spanning multiple bioactivity data types and time periods. Nucleic Acids Res. 2024, 52, D1180–D1192. [Google Scholar] [CrossRef] [PubMed]
- Szklarczyk, D.; et al. The STRING database in 2025: protein networks with directionality of regulation. Nucleic Acids Res. 2025, 53, D730–D737. [Google Scholar] [CrossRef] [PubMed]
- Wei, C.H.; et al. PubTator 3.0: an AI-powered literature resource for unlocking biomedical knowledge. Nucleic Acids Res. 2024, 52, W540–W546. [Google Scholar] [CrossRef] [PubMed]
- Ke, G.; Meng, Q.; Finley, T.; Wang, T.; Chen, W.; Ma, W.; Ye, Q.; Liu, T.Y. LightGBM: a highly efficient gradient boosting decision tree. Advances in Neural Information Processing Systems 30 (NeurIPS. 2017. Available online: https://papers.nips.cc/paper_files/paper/2017/hash/6449f44a102fde848669bdd9eb6b76fa-Abstract.html.
- Burges, C.J.C. Microsoft Research Technical Report MSR-TR-2010-82; From RankNet to LambdaRank to LambdaMART: an overview. 2010. Available online: https://www.microsoft.com/en-us/research/publication/from-ranknet-to-lambdarank-to-lambdamart-an-overview/.

Table 1.
Recall@100 by model and test. Zero-shot: mean ± SD over five seeds (335 diseases); areas: mean of nine areas (345 diseases); external exam: 645 diseases (non-obvious approvals: 2,719 pairs in 563 diseases; recent, first trial in 2018 or later: 158 pairs in 99 diseases). The logistic regression uses the same metapath features without the popularity feature. External exam: mean ± SD over models trained on each of the five zero-shot splits (TxGNN with its model for each split); the rest of the text, the hit rates and the examples use the first split (OREVID 0.359, TxGNN 0.121). The training-labels-only variant was not run on the external exam. RotatE: PyKEEN knowledge-graph embedding trained on each split's training edges, with its settings chosen on zero-shot seed 1; external exam on the first split only.
Table 1.
Recall@100 by model and test. Zero-shot: mean ± SD over five seeds (335 diseases); areas: mean of nine areas (345 diseases); external exam: 645 diseases (non-obvious approvals: 2,719 pairs in 563 diseases; recent, first trial in 2018 or later: 158 pairs in 99 diseases). The logistic regression uses the same metapath features without the popularity feature. External exam: mean ± SD over models trained on each of the five zero-shot splits (TxGNN with its model for each split); the rest of the text, the hit rates and the examples use the first split (OREVID 0.359, TxGNN 0.121). The training-labels-only variant was not run on the external exam. RotatE: PyKEEN knowledge-graph embedding trained on each split's training edges, with its settings chosen on zero-shot seed 1; external exam on the first split only.
| Model | Zero-shot | Zero-shot, hard | Areas | External | External, non-obvious | External, recent |
| Popularity baseline | 0.358 ± 0.040 | 0.203 ± 0.031 | 0.185 | 0.130 ± 0.010 | 0.076 ± 0.006 | 0.098 ± 0.012 |
| TxGNN | 0.412 ± 0.042 | 0.258 ± 0.067 | 0.237 | 0.126 ± 0.004 | 0.086 ± 0.004 | 0.138 ± 0.024 |
| RotatE (knowledge-graph embedding) | 0.289 ± 0.058 | 0.162 ± 0.048 | 0.219 | 0.156 (split 1) | 0.127 (split 1) | 0.149 (split 1) |
| OREVID | 0.811 ± 0.042 | 0.539 ± 0.090 | 0.617 | 0.367 ± 0.008 | 0.184 ± 0.007 | 0.365 ± 0.021 |
| OREVID, training labels only | 0.803 ± 0.035 | 0.530 ± 0.073 | 0.619 | – | – | – |
| Logistic regression without popularity | 0.781 ± 0.044 | 0.501 ± 0.088 | 0.591 | 0.363 ± 0.010 | 0.183 ± 0.013 | 0.339 ± 0.016 |
| OREVID without Open Targets features | 0.802 ± 0.048 | 0.522 | 0.628 | 0.348 (split 1) | – | – |
Table 2.
Results per disease area: number of test diseases (in the hard subset), Recall@100 on all and on hard diseases, and AUPRC with sampled negatives.
Table 2.
Results per disease area: number of test diseases (in the hard subset), Recall@100 on all and on hard diseases, and AUPRC with sampled negatives.
| Area | Diseases (hard) | Recall@100 TxGNN | Recall@100 OREVID | Hard TxGNN | Hard OREVID | AUPRC TxGNN | AUPRC OREVID |
| Adrenal gland | 6 (4) | 0.467 | 0.911 | 0.225 | 0.892 | 0.980 | 0.995 |
| Anaemia | 12 (6) | 0.082 | 0.704 | 0.000 | 0.468 | 0.655 | 0.968 |
| Autoimmune | 13 (6) | 0.326 | 0.726 | 0.288 | 0.449 | 0.914 | 0.909 |
| Cardiovascular | 53 (49) | 0.114 | 0.378 | 0.090 | 0.335 | 0.772 | 0.783 |
| Cell proliferation | 180 (108) | 0.346 | 0.737 | 0.233 | 0.576 | 0.951 | 0.949 |
| Diabetes | 2 (2) | 0.028 | 0.236 | 0.028 | 0.236 | 0.690 | 0.727 |
| Mental health | 39 (33) | 0.209 | 0.427 | 0.202 | 0.349 | 0.924 | 0.871 |
| Metabolic disorder | 28 (19) | 0.081 | 0.582 | 0.011 | 0.409 | 0.925 | 0.915 |
| Neurodegenerative | 12 (6) | 0.479 | 0.849 | 0.192 | 0.699 | 0.984 | 0.952 |
| Mean of areas | 345 (233) | 0.237 | 0.617 | 0.141 | 0.490 | 0.866 | 0.897 |
| Weighted by disease | 345 (233) | 0.269 | 0.637 | 0.173 | 0.479 | – | – |
Disclaimer/Publisher’s Note: The statements, opinions and data contained in all publications are solely those of the individual author(s) and contributor(s) and not of MDPI and/or the editor(s). MDPI and/or the editor(s) disclaim responsibility for any injury to people or property resulting from any ideas, methods, instructions or products referred to in the content. |
© 2026 by the authors. Licensee MDPI, Basel, Switzerland. This article is an open access article distributed under the terms and conditions of the Creative Commons Attribution (CC BY) license (http://creativecommons.org/licenses/by/4.0/).
Copyright: This open access article is published under a Creative Commons CC BY 4.0 license, which permit the free download, distribution, and reuse, provided that the author and preprint are cited in any reuse.