

Submitted:
16 October 2026
Posted:
20 October 2026
You are already at the latest version
Abstract
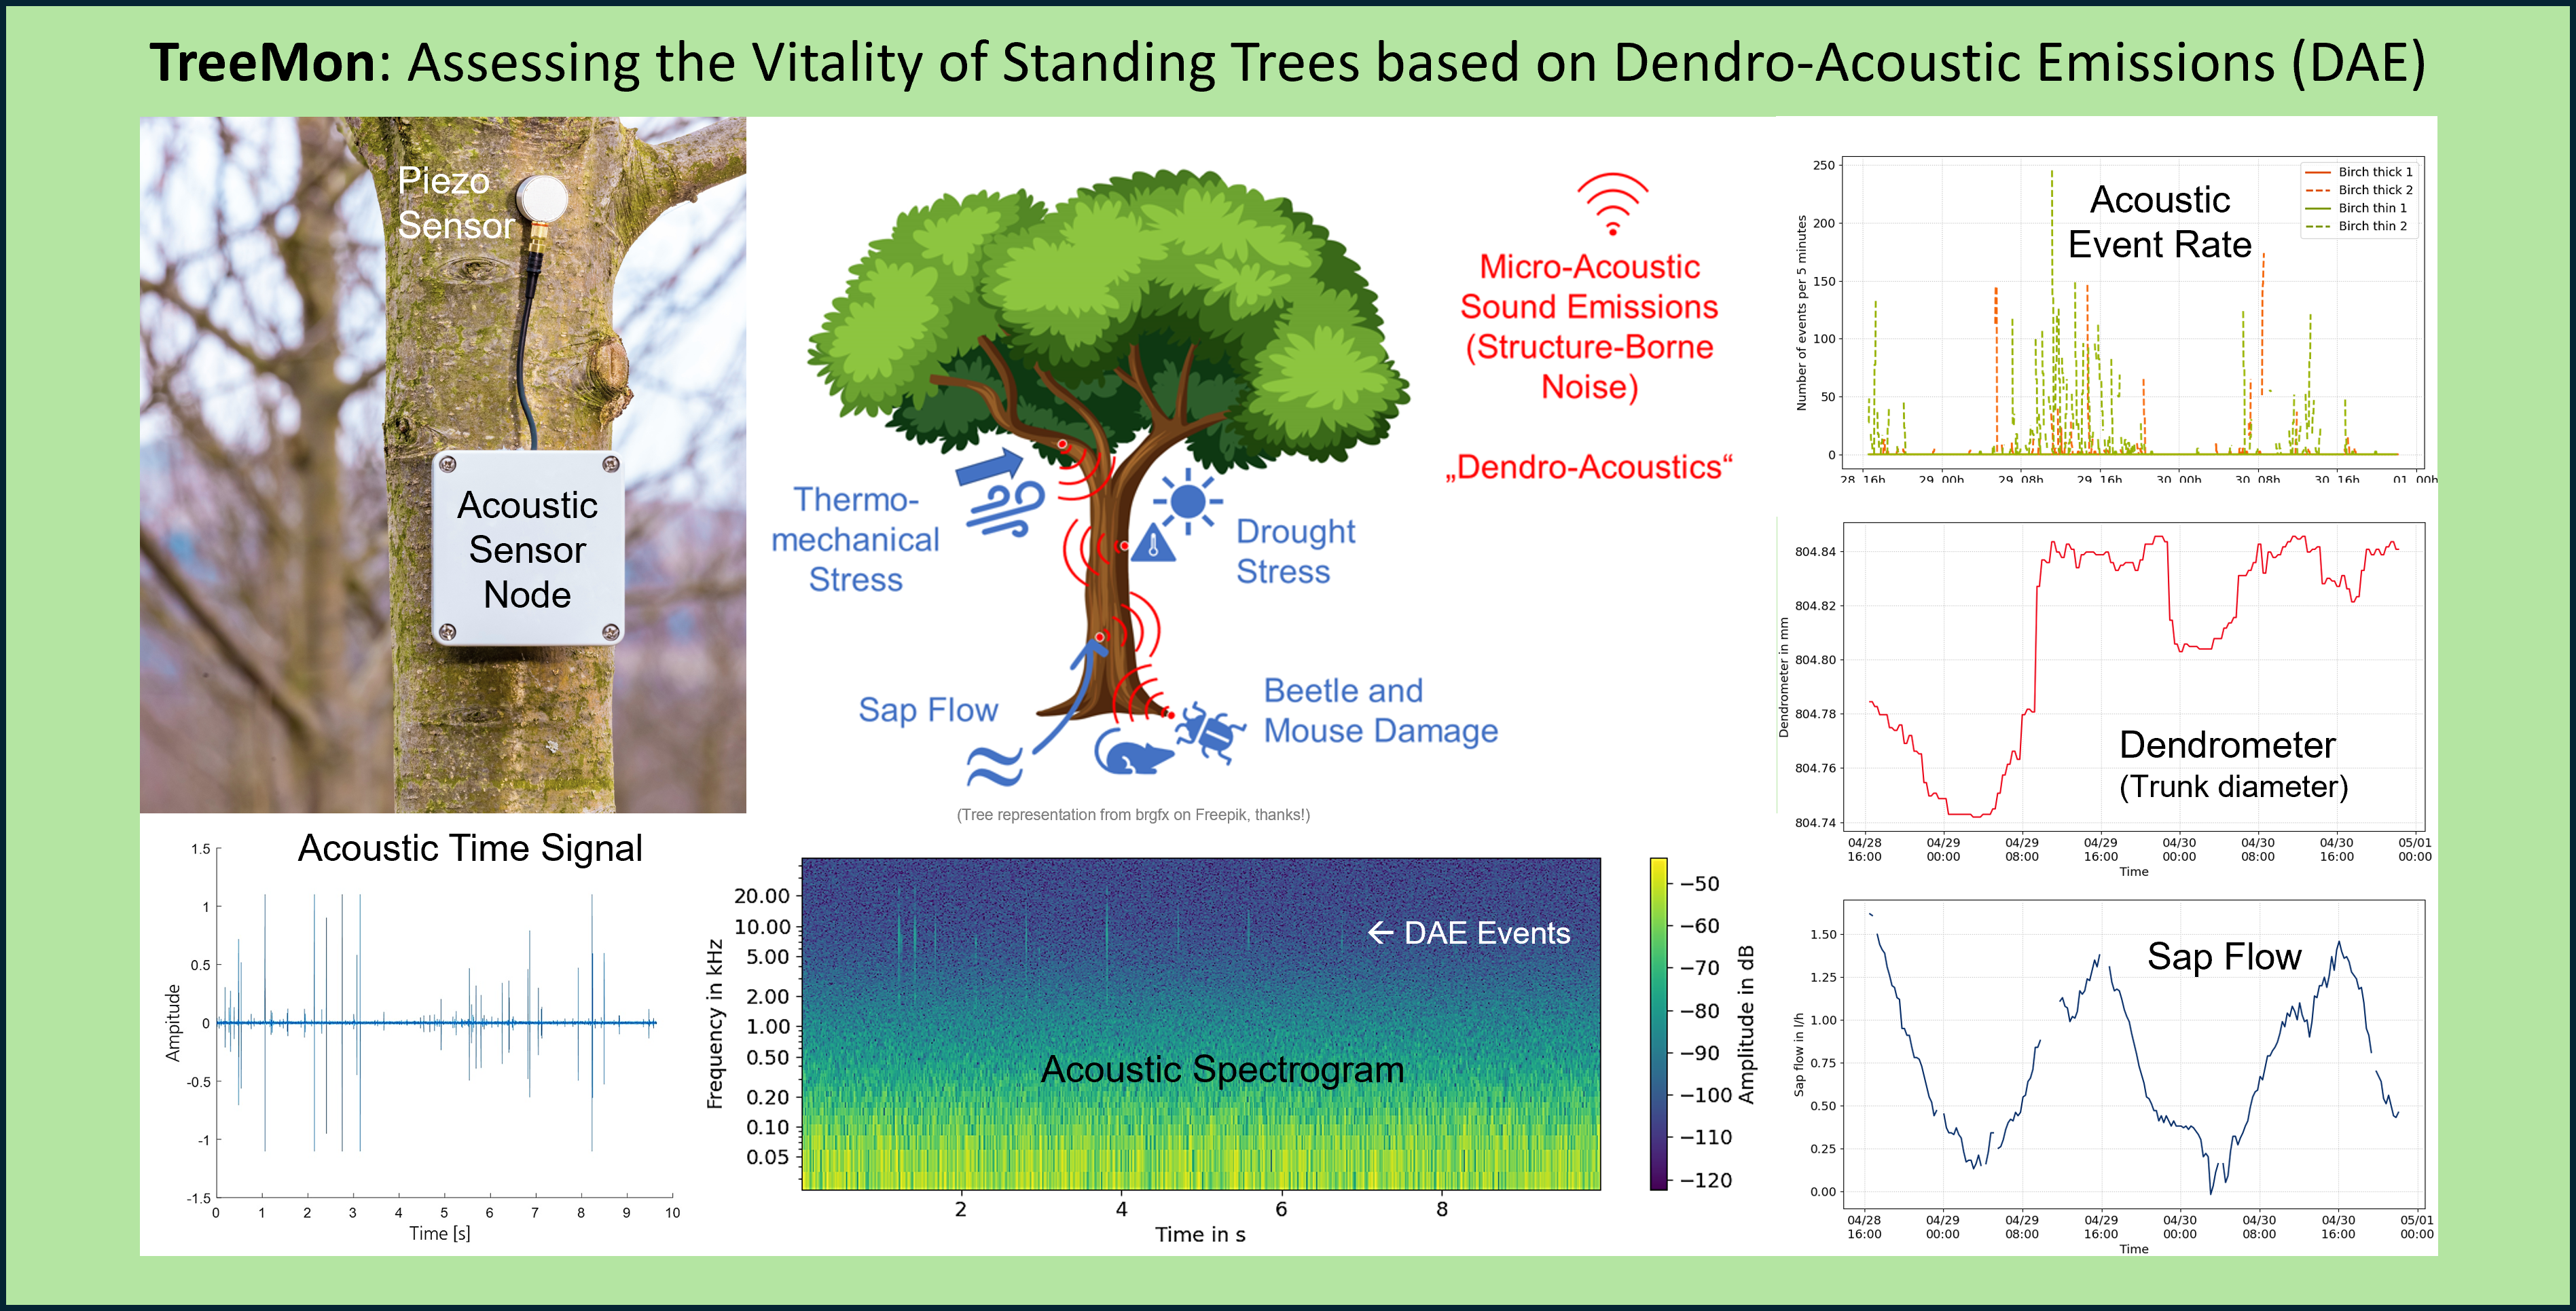
In the areas of road safety, fruit growing and forestry, there is an increased need for assessing the vitality of standing trees. Various dendro-acoustic emissions (DAEs) potentially allow conclusions to be drawn about the vitality of the trees and various diseases and pest infestations. All types of DAE events produce structure-borne sound inside the tree and can be automatically measured and evaluated by a piezoelectric sensor node attached to the tree trunk. The events are characterized by short, broadband cracking signals. Depending on the type of event, these differ in their number, strength and acoustic center frequency and can be separated from various types of background noise such as traffic, wind, rain, etc. In the frame of a German collaborative research project (TreeMon), an autonomous sensor prototype for long- and short-term monitoring using LoRaWAN technology was developed and successfully tested in the field. We present selected results of various test and field measurements at different trees, including several hardwood species like beech, birch and fruit trees. We compare temporal DAE profiles of single trees with simultaneously recorded weather, dendrometer and sap flow data and demonstrate first interesting correlations between them.
Keywords:
road safety
; fruit growing
; forestry
; tree vitality
; dendro-acoustic emissions (DAE)
; structure-borne sound
; acoustic sensor node
; weather data
; dendrometer
; sap flow
1. Introduction
Assessing the vitality of standing trees based on a single physical measurement principle would be highly desirable for many applications, such as nature conservation, tree care, fruit growing, and forestry. Previous studies have shown that standing trees can exhibit various micro-acoustic emissions in both the audible and ultrasonic range. These dendro-acoustic emissions (DAEs) may provide information about the tree's condition, its traffic safety, drought stress and sap flow anomalies, as well as potential pest or disease infestations. Within the framework of the collaborative research project TreeMon, an autonomous acoustic sensor node was developed and implemented for the first time, enabling the identification, characterization, and counting of different types of DAE events. This paper provides an overview of the overall project, selected preliminary results, and future possibilities of the technology. Section 1.1 begins by explaining the motivation behind the project and provides an overview of potential application areas. Section 1.2 is dedicated to the relevant preliminary work in this field.
1.1. Possible Fields of Application
The traffic safety assessment of urban, park, and street trees presents a demanding task, requiring a careful balancing of the risk of property damage and personal injury on the one hand, and the increasing desire to preserve the environment and the climate-improving effect of trees on the other. This ambivalent role of trees in urban and cultural landscapes is further intensified by climate change, as heat waves and air pollution scenarios become more frequent. This increases the need to preserve older trees, especially those with a significant climate impact, for as long as possible. Conversely, rising temperatures and drought stress are increasingly damaging trees. This leads to a greater need for methods for the early detection of tree damage. Currently, traffic safety assessments of trees are carried out as needed or at regular intervals by specially trained government employees or arborists [1]. This usually involves a visual inspection, possibly in conjunction with invasive drilling methods. In some cases, more complex tomography methods based on ultrasound or electrical conductivity are also used [2]. All methods are costly and only ever represent a snapshot of the tree's condition, which is also subject to considerable uncertainties. From a practical point of view, it would therefore be desirable to equip potentially endangered and particularly valuable trees with an easy-to-install, compact, and autonomous sensor node that can automatically record relevant measurement data over an extended period and then wirelessly transmit it externally, where it can be collected, analyzed, graphically displayed, and integrated into a long-term database of the recorded tree population.
Even in fruit trees, especially in organic cultivation on plantations and traditional orchards, the detection and interpretation of drought stress and tree diseases is becoming increasingly important in order to identify and counteract yield reductions and total crop failure in a timely manner. Often, even after many years of unremarkable growth, individual trees suddenly and unexpectedly die. Symptoms caused by diseases and pests usually persist for several years and often begin with a reduction in yield, either temporally or locally. The causes are usually internal abnormalities or diseases of the tree but also damage from mice to the trunk and roots, which often goes undetected. With a sensor system that detects the tree's sap flow and thus identifies anomalies or drought stress early on, personnel costs associated with manual inspection could be reduced, and a significant proportion of problematic trees could be saved through irrigation and other measures. Mouse damage could also be detected in time, before the tree dies. The use of such sensor technology could therefore yield considerable economic benefits and make a significant contribution to environmental protection through more targeted irrigation and the avoidance of pesticides. Furthermore, more drought-resistant fruit varieties could be identified, ensuring a stable yield even in dry years.
Progressive climate change and the massive damage to trees caused by drought stress, particularly to the predominant coniferous trees in Germany such as spruce and pine, present German forestry with the complex and challenging task of assessing existing damage and monitoring ongoing damage caused by drought stress, diseases, and pest infestations (e.g. by bark beetles) over the long term [3]. As active countermeasures against climate change, existing monocultures are to be gradually replaced by more resilient mixed forests, potentially including the planting of particularly drought-resistant tree species from different provenances. These adaptation strategies also require long-term monitoring and evaluation of their effectiveness. A monitoring system capable of recording information on sap flow, drought stress, and pest infestation from a statistically representative number of trees would be an important tool for assessing existing damage, monitoring its progression, and evaluating the effectiveness of implemented forest conversion measures. During long-term monitoring, direct comparisons between native and non-native tree species could also be carried out to validate the potentially greater resilience of the latter to drought stress. A comparable monitoring approach, although not based on dendro-acoustics, was developed in the Swiss TreeNet project [4]. This is an observation and research network for drought and tree growth indicators, in which point dendrometers automatically measure the daily fluctuations in tree trunk radius. These measurements are then evaluated with regard to the trees' responses to climate change [5].
The new acoustic sensor system could also make a significant contribution to forest surveys. When used in intensive forest monitoring (Level II), additional information on the condition of the trees present is highly valuable and can help improve our understanding of the cause-and-effect relationships within the ecosystem.
To address the issues described in the preceding sections, a sensor system is required that can capture aspects of tree safety, detect drought stress, record sap flow, and document pest infestations—particularly those caused by beetles and mice. The TreeMon project, funded by the German Federal Ministry for Research, Technology and Space (BMFTR, formerly BMBF), aimed to demonstrate that a previously little-studied physical property of trees—dendro-acoustics—could be utilized for this purpose.
1.2. Relevant Preliminary Work
Various studies have shown that trees can generate a wide range of micro-acoustic signals, in the following called dendro-acoustic emissions (DAEs) [6,7,8,9,10,11,12,13,14,15,16,17]. These originate within the tree, propagate extensively as structure-borne sound, and can be detected in the cambium or phloem layer between the sapwood and the bark. DAEs can be detected presumably even in the audible range using stethoscopes, but also in the ultrasonic range using specialized piezoelectric sensors inserted through the bark into the sapwood [6]. The following types of DAE have been detected to date:
- Acoustic emissions (AE) caused by wood fiber fractures resulting from mechanical loads (e.g., wind or frost loads) [7]. The intensity, frequency, and distribution of these acoustic events can provide information on the tree's mechanical condition as well as the initiation and propagation of damage [8]. Furthermore, the sound of waves propagating through the tree allows inferences to be drawn regarding the trunk's density distribution, as acoustic properties differ significantly between sapwood and heartwood, and—most notably—in damaged areas or regions affected by fungal decay characterized by low density or voids [9]. A damaged or hollow tree produces a different sound than a tree with intact heartwood [10].
- Characteristic acoustic emissions associated with drought stress [11]. These events involve the collapse of conducting pathways in the sapwood [6,12,13], pathways that normally transport water, convey mineral nutrients to the tree crown, and store sugars and starch in the adjacent cellular tissue (parenchyma). These acoustic emission events differ distinctly in their acoustic signature from those mentioned in point 1 and can therefore be analyzed separately. This allows for the determination of the cumulative number of drought-stress days per tree, which can then be used to assess the tree's condition.
- According to various—albeit scientifically unverified—internet sources, the flow of sap through the ascending and descending vascular pathways generates characteristic flow noises that are reportedly audible even with simple stethoscopes. Due to the size of the cell structures responsible for sound generation and the concurrent fluctuations in trunk radius [5], acoustic emissions also occur in the ultrasonic range [13]. During a sunny day, a tree loses more water through leaf transpiration than can be replenished from the soil via the roots. At night, the tree absorbs more water through its root system as transpiration ceases [14,15]. This results in a characteristic ebb and flow of the sap flow and associated acoustic emissions. In addition to daily fluctuations, seasonal and weather-dependent cycles also occur. Monitoring sap flow thus offers another means of assessing a tree's health and stress level.
- Pests can also generate acoustic emissions within or on the tree through feeding sounds [16,17]. These primarily include wood-dwelling insects (especially bark beetles) as well as voles that damage the tree's root zone or trunk. Detecting such feeding sounds could provide further important information regarding the tree's condition or current, potentially harmful influences.
As the existing literature illustrates, dendro-acoustic studies have thus far been conducted predominantly in R&D settings or laboratories and have not yet found their way into field-ready applications.
In recent years, there has been an increase in forestry monitoring projects investigating the impacts of climate change. The previously mentioned TreeNet project in Switzerland is particularly noteworthy in this context. It is an observation and research network that uses point dendrometers to automatically measure daily fluctuations in tree stem radius caused by sap flow and drought stress [4,5]. However, this project does not employ acoustic sensors. A US patent concerning forest sensor arrays and their use for monitoring soil conditions is described in [18].
As part of an undergraduate research project at Northern Illinois University, a simple, low-cost acoustic emission system—featuring an Arduino microcontroller and a 3D-printed housing—was constructed for use on trees [19]. The technical design was very basic, and the system's performance was consequently so limited that only test measurements with a very poor signal-to-noise ratio could be conducted. No reliable conclusions regarding the vitality of the examined trees could be drawn from the results.
There are other tree-oriented sensor products available commercially that are not based on dendroacoustics.
The TreeTalker was developed by Nature 4.0 SB Srl for the purpose of monitoring tree health [20]. It is a device attached to the tree that incorporates a combination of sensors (IR radial growth sensor, spectrometer, accelerometer, hygrometer). It features wireless communication capabilities for transmitting data from the device to an external server, as well as a connection for a solar-powered battery. According to the manufacturer, this combination of sensors allows the TreeTalker to monitor water transport, tree diameter growth, foliage quantity and quality, and tree stability, as well as various temperature and humidity parameters.
Another commercially available product is the AudioMoth from Open Acoustic Devices [21]. It is a low-cost environmental acoustic logger. Instead of a network of sensors, it features a single microphone connected to a microcontroller that monitors and records the surrounding environment. These recordings are stored on a Secure Digital (SD) card within the device. It has already been used to monitor both trees and caves; however, since the microphone captures only airborne sound, it can only detect the creaking of the tree bark and thus has no access to the dendro-acoustic sources inside the tree that are the focus of the present paper.
The goal of the TreeMon project presented here was to pursue and implement the novel concept of an autonomous sensor node for dendro-acoustic emissions. To this end, a wireless acoustic sensor node demonstrator was to be developed; this device would be attached to a tree trunk to capture sound emissions over an extended period and analyze them—either autonomously or with the aid of a central computer—using machine learning. In addition to soil moisture and weather data (such as temperature, precipitation, radiation, and wind), the project aimed to record dendrological parameters—specifically using dendrometers and sap flow sensors—to establish correlations with the acoustic measurement data at various points in time.
2. Materials and Methods
To bridge the time within the project until the development of the acoustic sensor node for the final field measurements, extensive test measurements were initially conducted using commercially available acoustic and acoustic emission systems. These included both laboratory measurements under controlled conditions and short-term field measurements on trees, mostly lasting a maximum of 1–2 hours. These preliminary measurements are described in Section 2.1.
In parallel with the test measurements, the acoustic TreeMon sensor node (including battery pack), a data dashboard, and a LoRaWAN interface with a gateway were developed and assembled. A commercially available weather station was also prepared and integrated into the overall system to operate alongside the subsequent field measurements (Section 2.2).
In addition to hardware development, AI-based analysis software was implemented for event identification and characterization. This software incorporates various filtering techniques to better distinguish between signals of interest and interfering ambient noise (Section 2.3).
Following the development phase, extensive field measurements were conducted using an initial field-ready demonstrator of the sensor node (versions 1.0 and 1.1); these tests involved various trees at different locations over periods ranging from a few minutes up to 2,5 months. Towards the end of the project, a revised version (2.0) of the sensor node—featuring significantly reduced energy consumption and an additional solar panel for autonomous operation—was introduced and successfully tested in the field (Section 2.4).
In parallel with the acoustic measurements, supplementary dendrometer and sap flow measurements were taken on the trees under study at two locations and compared with the temporal acoustic profiles. Weather data were also recorded using a dedicated weather station and incorporated into the analysis (Section 2.5).
To assess the vitality of the instrumented trees from a dendrological perspective, drone flights utilizing optical camera technology and tree assessments by human experts were conducted; the resulting data were stored in a database covering the surveyed tree population (Section 2.6).
2.1. Acoustic Test Measurements with Laboratory Equipment
Two different systems were used for the acoustic test measurements, a commercial acoustic system—the Zoom F8n with an AKG C411 contact condenser microphone (Figure 1) for the audible frequency range up to approximately 20 kHz, and a multichannel transient recorder HBM Gen3i for acoustic emission measurements using various piezoelectric sensors (including the Vallen VS150-M and IKTS KAR 601S) for frequencies up to 400 kHz (Figure 2). These measurements served to test and optimize various coupling methods (Section 2.1.1) and to conduct orientation and test measurements on trees in the laboratory (Section 2.1.2) and in the field (Section 2.1.3). Depending on the measurement location, power was supplied either via the local mains connection or, alternatively, by a car battery.
Table 1 provides a complete overview of the test measurements carried out during the project.
2.1.1. Acoustic Coupling Variants
To effectively record structure-borne sound propagating within the tree, sensors generally cannot simply be placed on the bark, as the bark’s mechanical structure causes significant acoustic damping (Figure 3a, variant 4). Direct coupling to the bark is feasible only for tree species with very thin bark that is tightly bonded to the cambium, such as birches. For all other species, a small area of bark must be milled away, or a nail sensor must be driven completely through it (Figure 3b,c). The former method allows for largely non-destructive surface coupling—using a coupling agent and a tensioning strap—directly onto the phloem without damaging it (diameter approx. 10–20 mm; Figure 3b). In the second method, the nail sensor is driven deep into the sapwood. While this causes localized damage, it provides a more stable long-term coupling (nail diameter approx. 3–4 mm; Figure 3b). Here, the piezoelectric sensor is mounted directly on the nail head, with the nail itself acting as a waveguide for the acoustic waves emerging from the tree.
Using the acoustic and AE systems described above, various sensitivity tests were conducted and evaluated on a freshly felled spruce log, employing different coupling methods. Standardized acoustic excitations were generated using both an active sound transducer and a mechanical hammer, and the amplitudes detected by various sensors were measured at a constant distance from the actuator (Figure 4). The key results of these investigations are summarized in Section 3.1.
2.1.2. Test Measurements on Trees in the Laboratory
In addition to investigations into coupling methods, drying experiments were conducted on a felled spruce tree (Figure 5), as well as drought-stress and re-watering experiments on potted indoor trees (orange and lemon, trunk diameter approx. 5 cm) under laboratory conditions (Figure 6). For the drying experiment, a freshly felled spruce tree was divided into two trunks; one was placed in a bucket of water, while the other was kept under dry conditions. Subsequently, acoustic event rates were measured over a period of 13 days and compared between the two trunks. The results are presented and discussed in Section 3.4.1.
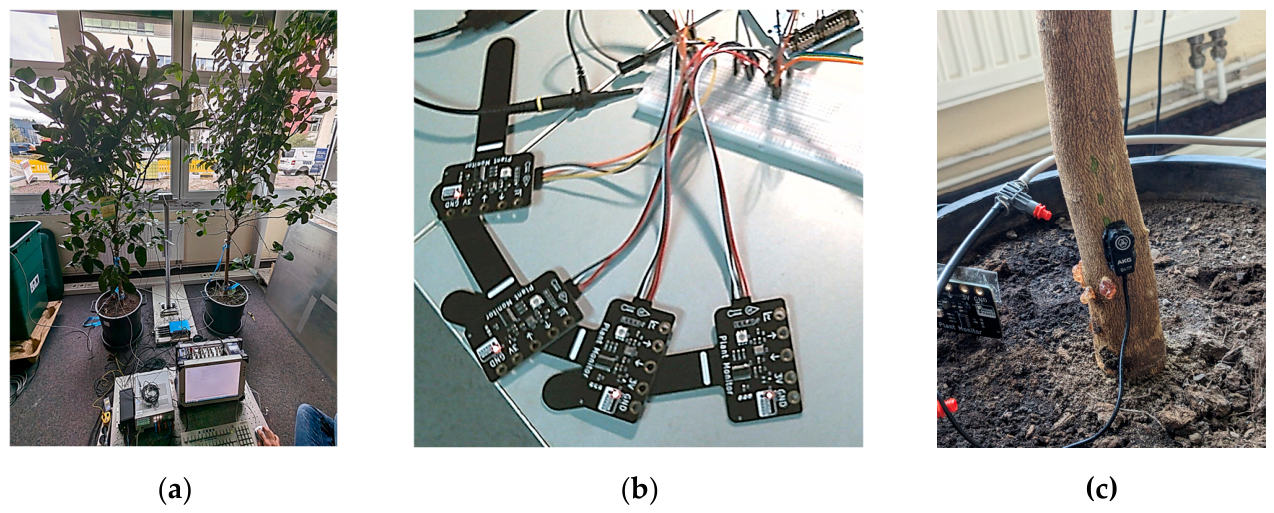
As part of the drought stress and rewetting experiments, both indoor potted trees were initially equipped with soil moisture sensors and a controllable irrigation system (Figure 6). Subsequently, several drought phases followed by rewetting were carried out over a total period of 73 days and monitored using acoustic and AE measurements. Selected results are summarized in Section 3.4.2.
Figure 6.
Laboratory measurement setup for the drought stress experiment on two indoor trees. (a) A potted orange tree and a potted lemon tree in front of the laboratory window. (b) Various sensors deployed directly on the tree, near the tree, or in the soil, including soil moisture sensors, a humidity sensor, a brightness sensor and a temperature sensor. (c) Coupled acoustic sensor with parts of the controllable and programmable irrigation system.
Figure 6.
Laboratory measurement setup for the drought stress experiment on two indoor trees. (a) A potted orange tree and a potted lemon tree in front of the laboratory window. (b) Various sensors deployed directly on the tree, near the tree, or in the soil, including soil moisture sensors, a humidity sensor, a brightness sensor and a temperature sensor. (c) Coupled acoustic sensor with parts of the controllable and programmable irrigation system.
2.1.3. Test Measurements on Trees in the Field
Further test measurements, typically lasting several hours, were conducted on various trees at different locations; these included street trees in Bad Gottleuba, fruit trees and birches at the orchard in Sohra, bark beetle-infested pines in the forests near Senftenberg and Geierswalde, and a felled spruce in the Oelsengrund valley near Dresden (Figure 7). In Senftenberg, a pull test was also performed on a pine tree, continuing until it toppled completely (Figure 8). During the pulling and holding phases, DAE event rates were measured and plotted against time.
2.2. Development and Integration of Acoustic Sensor Node, Data Dashboard, and LoRaWAN Gateway
The development of the autonomous sensor node, the data dashboard, and the LoRaWAN interface were among the main objectives of the TreeMon project and are therefore presented in detail below. Due to the finding of the test measurements that all relevant DAEs could be identified in the acoustic range, it was decided to restrict the system to lower frequencies. This does not necessarily mean that ultrasonic frequencies from AE systems are not relevant for future applications. However, for practical purposes a proper balance between functionality and economic aspects had to be found.
2.2.1. Sensor Node
The TreeMon sensor node represents the heart of the project. The following subsections describe its design and development, the internal signal processing, and the power supply system.
Design and Development
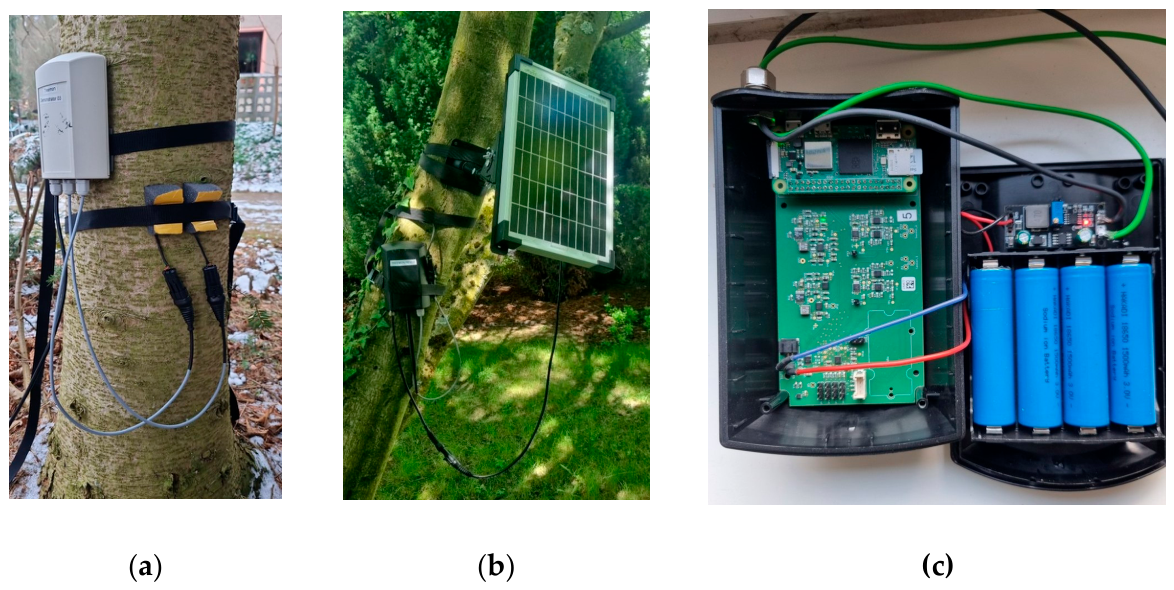
The TreeMon sensor node was developed to acquire tree-borne acoustic signals under field conditions and to provide a hardware platform for investigating their relationship to tree vitality. Development proceeded in two generations with complementary purposes: a first generation based on a Linux-capable single-board computer (Revision 1, subsequently upgraded to Revision 1.1, Figure 9a), designed to collect extensive raw data recordings for algorithm development, and a microcontroller-based system with on-device signal processing and a solar-assisted power supply (Revision 2.0, Figures 9b,c), implementing an energy-efficient autonomous monitoring architecture.
Revision 1.1 combined piezoelectric transducers with analogue signal conditioning, local storage on a memory card and a LoRaWAN radio module; two acoustic sensors could be connected to each node. Because the continuous power demand of the computing platform was too high for a small internal battery, the electronics were supplied from external 12-V lithium iron phosphate batteries through weather-protected cabling, with batteries exchanged approximately once or twice per week. This configuration enabled continuous long-term recording campaigns of more than four weeks each, in winter as well as in spring and summer, acquiring raw acoustic data at configurable intervals together with operating and diagnostic parameters, and confirmed stable mechanical and electrical operation under outdoor conditions including sub-zero temperatures, which noticeably reduce the usable battery capacity (Figure 9a).
Figure 9.
Different development versions of the TreeMon sensor node (a) First-generation (Revision 1.1) field installation with tree-mounted electronics, connected piezoelectric sensors and external power-supply cabling. (b) Revision 2.0 field installation with a 10-W (rated peak power) solar panel recharging the integrated battery supply. (c) Interior of the Revision 2.0 sensor node showing the electronic assembly and the integrated four-cell battery pack.
Figure 9.
Different development versions of the TreeMon sensor node (a) First-generation (Revision 1.1) field installation with tree-mounted electronics, connected piezoelectric sensors and external power-supply cabling. (b) Revision 2.0 field installation with a 10-W (rated peak power) solar panel recharging the integrated battery supply. (c) Interior of the Revision 2.0 sensor node showing the electronic assembly and the integrated four-cell battery pack.
The acoustic coupling of the sensors to the stem proved decisive for signal quality and was iterated over several variants. Laboratory comparisons of different transducer types and coupling principles showed good signal-to-noise ratios across the excited bandwidth. In the field, sensor attachment evolved from warmed beeswax (reproducible but laborious to apply) to butyl rubber applied from a cartridge, which considerably simplifies installation. The sensor assemblies themselves were additionally examined with regard to shielding, encapsulation and mechanical fixation, and polyurethane foam was tested as an acoustic screen against airborne noise.
The long-term campaigns also yielded instructive findings on self-generated interference. A reproducible signal with harmonic components near 6, 12 and 18 kHz, clearly above the ambient noise floor and independent of weather conditions, was traced to electronic coupling from periodic activity of the computing platform, mechanically amplified by the sensor mounting, in which damping foam and fastening strap acted as a resonator. These findings led to stricter separation and shielding of the analogue circuitry, power paths and sensor wiring, and to a revised mechanical mounting stack of sensor, spacer ring, electromagnetic shielding, damping foam and strap to suppress the resonance.
Embedded Acquisition and On-Device Signal Processing
Revision 2.0 is built around a low-power microcontroller with 16 MB of flash memory and 8 MB of external RAM. Its acquisition chain comprises a low-noise amplifier and a 24-bit audio analogue-to-digital converter sampling at 96 kHz on one channel. Diagnostic raw data recordings are stored locally as audio files, so that full-resolution data remain available for subsequent validation.
The signal-processing algorithm developed with Fraunhofer IKTS was ported from Python to C for on-device execution. Processing comprises windowing, a 4096-point real Fast Fourier Transform (FFT) with a 1024-sample hop, selection of the event-analysis band of approximately 2.7–9 kHz and adaptive peak detection. Extracted features include RMS amplitude, peak frequency, event counts and timing, and event and noise spectra. Single-channel processing at full spectral resolution met the real-time requirement, whereas full-resolution processing of two channels exceeded the available computation time; the final design therefore concentrates on one robustly processed measurement channel.
Compact telemetry is transmitted via LoRaWAN, with downlinks supporting time synchronization and configuration updates. Re-join logic, persistent settings and a boot counter support unattended operation and remote diagnosis. A Wi-Fi access point with a built-in web interface allows measurement parameters to be configured and recent results to be read out on site without cables or memory-card exchange. Radio and other peripheral activity are scheduled outside the acoustic acquisition windows to minimize self-generated interference.
Energy Performance and Solar-Assisted Autonomy
The change of computing architecture, the removal of subsystems not required for autonomous operation and a duty-cycled measurement regime reduced the daily energy requirement from approximately 15 Wh for Revision 1.1 to approximately 1 Wh for Revision 2.0; measured power levels were approximately 500 mW during acquisition and 25 mW in sleep mode. This improvement combines the architectural change with duty cycling and is not a comparison at identical continuous acquisition settings. The revised power supply consists of an integrated four-cell battery pack and a solar panel with a rated peak power of 10 W (Figures 9b,c).
In an outdoor power-system test of more than 72 h, the panel recharged the battery pack reliably, even under partial shading. Revision 2.0 was subsequently operated in parallel with a Revision 1.1 node on the same tree in August 2026, acquiring 60-s measurements every 20 min. With the panel facing southeast and receiving direct morning sunlight, the battery voltage reached its end-of-charge value of approximately 3.58 V within a few hours of morning sunshine each day and declined to only approximately 3.31 V overnight, indicating a substantial daily charging surplus. The evaluated telemetry contained one missing message among 949 expected LoRaWAN messages, and the boot counter recorded no unplanned restarts after commissioning. Two findings remained open: the data stream ceased on 19 August for an unresolved reason, and 26 invalid temperature readings indicated an initialization fault of an auxiliary sensor. Although the solar elevation is lower in winter, shading by the canopy is also much reduced after leaf fall, so that the harvested energy is expected to remain sufficient for the roughly hundredfold lower consumption of the duty-cycled node. Year-round autonomy remains to be demonstrated experimentally.
2.2.2. LoRaWAN Gateway, IoT and Data Dashboard
In the frame of the TreeMon project, the IoT data infrastructure was developed, which collects acquired survey data in the sparsely distributed tree sensor network and forwards that data to a centralized infrastructure (Figure 10). All data acquisition is handled reliably and energy efficient with environmental challenges, such as harsh weather conditions or urban structures, in mind.
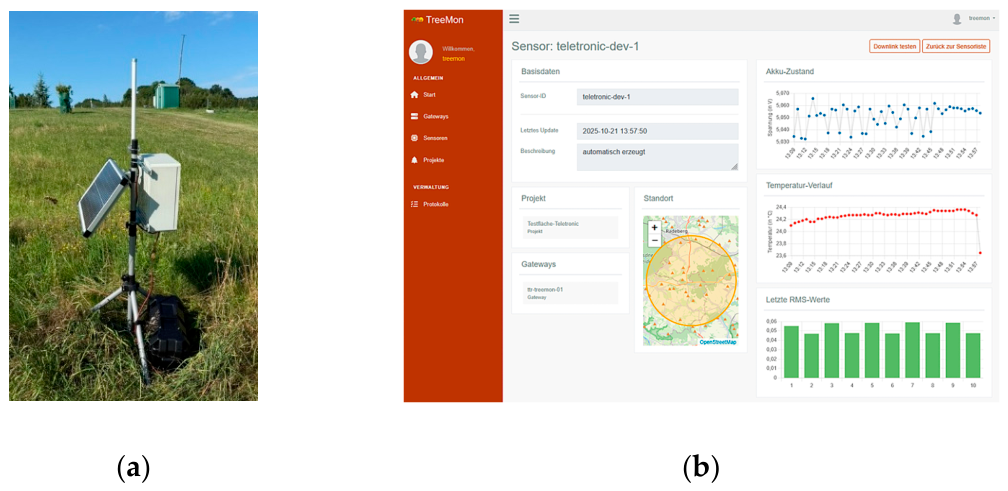
Data collection from single tree sensors is handled by a distributed LoRaWAN network. A partially public infrastructure is used. While data is kept secure and custom-made, treeGATE gateways can be set up as needed (Figure 11a). In urban areas, already available infrastructure can be used for data transfer as well. In addition to tree-related information, local meteorological data is collected for extended data processing. The weather stations can be operated at treeGATE gateways or fully autonomously.
Collected data is stored in a secure database environment, allowing for a structured access. A REST API was created as a machine-readable interface, using standardized JSON responses. A personalized authentication token is needed for authorized access. As a human-readable interface, a data dashboard was developed, allowing the filtering by gateway, region or specific sensor (Figure 11b). Graphs are created online for easily understandable data. Dashboard access is user-specific and can be limited to specific sensors to allow for an efficient multi-client infrastructure use.
Figure 11.
(a) Developed treeGATE gateway with solar panel for LoRaWAN transfer. (b) Developed data dashboard for data access and analysis of results including statistics.
Figure 11.
(a) Developed treeGATE gateway with solar panel for LoRaWAN transfer. (b) Developed data dashboard for data access and analysis of results including statistics.
2.3. Signal Processing
A particular challenge within the signal processing component of the project—especially during field measurements—arose from the presence of significant ambient noise and interference, which had to be separated from the actual signals of interest using specialized techniques. Furthermore, universal AI-based event detection and clustering methods had to be implemented to reliably count and characterize the signals originating from the trees. Both aspects are described in the following two sections.
2.3.1. Signal Enhancement and Noise Filtering
To identify relevant sounds and DAE events, it was necessary to process the recorded signals and remove noise sounds. The observed noise can be divided into two groups. There is noise that is electrically coupled. Due to the very high sensitivity of the sensors, this noise can be caused by the measurement equipment itself as well as by external sources. We have been able to identify various humming and buzzing noises as well as beeping sounds. A particular source of interference is the pasture fence in Sohra. The second group of interference noises consists of external acoustic couplings. These primarily include weather-related sounds such as wind, rain, and thunderstorms, as well as animal sounds from birds. In urban areas, machine noises from vehicles, airplanes, and agricultural machinery are also present.
Since event detection in the following section focuses on short-duration broadband signals, longer-lasting, quasi-constant disturbances like buzzing or machine noises are not relevant. The electrical beep disturbances and the interference from the pasture fence were successfully identified and removed from the event detection by identifying peaks at a defined time interval in specific frequency ranges of the signal’s short-time Fourier analysis. Bird noises were eliminated by excluding the frequency range between 2.5 and 5 kHz from the event detection.
2.3.2. Event Detection and Clustering
Analysis of the data from the first half of the project showed that the short-duration, broadband cracking sounds contain the most information about the tree’s condition and are also easily detectable in the acoustic recordings. Therefore, we focused the analysis and processing of the data on these sounds. A short-time Fourier analysis is performed here with a temporal resolution of 10 ms and a spectral resolution of 23 Hz. The sum level is then calculated in the frequency range between 1.5 and 2.5 kHz and between 5 and 10 kHz. Relevant events are detected when this total level exceeds the median value over a 2-minute period by a configurable factor. For each detected event, both its temporal position and its spectrum are stored or transmitted. Events identified as noise sound are removed beforehand.
A clustering method was used to select and sort the events. A variational autoencoder (VAE, [22]) was implemented using TensorFlow (TF, [23]) and trained using the spectra of the events. The autoencoder has three convolutional layers and two fully connected layers. The bottleneck layer has 64 neurons. A K-means clustering model was trained using the values from the bottleneck layer. Finally, the encoder from the autoencoder is connected to a matrix clustering layer initialized with the K-means matrix. The method is based on deep embedded clustering (DEC, [24]). This network is trained again with the spectra of the events and used for clustering.
2.4. Field Measurements
Following the development of the sensor node's hardware and software, numerous field measurements were conducted on various trees at different locations over periods ranging from several hours up to 2.5 months. The sensor node was powered by a rechargeable battery pack that allows for an autonomous operating time of many weeks (Figures 12a–c).
Figure 12.
Autonomous TreeMon sensor node (rev. 1.1) developed for field measurements. (a) Sensor node with two piezoelectric transducers and a battery pack for long-term monitoring. (b) Instrumented system on a fungus-infested beech tree. (c) Deployment on a bark beetle-infested pine tree.
Figure 12.
Autonomous TreeMon sensor node (rev. 1.1) developed for field measurements. (a) Sensor node with two piezoelectric transducers and a battery pack for long-term monitoring. (b) Instrumented system on a fungus-infested beech tree. (c) Deployment on a bark beetle-infested pine tree.
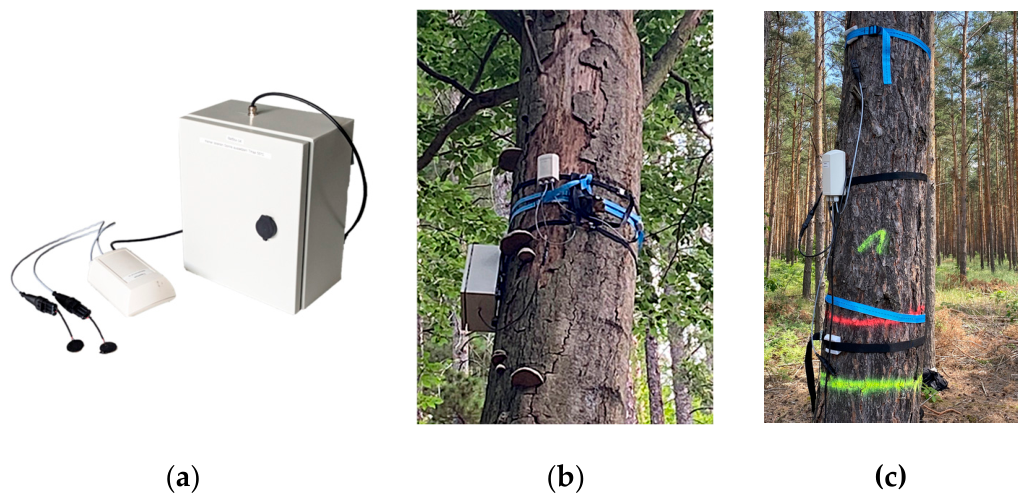
The field measurements conducted served to compare results with the initial test measurements, confirm the system's practical suitability, and—for the first time—record long-term acoustic profiles for comparison with weather data as well as dendrometer and sap flow measurements. All field measurements carried out during the project are summarized in Table 2 below. This table partially repeats entries from Table 1, since measurements using both commercial systems and the sensor node developed within the project were conducted at several locations for comparison purposes.
2.5. Dendrometer and Sap Flow Measurements
Alongside the acoustic measurements, dendrometers and sap flow monitoring systems were installed at selected sites (Sohra and Pillnitz) to identify correlations between these various measured parameters and the locally recorded weather data.
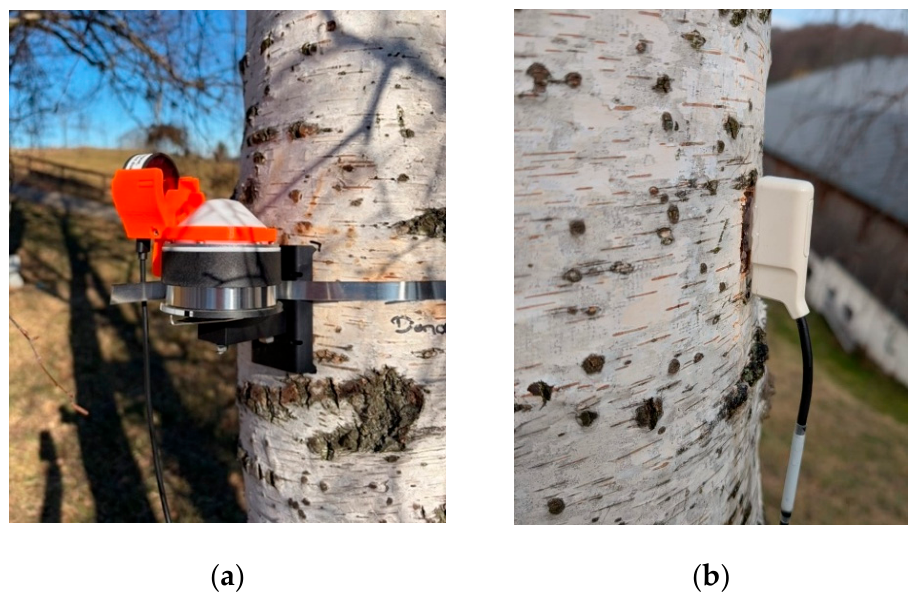
At the Sohra site, dendrometer and sap flow measurements were combined to investigate the trees' water status (Figure 13a). A DRL26D logger dendrometer was used for this purpose; it continuously recorded changes in stem circumference via a stainless-steel band attached to the trunk. This setup allows for the monitoring of both long-term growth processes and short-term fluctuations in stem circumference driven by water status. The dendrometer was installed at a height of 1.60 m, where the tree had a stem circumference of approximately 80 cm.
A SFM-5L system was used to measure sap flow; it records water transport within the xylem using a thermal measurement technique (the heat-pulse method) (Figure 13b). The determined stem dimensions also serve as a basis for the quantitative interpretation of the sap flow data. To install the sap flow meter, the outer bark was removed down to the cambium, and the sensor was then positioned on the south side of the tree at a height of 1.40 m. An additional radiation shield was installed to provide better protection against solar radiation.
Dendrometer and sap flow measurements were conducted on a birch tree from April to August 2026; starting in May 2026, intermittent dendrometer measurements were also performed on an apple tree. The birch tree—approximately 20 years old—was selected due to its high vitality and its location on a slope. Extensive acoustic test measurements and field measurements were also carried out on this tree during the course of the project.
Figure 13.
Instrumented birch tree showing the dendrometer and sap flow measurement equipment used. (a) DRL26D dendrometer logger. (b) SFM-5L sap flow meter.
Figure 13.
Instrumented birch tree showing the dendrometer and sap flow measurement equipment used. (a) DRL26D dendrometer logger. (b) SFM-5L sap flow meter.
2.6. Drone Surveys and Tree Assessments
To better assess the vitality of selected trees equipped with acoustic sensors, drone flights with systems from SZ DJI Technology Co., Ltd. using multispectral camera and Lidar technology were conducted at the Sohra and Tharandt sites. Vitality was subsequently estimated using vegetation indices derived from the optical data (Figure 14). Additionally, manual assessments were performed by tree experts in accordance with the Tharandt tree diagnosis method [25]. Due to the fact that the long-term field measurements were carried out relatively late in the project and data analysis is currently still ongoing in some areas, correlations between the vegetation indices (or vitality parameters) and the acoustic DAE profiles are not addressed further in the results section of this paper; these are reserved for future analyses and publications. Nevertheless, the drone flights and tree assessments are mentioned here for the sake of completeness, in order to illustrate the overall project design and future analysis possibilities. The relevant data are available and are intended to be used in further analyses of the acoustic profiles (see also the discussion in Chapter 4).
3. Results
This chapter presents selected results from the project obtained during testing and field measurements. These are categorized according to the four event types described in Section 1.2. First, however, the results of the acoustic coupling investigations—which formed the basis for all subsequent measurements in the project—are presented.
3.1. Coupling Variants
The investigations clearly demonstrate that mounting the sensors directly against the sapwood, the exposed cambium or the inner bark (phloem) yields the best results, i.e. received signals with the highest amplitudes (Figures 15a). The nail sensor and the variant involving direct coupling to the sapwood also exhibit high sensitivity. The nail sensor performs slightly less well, while—as expected—coupling to the outer bark yields the poorest results (Figure 15b). Based on these findings and the relatively short field measurement periods (maximum 2.5 months) in the project, the decision was made to use the surface-coupling method on the phloem or cambium, secured with an additional tensioning strap. For future long-term monitoring applications spanning many months or years, the nail sensor variant could be used instead.
3.2. Fibre Breakage
Fiber breakage events are relevant in practice for early warning prior to macroscopic branch breakage and for tree tensile tests in urban environments.
3.2.1. Branch Breakages
Manual mechanical branch-pulling and bending tests on fruit trees reveal the occurrence of numerous characteristic broadband crackling sounds. In the time domain, these appear as a sequence of short bipolar pulses (Figure 16a). The corresponding typical spectrograms (Figure 16b) show strong initial contact sounds between 0 and 6 kHz at t ≤ 1 sec, followed by small crackling bending sounds between 2 and 7 kHz for t ≥ 1 sec and t ≤ 6 sec (corresponding to the time-domain signal shown in Figure 16a), and finally a macroscopic branch fracture of moderate amplitude with frequencies ranging from 0.2 to 12 kHz at t = 6.25 sec.
3.2.2. Tensile Pull Test
The results of the pull test on the pine tree (Figure 17a) show that the maxima of the DAE event rates coincide with temporal phases of increased tensile stress. The minima coincide with the holding phases. It is also notable that higher maxima are associated with increasing tensile stress or damage. The low yet significant initial values of the curve in Figure 17b are relevant for tensile tests in urban areas involving very low tensile stresses. They indicate low but significant event rates of 1–2 events per 10 seconds, equivalent to 6–12 events per minute, which corresponds to the typical duration of a practical tensile test.
3.3. Feeding Noise of Bark Beetles
Detecting the feeding sounds of bark beetles is relevant for early infestation warnings and for estimating the degree of infestation. The study results show that these feeding sounds consist of a sequence of short, broadband separated signals (Figure 18a) between 2 and 20 kHz, predominantly in the 5–10 kHz frequency range. Trees with heavy infestation exhibit the highest event rates (Figure 18b). In contrast, very few events are recorded on uninfested reference trees during the short measurement periods of a few minutes; these likely originate from other types of DAE events. Trees with moderate or residual infestation show significantly elevated event rates. Preliminary distance measurements—which are difficult to implement and interpret in practice—indicate a maximum range of 2–3 m along the trunk for the sensors used. Consequently, infestation confined to the tree crown generally cannot be detected by sensors placed at the base of the trunk.
3.4. Draught Stress
The detection of drought stress events is relevant for identifying and assessing exposure to drought stress, as well as for evaluating vitality. Here, too, the individual events are characterized by short, broadband signals, specifically in the frequency range between approximately 1 - 25 kHz (predominantly 2 - 5 kHz, Figure 19). Event rates are low and amplitudes are small compared to those associated with bark beetles and fiber breakage.
3.4.1. Drying Experiment on Spruce Trees
The DAE event curve for the drying test of the spruce trunk stored under dry conditions exhibits three distinct phases (orange curve in Figure 20a): an initial period with rapidly increasing DAE rates during the first three days due to drought stress events (capillary collapse and micro-cracking), a peak after five days, and a phase of slowly declining AE rates associated with drying events (macro-cracks). In contrast, the reference curve for the trunk stored under humid conditions shows very low event rates (green curve). From the first Sunday onwards, both curves display a data gap of approximately two days due to technical reasons; however, this does not invalidate the general trend of the curves. The initial day is of particular interest, as the transition from capillary-induced drought stress events to crack-induced drying events is expected to occur then. A separate acoustic emission analysis reveals that, during the first few minutes and hours, a small number of weak, high-frequency events occur (blue dots in Figure 20b) that could be attributed to drought stress. Subsequently, stronger, lower-frequency events become increasingly dominant (yellow dots); these can be interpreted as events caused by micro- and macro-cracking. AE events reaching just above 150 kHz were detected, with a rate of nearly 1,000 events per hour for the dry-stored spruce trunk over a two-week period. By comparison, the spruce trunk stored in water exhibited only a few hundred AE events per hour.
3.4.2. Drying experiment on Orange and Lemon Trees
To investigate drought stress events in living trees under controlled laboratory conditions—and to examine the behavior of other tree species—acoustic and AE measurements were conducted on an orange tree and, for reference, on a lemon tree that was not subjected to drought periods. In contrast to trees previously studied in the literature, the orange tree showed no increased DAE activity during the drought phase; instead, such activity was observed only after rewatering (Figure 21). This result suggests that drought stress behavior can vary significantly among tree species and that acoustic emissions can be triggered not only by the collapse of conductive pathways but also by their reopening. Further, more detailed systematic studies are required in this regard.
3.5. Sap Flow
The subject of sap flow is relevant to long-term monitoring and the assessment of tree vitality and resilience. To place the numerous anecdotal reports found online regarding audible sap flow noise on a scientific footing, various studies were conducted and analyzed on different trees—including birches in the spring—using a commercial acoustic system with a contact microphone, an acoustic emission system, and a digital stethoscope with a recording function.
3.5.1. The Futile Search for Sap Flow Noise
Despite the use of sophisticated noise analysis algorithms, the investigations yielded no evidence that the sap flow manifests as a modified noise signal. Instead, it is suspected that the frequently reported audible noise is an illusory sound—much like the perceived sound of the ocean heard when holding a seashell to one's ear. Further in-depth investigations involving the orange tree described in Section 3.4.2 demonstrate that such measurements require great care in both execution and interpretation (Figure 22).
For instance, the laboratory results shown in Figure 22 appear to show the noise signal in the spectrogram changing periodically over the course of the day, correlating with the duration of sunshine. Specifically, a rise in level is observed in the afternoon during periods of direct sunlight. The intensity and "sharpness" of this level rise correlate with the hours of sunshine and the readings from the brightness sensor. While one might theoretically expect such behavior from sap flow, the same pattern persists even when the sensor is removed from the tree! Consequently, the measurement effect observed here proves to be purely a temperature effect, acting directly on sensor and electronics and influencing the noise they introduce into the measurement signal.
Even though the results cannot be generalized to other tree species, all indications (including our findings on outdoor birches not shown here) suggest that the sap flow signals described in lay literature are scientifically untenable. At the very least, they could not be verified in the present case.
3.5.2. Individual Sap Flow Events
In contrast to the assumption of sap flow noise discussed in the previous section, our DAE rates recorded on birches during the field trials at Sohra site indicate that sap flow might be associated with characteristic changes in AE event statistics. This is suggested by a comparison with simultaneously recorded dendrometer and sap flow sensor data (Figure 23). In this example, high DAE event rates show a striking correlation with the maxima of tree diameter and sap flow, whereas DAE minima correlate with the minima of the dendrometer and sap flow measurements. However, a cause-and-effect relationship cannot yet be inferred from this, particularly since some of the additionally collected weather data also correlate with the acoustic profile (see Section 3.7).
A striking feature of the dendrometer data shown in Figure 23b is that the birch tree under study does not increase in diameter at night—as would be expected according to standard theory—but rather exhibits maximum expansion during the day and minima at night. This anomalous pattern is confirmed by independently collected sap flow data (Figure 23c), which show distinct minima at night and maxima during the day. It is hypothesized that this anomalous behavior of the birch is attributable to the early timing of the measurements in March/April 2026, occurring shortly before and during the period of new shoot emergence. Additional measurements taken during May and June 2026 are currently being analyzed. The acoustic findings from the TreeMon node (Figure 23a) were corroborated by separate acoustic emission measurements using a Vallen linWave system on the first day (Figure 24); these also reveal a characteristic minimum during the night of April 29, 2026, followed by a plateau during the following day.
3.6. Acoustic Long-Term Profiles of Different Trees
The sensor node developed during the project makes it possible to record and compare long-term acoustic profiles of various trees over periods of days, weeks, or evenmonths. Figure 25 shows long-term acoustic profiles successfully measured at the “future tree area” in Dresden-Pillnitz over the entire measurement period of nearly 12 days. None of the events show a strong correlation with wind (based on data from the DWD weather station at DD-Klotzsche); instead, they exhibit a visible—albeit irregular—daily rhythm, partially overlaid by additional sub-daily patterns. The elm shows significantly more events than the Norway maple, demonstrating that different trees can exhibit distinct acoustic behavior even under otherwise identical weather conditions. However, the general fluctuation of the curves over time is very similar for both trees.
3.7. Correlation with Weather Data
The weather data collected alongside the dendrometer and sap flow measurements at the birch discussed in section 3.5.2 also show a striking correlation with the acoustic data. For instance, sun radiation values and air temperature during the time interval shown here correlate well with the minima and maxima of the DAE event rates (Figure 26).
Figure 27 displays heatmaps of acoustic DAE event rates for two birch trees situated in immediate proximity to one another over the entire 2.5-month measurement period, alongside corresponding heatmaps for selected weather data such as rainfall, wind speed, air temperature, and radiation levels. The acoustic event rates of the two birch trees (Figures 27a,b) generally exhibit very different patterns; this illustrates that individual trees of the same species can display distinct acoustic behaviors and that the acoustic profiles do not merely reflect local, short-term weather conditions (which would be identical for the two trees). However, both trees share the characteristic of exhibiting significantly more acoustic events during the day than at night. That said, there is no distinct period of nocturnal quiescence, as evidenced, for example, by the radiation heatmap (Figure 27f). Radiation levels—as well as the air temperature shown in Figure 27e—rise markedly towards the end of the measurement period depicted here (early May 2026). This trend is not reflected in the acoustic profiles. This further suggests that the acoustic profiles do not primarily track individual weather parameters but rather exhibit unique characteristics that may be influenced by a combination of factors.
The precipitation events shown in Figure 27c show a certain correlation with phases of intense acoustic activity. Although the acoustic events caused by raindrops are generally filtered out by the detection algorithm, confusion with actual DAE signals cannot be entirely ruled out, particularly during heavy rainfall. It is possible that the correlation described above is also driven by sap-flow-related DAE signals, though the available data do not provide conclusive evidence of this.
Wind data as given in Figure 27d show only a very weak correlation—if any—with the acoustic activity. In particular, the corresponding heatmap reveals that periods of high wind speed lead to intense DAE activity only occasionally, and by no means consistently.
In the future, further systematic long-term measurements and statistical correlation analyses are needed in order to provide robust evidence or non-evidence for different correlations between DAE events and weather data.
3.8. Public Demonstrator
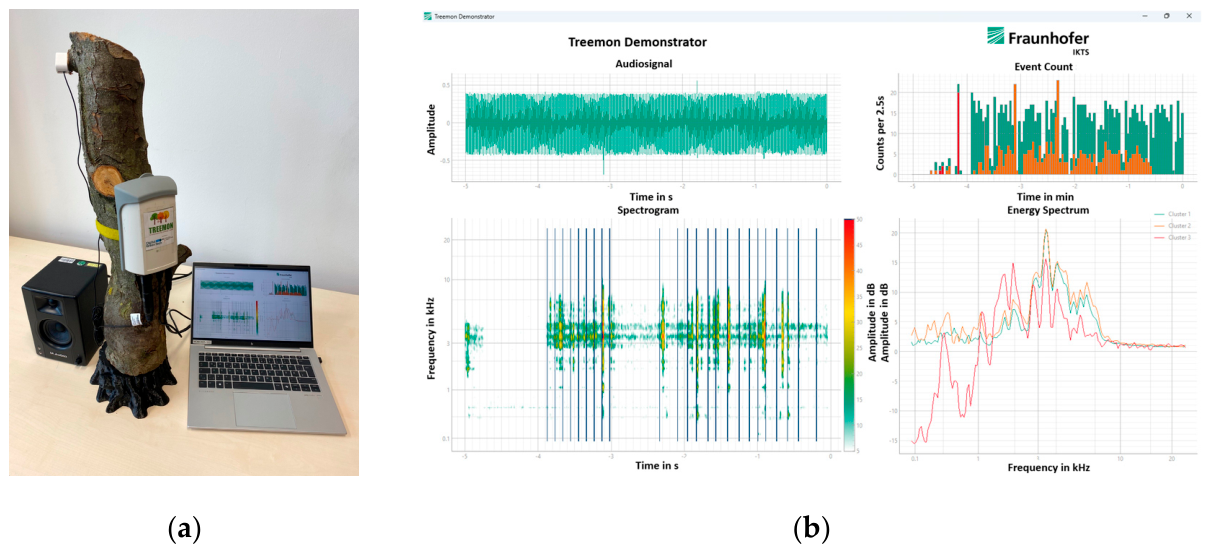
In addition to the actual sensor node, an interactive demonstrator designed to engage the public was also set up. It illustrates how the TreeMon system enables the measurement of structure-borne sound for the condition monitoring of standing trees (Figure 28). Concealed within the (3D-printed) root section at the base of the demonstrator is a structure-borne sound transducer; this injects characteristic sounds—previously recorded during the project—directly into the tree trunk, thereby simulating acoustic signals within the wood such as those caused by bark beetles or fiber fractures. Additionally, users can manually generate various acoustic events on the trunk by rubbing, tapping, or scraping it.
A contact microphone is attached to the upper end of the trunk; it converts the acoustic waves transmitted through the trunk into electrical signals. The signal is then transmitted via a recording device to a Laptop, where it is analyzed using specialized software and rendered audible. The user can then listen to the amplified signals via loudspeakers. This allows the operating principle of the TreeMon sensor node to be demonstrated clearly and intuitively, without requiring an actual—potentially sick—tree. At the same time, the analysis software displays the signal on the monitor, analyzes it in real time, and clusters the information using the clustering method described in Section 2.3.2. This process categorizes the detected sounds into three classes and displays the mean spectrum for each class in a chart (using green, yellow, and red colors). This illustrates the various sounds detected automatically, with the averaged spectrum serving as a simple indicator of the type of sound.
Figure 28.
Components of the developed public demonstrator. (a) Hardware setup comprising a tree model, TreeMon sensor node, actuator, sensor, loudspeaker, and laptop. (b) Software GUI with real-time imaging and analysis for visualizing various excitations.
Figure 28.
Components of the developed public demonstrator. (a) Hardware setup comprising a tree model, TreeMon sensor node, actuator, sensor, loudspeaker, and laptop. (b) Software GUI with real-time imaging and analysis for visualizing various excitations.
4. Discussion and Conclusions
The sensor node developed as part of the TreeMon project and successfully tested in the field has demonstrated the feasibility of automatically recording various dendroacoustic emissions (DAE) from standing trees using highly sensitive piezoelectric sensors, performing local signal evaluation, and transmitting the results to a base station via a LoRaWAN interface. The sensor node can be individually configured or operated in various modes; for instance, for R&D purposes, complete raw datasets—or selected portions thereof—can be stored locally on the node and retrieved as needed. In standard mode, the actual analysis of raw data takes place within the node itself: the system automatically detects and clusters relevant DAEs and transmits them externally via LoRaWAN in the form of acoustic event rates.
This universal, automated analysis is made possible by the fact that all event types investigated in the project share the same characteristic of being short, broadband signals. However, they differ by event type in terms of frequency of occurrence, intensity, center frequency, and bandwidth, thereby allowing for the characterization and clustering of different events. Typically, such analysis cannot be performed based on individual signals alone but requires statistical data derived from a large number of single events. The project verified all four event types described in the literature and subjected them to detailed examination.
Fiber fractures can be reliably detected as precursors to macroscopic branch failures. They generally manifest as faint, repetitive crackling sounds in the frequency range between approximately 2 and 7 kHz. Determining the typical advance warning times prior to branch failure would require systematic studies on trees prone to or affected by branch breakage—potentially involving the application of progressively increasing mechanical loads using artificial weights. Such experiments entail extensive safety and cordoning measures and could not be implemented within the scope of the TreeMon project; they remain a task for future projects focused on public safety.
Our results from the tensile pull test suggest that a small number of significant fiber-breakage events occur even during the early stages of tensile tests. Detecting and analyzing these events could provide valuable additional information and meaningfully complement standard tensile test analysis. Given the low number of acoustic emission events expected during a typical one-minute tensile test, implementation requires highly precise and reliable event detection. Future projects should systematically investigate the number of fiber breaks occurring as a function of mechanical load, the locations within the tree from which these events originate, and the most effective and reliable methods for their detection.
The TreeMon system also successfully detected feeding sounds produced by beetles, particularly bark beetles. These events also occur in frequent temporal clusters and exhibit high signal strength. The typical frequency range lies between 2 and 20 (predominantly 5-10) kHz. Translating these findings into a field-ready application for identifying and analyzing infestations would require systematic studies on detection range—studies that are, in practice, very difficult to conduct using live bark beetles. The TreeMon project carried out an initial test of this kind on a freshly felled spruce. While the results could not always be interpreted conclusively, they indicate that the effective detection range is likely in the order of 2–3 meters at most. Further systematic studies on various tree species are needed to verify and quantify this figure.
Drought stress events can be identified during the early stages of laboratory-based drying experiments; however, in the field, they are difficult to unequivocally detect due to their low signal strength. Definitive detection would only be possible on a statistical basis through controlled drought and rehydration experiments in tree nurseries or other experimental areas. Such experiments were beyond the scope of the TreeMon project and should be the subject of future systematic investigations. The DAEs recorded during the project and identified as drought stress events fell within the minimum amplitude range and exhibited a high frequency bandwidth between approximately 1 - 25 kHz with main contributions between 2 - 5 kHz. Furthermore, the project demonstrated that, in addition to the DAEs associated with the collapse of conductive pathways, characteristic events can also occur during the reverse reopening process—rehydration. This phenomenon warrants investigation in future systematic comparative studies involving various indoor and outdoor trees subjected to controlled dry and wet phases.
Following the initial systematic long-term trials, tree sap flow exhibits correlations with acoustic profiles that are in some cases striking; these require further investigation, given that various weather data also track the fluctuations in DAE events. Due to these complex findings, it is not yet possible to establish definitive cause-and-effect relationships. Systematic statistical correlation analyses currently underway may yield further insights. However, a systematic approach incorporating extended measurement periods and a variety of trees and species remains a task for future projects.
The DAEs associated with sap flow still need to be acoustically characterized in detail. Since DAEs linked to drought stress are invariably associated with sap flow in real-world conditions, explicitly distinguishing between the two types of events is usually neither feasible nor particularly meaningful in practice. This hypothesis, too, warrants investigation in future projects involving prolonged or recurring drought periods.
Further audiovisual representations of characteristic spectrograms of the main types of DAE events can be found in the supplementary materials section of this paper.
The TreeMon project has, for the first time, created the technical capability to autonomously identify and classify dendroacoustic emissions (DAEs) from standing trees. These emissions are then transmitted to a base station as temporal acoustic profiles—that is, time series of acoustic event rates—where they can be analyzed, compared and correlated with any available dendrometer, sap flow, and weather data. By the end of the project, a total of six TreeMon sensor nodes is available for further field measurements. Potential applications of the system primarily include
- to identify and classify at an early stage significant damage and diseases that could compromise tree safety,
- to propose timely measures to prevent tree death or damage and enable more stable, higher yields in fruit growing, and
- to evaluate the effectiveness of long-term forestry measures (e.g., the cultivation of mixed forests or non-native tree species) and, where appropriate, serve as a basis for their adjustment or modification.
From a long-term perspective, the unique feature of the TreeMon approach is that, in principle, all these tasks could be accomplished using a single physical measurement principle: the detection of dendroacoustic emissions (DAE). Nevertheless, each of the aforementioned fields of application presents specific characteristics that require systematic investigation in future projects, leading to specific hardware and software adaptations and optimizations. As things stand, the detection of bark beetle infestation and its severity, as well as the early detection of risks associated with branch failure, represent obvious application scenarios that could be rapidly implemented in practice. The use of the TreeMon system would be particularly sensible—and economically justifiable—for park trees with pre-existing damage and for tree species prone to spontaneous branch failure, such as the gum trees (Eucalyptus) that are widespread in Australia and feared as "widow-makers."
Building on the two sensor-node generations as described in section 2.2.1, two complementary monitoring approaches are envisaged. The raw-data-oriented Revision 1.1 lends itself to R&D projects with the need for raw data analysis as well as to active diagnosis using induced acoustic excitation, for example as an objective additional data source when assessing the stability of urban trees. The energy-autonomous Revision 2.0 is intended for passive long-term monitoring, tracking gradual changes in acoustic event activity over seasons and years at low maintenance effort. The parallel operation of both revisions has established a direct comparison basis between full raw-data recording and on-device event detection. Validating the physiological interpretation of the detected events against the stored raw data recordings and independent tree vitality assessments as described in Section 2.6 are the immediate next steps.
Supplementary Materials
The following supporting information can be downloaded at the website of this paper posted on Preprints.org, Video S1: Spectrogram_Video_Audio_BarkBeetles_Severe_Infestation.mp4, Video S2: Spectrogram_Video_Audio_Drying-Test_Day1_Drought_stress_events.mp4, Video S3: Spectrogram_Video_Audio_BranchBendingTest_FruitTree.mp4, Video S4: Spectrogram_Video_Audio_Birch_During_Wind_Maximum.mp4.
Author Contributions
Conceptualization, F.S.; methodology, F.S., F.D., M.K., C.Z, M.H., M.B. and R.G.; software, M.H. and F.D.; validation, F.D., M.R, M.B. and R.G.; formal analysis, F.D., C.Z. and R.G.; investigation, F.D., M.R., M.K., C.Z., S.W., C.S. and M.B.; resources, A.W., W.S. and C.H.; data curation, F.D.; writing—original draft preparation, F.S.; writing—review and editing, F.S., F.D., M.H., S.W., C.S., M.K., C.Z., C.H. and M.R.; visualization, F.D., M.K., M.H., M.R., C.Z., C.H., S.W. and C.F.; supervision, A.W., F.S. and W.S.; project administration, A.W. and F.S.; funding acquisition, F.S. and A.W. All authors have read and agreed to the published version of the manuscript.
Funding
This research was funded by the German Bundesministerium für Forschung, Technologie und Raumfahrt (BMFTR) in the frame of the collaborative research project “TreeMon: Entwicklung eines autonomen Schallemission-Sensorknotens für das Zustandsmonitoring von stehenden Bäumen” under grant number 02WDG1698B within the funding program ‘Digital Green Tech 2’.
Data Availability Statement
Datasets are available on request from the authors.
Acknowledgments
The authors would like to thank the company ‘Wald und Baum’ for their continuous support in assessing the vitality of the trees examined during the project.
Conflicts of Interest
The authors declare no conflicts of interest.
Abbreviations
The following abbreviations are used in this manuscript:
| AE | Acoustic Emission |
| DAE | Dendro-Acoustic Emission |
| DEC | Deep Embedded Clustering |
| DWD | Deutscher Wetter Dienst (German Weather Service) |
| GUI | Graphical User Interface |
| RMS | Root Mean Square |
| TF | Tensor Flow |
| VAE | Variational Autoencoder |
References
- Stobbe, H.; Kowol, T.; Jaskula, P.; Wilstermann, D.; Düsterdiek, S.; Wilm, P.; Vogel, T.; Dujesiefken, D. Verkehrssicherheit und Baumkontrolle, Der Praxisleitfaden zu den FLL-Baumkontrollrichtlinien; Haymarket Media: Braunschweig, Germany, 2020; ISBN 978-3-87815-269-9. In German. [Google Scholar]
- Rust, S. Geräte und Verfahren zur eingehenden Baumuntersuchung. In Ulmer Verlag, Stuttgart, Germany, leicht überarbeitete Fassung; Baumpflege, Roloff, A., Eds.; Available online: http://baumtomographie.de/pubs/Baumdiagnose_Geraete.pdf (accessed on 8.10.2026).
- Forstliches Umweltmonitoring in Deutschland, Durchführungskonzept Forstliches Umweltmonitoring, Bundesministerium für Ernährung und Landwirtschaft, BMEL, Germany, Oktober 2016. Available online: https://www.bmleh.de/SharedDocs/Downloads/DE/_Wald/ForstlichesUmweltmonitoring.pdf?__blob=publicationFile&v=5 (accessed on 8.10.2026).
- TreeNet - The biological drought and growth indicator network. Available online: https://treenet.info (accessed on 8.10.2026).
- Zweifel, R.; Etzold, S.; Basler, D.; Bischoff, R.; Braun, S.; Buchmann, N.; Conedera, M.; Fonti, P.; Gessler, A.; Haeni, M.; Hoch, G.; Kahmen, A.; Köchli, R.; Maeder, M.; Nievergelt, D.; Peter, M.; Peters, R.L.; Schaub, M.; Trotsiuk, V.; Walthert, L.; Wilhelm, M.; Eugster, W. TreeNet–The Biological Drought and Growth Indicator Network. Front. For. Glob. Change 2021, Vol. 4. [Google Scholar] [CrossRef]
- Ponomarenko, A.; Vincent, O.; Pietriga, A.; Cochard, H.; Badel, E.; Marmottant, P. Ultrasonic emissions reveal individual cavitation bubbles in water-stressed wood. J. R. Soc. Interface 2014. [Google Scholar] [CrossRef] [PubMed]
- Améglio, T. Project ACOUFREEZE – Monitoring of cold stress in trees by acoustic emission technique. ANR France. Available online: https://anr.fr/Project-ANR-11-ISV7-0003 (accessed on 8.10.2026).
- Charrier, G.; et al. Detecting cellular damages in freezing plants: Are acoustic emissions useful? 2021 IEEE International Workshop on Metrology for Agriculture and Forestry (MetroAgriFor), 2021; pp. 140–144. [Google Scholar]
- Clauss, S.; Bächle, F.; Niemz, P. Experimentelle Untersuchungen zur radialen Durchschallung von Stämmen mittels variabler Frequenz. Holz. Roh. Werkst. in German. 2007, Vol. 65, 95–103. [Google Scholar] [CrossRef]
- Zweifel, R.; Zeugin, F. Ultrasonic acoustic emissions in drought-stressed trees—more than signals from cavitation? New Phytol. 2008, Vol. 179, 1070–79. [Google Scholar] [CrossRef] [PubMed]
- De Roo, L.; Vergeynst, L.L.; De Baerdemaeker, N.J.F.; Steppe, K. Acoustic Emissions to Measure Drought-Induced Cavitation in Plants. Applied. Sci. 2016, Vol. 6, 71ff. [Google Scholar] [CrossRef]
- Ikeda, T.; Ohtsu, M. Detection of xylem cavitation in field-grown pine trees using the acoustic emission technique. Ecol. Res. 1992, Vol. 7, 391–395. [Google Scholar] [CrossRef]
- Mazal, P.; Nohal, L.; Cermák, J.; Černý, M. Measurements of acoustic emission in evaluating of sap flow in trees. ISHS Acta Horticulturae 951: VIII International Symposium on Sap Flow 2012, 309–316. [Google Scholar] [CrossRef]
- Schmid, E.A. Ultraschallemissionen als Wasserstress-Signale an gärtnerischen Kulturpflanzen; Dissertation: Justus-Liebig-Universität Giessen, Germany, 2010; In Germany. [Google Scholar] [CrossRef]
- Tötzke, C. Untersuchungen über den Zustand tensilen Wassers in Bäumen. In Dissertation. FU Berlin; in German; 2008. [Google Scholar] [CrossRef]
- Tschöpe, C.; Duckhorn, F.; Pietzsch, A.; Lieske, U. Akustische Mustererkennung zur automatischen Schädlingserkennung. Proc. DACH-Jahrestagung, Salzburg, Austria, 11.-13. Mai 2015; Available online: https://jt2015.dgzfp.de/Portals/jt2015/BB/mi2a4.pdf (accessed on 8.10.2026).
- Lieske, U.; Duckhorn, F.; Tschöpe, C.; Harig, P.; Pallmer, M.; Röder, O.; Röder, E. Verfahren zur akustischen Detektion von Schadinsekten bei der Getreide- und Saatgutlagerung. Proc. DGZfP Jahrestagung, Koblenz, Germany, 22.-24. Mai 2017; Available online: https://www.ndt.net/search/docs.php?id=21513 (accessed on 8.10.10262).
- Vian, J.L. Forest Sensor Deployment and Monitoring System. 2 February 2016. Available online: https://patents.google.com/patent/US20140077969A1/en (accessed on 8.10.2026).
- Li, T.; Molina Hoyos, E.; West, C. Acoustic Emissions Tree Monitoring System (2021). Honors Capstones. 101, Northern Illinois University, Undergraduate Research. Available online: https://api.semanticscholar.org/CorpusID:234756976 (accessed on 8.10.2026).
- Valentini, R.; Belelli Marchesini, L.; Gianelle, D.; Sala, G.; Yarovslavtsev, A.; Vasenev, V.; Castaldi, S. New tree monitoring systems: from Industry 4.0 to Nature 4.0. Ann. Silvic. Res. 2019, Vol. 43(2), 84–88. [Google Scholar] [CrossRef]
- Hill, A.P.; Prince, P.; Snaddon, J.L.; Doncaster, C.P.; Rogers, A. AudioMoth: A low-cost acoustic device for monitoring biodiversity and the environment. HardwareX 2019, Vol 6. [Google Scholar] [CrossRef]
- Pinheiro Cinelli, L.; et al. Variational autoencoder. Variational methods for machine learning with applications to deep networks; Springer International Publishing, 2021; pp. 111–149. [Google Scholar]
- Abadi, M.; et al. TensorFlow: A system for Large-Scale machine learning. Proc. of the 12th USENIX Symposium on Operating Systems Design and Implementation (OSDI ’16)., Savannah, GA, USA; 2–4 November 2016. Available online: https://www.usenix.org/system/files/conference/osdi16/osdi16-abadi.pdf (accessed on 8.10.2026).
- Guo, X.; Liu, X.; Zhu, E.; Yin, J. Deep Clustering with Convolutional Autoencoders. In Neural Information Processing. ICONIP 2017. Lecture Notes in Computer Science; Liu, D., Xie, S., Li, Y., Zhao, D., El-Alfy, E.S., Eds.; Springer International Publishing: Cham; Vol. 10635. [CrossRef]
- Weiß, H.; Roloff, A.; Goede, M. Tharandter Baumdiagnose - Ein integriertes Verfahren zur Beurteilung von Problembäumen. AFZ-Der Wald 2004, Vol. 2, 52–55. Available online: https://www.yumpu.com/de/document/read/2873654/tharandter-baumdiagnose-ein-integriertes-verfahren/1 (accessed on 8.10.2026).
Figure 1.
Commercial acoustic equipment for the initial test and laboratory measurements. (a) Zoom F8n with 8 input channels, a frequency range from 10 Hz to 80 kHz, and a sampling rate of 192 kHz. (b) AKG C411 contact condenser microphone with a frequency range of 20 Hz to 16 kHz, a sensitivity of 2 mV/Pa, and dimensions of approximately 10 x 14 mm.
Figure 1.
Commercial acoustic equipment for the initial test and laboratory measurements. (a) Zoom F8n with 8 input channels, a frequency range from 10 Hz to 80 kHz, and a sampling rate of 192 kHz. (b) AKG C411 contact condenser microphone with a frequency range of 20 Hz to 16 kHz, a sensitivity of 2 mV/Pa, and dimensions of approximately 10 x 14 mm.
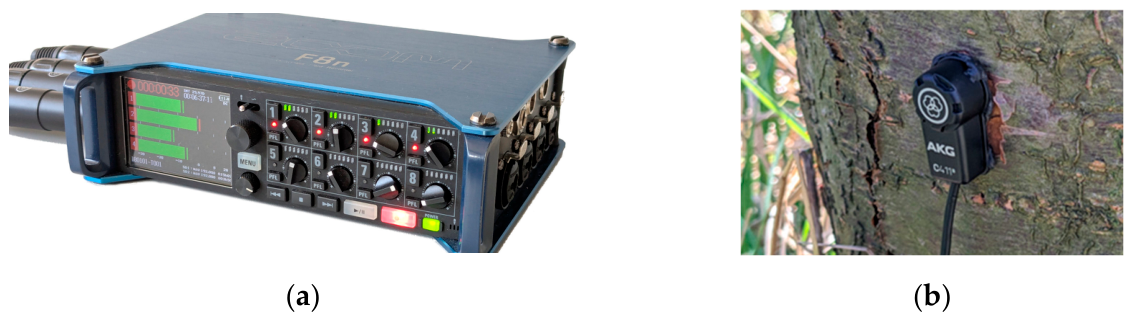
Figure 2.
Acoustic emission equipment for the initial test and laboratory measurements. (a) HBM GEN3i transient recorder with 8 channels, a maximum sampling rate of 100 MS/s, and 14-bit resolution (operated with various IKTS preamplifiers). (b) Acoustic sensor KAR 601S (IKTS) with a frequency range from 100 to 500 kHz and an active surface diameter of 4 mm (suitable for direct contact application or for mounting on the head of a pin or nail.
Figure 2.
Acoustic emission equipment for the initial test and laboratory measurements. (a) HBM GEN3i transient recorder with 8 channels, a maximum sampling rate of 100 MS/s, and 14-bit resolution (operated with various IKTS preamplifiers). (b) Acoustic sensor KAR 601S (IKTS) with a frequency range from 100 to 500 kHz and an active surface diameter of 4 mm (suitable for direct contact application or for mounting on the head of a pin or nail.
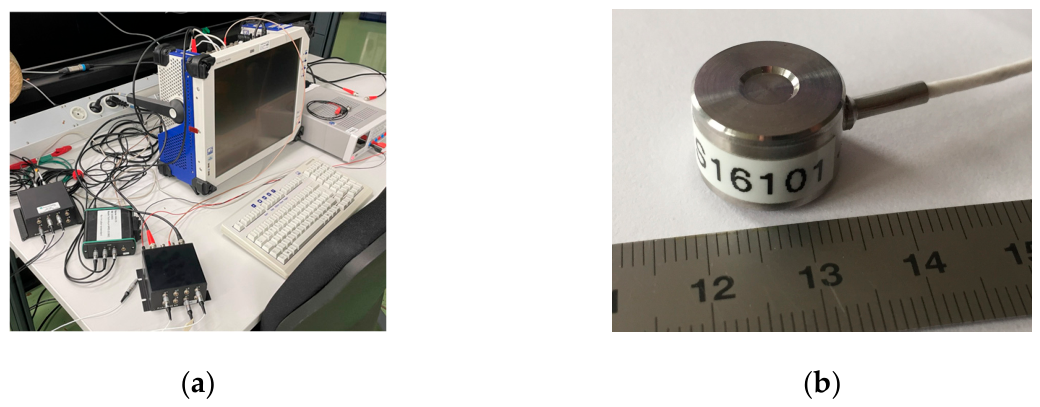
Figure 3.
Various coupling methods implemented and compared during the test measurements. (a) Schematic of the four basic options: 1 (on sapwood), 2 (nail/pin in sapwood), 3 (on phloem), 4 (on outer bark). (b) Surface coupling on an exposed section of sapwood (variant a1), directly on the outer bark (variant a4) and on the phloem (variant a3). (c) Pin or nail sensor driven directly through the outer bark into the sapwood (variant a2).
Figure 3.
Various coupling methods implemented and compared during the test measurements. (a) Schematic of the four basic options: 1 (on sapwood), 2 (nail/pin in sapwood), 3 (on phloem), 4 (on outer bark). (b) Surface coupling on an exposed section of sapwood (variant a1), directly on the outer bark (variant a4) and on the phloem (variant a3). (c) Pin or nail sensor driven directly through the outer bark into the sapwood (variant a2).
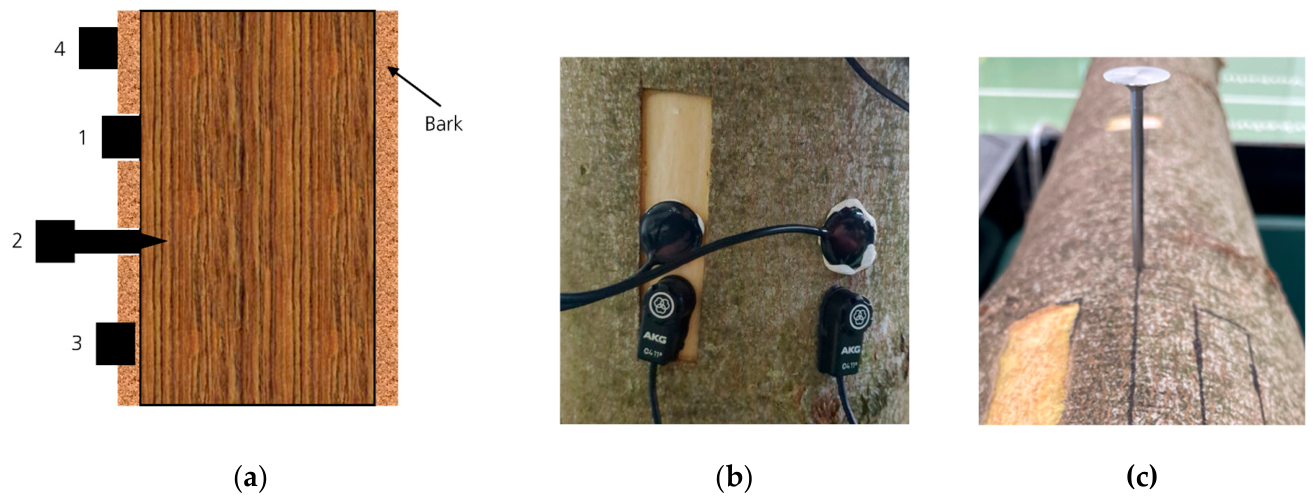
Figure 4.
Freshly felled spruce log (foreground) with the various instrumented actuators and sensors used for sensitivity comparisons. The travel path of the excited waves within the spruce log was approximately 80 cm.
Figure 4.
Freshly felled spruce log (foreground) with the various instrumented actuators and sensors used for sensitivity comparisons. The travel path of the excited waves within the spruce log was approximately 80 cm.
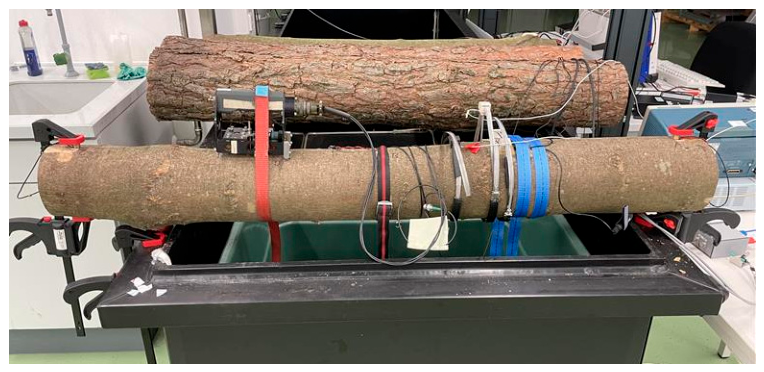
Figure 5.
Laboratory-based drying test with two freshly cut spruce trunks, one reference trunk stored under humid conditions and the other under dry conditions. Measurements were taken using both the low-frequency acoustic measurement system and the high-frequency transient recorder (visible right in the image).
Figure 5.
Laboratory-based drying test with two freshly cut spruce trunks, one reference trunk stored under humid conditions and the other under dry conditions. Measurements were taken using both the low-frequency acoustic measurement system and the high-frequency transient recorder (visible right in the image).
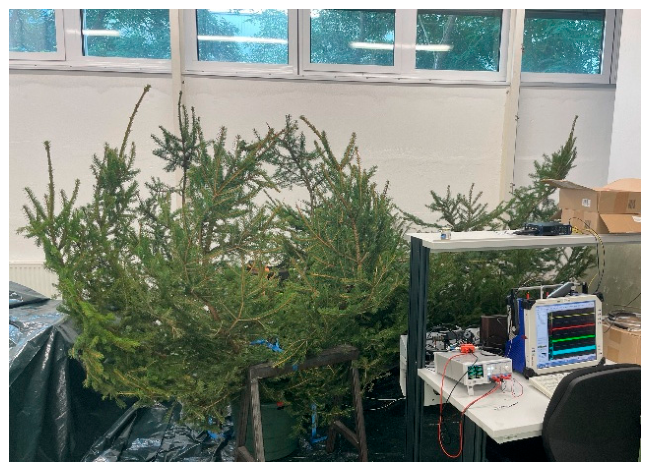
Figure 7.
Various locations for test measurements in the field. (a) Bark beetle measurements in the forest near Senftenberg. (b) Pull test on a plane tree in Dresden. (c) Felled pine tree used for initial estimates of the range of bark beetle feeding sounds.
Figure 7.
Various locations for test measurements in the field. (a) Bark beetle measurements in the forest near Senftenberg. (b) Pull test on a plane tree in Dresden. (c) Felled pine tree used for initial estimates of the range of bark beetle feeding sounds.
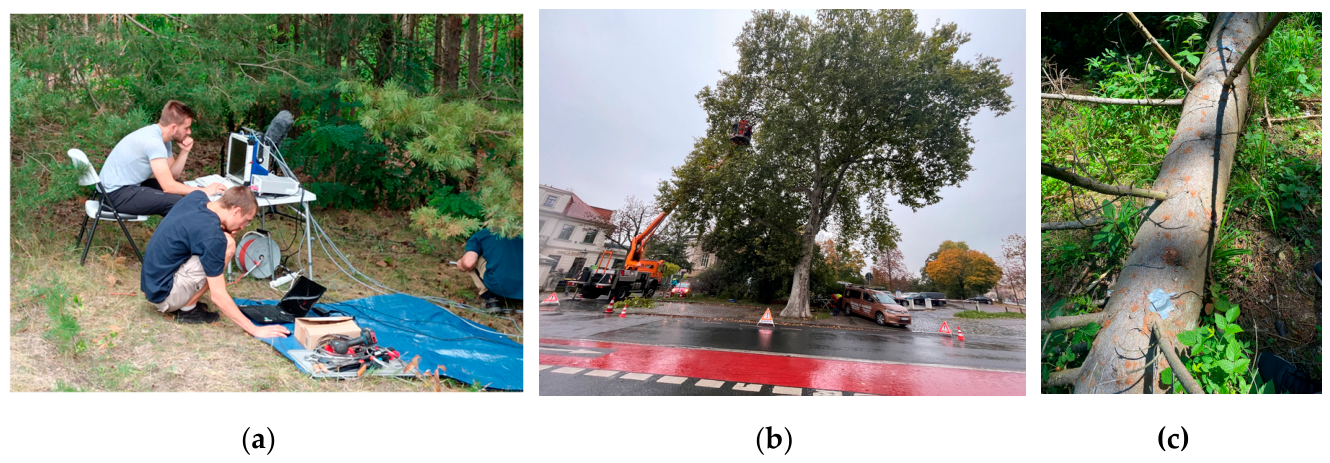
Figure 8.
Pull test of a bark beetle-infested pine tree in the forest near Senftenberg until complete toppling. Between the loading phases—each involving an increase in load—periodic holding phases without further load increases were implemented. (a) Early pulling phase. (b) Later pulling phase. (c) Pine tree after stem breakage.
Figure 8.
Pull test of a bark beetle-infested pine tree in the forest near Senftenberg until complete toppling. Between the loading phases—each involving an increase in load—periodic holding phases without further load increases were implemented. (a) Early pulling phase. (b) Later pulling phase. (c) Pine tree after stem breakage.
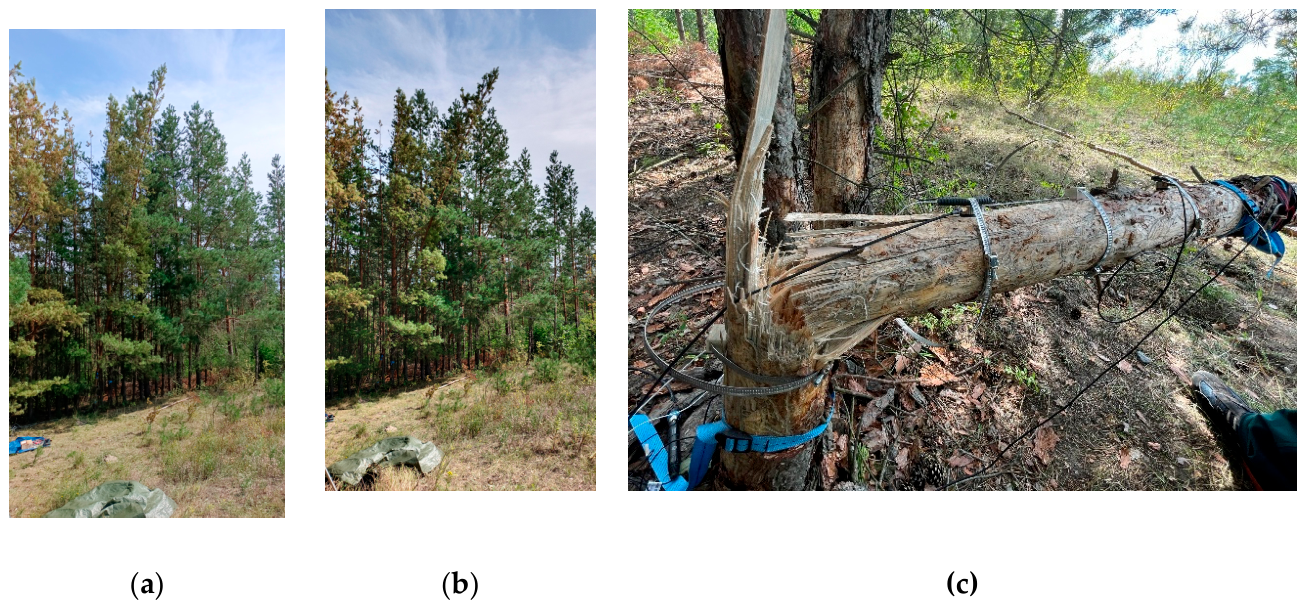
Figure 10.
Scheme of data flow and IoT infrastructure for the TreeMon system.
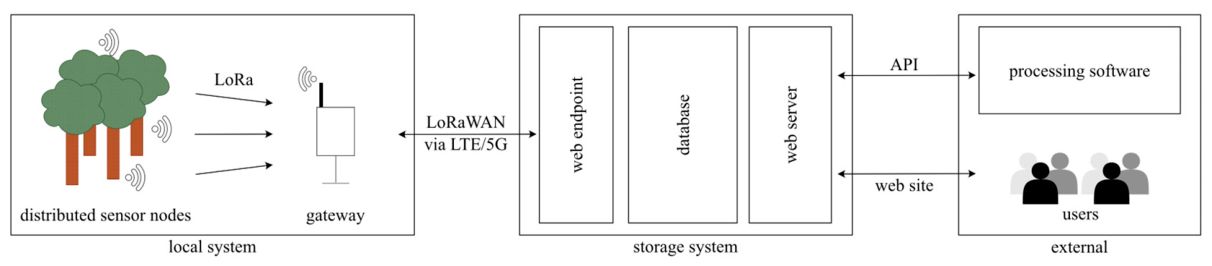
Figure 14.
Areas documented using drones and optical cameras. (a) Optical visualization of the drone flight over the Sohra fruit orchard. (b) Optical and IR visualization of the drone flight over the forest botanical garden in Tharandt.
Figure 14.
Areas documented using drones and optical cameras. (a) Optical visualization of the drone flight over the Sohra fruit orchard. (b) Optical and IR visualization of the drone flight over the forest botanical garden in Tharandt.
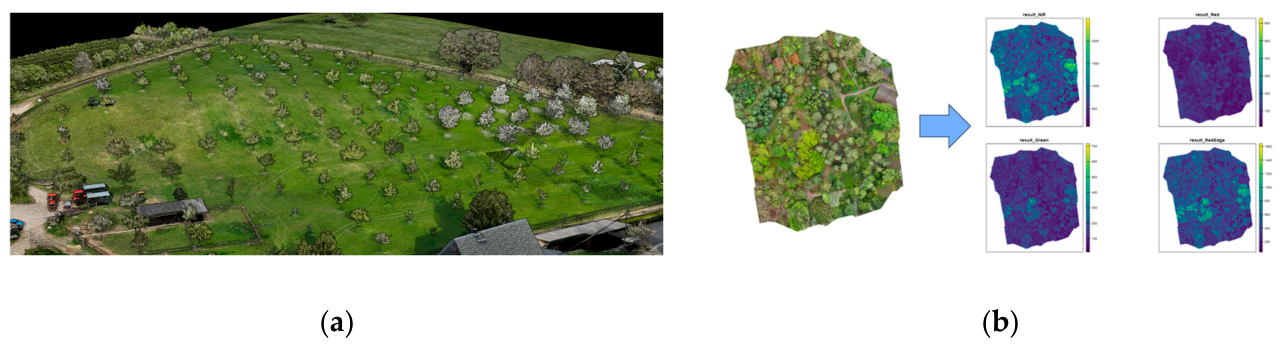
Figure 15.
Selected results of the coupling investigations. Surface coupling on the sapwood or phloem proves to be the most sensitive method. (a) Sensitivity comparison of coupling methods 1, 3, and 4 from Figure 3a in the frequency domain for the AKG C411 condenser microphone using a 10 kHz broadband excitation. (b) Sensitivity comparison of coupling methods 1 (sapwood, red signal) and 4 (bark, blue signal) from Figure 3a in the time domain for the KAR 601 S acoustic emission sensor using the same 20 kHz broadband excitation.
Figure 15.
Selected results of the coupling investigations. Surface coupling on the sapwood or phloem proves to be the most sensitive method. (a) Sensitivity comparison of coupling methods 1, 3, and 4 from Figure 3a in the frequency domain for the AKG C411 condenser microphone using a 10 kHz broadband excitation. (b) Sensitivity comparison of coupling methods 1 (sapwood, red signal) and 4 (bark, blue signal) from Figure 3a in the time domain for the KAR 601 S acoustic emission sensor using the same 20 kHz broadband excitation.
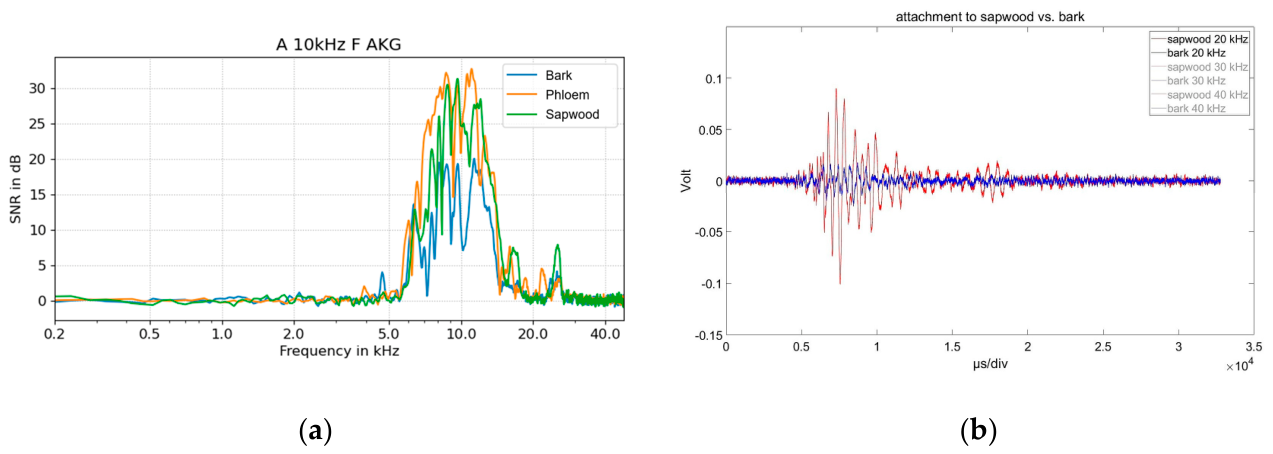
Figure 16.
Results of branch fracture investigations. (a) Typical AE time-domain signal showing numerous high-frequency crackling signals during branch stretching. (b) Typical acoustic spectrogram during branch stretching leading to final macroscopic fracture.
Figure 16.
Results of branch fracture investigations. (a) Typical AE time-domain signal showing numerous high-frequency crackling signals during branch stretching. (b) Typical acoustic spectrogram during branch stretching leading to final macroscopic fracture.
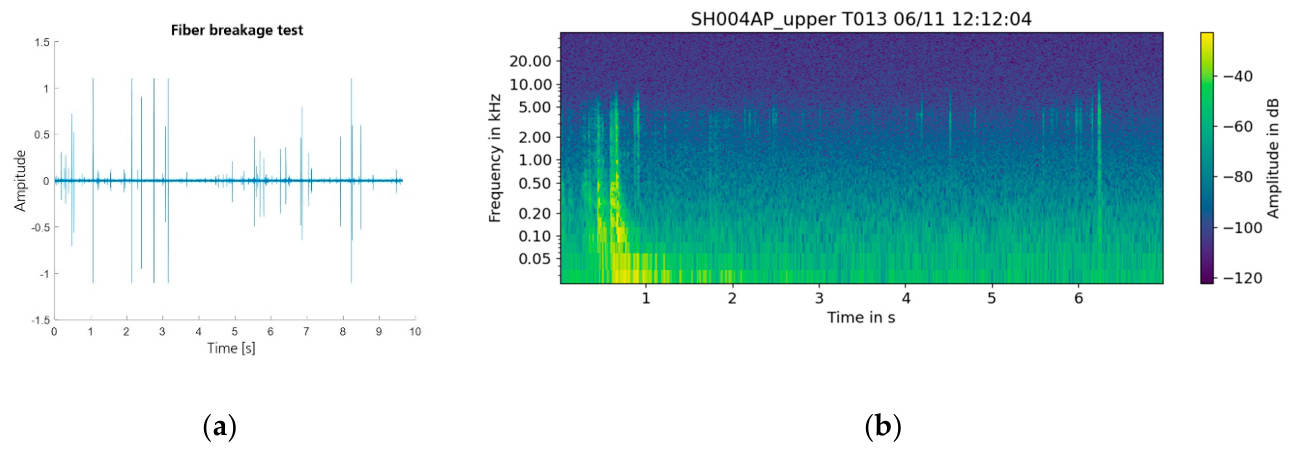
Figure 17.
Results of the tensile pull test on the bark beetle-infested pine. (a) DAE Event rates over the entire test. (b) Detailed view of the first six minutes.
Figure 17.
Results of the tensile pull test on the bark beetle-infested pine. (a) DAE Event rates over the entire test. (b) Detailed view of the first six minutes.
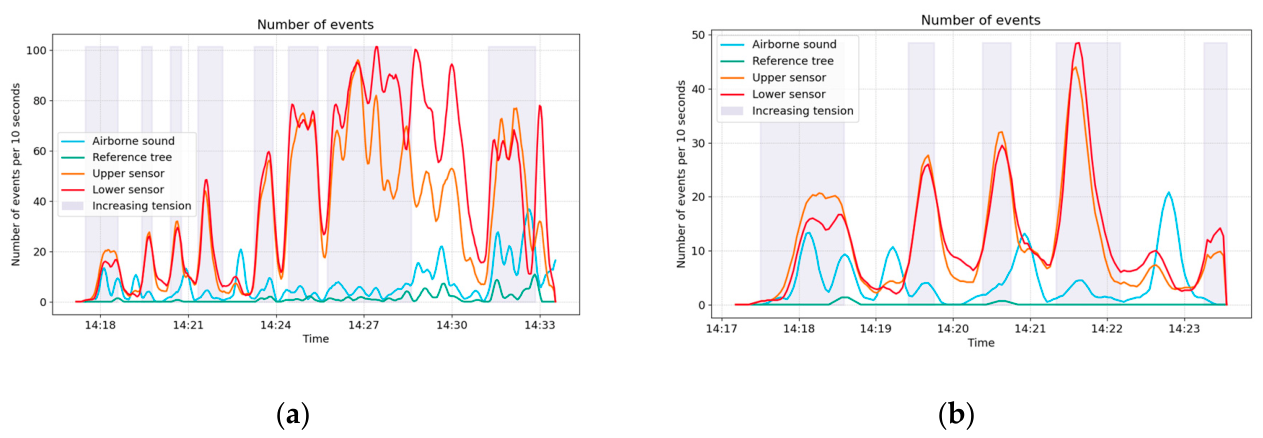
Figure 18.
Results of bark beetle measurements. (a) Typical spectrogram showing high-frequency feeding sounds between 2 and 20 kHz. (b) Time course of DAE event rates for different pine trees with varying levels of infestation.
Figure 18.
Results of bark beetle measurements. (a) Typical spectrogram showing high-frequency feeding sounds between 2 and 20 kHz. (b) Time course of DAE event rates for different pine trees with varying levels of infestation.
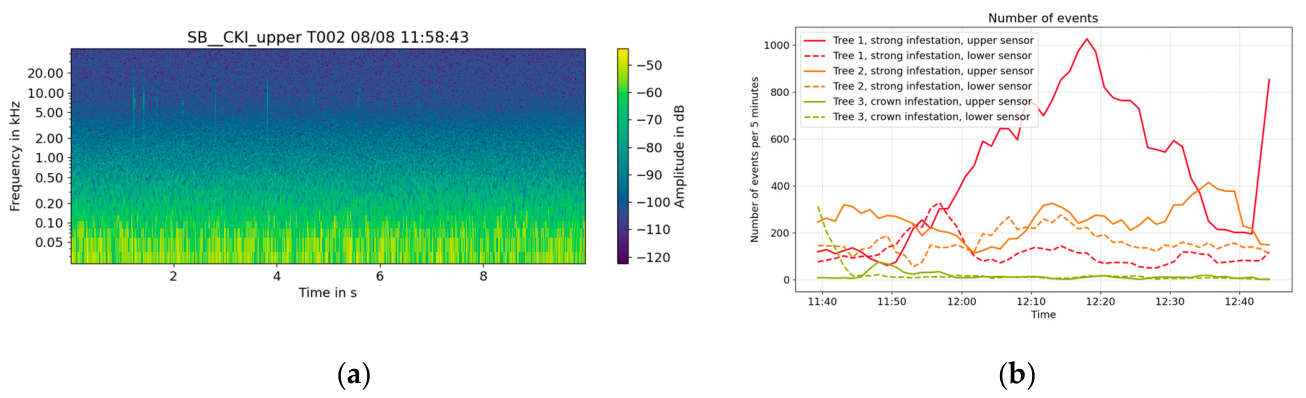
Figure 19.
Typical spectrogram of a suspected drought stress event during the lab-based drying experiment (see following section) with a very wide bandwidth of approximately 25 kHz.
Figure 19.
Typical spectrogram of a suspected drought stress event during the lab-based drying experiment (see following section) with a very wide bandwidth of approximately 25 kHz.
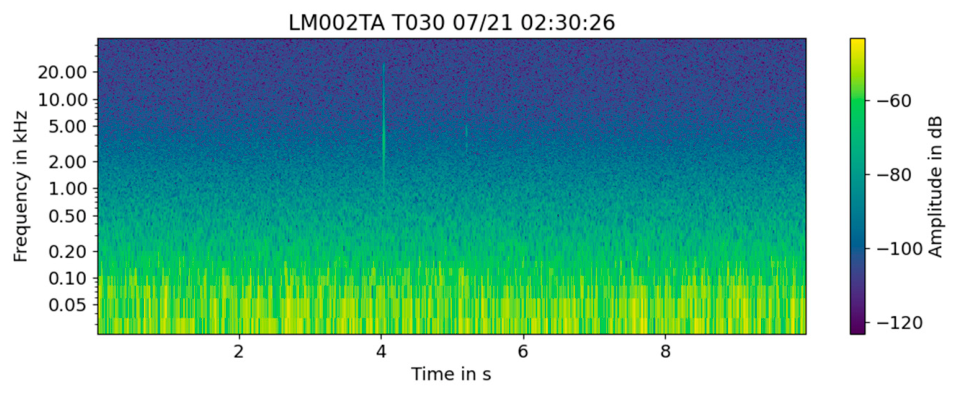
Figure 20.
Results of the drying experiment on the two spruce trunks. (a) Acoustic event rates over the entire measurement period. (b) Acoustic emission events from the first day (individual points) as a function of their signal energy and center frequency. The progression over the day is color-coded from 0 h (blue) to 24 h (yellow).
Figure 20.
Results of the drying experiment on the two spruce trunks. (a) Acoustic event rates over the entire measurement period. (b) Acoustic emission events from the first day (individual points) as a function of their signal energy and center frequency. The progression over the day is color-coded from 0 h (blue) to 24 h (yellow).
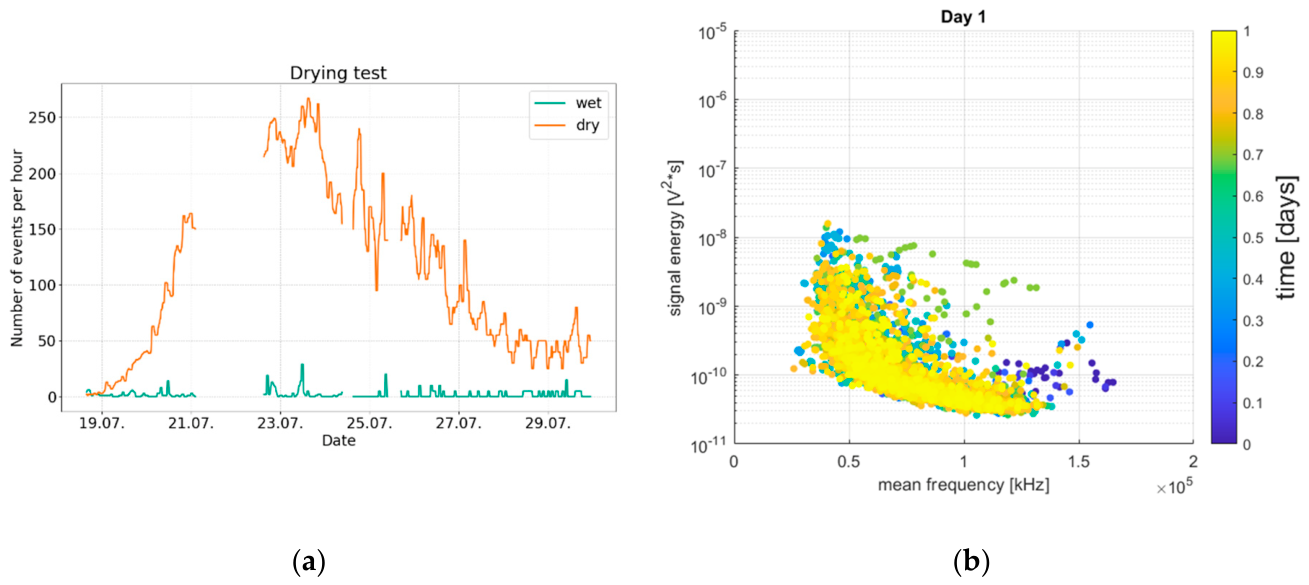
Figure 21.
Time course of DAE event rates for the two indoor trees. Sensor data for the orange tree—which was allowed to dry out periodically—are shown in red and orange, while data for the reference lemon tree—kept humid—are shown in green.
Figure 21.
Time course of DAE event rates for the two indoor trees. Sensor data for the orange tree—which was allowed to dry out periodically—are shown in red and orange, while data for the reference lemon tree—kept humid—are shown in green.
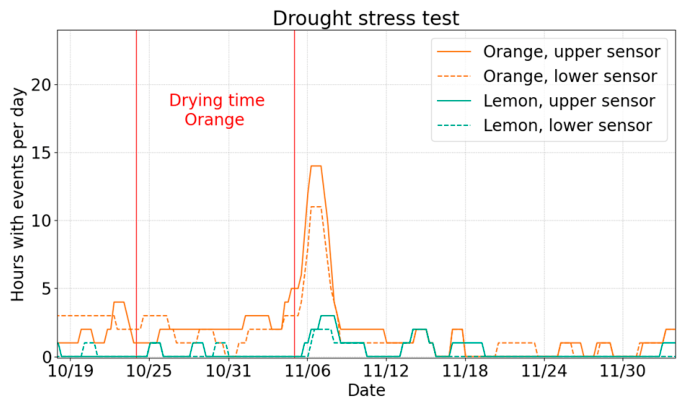
Figure 22.
Results of a sophisticated noise analysis on the two indoor trees. (a) Sunshine duration recorded by the nearest weather station. (b) Spectrogram of the apparent sap flow noise, which was, however, identified as a temperature effect on the sensor and/or the electronics.
Figure 22.
Results of a sophisticated noise analysis on the two indoor trees. (a) Sunshine duration recorded by the nearest weather station. (b) Spectrogram of the apparent sap flow noise, which was, however, identified as a temperature effect on the sensor and/or the electronics.
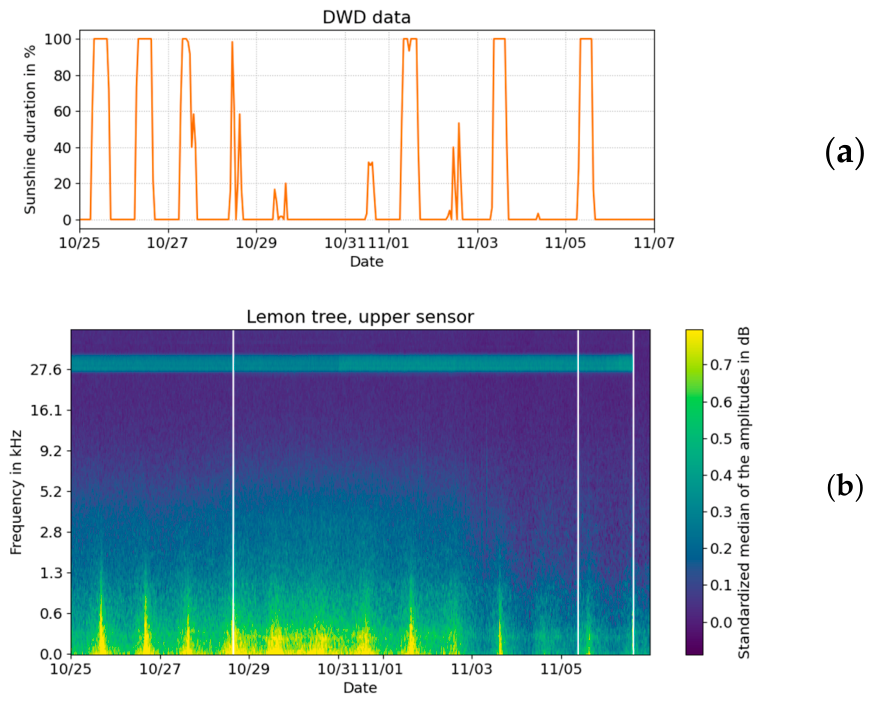
Figure 23.
Comparison of time-dependent DAE events with dendrometer and sap flow data over a period of 2.5 days, obtained on a birch. (a) DAE events on two birch trees (thin birch in green). (b) Dendrometer trace for the thin birch over the same period. (c) Sap flow trace for the thin birch over the same period.
Figure 23.
Comparison of time-dependent DAE events with dendrometer and sap flow data over a period of 2.5 days, obtained on a birch. (a) DAE events on two birch trees (thin birch in green). (b) Dendrometer trace for the thin birch over the same period. (c) Sap flow trace for the thin birch over the same period.
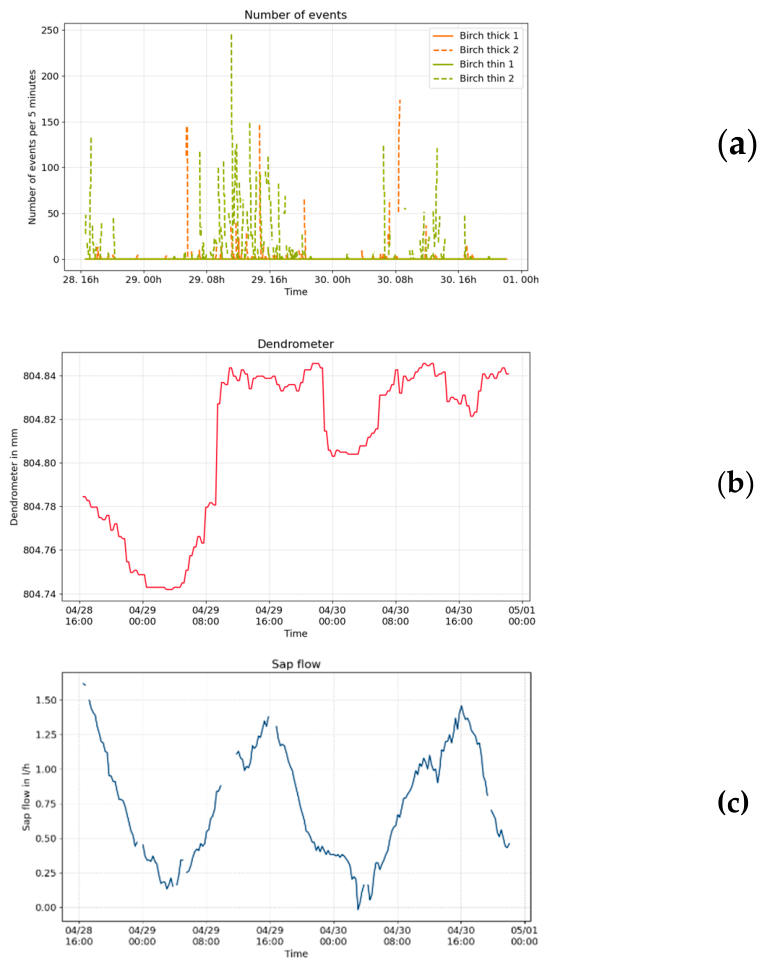
Figure 24.
Acoustic emission signals (Vallen linWave) showing peak amplitude and RMS over time for the first day (29.04.26) of the 2.5-day measurement period fully shown in Figure 23.
Figure 24.
Acoustic emission signals (Vallen linWave) showing peak amplitude and RMS over time for the first day (29.04.26) of the 2.5-day measurement period fully shown in Figure 23.
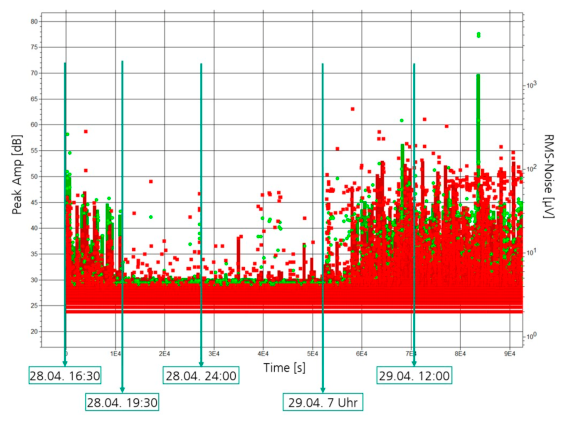
Figure 25.
DAE profiles of an elm (green) and a Norway maple (red) at the Pillnitz site over a period of approximately 12 days. Dendrometer data simultaneously recorded for both trees by the facility operator could not yet be used for comparative analysis.
Figure 25.
DAE profiles of an elm (green) and a Norway maple (red) at the Pillnitz site over a period of approximately 12 days. Dendrometer data simultaneously recorded for both trees by the facility operator could not yet be used for comparative analysis.
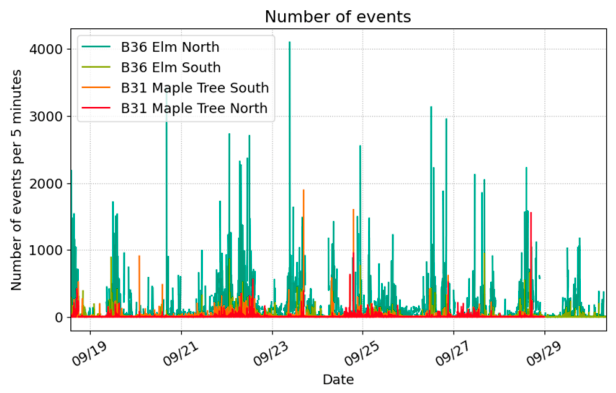
Figure 26.
Comparison of time-dependent DAE events with sun radiation and air temperature data. (a) Acoustic DAE events at the two birch trees (thin birch in green). (b) Solar radiation at the thin birch during the same period. (c) Air temperature at the thin birch during the same period.
Figure 26.
Comparison of time-dependent DAE events with sun radiation and air temperature data. (a) Acoustic DAE events at the two birch trees (thin birch in green). (b) Solar radiation at the thin birch during the same period. (c) Air temperature at the thin birch during the same period.
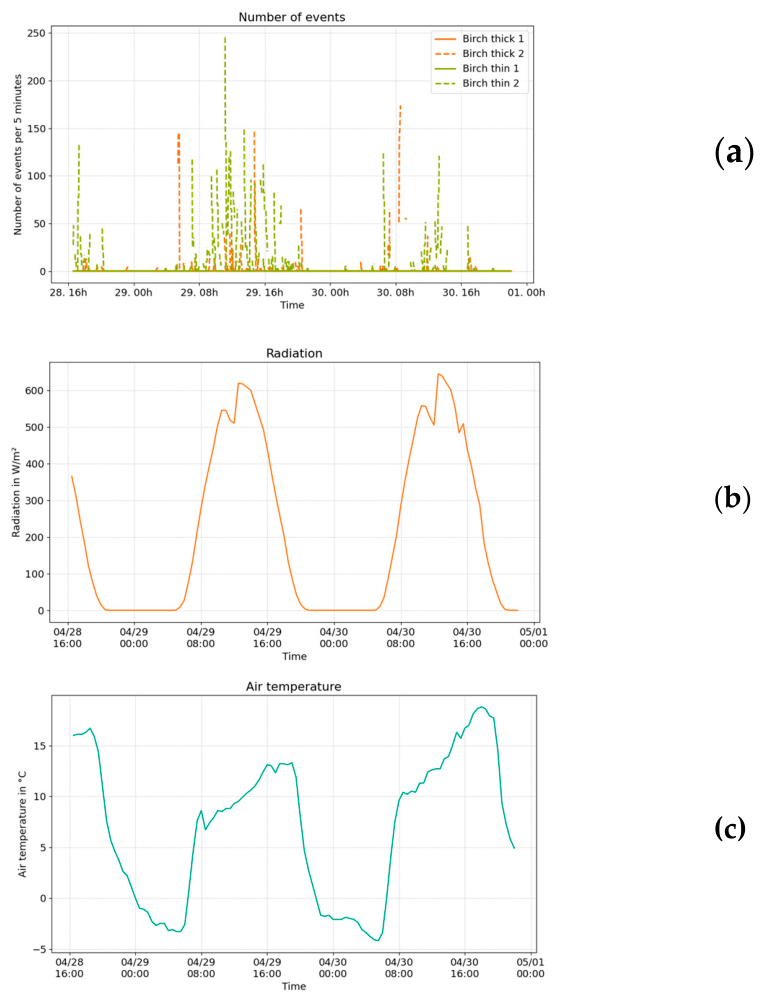
Figure 27.
Comparison of heatmaps of DAE events at the two birch trees with various weather data. The intensity of each measured variable is shown on a color scale from 0 (blue) to the maximum (red) as a function of measurement days (x-axis) and time of day (y-axis): (a) DAE heatmap for the thin birch. (b) DAE for the thick birch. (c) rainfall. (d) wind speed. (e) air temperature. (f) solar radiation.
Figure 27.
Comparison of heatmaps of DAE events at the two birch trees with various weather data. The intensity of each measured variable is shown on a color scale from 0 (blue) to the maximum (red) as a function of measurement days (x-axis) and time of day (y-axis): (a) DAE heatmap for the thin birch. (b) DAE for the thick birch. (c) rainfall. (d) wind speed. (e) air temperature. (f) solar radiation.
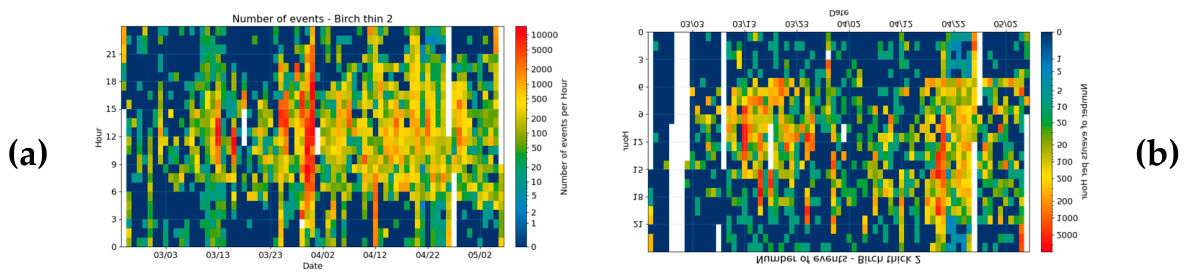
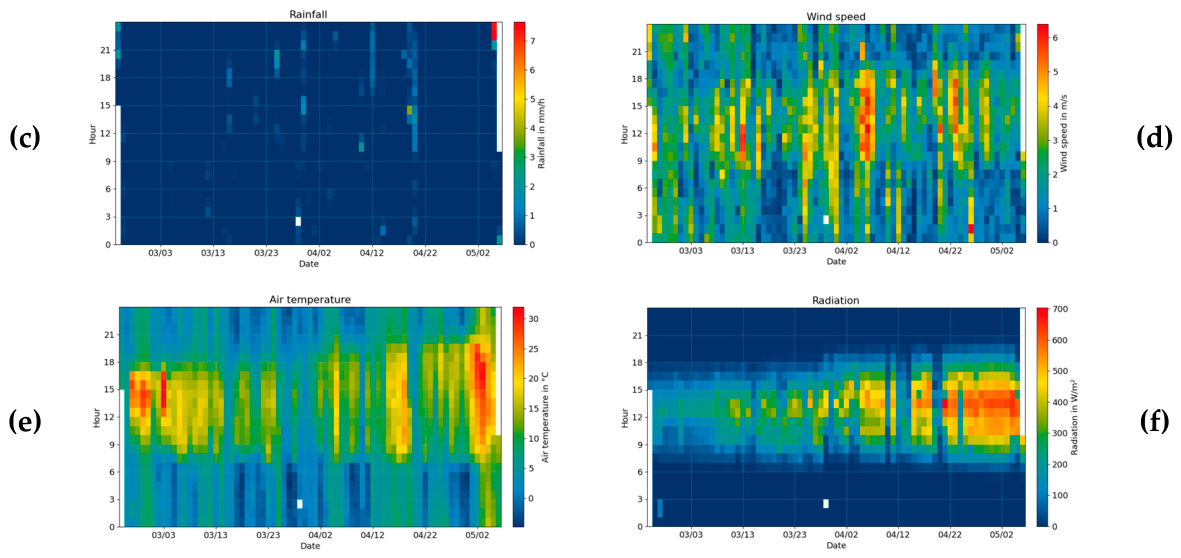

Table 1.
Overview of test measurements in the lab and in the field.
| Focus of investigation | Location | Trees | System used | Duration |
|---|---|---|---|---|
| Sensor coupling | IKTS Lab | Spruce trunk | Commercial Acoustic & AE | 15 minutes |
| Field trials | Sohra fruit plantation |
2 Plum, 2 Birch, 2 Apple trees |
Commercial Acoustic & AE | 6,6 Hours |
| Tharandt forest garden |
2 Fir, 2 Pine, 2 Beech trees |
Commercial Acoustic & AE | 5,6 Hours | |
| Street Bad Gottleuba | 4 Linden trees | Commercial Acoustic & AE | 4,4 Hours | |
| Drying test | IKTS Lab | Spruce trunk | Commercial Acoustic & AE | 13 Days |
| Bark beetles | Senftenberg | 4 Pines | Commercial Acoustic & AE | 1,5 Hours |
| Geierswalde | 4 Pines | Commercial Acoustic | 1 Hour | |
| Oelsengrund | Spruce trunk | Commercial Acoustic | 7 Days | |
| Tensile test | Senftenberg | 1 Pine tree | Commerical Acoustic & AE | 15 Minutes |
| Dresden city | 1 Plane tree, 1 Red oak | Commerical Acoustic & AE | 1 min | |
| Sap flow | IKTS Lab | 1 Lemon, 1 Orange tree | Commercial Acoustic & AE | 73 Days |
| Pillnitz | 1 Maple tree, 1 Elm | Commerical Acoustic & AE | 12 Days | |
| Fungal infestation | Tharandt | 4 Beech trees | Commerical Acoustic & AE | 14 Days |
| Chemnitz | 1 Maple tree, 1 Linden | Commercial Acoustic, active excitation |
15 Minutes | |
| System comparison | Sohra | 2 Beech trees | Commercial Acoustic | 7 Days |
Table 2.
Overview of the field measurements with the TreeMon sensor node.
| Focus of investigation | Location | Trees | System used | Duration |
|---|---|---|---|---|
| Tensile test | Senftenberg | 1 Pine | Sensor node, v1.0 | 15 Minutes |
| Bark beetles | Senftenberg | 4 Pines | Sensor node, v1.0 | 1,5 Hours |
| Geierswalde | 4 Pines | Sensor node, v1.1 | 1 Hour | |
| Fungal infestation | Tharandt | 4 Beech trees | Sensor node, v1.1 | 14 Days |
| Sap flow | Pillnitz | 1 Maple tree, 1 Elm | Sensor node, v1.1 | 12 Days |
| Sohra | 2 Beech trees | Sensor node, v1.1 | 72 Days | |
| Drought stress | Sohra | 1 Beech, 1 Plum, 1 Apple tree |
Sensor node, v1.1 | 64 Days |
| System comparison | Sohra | 2 Beech trees | Sensor node, v1. | 7 Days |
| Sohra | 1 Beech tree | Sensor node, v1.1 & v2.0 | 22 Days |
Disclaimer/Publisher’s Note: The statements, opinions and data contained in all publications are solely those of the individual author(s) and contributor(s) and not of MDPI and/or the editor(s). MDPI and/or the editor(s) disclaim responsibility for any injury to people or property resulting from any ideas, methods, instructions or products referred to in the content. |
© 2026 by the authors. Licensee MDPI, Basel, Switzerland. This article is an open access article distributed under the terms and conditions of the Creative Commons Attribution (CC BY) license (http://creativecommons.org/licenses/by/4.0/).
Copyright: This open access article is published under a Creative Commons CC BY 4.0 license, which permit the free download, distribution, and reuse, provided that the author and preprint are cited in any reuse.