
Submitted:
15 October 2026
Posted:
20 October 2026
You are already at the latest version
Abstract
With the intensification of global climate change, extreme precipitation events have become more frequent and intense, underscoring the need for rapid collection and accurate analysis of disaster information to improve emergency response efficiency. Social media, as a rich source of unstruc-tured, high-frequency, and near-real-time data, holds significant potential for urban disaster monitoring and assessment. However, its utility is limited by noise, semantic redundancy, and loosely structured content, which hinder the accurate extraction and structured representation of disaster information. To address the rapid assessment of flood-related road traffic impacts during urban pluvial flooding, this study proposes a social-media-driven framework for constructing a hierarchical semantic knowledge graph of flood-related road impacts. Using flood-related social media data collected from Weibo and road network data from OpenStreetMap (OSM), the pro-posed framework integrates text deduplication, road and geographic information extraction, Transformer-based impact severity classification, and knowledge graph construction. First, a deduplication approach combining MinHash-LSH candidate filtering with embedding-based se-mantic similarity verification is applied to remove redundant social media posts, followed by the extraction of flood-related road and geographic information from the retained texts. Second, a Transformer-based text classification model classifies the extracted road-related information into four flood-related impact severity levels. Finally, a dictionary- and rule-constrained entity extrac-tion approach is used to construct a hierarchical semantic knowledge graph encompassing spatial locations, entity relationships, and impact severity attributes. The extracted road entities are fur-ther matched to the OSM road network to enable spatial representation of the identified impacts. The experimental results show that the proposed deduplication method achieved an accuracy of 94.1%, outperforming standalone MinHash, SimHash, and embedding-based methods. The Transformer model achieved precision, recall, F1-score, and accuracy of 0.97, 0.98, 0.97, and 0.97, respectively, and outperformed the evaluated traditional machine-learning and RNN-based models. Furthermore, the proposed framework successfully transformed fragmented and un-structured social media information into structured and georeferenced road-impact information by linking affected road entities with spatial locations and flood-related impact severity attributes. These results highlight the potential of the proposed framework to support rapid identification of flood-related road impacts, disaster situational awareness, and emergency transportation man-agement.
Keywords:
social media data
; flood-induced disasters
; traffic risk
; semantic knowledge graph
1. Introduction
With the intensification of global warming, extreme climate events have occurred more frequently, and the likelihood of different types of climate events occurring simultaneously or in combination has increased significantly, leading to greater risks of natural disasters [1,2,3]. In recent years, increasing economic losses and casualties have been caused by such disasters, attracting considerable attention from governments and the public worldwide [4,5,6]. According to the State of the Climate in Asia 2023 report published by the World Meteorological Organization (WMO) [7], more than 60% of disaster-related deaths were attributed to floods, heavy rainfall, and their associated secondary disasters. Therefore, greater efforts are urgently needed to strengthen flood monitoring, prevention, and emergency response. The 2024 report [8] further indicated that rainfall and flooding events of varying severity were experienced in many regions worldwide. Within emergency management systems, a substantial increase in the volume of multisource heterogeneous data has been observed, making the extraction of critical emergency information increasingly important for modern disaster prevention and mitigation [9]. In urban areas, flooding caused by extreme precipitation has become an urgent problem that needs to be addressed. As essential components of urban transportation systems, road networks are particularly vulnerable to flooding. Road damage and destruction caused by flood events can seriously hinder rescue operations and reduce the efficiency of emergency response. Therefore, the rapid identification of road accessibility and operational conditions, together with the timely and dynamic assessment of emergency rescue activities, is considered essential for effective and targeted urban flood disaster management.
Crowdsourced data have become an important source of information for disaster emergency management. Their timeliness and broad coverage offer new opportunities for monitoring and assessing urban flood events [10,11,12,13]. However, social media data are often characterized by high redundancy, substantial noise, and limited structural organization, which constrain their effective use in natural disaster risk assessment [14,15]. Previous studies have explored the use of social media data for disaster-related public opinion analysis, post-disaster recovery monitoring, and damage assessment [16,17,18,19,20]. Nevertheless, several challenges remain, including the limited availability of disaster-related reports containing geographic information, imbalanced distributions of risk severity levels, and ambiguous semantic boundaries between different impact categories. These challenges highlight the need for effective text preprocessing and sample optimization, as well as improved semantic representation methods to enhance the reliability of disaster-impact classification. For text de-duplication, existing methods primarily rely on text similarity measures such as Jaccard coefficients and TF-IDF vector similarity [21,22]. While effective in detecting fully or partially duplicated texts, these techniques may become computationally inefficient or insufficiently sensitive to semantic equivalence when applied to large-scale and linguistically diverse social media datasets. Locality sensitive hashing (LSH) and SimHash have been widely adopted for de-duplication tasks [23,24], enabling approximate text matching through hash signature generation. These methods use compact signatures to identify near-duplicate texts efficiently, but their reliance on lexical features may limit their ability to capture semantic similarity. For disaster-text classification, traditional methods have predominantly employed algorithms such as Naïve Bayes, support vector machines (SVM), and logistic regression. However, these approaches often struggle to capture complex contextual and long-range semantic relationships [25,26]. With the rapid advancement of deep learning, models based on convolutional neural networks (CNNs) and recurrent neural networks (RNNs) have been introduced for social media text classification [27,28]. For knowledge graphs [29,30], existing knowledge graph studies can be broadly categorized into three paradigms according to their primary knowledge-organization mechanisms: (1) ontology-driven knowledge graphs [31,32], which define disaster concepts, attributes, and relationships through predefined ontologies and therefore provide high semantic consistency and interpretability; (2) event-driven knowledge graphs [33,34], which organize information around specific disaster events and their temporal, spatial, causal, and impact characteristics, supporting dynamic analysis and spatiotemporal reasoning; and (3) relation-driven knowledge graphs [35,36], which emphasize explicit semantic associations among disaster-related entities and facilitate analysis of their interconnections. These paradigms represent different knowledge-organization strategies rather than three independent graph types that must be simultaneously implemented in a single application. For social-media-based flood traffic-impact assessment, the key requirement is to establish explicit relationships among geographic locations, affected roads, and corresponding impact severity. Therefore, this study develops a unified semantic knowledge graph with a relation-oriented entity–relationship structure, while incorporating hierarchical traffic-impact severity information, rather than constructing three separate knowledge graphs. This design enables fragmented social media reports to be transformed into structured and spatially associated road-impact knowledge.
Despite the progress made in disaster-related text analysis, the connection between information extracted from social media and the spatial representation of affected roads remains insufficiently explored. In particular, road-related disaster information is often extracted at the text level without being further organized into structured knowledge linked to actual road networks. In this study, a framework based on social media data is developed to construct a hierarchical semantic knowledge graph of flood-related road impacts during urban pluvial flooding. The main contributions are summarized as follows:
(1) A text deduplication method is developed by combining MinHash-LSH candidate filtering with embedding-based semantic similarity verification. Redundant social media posts are identified through a two-stage process, in which computational efficiency and deduplication accuracy are both considered.
(2) A hierarchical semantic knowledge graph is constructed by linking flood-related information extracted from social media texts to standardized OpenStreetMap (OSM) road entities and different levels of traffic-impact severity. Through this framework, affected roads and their associated traffic impacts are represented in a structured and spatially explicit manner, providing information for spatial analysis and flood emergency response.
The remainder of this paper is organized as follows. The study areas and data sources are described in Section 2. The methodology, including social media text deduplication, road-related information extraction, Transformer-based traffic-impact severity classification, and knowledge graph construction, is presented in Section 3. The experimental results are reported in Section 4. In Section 5, the findings are discussed in relation to previous studies, and the limitations of the proposed framework are examined. Finally, the main conclusions and directions for future research are presented in Section 6.2. Study Case and Data Collection
Two major flood events were selected for the feasibility analysis: the extreme rainstorm that occurred in Henan Province in July 2021 and the extreme rainfall and flooding event that affected the Beijing–Tianjin–Hebei (BTH) region in July 2023. The locations and road networks of the two study areas are shown in Figure 1. From July 17 to 23, 2021, Henan Province was affected by an exceptionally severe rainstorm and subsequent flooding, with both high rainfall intensity and prolonged precipitation. The highest cumulative rainfall of 1,122.6 mm was recorded at the Hebi Kechuang Center meteorological station, while 993.1 mm was measured at the Baizhai meteorological station in Xinmi, Zhengzhou. Approximately 14.786 million people were affected by the disaster, and 398 people were reported dead or missing. Direct economic losses were estimated at 120.06 billion yuan. From July 29 to August 2, 2023, the BTH region was subjected to another extreme rainfall event, which was influenced by the residual circulation of Typhoon Doksuri and local topographic conditions. Cumulative rainfall of 200–450 mm was recorded across much of the region, with amounts exceeding 700 mm in some locations. These values were particularly high when compared with the mean annual precipitation of approximately 580 mm in Beijing. Hourly rainfall intensities generally reached 30–60 mm/h, with local maxima exceeding 80 mm/h. Extensive flooding was reported, and transportation networks across the region were severely disrupted. In Hebei Province alone, 29 deaths and 16 missing persons were reported. A total of 110 counties (including county-level cities and districts) and approximately 3.8886 million people were affected, while direct economic losses were estimated at 95.811 billion yuan.
In this study, social media data related to urban flood events were collected from the Weibo platform. Weibo provides user access through multiple channels, including web, email, mobile applications, instant messaging, SMS, and both PC and mobile terminals, allowing users to publish and disseminate information in real time via text, images, and videos. These features enable Weibo to offer rapid response and rich information during sudden natural disasters. Data collection was performed using keywords such as “place name + flood” or “rainstorm,” with the temporal range set from one day before the disaster to seven days after the event. Details of the data collection process are summarized in Table 1.
In addition to social media data, road network data were obtained from OpenStreetMap (OSM) and used as the spatial reference for identifying and geolocating flood-affected roads mentioned in Weibo posts. Road names extracted from social media texts were matched with OSM road entities through road-name recognition and spatial association, thereby linking unstructured disaster-related information to real-world transportation infrastructure. The integrated Weibo–OSM dataset provided the basis for subsequent text processing, road-impact classification, spatial association, and hierarchical semantic knowledge graph construction.
3. Methodology
Given the high redundancy, unstructured nature, and substantial noise inherent in social media data, a de-duplication method combining semantic embedding and MinHash-LSH was employed to eliminate duplicate texts. Following de-duplication, disaster-related information was extracted by mapping social media content onto the OSM road network. Building on this extracted and augmented text data, a Transformer-based model was utilized to classify traffic risk levels. Subsequently, entity extraction was conducted using a dictionary- and rule-constrained approach to construct a hierarchical semantic knowledge graph of traffic risk, which integrates spatial locations, entity relationships, and attribute information. The graph-based representation of disaster information was implemented using the Neo4j database. The detailed technical workflow is illustrated in Figure 2.
3.1. Preprocessing of Social Media Data
3.1.1. De-duplication Method for Social Media Data Integrating Semantic Embedding and MinHash-LSH
To address the significant semantic redundancy and repetition in social media public opinion data, a de-duplication method was proposed, integrating semantic embedding, MinHash-LSH, and cosine similarity verification. First, social media data were preprocessed by removing irrelevant characters, such as punctuation marks and extra spaces. The texts were then tokenized using Jieba in precise mode, and stopwords were filtered out to construct an initial textual corpus for disaster assessment. Next, each social media post Ti was converted into a semantic vector representation using a pre-trained language model:
vi = fmodel(Ti) = [vi1,vi2,...,vid] ∈ ℝd
In the equation, denotesfmodel(·) the semantic encoding function, and d represents the embedding dimension. The vector vi preserves the semantic and contextual information of the text, mapping the textual data into a continuous vector space ℝd. This transformation provides a numerical basis for subsequent similarity calculations.
Computing the full pairwise similarity in high-dimensional semantic vector space is computationally expensive. Therefore, this study employs the MinHash algorithm to approximate the Jaccard similarity between texts and utilizes the LSH bucketing mechanism to efficiently retrieve similar texts. Suppose the embedding vectors of two texts are vi and vj, ; their MinHash signatures are generated using p independent hash functions:
where MinHash(Ti) denotes the MinHash signature of text Ti, w represents an arbitrary token in the set Si, Si represents the set of tokens extracted from text Ti, hp(w) represents the hash value generated by the p-th hash function for token w, p denotes the total number of hash functions.
The MinHash signature of each text vi is inserted into LSH buckets to rapidly generate a candidate set of duplicate texts. While MinHash efficiently identifies candidate similar pairs, its approximation may miss semantic similarities captured by the embedding vectors. To reduce false positives caused solely by hashing, a semantic-level verification using cosine similarity is applied to the candidate text pairs for more precise discrimination. The cosine similarity between two vectors vi_MinHashand vj_MinHashis defined as Simcos(vi_MinHash,vj__MinHash), as shown in Equation (3). WhenSimcos(vi_MinHash,vj__MinHash)> the similarity exceeds a threshold τ, the texts Ti and Tj are considered semantically duplicate; otherwise, Ti is treated as a new, unique text and inserted into the LSH buckets. By iterating through all texts, a deduplicated sample dataset S is obtained.
3.1.2. Disaster Information Extraction from Social Media Based on the OSM Road Network
Keywords and structural features in text are identified using predefined regular expression patterns. In this study, sentences containing road names are initially screened using these patterns. The mathematical formulation of regular expression matching is as follows:
where L represents the set of OSM road-name patterns, and S denotes the text set of de-duplicated social media data. A sample Si is considered matched if at least one candidate satisfies the matching condition.
L = {l1,l2,…,ln},S = {s1,s2,…,sm}
However, spelling errors, synonym substitutions, and non-standard expressions cannot always be handled effectively by regular expressions alone. Therefore, fuzzy matching is also applied to identify text variations and partial matches based on string similarity. The core idea is to compute the similarity sim(Si, lj) between a sentence S and a target keyword li. The mathematical formulation of fuzzy matching is as follows:
where Si denotes the matched social media text, and lj represents the j-th road name in the OSM road network. ED refers to the character-level similarity calculated using the edit distance, while are the semantic embedding vectors of the social media text and the road name, respectively. The parameter μ ∈ [0,1] is a weighting coefficient that balances character-level and semantic similarity. When the combined similarity score sim(Si,lj)≥δ, the social media text Si is considered to have a geographic association with the road entity lj.
3.1.3. Sample Augmentation
Given the limited volume of disaster-related text samples and the imbalance among categories, data augmentation is employed to ensure class balance and maintain the model’s classification accuracy. Considering the unique characteristics of social media disaster information, random deletion is avoided as it may disrupt critical details such as disaster losses or specific road names. Likewise, back-translation is not used due to the risk of introducing semantic deviations, which could negatively impact the subsequent matching of road information. Instead, road names are treated as stop words to preserve key road-network information and prevent synonym replacement for these terms. Based on this constraint, synonym substitution is applied for data augmentation. The augmented texts are then combined with the original samples to form the final social media disaster-information dataset.
3.2. Traffic Risk Levels Classification Based on Social Media Information
In this study, the target domain of traffic roads extracted from social media includes railways, expressways, and highways. To avoid interpreting the classified levels as direct indicators of structural damage to transportation infrastructure, four categories are defined as flood-related transportation impact severity levels. These levels characterize the severity of flood-induced impacts on accessibility and traffic serviceability inferred from social media reports, rather than the physical damage state of roads, bridges, or other transportation structures. Based on the classification scheme adopted from [20], the identified impacts are categorized into four severity levels: very heavy, heavy, medium, and low, as presented in Table 2. The specific criteria for each risk level are described as follows:
Level 0: Represents the most severe flood-related impact on road traffic. Typical situations include road inundation, complete traffic interruption, road closure, impassable conditions, washout, collapse, or other events resulting in a substantial loss of road accessibility or traffic serviceability.
Level 1: Represents a high level of disruption to road traffic, typically characterized by deep water accumulation, severe traffic congestion, restricted accessibility, partial obstruction, or situations requiring traffic control or emergency response.
Level 2: Represents a moderate level of disruption to road traffic, such as partial or shallow waterlogging that reduces driving speeds but does not completely prevent road access.
Level 3: Represents little or no observable flood-related disruption, with minimal or no standing water and generally normal traffic flow.
3.2.1. Transformer-Based Classification Model for Social Media Disaster Information
Social media disaster-related texts are typically short, non-standard, and semantically dispersed, with information on road entities, flooding conditions, severity, and traffic accessibility often appearing within the same text. Therefore, flood-related traffic impact severity cannot be reliably determined from individual keywords alone but requires contextual semantic modeling. To capture such contextual dependencies, this study employs a Transformer Encoder-based text classification model, in which self-attention enables interactions among different positions in the input sequence. The model consists of character-level embedding, positional encoding, multi-head self-attention, residual connections and layer normalization, a feed-forward neural network, sequence-level feature aggregation, and a linear classification layer. It is used to classify social media disaster-related texts into four levels of flood-related road traffic impact severity. The overall architecture is illustrated in Figure 3.
(1) Text Representation and Embedding.Assume the input text sequence is X=[x1, x2, …, xL], where L denotes the sequence length and each xi represents a word or character. The input sequence is first mapped into continuous vector representations via an embedding layer, generating a d -dimensional feature vector for each token, as described in Equation (6). To retain positional information within the sequence, the model incorporates positional encoding using sine and cosine functions. These positional encodings are added to the token embeddings to produce the final input feature representations fed into the Transformer.
E = [e1,e2,...,eL],ei ∈ ℝd
(2) Positional Encoding. Self-attention itself does not inherently capture sequential order. For example, “severe waterlogging on the road” and “severely waterlogged road” may contain similar tokens, but different positional relationships can correspond to different linguistic structures. Therefore, positional encoding is added to the character embeddings to enable the model to capture the relative or absolute positions of characters within the text. The input representation of the Transformer Encoder can be expressed as:
where E denotes the character embedding matrix, and P denotes the positional encoding matrix.
X0 = E + P,X0 ∈ ℝL×d
(3) Multi-Head Self-Attention. A single attention mechanism captures relationships between tokens within only one representation subspace, whereas flood-related social media texts often contain multiple types of semantic information, such as location, flooding conditions, severity, and traffic status. Therefore, Multi-Head Self-Attention is employed to capture these complementary semantic relationships in parallel by projecting the input representations into multiple lower-dimensional subspaces:
headj = Attention(Qj,Kj,Vj),j = 1,…,h
The input sequence is transformed into three matrices: queries (Q), keys (K), and values (V). The outputs of different attention heads are concatenated,whereheadirepresent the output of the i-th attention head:
H = Concat(head1,…headh)
It is then passed through a linear projection to obtain:
MultiHead(X0) = HWo
Let X0denote the input feature matrix to the multi-head attention module, and Wo be the corresponding learnable parameter matrix.
(4) Residual Connections and Layer Normalization. Residual connections preserve the original text representations while providing cross-layer pathways for gradient propagation. Layer normalization stabilizes the feature distributions across different layers, thereby improving the training stability of the multi-layer Transformer Encoder.
X1 = LayerNorm(X0 + MultiHead(X0))
(5) Position-Wise Feed-Forward Neural Network. Self-attention primarily facilitates information interaction among different positions in a sequence, while the attention operation itself mainly involves linear weighted aggregation. Therefore, each Encoder Block incorporates a feed-forward neural network after the self-attention layer to independently perform nonlinear transformations on the contextual features at each position:
FFN(x) = W2ReLU(W1x + b1) + b2
(6) Sequence-Level Feature Aggregation. The sequence representations are integrated into a global feature vector z through average pooling.
(7) Road Traffic Risk Classification. After obtaining the text-level feature vector z, it is fed into a fully connected classifier:
o = Wcz + bc,Wc ∈ RC×d,C = 4
After applying the Softmax function, the predicted probabilities for the four road traffic risk classes are obtained:
The final predicted class is determined as:
3.2.2. Accuracy Evaluation
Accuracy, precision, recall, and F1 score [25,32] are commonly used metrics for evaluating the performance of classification tasks, such as remote sensing image inundation range recognition and traffic risk level classification based on social media data. In these metrics, TP denotes the number of true positives, TN represents the number of true negatives, FP indicates the number of false positives, and FN presents the number of false negatives.
Precision is defined as the ratio of true positives to the total number of items classified as positive, expressed in Formula (17):
Recall (sensitivity) is the ratio of true positives to all actual positive cases, as defined in Formula (18):
The F1 score, defined as the harmonic mean of precision and recall, provides a balanced measure of a classification model’s performance. It ranges from 0 to 1, where higher values indicate better classification effectiveness. The F1 score is calculated as shown in Formula (19):
In addition, accuracy was calculated to evaluate the classification performance of each model. It was determined by dividing the number of correctly classified samples by the total number of samples, as shown in Equation (20):
3.3. Construction of a Semantic Knowledge Graph with Hierarchical Traffic-Impact Levels
The knowledge graph is organized using an entity–relation–attribute structure, in which disaster-related entities and their semantic relationships are represented as interconnected nodes and edges. To overcome the unstructured and semantically ambiguous nature of disaster-related social media texts, this study constructs a hierarchical semantic knowledge graph focused on flood-induced road traffic impacts. The objective is to transform fragmented social media reports into structured and semantically connected knowledge units that explicitly represent administrative locations, road entities, and their corresponding traffic-impact severity levels. For the identification and normalization of key entities in disaster-related social media texts, a dictionary-constrained and semantic-similarity-assisted entity extraction approach is employed. Based on the characteristics of flood related traffic impacts, the entity set (E) is divided into three main categories:
E = Eloc ∪ Eroad ∪ Erisk
Here, Eloc represents the set of administrative location entities, Eroad represents the set of road entities, and Erisk represents the set of traffic-impact severity entities.
To associate road mentions in social media texts with standardized road entities in the OSM road network, candidate road names are first identified using predefined linguistic templates and a road-name dictionary derived from OSM. A entity-matching function is then defined as follows:
Here, fmatch(Ti, lj) denotes a matching function that integrates lexical and semantic similarity, Ti denotes the i-th social media text, and lj represents the j-th candidate road name extracted from the OSM road network. The function sim(Ti,lj) measures the similarity between the road mention in Ti and the candidate OSM road name lj by integrating lexical and semantic similarity. The parameter δ denotes the predefined similarity threshold, ℜOSM denotes the set of road entities derived from OSM. When sim(Ti,lj)≥δ, the road mention identified in Ti is considered to match the standardized OSM road entity lj.
After entity recognition and normalization, semantic relationships among the identified entities are established according to the disaster-event context and predefined relation templates. The set of relationships R includes three types:
R = {r1,r2,r3} = {Located,Affected,Has_Risk_Level}
Here, r1 represents the spatial affiliation relationship between administrative divisions and roads, r2 denotes the impact relationship of flood events on roads, and r3 indicates the semantic mapping relationship between roads and their associated risk levels. For each social media text Ti, recognized entities are linked according to dependency information, administrative-location constraints, road-matching results, and predefined semantic relation templates. The traffic-impact severity assigned to each road is obtained from the Transformer-based classification. Ultimately, these triplets are stored and visualized graphically, yielding a knowledge representation organized as a directed chain from Province/City to Road, and then to Risk Level.
To implement the hierarchical semantic knowledge graph, Neo4j was employed to organize the extracted disaster-related information into four types of nodes: Province, City, Road, and Severity. Three types of directed relationships were established: located, affected, and HAS_RISK_LEVEL, representing the spatial affiliation between provinces and cities, the association between cities and affected roads, and the correspondence between roads and their traffic-impact severity levels, respectively. The graph was constructed using Cypher statements, with an illustrative implementation excerpt provided below.
MERGE (p:Province {name: $province})
MERGE (c:City {
name: $city,
province: $province
})
MERGE (r:Road {
name: $road,
city: $city,
province: $province
})
MERGE (p)-[:Located]->(c)
MERGE (c)-[:Affected]->(r)
MERGE (s:Severity {
road: $road,
city: $city,
province: $province
})
SET s.name = $severity
MERGE (r)-[:HAS_RISK_LEVEL]->(s)
In this implementation, the MERGE operation was used to create or match existing administrative and road entities based on their identifying attributes, while the CREATE operation was applied to Severity nodes to maintain an independent representation of traffic-impact severity for each imported risk record. The resulting directed graph connects administrative locations, road entities, and their associated severity information.
4. Experimental Results and Analysis
4.1. Preprocessing and Analysis of Social Media Data
The experiment collected social media data related to heavy rainfall and flood events, comprising 84,148 posts from Henan Province, and 102,179 posts from the BTH region. To ensure the accuracy of disaster-related text data, several deduplication methods, including MinHash, SimHash, and embedding-based semantic vector matching, were evaluated during preprocessing. Approximately 10,000 posts were randomly selected for each round of comparison, and the experiments were repeated multiple times. The results are presented in Table 3.
In terms of computational efficiency, the shortest runtime was observed for MinHash among the evaluated methods. Texts were represented as token sets, and their similarity was estimated using hash signatures, allowing substantial lexical overlap to be identified efficiently. However, similar information expressed using different words was not always detected. For SimHash, text similarity was calculated based on the Hamming distance. Although relatively low computational costs were required, semantically similar texts with different expressions could be missed, and some texts could be incorrectly removed. In the embedding-based method, cosine similarity between semantic vectors was used to identify duplicate texts. Semantic similarities could be captured more effectively, but additional time was required for model loading and vector similarity calculations, particularly when large datasets were processed. To balance computational efficiency and deduplication accuracy, MinHash-LSH was first used to filter potential duplicates, after which embedding-based cosine similarity was applied to verify semantic similarity. In this way, the computational cost associated with vector similarity calculations was reduced. Highly similar texts could therefore be identified from large-scale social media datasets while maintaining relatively high accuracy and robustness. After the proposed method was applied, 20,002 posts were retained for Henan Province and 32,039 posts for the BTH region.
After deduplication, disaster-related information was extracted from social media data using the OSM road network. The affected traffic network comprised 826 roads in Henan Province, and 1,633 roads in the BTH region. To address potential underfitting caused by small-sample, multi-class classification problems, data augmentation was applied to the sample datasets. Following augmentation, the original 826 samples from Henan Province increased to 2004; the 1,633 samples from the BTH region increased to 4085. It should be noted that data augmentation was introduced primarily to alleviate the limited number of valid road-related disaster samples and the imbalance among risk categories, rather than as a specific mechanism for preventing overfitting. The effects of sample size and the adopted augmentation strategy on classification performance were systematically evaluated in our previous study [20]. For Transformer-based traffic-impact severity classification, the dataset was divided into training and testing sets at a ratio of 7:3. The present study adopts this previously validated augmentation strategy as a preprocessing step and focuses instead on the subsequent integration of road-entity extraction, spatial matching, Transformer-based hierarchical risk classification, and knowledge graph construction. For traffic road risk assessment based on social media data, the performance of this ap-proach was compared with several machine learning and deep learning models, in-cluding SVM, random forest (RF), AdaBoost, Word2Vec-based models, and RNN. The classification results are summarized in Table 4.
Table 4 presents the performance metrics, Precision, Recall, F1 Score, and Accuracy, of various classification methods applied to the task of categorizing road risk levels from flood-related social media texts. The results indicate that traditional machine learning models (SVM, RF, AdaBoost) and shallow Word2Vec-based methods perform notably worse than deep learning approaches. Among the traditional models, SVM achieves the highest scores with Precision, Recall, and Accuracy all at 0.76, and an F1 Score of 0.74. However, its F1 Score remains significantly lower than those of deep learning models. RF attains an F1 Score of 0.69, and AdaBoost reaches an Accuracy of only 0.69, suggesting these methods struggle to capture the complex semantic features present in flood-related texts. An accuracy of 0.71 was obtained by the Word2Vec-based model, while relatively low precision, recall, and F1 scores were observed. These results suggest that semantic information in noisy and unstructured social media texts was not adequately captured by this model. Better classification performance was achieved by the RNN, with all four evaluation metrics reaching 0.95. However, the results were still lower than those obtained by the Transformer. The superior performance of the Transformer may be attributed to its self-attention mechanism, through which contextual relationships across the input sequence can be captured and subtle differences in traffic-impact descriptions can be distinguished.
4.2. Construction and Feasibility Analysis of a Hierarchical Semantic Knowledge Graph for Urban Flood-Related Traffic Risks
In the urban flood-related road risk knowledge graph, disaster information is organized into four types of nodes: “Province,” “City,” “Road,” and “Disaster Severity.” Three relationships, namely “Located,” “Affected,” and “HAS_RISK_LEVEL,” are used to connect these nodes and represent the associations among administrative divisions, affected roads, and their severity levels. The knowledge graph was constructed in Neo4j, through which road-related disaster information can be queried and the distribution of traffic-impact levels can be examined. The constructed knowledge graphs and selected enlarged views are presented in Figure 4 and Figure 5. Given the large number of nodes and relationships, representative cities and their associated roads are displayed as subgraphs to improve readability. The resulting structure provides a basis for organizing and retrieving flood-related road information to support emergency response.
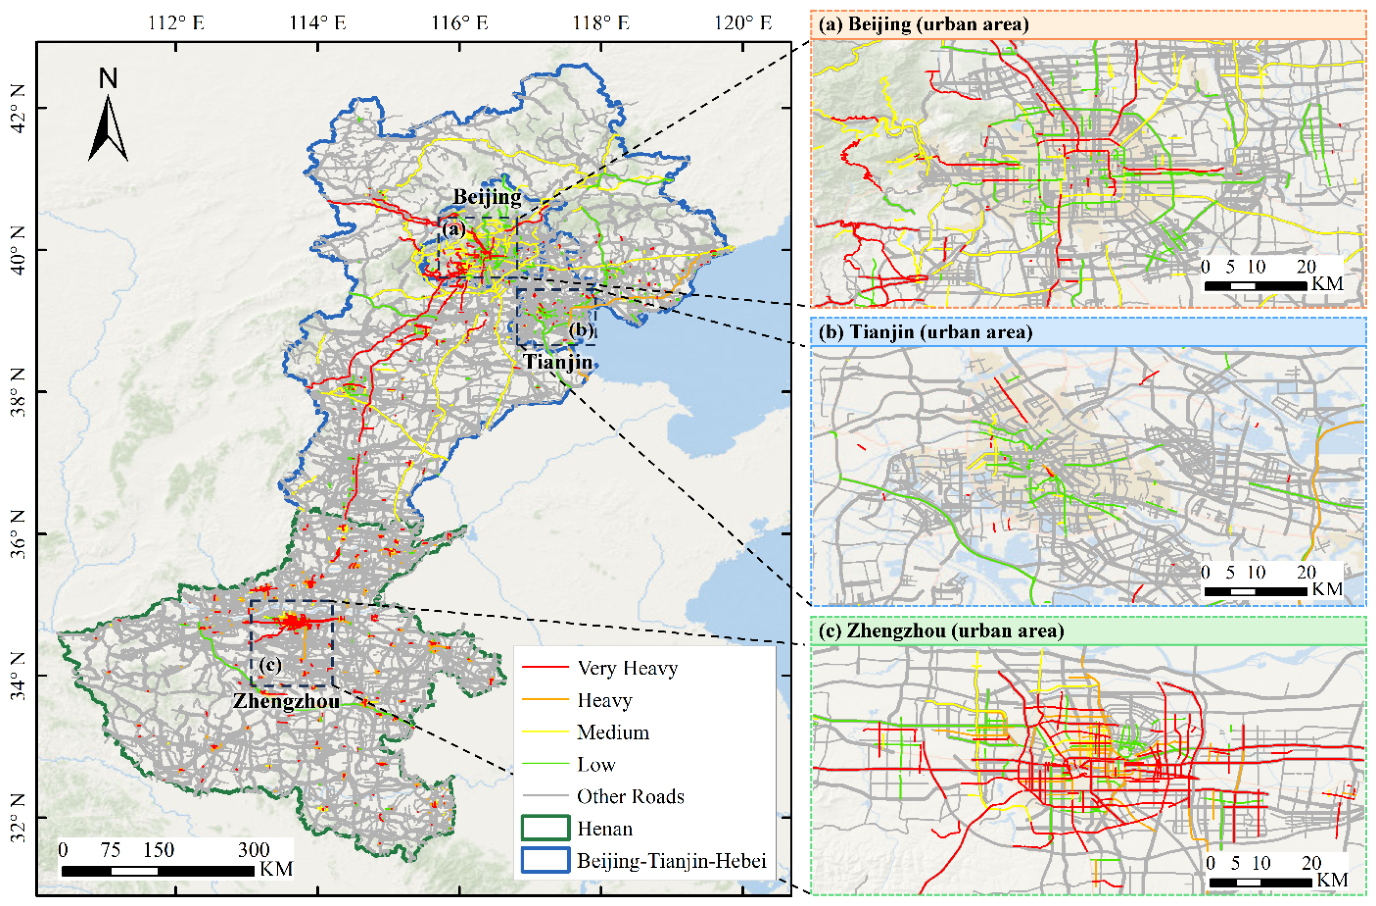
As shown in Figure.6, the road risk entities extracted from the knowledge graph were spatially matched with the OpenStreetMap (OSM) road network and subsequently projected onto real-world road segments. The visualization results show that road-related information extracted from social media texts can be matched to corresponding entities in the OSM road networks of Henan Province and the Beijing–Tianjin–Hebei region. The identified roads are assigned four traffic-impact severity levels: Low, Medium, Heavy, and Very Heavy, each represented by a different color. From a regional perspective, the Beijing–Tianjin–Hebei region contains a larger number of identified risk roads with a distinct multicenter distribution centered on Beijing, Tianjin, and several major cities in Hebei Province. In comparison, the road risk distribution in Henan Province exhibits a pronounced hotspot centered on Zhengzhou, with high-risk road segments extending outward along major transportation corridors. Overall, integrating the semantic information extracted from the knowledge graph with the OSM road network enables an effective transformation from unstructured textual descriptions to geographically referenced road entities. This approach provides an intuitive spatial representation of flood-related road risks and offers valuable support for identifying critical flood-prone road segments, analyzing regional differences in transportation risk, and assisting emergency traffic management and disaster response during urban flood events.
Figure 6.
Spatial visualization of urban flood road risks derived from the knowledge graph and matched to the OpenStreetMap road network.
Figure 6.
Spatial visualization of urban flood road risks derived from the knowledge graph and matched to the OpenStreetMap road network.
5. Discussion
The main contribution of this study is an integrated framework that links disaster-related social media texts to road entities and their corresponding traffic-impact severity levels, extending beyond improvements in text deduplication and classification accuracy. Nevertheless, considerable uncertainty remains in representing the spatial extent of road impacts using social media information. Social media posts generally describe phenomena such as “waterlogging on a road,” “traffic interruption on a road section,” or “a road being impassable,” but do not necessarily provide the precise start and end locations, inundation extent, or affected length of the road segment. Therefore, the spatial road-risk results presented in this study should be interpreted as representations of potentially affected roads and their associated impact attributes identified from social media information, rather than as precise measurements of the actual flood-inundation extent or affected road length. At the text preprocessing stage, the proposed deduplication method achieved an accuracy of 94.1%, outperforming the individual MinHash, SimHash, and embedding-based approaches. This result indicates that combining rapid candidate screening with semantic refinement provides an effective compromise between computational efficiency and semantic discrimination. A Transformer-based text classification model was subsequently used to classify social media disaster information into different levels of road traffic impact. Its classification performance depends not only on the model architecture, but also on input feature representation, sample size, and class distribution. The number of valid road-related disaster samples retained from the original social media dataset was substantially smaller than the number of initially collected posts, and a certain degree of class imbalance existed among different risk levels. To alleviate this problem, this study employed a synonym-replacement-based data augmentation strategy while preserving road names and key disaster-related information, thereby expanding the training dataset and improving class balance [20]. Data augmentation increases linguistic diversity but does not introduce new independent disaster observations. It cannot replace additional real-world samples, and the reported classification accuracy should therefore be interpreted in the context of the dataset and experimental conditions used in this study. The overall structure of the constructed road-disaster knowledge graph reveals clear differences in the number of road entities associated with different cities. Some cities form relatively large clusters of road-risk nodes, whereas others are represented by only small localized clusters. Although differences in node-cluster size may be associated to some extent with the severity of flooding in affected cities, they should not be directly interpreted as differences in actual urban flood risk. The number of roads represented in the knowledge graph is also influenced by factors such as the number of Weibo users, the level of information-posting activity, whether road names are explicitly mentioned, and whether textual road expressions can be successfully matched to corresponding OSM road entities.
This study also has several limitations. Social media data are subject to pronounced user and spatial representativeness biases. The number of identified risk-related roads is determined not only by flood intensity, but also by population density, platform usage patterns, communication conditions, and accessibility during disaster events. Roads located in densely populated and highly trafficked areas are more likely to generate social media reports because of greater human activity and information exposure, whereas smaller roads, peripheral road segments, and roads that become completely inaccessible during severe flooding may be underrepresented. Therefore, the spatial patterns identified in this study should be interpreted as the distribution of social-media-observed road impacts rather than as a complete inventory of all flood-affected roads. In addition, the current validation primarily focuses on text deduplication and traffic-impact classification performance and has not yet systematically incorporated independent observations such as official road-closure records from transportation authorities, field measurements of inundation depth, road inspection and maintenance logs, or remotely sensed flood products. Therefore, the Level 0–Level 3 categories used in this study represent traffic serviceability and accessibility impacts inferred from textual descriptions and should not be directly interpreted as structural damage levels of pavements, bridges, or other transportation infrastructure. Weibo was used as the primary data source in this study. When transferring the proposed framework to Twitter or crowdsourced traffic-information platforms, differences in language, text length, the proportion of geotagged content, and user demographics should be considered, and the model would need to be retrained or recalibrated accordingly. Future research will prioritize cross-platform transferability, cross-event testing, and uncertainty quantification. Social-media-derived road-impact information will also be integrated with precipitation, DEM, remotely sensed inundation extent, land-use information, and real-time traffic data to improve the physical consistency and decision-making reliability of road-risk interpretation.
6. Conclusions
This study developed a social-media-driven framework for constructing a hierarchical semantic knowledge graph of flood-related road impacts, integrating text deduplication, Transformer-based impact severity classification, road-entity matching, and knowledge graph construction. Using the 2021 Henan and 2023 Beijing–Tianjin–Hebei flood events as case studies, the principal findings are summarized as follows.
(1) The proposed deduplication method combining MinHash-LSH candidate retrieval with embedding-based semantic similarity verification achieved an accuracy of 94.1%, these results demonstrate the feasibility of combining efficient candidate retrieval with semantic verification to reduce redundancy in disaster-related social media data.
(2) Precision, recall, F1-score, and accuracy values of 0.97, 0.98, 0.97, and 0.97, respectively, were achieved by the Transformer-based classification model. Higher classification performance was obtained compared with the evaluated traditional machine learning and RNN-based models. Based on these results, contextual semantic representations were found to be effective in distinguishing four levels of flood-related road traffic impact severity in the evaluated datasets. However, classification performance may still be affected by sample representativeness, class distribution, and the quality of semantic information extracted from social media texts.
(3) Explicit semantic relationships among administrative locations, road entities, and flood-related traffic-impact severity levels were established in the constructed knowledge graph. Road information extracted from social media was matched with corresponding OSM road entities, and fragmented textual descriptions were converted into structured and spatially referenced road-impact information. Through this process, a basis was provided for organizing disaster information and supporting transportation emergency management.
Author Contributions
Jian Meng and Hong Zhu proposed the methodology and wrote the manuscript. Huiyun Tian helped edit and improve the manuscript. Fan Mo contributed to improving the methodology. All authors have read and agreed to the published version of the manuscript.
Funding
This research was jointly supported by science technology research and development plan self-fund program of Langfang (Grant No. 2021013164) and the Science Research Project of Hebei Education Department (Grant No. QN2025357).
Data Availability Statement
The data are not publicly available due to privacy restrictions.
Conflicts of Interest
The authors declare no conflicts of interest.
References
- Wang, T.; Wang, H.; Wang, Z.; Huang, J. Dynamic risk assessment of urban flood disasters based on functional area division—A case study in Shenzhen, China. J. Environ. Manag. 2023, 345, 118787. [Google Scholar] [CrossRef] [PubMed]
- Zhu, H.; Yao, J.; Meng, J.; Cui, C.; Wang, M.; Yang, R. A Method to Construct an Environmental Vulnerability Model Based on Multi-Source Data to Evaluate the Hazard of Short-Term Precipitation-Induced Flooding. Remote Sens. 2023, 15, 1609. [Google Scholar] [CrossRef]
- Rodell, M.; Li, B. Changing intensity of hydroclimatic extreme events revealed by GRACE and GRACE-FO. Nat. Water 2023, 1, 241–248. [Google Scholar] [CrossRef]
- Wu, X.; Zhu, H.; Hu, L.; Meng, J.; Sun, F. Analysis of Short-Term Heavy Rainfall-Based Urban Flood Disaster Risk Assessment Using Integrated Learning Approach. Sustainability 2024, 16, 8249. [Google Scholar] [CrossRef]
- Dottori, F.; Szewczyk, W.; Ciscar, J.-C.; Zhao, F.; Alfieri, L.; Hirabayashi, Y.; Bianchi, A.; Mongelli, I.; Frieler, K.; Betts, R.A.; et al. Increased human and economic losses from river flooding with anthropogenic warming. Nat. Clim. Chang. 2018, 8, 781–786. [Google Scholar] [CrossRef]
- Roy, K.C.; Hasan, S.; Culotta, A.; Eluru, N. Predicting traffic demand during hurricane evacuation using Real-time data from transportation systems and social media. Transp. Res. Part C Emerg. Technol. 2021, 131, 103339. [Google Scholar] [CrossRef]
- World Meteorological Organization. State of the Climate in Asia 2023; WMO: Geneva, 2024. [Google Scholar]
- World Meteorological Organization. State of the Climate 2024 | Extreme Events Supplement; WMO: Geneva, 2025. [Google Scholar]
- Shoyama, K.; Cui, Q.; Hanashima, M.; et al. Emergency flood detection using multiple information sources: Integrated analysis of natural hazard monitoring and social media data. Sci. Total Environ. 2021, 767, 144371. [Google Scholar] [CrossRef] [PubMed]
- Fang, J.; Hu, J.; Shi, X.; et al. Assessing disaster impacts and response using social media data in China: A case study of 2016 Wuhan rainstorm. Int. J. Disaster Risk Reduct. 2019, 34, 275–282. [Google Scholar] [CrossRef]
- Wang, C.; Zhang, X.; Wu, J. Disaster information mining from a social perception perspective: A case study of the “23· 7” extreme rainfall event in the Beijing–Tianjin–Hebei region. Int. J. Disaster Risk Reduct. 2024, 115, 105056. [Google Scholar] [CrossRef]
- Boota, M.W.; Zwain, H.M.; Shi, X.; et al. How effective is twitter (X) social media data for urban flood management? J. Hydrol. 2024, 634, 131129. [Google Scholar] [CrossRef]
- Li, H.; Han, Y.; Wang, X.; et al. Risk perception and resilience assessment of flood disasters based on social media big data. Int. J. Disaster Risk Reduct. 2024, 101, 104249. [Google Scholar] [CrossRef]
- Han, J.; Zheng, Z.; Lu, X.Z.; Chen, K.Y.; Lin, J.R. Enhanced Earthquake Impact Analysis based on Social Media Texts via Large Language Model. Int. J. Disaster Risk Reduct. 2024, 104574. [Google Scholar] [CrossRef]
- Peng, J.; Zhang, J. Spatiotemporal assessment of urban flooding hazard using social media: A case study of Zhengzhou ‘7· 20’. Environ. Model. Softw. 2024, 176, 106021. [Google Scholar] [CrossRef]
- Li, L.; Bensi, M.; Cui, Q.; Baecher, G.B.; Huang, Y. Social media crowdsourcing for rapid damage assessment following a sudden-onset natural hazard event. Int. J. Inf. Manag. 2021, 60, 102378. [Google Scholar] [CrossRef]
- Yuan, F.; Liu, R. Feasibility study of using crowdsourcing to identify critical affected areas for rapid damage assessment: Hurricane Matthew case study. Int. J. Disaster Risk Reduct. 2018, 28, 758–767. [Google Scholar] [CrossRef]
- Dou, M.; Wang, Y.; Gu, Y.; Dong, S.; Qiao, M.; Deng, Y. Disaster damage assessment based on fine-grained topics in social media. Comput. Geosci. 2021, 156, 104893. [Google Scholar] [CrossRef]
- Hao, H.; Wang, Y. Leveraging multimodal social media data for rapid disaster damage assessment. Int. J. Disaster Risk Reduct. 2020, 51, 101760. [Google Scholar] [CrossRef]
- Zhu, H.; Meng, J.; Yao, J.; Xu, N. Feasibility of Emergency Flood Traffic Road Damage Assessment by Integrating Remote Sensing Images and Social Media Information. ISPRS Int. J. Geo-Inf. 2024, 13, 369. [Google Scholar] [CrossRef]
- Madhan, N.; Dheva Rajan, S.; Jain, M. Directing Natural Language Processing Text Similarity Challenges in Social Media with AI Techniques. In International Conference on Advances in Information Communication Technology & Computing; Springer Nature Singapore: Singapore, 2024; pp. 425–442. [Google Scholar]
- Sarwar, T.B.; Noor, N.M.; Miah, M.S.U. Evaluating keyphrase extraction algorithms for finding similar news articles using lexical similarity calculation and semantic relatedness measurement by word embedding. PeerJ Comput. Sci. 2022, 8, e1024. [Google Scholar] [CrossRef] [PubMed]
- Gyawali, B.; Anastasiou, L.; Knoth, P. Deduplication of scholarly documents using locality sensitive hashing and word embeddings. 2020. [Google Scholar] [PubMed]
- Ji, L. Research on fast de-duplication of text backup information in library database based on big data. Int. J. Inf. Commun. Technol. 2021, 19, 76–92. [Google Scholar] [CrossRef]
- Rahman, H.; Tariq, J.; Masood, M.A.; et al. Multi-tier sentiment analysis of social media text using supervised machine learning. Comput. Mater. Contin. 2023, 74, 5527–5543. [Google Scholar] [CrossRef]
- Chiong, R.; Budhi, G.S.; Dhakal, S.; et al. A textual-based featuring approach for depression detection using machine learning classifiers and social media texts. Comput. Biol. Med. 2021, 135, 104499. [Google Scholar] [CrossRef] [PubMed]
- Minaee, S.; Kalchbrenner, N.; Cambria, E.; et al. Deep learning--based text classification: A comprehensive review. ACM Comput. Surv. (CSUR) 2021, 54, 1–40. [Google Scholar]
- Fang, W.; Luo, H.; Xu, S.; et al. Automated text classification of near-misses from safety reports: An improved deep learning approach. Adv. Eng. Inform. 2020, 44, 101060. [Google Scholar] [CrossRef]
- Kosasih, E.E.; Margaroli, F.; Gelli, S.; et al. Towards knowledge graph reasoning for supply chain risk management using graph neural networks. Int. J. Prod. Res. 2024, 62, 5596–5612. [Google Scholar] [CrossRef]
- Hofmeister, M.; Bai, J.; Brownbridge, G.; et al. Semantic agent framework for automated flood assessment using dynamic knowledge graphs. Data-Centric Eng. 2024, 5, e14. [Google Scholar] [CrossRef]
- Son, J.; Lim, C.S.; Shim, H.S.; et al. Development of knowledge graph for data management related to flooding disasters using open data. Future Internet 2021, 13, 124. [Google Scholar] [CrossRef]
- Zhang, M.; Wang, J. Global flood disaster research graph analysis based on literature mining. Appl. Sci. 2022, 12, 3066. [Google Scholar] [CrossRef]
- Hofmeister, M.; Brownbridge, G.; Hillman, M.; et al. Cross-domain flood risk assessment for smart cities using dynamic knowledge graphs. Sustain. Cities Soc. 2024, 101, 105113. [Google Scholar] [CrossRef]
- Zou, Y.; Huang, Y.; Wang, Y.; et al. The construction of urban rainstorm disaster event knowledge graph considering evolutionary processes. Water 2024, 16, 942. [Google Scholar] [CrossRef]
- Jiao, Y.; You, S. Rescue decision via earthquake disaster knowledge graph reasoning. Multimed. Syst. 2023, 29, 605–614. [Google Scholar] [CrossRef]
- Ge, X.; Yang, Y.; Chen, J.; et al. Disaster prediction knowledge graph based on multi-source spatio-temporal information. Remote Sens. 2022, 14, 1214. [Google Scholar] [CrossRef]
Figure 1.
Location and road networks of the study areas. (a) Geographic locations of the two study areas; (b) road network of Henan Province; and (c) road network of the Beijing–Tianjin–Hebei region.
Figure 1.
Location and road networks of the study areas. (a) Geographic locations of the two study areas; (b) road network of Henan Province; and (c) road network of the Beijing–Tianjin–Hebei region.
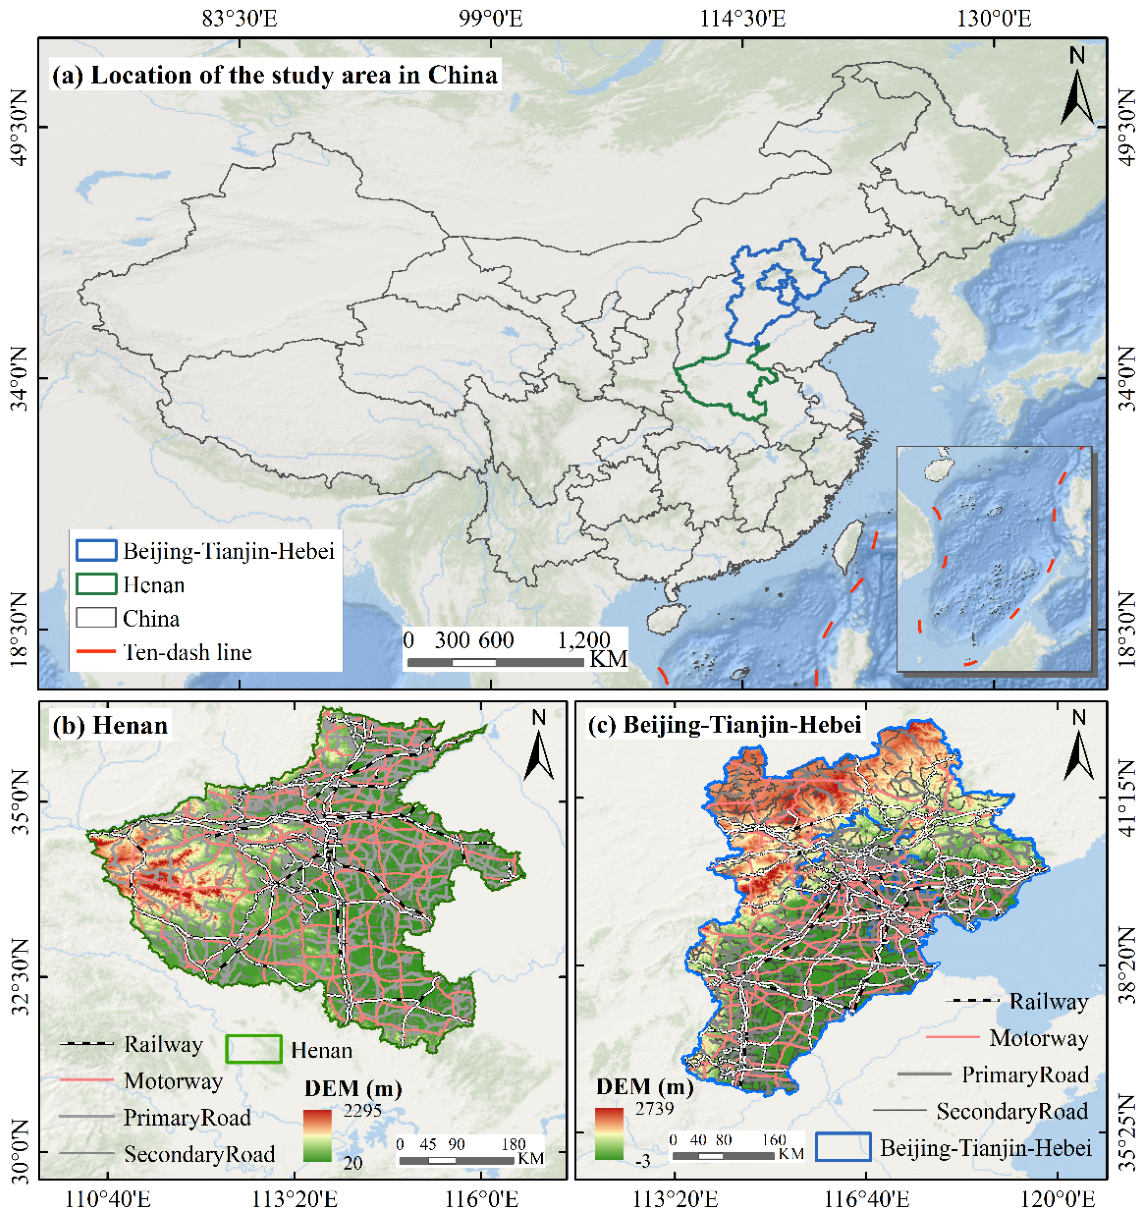
Figure 2.
Technical Workflow for Constructing a Hierarchical Semantic Knowledge Graph of Flood-Related Traffic Risks Based on Social Media Data.
Figure 2.
Technical Workflow for Constructing a Hierarchical Semantic Knowledge Graph of Flood-Related Traffic Risks Based on Social Media Data.
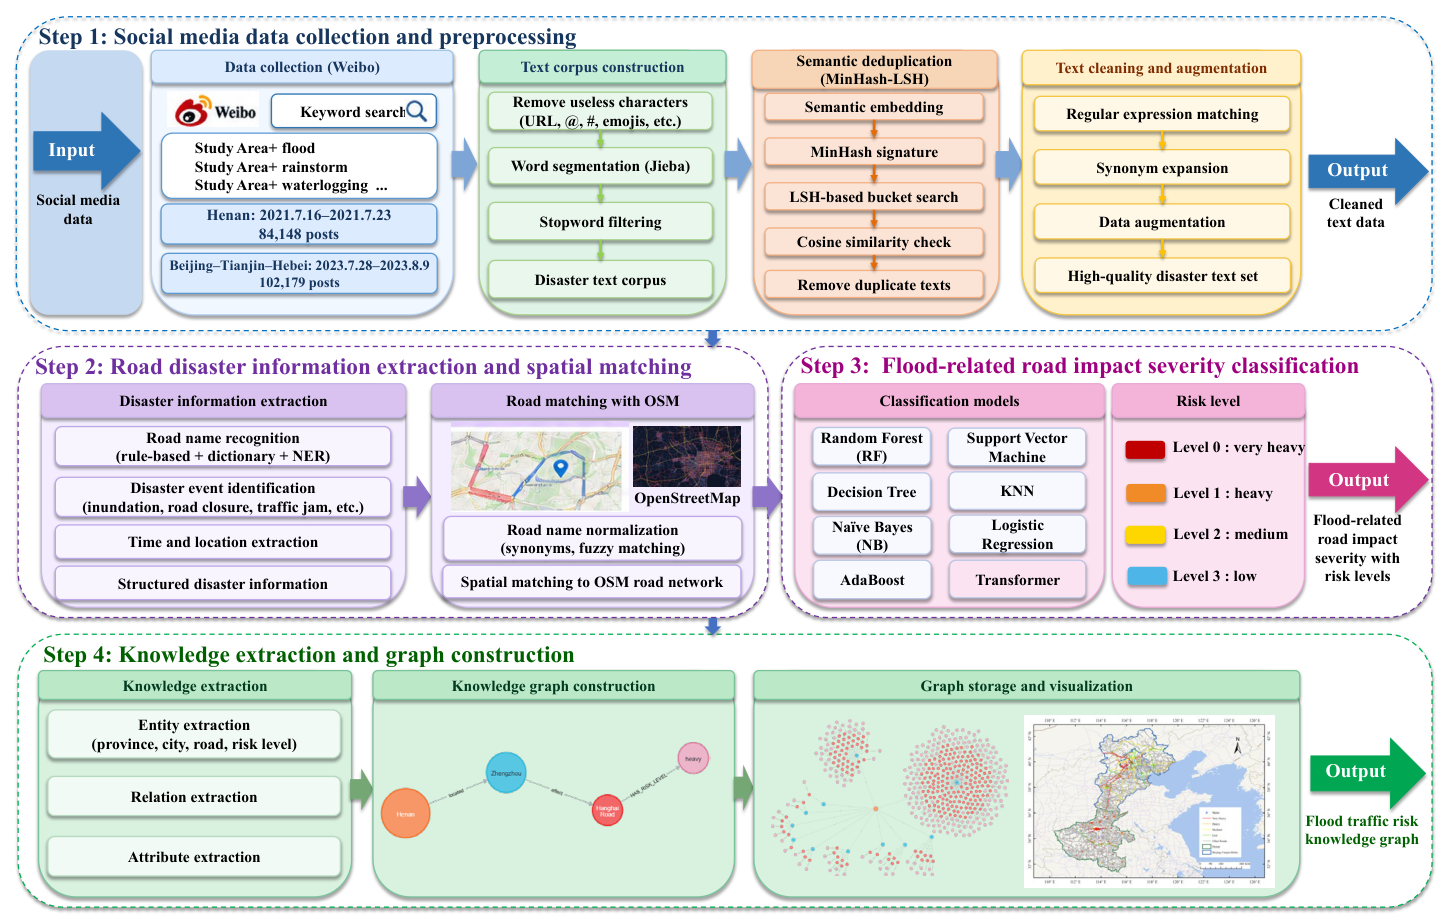
Figure 3.
Overall framework of the Transformer-based approach for flood-related road risk classification.
Figure 3.
Overall framework of the Transformer-based approach for flood-related road risk classification.
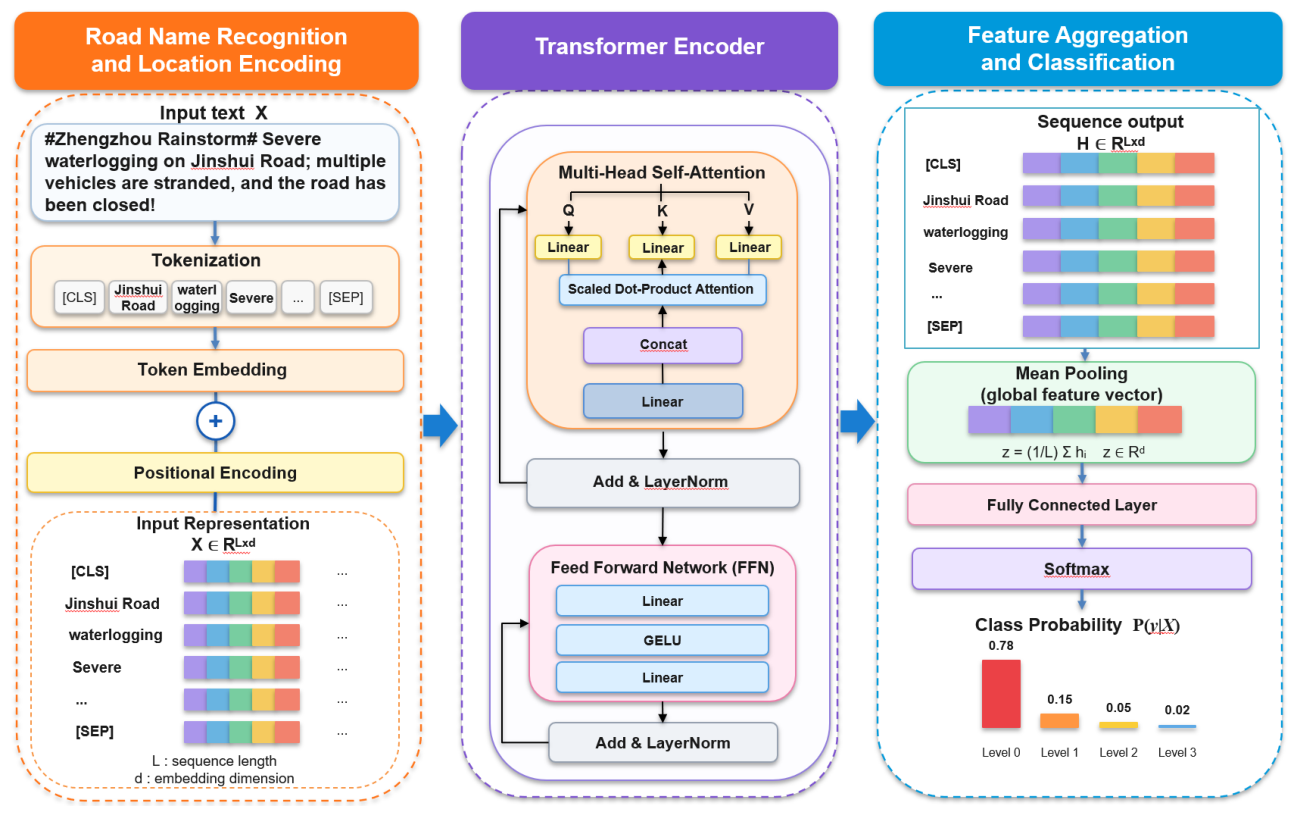
Figure 4.
Visualization of the social-media-driven knowledge graph of urban flood-related road risks in Henan Province: (a) the overall knowledge graph; (b) an enlarged subgraph of Zhengzhou; and (c) an enlarged subgraph of Xinxiang.
Figure 4.
Visualization of the social-media-driven knowledge graph of urban flood-related road risks in Henan Province: (a) the overall knowledge graph; (b) an enlarged subgraph of Zhengzhou; and (c) an enlarged subgraph of Xinxiang.
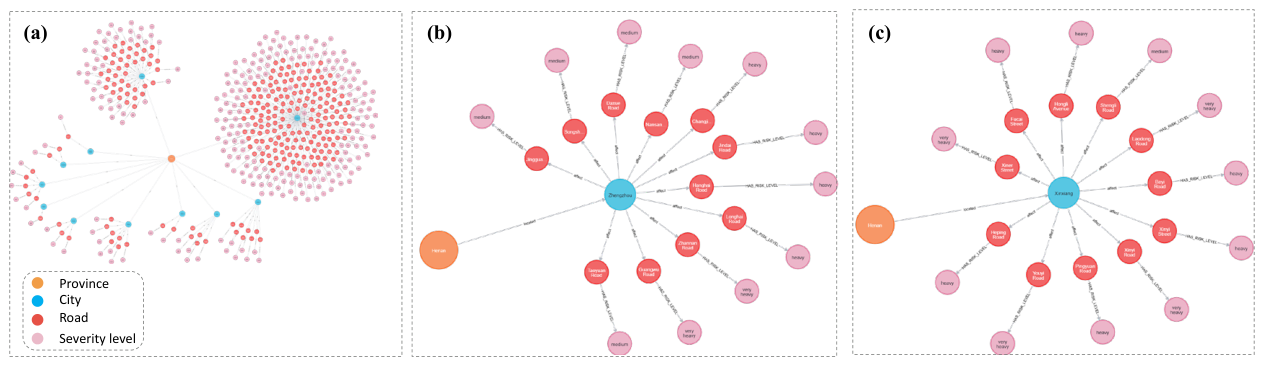
Figure 5.
Visualization of the social-media-driven knowledge graph of urban flood-related road risks in BTH region: (a) the overall knowledge graph; (b) an enlarged subgraph of Zhuozhou; and (c) an enlarged subgraph of Tianjin.
Figure 5.
Visualization of the social-media-driven knowledge graph of urban flood-related road risks in BTH region: (a) the overall knowledge graph; (b) an enlarged subgraph of Zhuozhou; and (c) an enlarged subgraph of Tianjin.
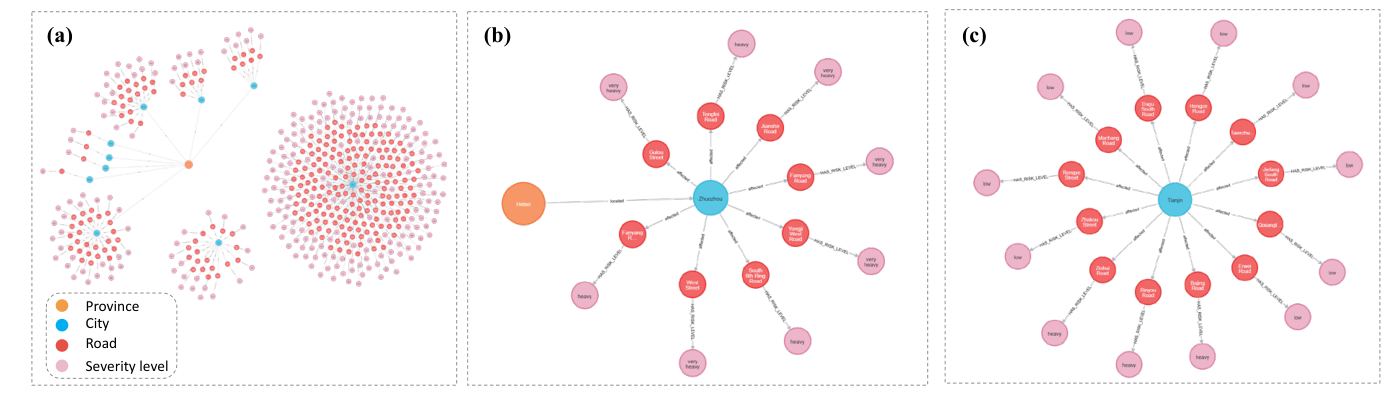

Table 1.
Social media data used in the two case studies.
| Study Area | Collection Platform | Collection Period | Social Media Data (posts) |
| Henan Province | 16 July 2021 - 23 July 2021 | 84,148 | |
| Beijing-Tianjin-Hebei | 28 July 2023 - 9 August 2023 | 102,179 |
Table 2.
Description and semantic indicators of flood-related road impact severity levels derived from social media reports [20].
Table 2.
Description and semantic indicators of flood-related road impact severity levels derived from social media reports [20].
| Impact Level | Severity | Typical semantic indicators |
| Level 0 | very heavy | Serious/major/substantive/damage, serious injury, death of personnel, trapped, drowning, flooding, traffic paralysis, inability to pass, damage, collapse/collapse/collapse, landslide, mudslide flow, washout, urgent/urgent, severe disaster area, heavy injury, closure, flood discharge, embankment burst. |
| Level 1 | heavy | Some/extensive damage, multiple people injured, obstructed/damaged, congested, inconvenient transportation, deep mud/water accumulation, affected, requiring rescue. |
| Level 2 | medium | Mild/minor/water accumulation, minor/minor/minor injury, walking slowly, slightly muddy, slippery, with small potholes, etc. |
| Level 3 | low | No/zero damage, no death, no damage, provide a venue/rest area/shelter/shelter, recover. |
Table 3.
Comparison of Deduplication Methods.
| Method | Algorithm Type | Computation Time/s | Accuracy/% |
| MinHash | Locality-Sensitive Hashing | 13.78 | 90.5 |
| SimHash | Text Fingerprinting Hash | 109.08 | 87.5 |
| Embedding | Semantic Vector Matching | 577.43 | 85.1 |
| Embedding-MinHash-LSH | Our Method | 191.46 | 94.1 |
Table 4.
Classification performance.
| Method | Precision | Recall | F1 Score | Accuracy |
| SVM | 0.76 | 0.76 | 0.74 | 0.76 |
| RF | 0.71 | 0.73 | 0.69 | 0.73 |
| AdaBoost | 0.75 | 0.69 | 0.70 | 0.69 |
| Word2vec | 0.56 | 0.46 | 0.49 | 0.71 |
| RNN | 0.95 | 0.95 | 0.95 | 0.95 |
| Transformer | 0.97 | 0.98 | 0.97 | 0.97 |
Disclaimer/Publisher’s Note: The statements, opinions and data contained in all publications are solely those of the individual author(s) and contributor(s) and not of MDPI and/or the editor(s). MDPI and/or the editor(s) disclaim responsibility for any injury to people or property resulting from any ideas, methods, instructions or products referred to in the content. |
© 2026 by the authors. Licensee MDPI, Basel, Switzerland. This article is an open access article distributed under the terms and conditions of the Creative Commons Attribution (CC BY) license.
Copyright: This open access article is published under a Creative Commons CC BY 4.0 license, which permit the free download, distribution, and reuse, provided that the author and preprint are cited in any reuse.