

Submitted:
15 October 2026
Posted:
20 October 2026
You are already at the latest version
Abstract
Anti-money-laundering monitoring divides work between a model and a team of analysts: the model ranks transactions, analysts review as many alerts as their capacity allows, and the labels they return are the model’s only supervision. A budget spent on the highest-scoring alerts maximizes immediate seizures while leaving the model blind to patterns it has not yet learned. This exploitation-exploration trade-off is known in fraud detection, but how to adapt the split of a review budget to concept drift has received little attention. We propose DAT, a drift-adaptive triage policy that splits the review budget between a detection and an exploration channel. It selects the highest-risk transactions for detection, then transactions that are uncertain under the current model or distributionally novel for exploration, clustering the latter so the budget buys distinct information rather than near-duplicates, and adapts the split online from two drift signals: the analyst hit rate in the detection channel and the divergence between the current and the training distributions. Every alert carries the reason it was raised so that a team can tell a seizure case from a learning case, a design element we specify but do not evaluate, because our analysts are simulated. Replaying the labeled Elliptic Bitcoin transactions step by step with simulated analysts at a 10% budget and a 1-step label delay, DAT retains 52% of its pre-shift illicit-class F1 after the documented distribution shift, against 42% for a drift-triggered policy that widens exploration only once a detector fires and 36% for pure exploitation, while catching as many illicit transactions as either, 707 against 692 and 680, and at no measurable cost in pre-shift F1. The review budget is an enforcement resource and a learning channel at once, and DAT lets a team set how it is divided.
Keywords:
anti-money laundering
; alert triage
; human-in-the-loop learning
; concept drift
; active learning
; collaborative decision making
1. Introduction
Anti-money-laundering (AML) compliance is a collaborative workflow in which an automated monitoring system and a team of human analysts depend on each other: the system scores transactions and raises alerts, analysts investigate as many alerts as their capacity allows and decide whether to file a report, and the decisions they record return to the system as labels. Three properties distinguish this loop from standard supervised learning: review capacity is a hard constraint, labels exist only for reviewed alerts, and they arrive after an investigation delay [1,2].
The policy deciding which alerts reach an analyst therefore determines both what the institution seizes today and what the model learns for tomorrow. Alerts are conventionally ranked by risk score and the standard benchmark evaluates detectors by precision within a fixed investigator budget [3], whereas active learning selects the cases the model learns most from [4,5,20,21]. These objectives compete for the same budget, and the conflict matters most when the distribution shifts [5,6]. The Elliptic Bitcoin dataset documents such an event: after a dark marketplace was shut down at time step 43, the performance of the models evaluated on it degraded sharply and did not recover [7]. As Figure 1 illustrates, pure exploitation presents analysts only with transactions resembling patterns the model has learned, so its labels mostly confirm what the model already believes, whereas pure exploration confirms too few illicit transactions for a compliance function measured on enforcement. Concept drift adaptation has been studied extensively as a learning problem [8], whereas driving the split of a human review budget directly from drift signals has received comparatively little attention. That distinction matters for reading the prior negative result: Carcillo et al. found exploratory querying no better than highest-risk querying for card fraud [5], and our replay reproduces exactly that while the distribution is stable, with the gain appearing only after the shift.
To address this limitation, we propose DAT, a drift-adaptive triage policy for human-in-the-loop AML. Our key idea is to treat the review budget, the mechanism coordinating the division of labor between model and team, as a resource allocated jointly for enforcement and for learning, and to let the allocation respond to evidence of drift. DAT splits the budget between a detection channel of highest-risk transactions and a clustered exploration channel of uncertain or distributionally novel ones, and adapts the split online from the analyst hit rate in the detection channel and the divergence between the current and the training distributions. Because an exploration alert is a likely false positive by construction, we attach a reason tag to every alert, which keeps the division of labor between model and team auditable. At a 10% review budget, DAT catches about as many illicit transactions as the best baseline (707 against 692 for the drift-triggered policy, a gap smaller than the seed standard deviation of DAT) and retains 52% of its pre-shift F1 after the shift, against 42% for that policy and 36% for pure exploitation.
Our work makes three main contributions. First, we formulate alert triage as the joint allocation of a fixed analyst review budget between enforcement and learning, which makes explicit the trade-off that a risk-control team actually faces. Second, we propose DAT, which adapts this allocation online from the detection hit rate and a label-free divergence signal, and specify a per-channel reason tag that keeps the allocation auditable without evaluating its effect on analysts. Third, we report a step-by-step replay evaluation on the Elliptic Bitcoin dataset across review budgets and label delays, which shows that pure exploitation degrades at the shift while pure exploration forfeits most seizures, and that an adaptive split retains much of both.
2. Related Work
2.1. Anti-Money Laundering and Financial Crime Detection
Weber et al. released the Elliptic Bitcoin dataset, compared graph convolutional networks [9] with tree ensembles and reported the degradation after step 43 [7]. Pareja et al. proposed EvolveGCN to adapt graph parameters over time [10], Elmougy and Liu extended the dataset with wallet-address nodes [11], and Altman et al. released synthetic AML transactions with ground-truth patterns [12]. These works evaluate detection on a fixed labeled test set, whereas we evaluate a detector together with the review process that supplies its labels.
2.2. Alert Triage Under a Review Budget
Dal Pozzolo et al. formalized the constraint that only a limited number of alerts can be investigated, modeling the alert-feedback interaction and the delay with which labels return [1], around which Carcillo et al. built a streaming framework [13]. Le Borgne et al. consolidated the resulting evaluation practice, in which detectors are compared by precision within a fixed daily investigator budget [3] and the area under the precision-recall curve is preferred under heavy class imbalance [14]. Work on learning to defer asks which decisions should be routed to a human at all [15,16], and Alves et al. studied deferral to multiple fraud analysts under capacity and asymmetric costs [17]. These works maximize immediate decision quality; we ask how a committed budget should be divided to maximize the cumulative outcome.
2.3. Active Learning and Concept Drift
Active learning selects the examples whose labels are most informative, most commonly by uncertainty sampling [4,18,19]. Carcillo et al. assessed streaming active learning for real card fraud under a daily investigation budget and highlighted an exploitation-exploration trade-off, but found exploratory querying no better than highest-risk querying combined with stochastic semi-supervised learning [5]. Soemers et al. cast the choice of which transactions to investigate as a contextual bandit over an incremental regression tree and obtained higher cumulative reward than offline models, especially under concept drift [6]. Lorenz et al. showed on Elliptic that a small number of actively selected labels approaches fully supervised performance [20], and Barata et al. studied the cold-start regime [21]. Gama et al. surveyed concept drift as a learning problem with detection, understanding, and adaptation stages [8]. We differ from these works in driving an explicit, bounded exploration share from a hit-rate and a label-free divergence signal. Consistent with the finding of Carcillo et al., exploration brings no gain while the distribution is stable in our replay: the gain from DAT arises after the shift.
3. Method
3.1. Problem Formulation
Transactions arrive in discrete time steps . At step t a model assigns each transaction a risk score , and a triage policy selects with , where is the team capacity as a fraction of the stream. The labels of are revealed at step , where d is the investigation delay, and the model is retrained on all labels revealed so far, that is, on the 29,894 initial labels of steps 1 to 34 plus every label the triage policy has revealed up to step t. The objective is the cumulative number of illicit transactions confirmed over the horizon, , which rewards both immediate seizures and the learning that enables later ones.
3.2. Method Overview
Figure 2 shows our system. Our key idea is that the split of a fixed review budget should depend on how far the transaction distribution has moved from the training data. At each step DAT allocates of the budget to a detection channel and to an exploration channel, tags the alerts with the reason they were raised, and updates from two drift signals.
3.3. Detection Channel
We allocated of the budget to the highest-scoring transactions under the current model, which reproduces the conventional ranking policy and preserves the enforcement output a compliance function is measured on [3], and tagged every alert from this channel as a seizure alert.
3.4. Exploration Channel
We allocated the remaining to transactions the model stands to learn from. Because uncertainty is computed under the current model and is itself unreliable once the distribution has moved, we ranked candidates by a weighted sum of predictive uncertainty, the closeness of the score to the threshold [4,18], and distributional novelty, the feature-space distance to the training data, which does not depend on calibration. Because drift produces many similar novel transactions at once, we clustered the top candidates, took representatives from distinct clusters and tagged these as learning alerts. The quotas are and ; exploration excludes transactions chosen for detection, and when exceeds the number of clusters k the remaining slots go to the next-ranked candidates round-robin across clusters, so that .
3.5. Drift-Adaptive Allocation
We updated from two signals that need no additional review effort. The first is the analyst hit rate in the detection channel, , the fraction of step s’s seizure alerts analysts confirmed as illicit, whose fall indicates the model is ranking on patterns that no longer identify laundering. Because the labels of step s return at , the most recent hit rate known when the alerts of step t are chosen is . The second is a distribution divergence between the features of the current step and those of the training window, which needs no labels and is computable from before is chosen. We combined them as
where is a running average of the available hit rates over a reference window and and are sensitivity coefficients, and we chose so the detection channel always retains a majority of the budget, which we regard as a precondition for the policy to be acceptable to a compliance function. We set , and , all selected by the validation protocol of Section 4.4.
3.6. Reason Tags
Because a learning alert is likely to be a false positive, silently mixing the channels would appear to analysts as degraded alert quality, so we attached the channel of origin to every alert as a reason tag. It lets a team report precision per channel and makes the allocation auditable. In our simulation it does not influence the simulated decisions, so whether it preserves analyst trust is untested here.
4. Experiments
4.1. Dataset and Simulation Protocol
We evaluated DAT on the Elliptic Bitcoin dataset [7], which contains 203,769 transactions over 49 time steps with 166 features per transaction, of which 4545 are labeled illicit and 42,019 licit; it is public, temporal, and contains a documented distribution shift at step 43. We replayed the stream step by step: we trained an initial model on steps 1 to 34, following the standard temporal split [7], then at each subsequent step scored the labeled transactions of that step, selected of them with the triage policy, revealed their labels after a delay of d steps, and retrained on all labels revealed so far, keeping the 29,894 initial labels in every retraining set. We restricted the simulation to labeled transactions, the only ones on which feedback can be simulated, so is richer in illicit cases than a real queue. The replay covers 16,670 labeled transactions, 1083 of them illicit (6.5%), or 1111 labeled transactions per step on average, while the initial model is trained on 29,894 labeled transactions, 3462 of them illicit, so a budget of , 10, and 20% buys about 834, 1667, and 3334 reviews over the replay before per-step rounding. The simulated analyst returns the ground-truth label without error unless stated otherwise (Section 4.9). Headline results use ; one Elliptic step spans about two weeks [7], so this is a realistic investigation time, and is a sensitivity setting only.
4.2. Baselines
We compared DAT with the following triage policies under an identical model, budget, and delay:
- Static: never retrain; spend the budget on the initial model’s highest-scoring transactions, isolating the value of analyst feedback.
- Exploitation: spend the whole budget on the highest-scoring transactions, the conventional policy [3].
- Uncertainty: spend it all on the most uncertain transactions, standard active learning [4].
- Random: a uniform random sample of the budget.
- Fixed mixture: a constant exploration fraction of 0.15, equal to , with the same exploration channel as DAT, a static form of the exploitation-exploration mixture discussed by Carcillo et al. [5].
- Fixed mixture, tuned: a constant fraction chosen from by the same validation protocol as DAT, which isolates the value of adaptivity from that of a well-chosen share.
- Drift-triggered: pure exploitation until an ADWIN detector [22] () on the detection hit rate fires, then exploration at DAT’s ceiling for five steps, the obvious alternative to continuous adaptation.
- DAT (ours).
We used a random forest as the underlying model because Weber et al. report it above their graph convolutional networks on this dataset [7]: it is the dataset’s own strongest model rather than a weak stand-in, so the policy comparison is not confounded by an avoidably poor detector.
4.3. Evaluation Metrics
The primary metric is the cumulative illicit transactions caught over the replay; post-shift recovery is the mean illicit-class F1 over steps 43 to 49 and pre-shift performance the same over steps 35 to 42. F1 at step t is computed for at threshold on all labeled transactions of that step before any of its labels are revealed, and we also report post-shift AUPRC [14]. The analyst hit rate is the signal the controller reads off the detection channel rather than a reported outcome. We report every metric as the mean and standard deviation over 10 seeds, because both the model and the exploration sampling are stochastic.
4.4. Implementation Details
The random forest has 500 trees with class weights balanced per bootstrap sample. We measured uncertainty as and novelty as the standardized distance to the 10 nearest training transactions, ranking exploration candidates by times the former plus times the latter. We clustered the candidates with k-means, with , and took the highest-ranked transaction of each cluster. The divergence is the RBF-kernel maximum mean discrepancy between the standardized features of the current step and the training window, normalized to using training-period data only, so no test step enters the normalization: we divide by the largest MMD on the validation windows and clip at 1. We set and and computed over the preceding 6 available steps. We selected all controller settings (, , , , , the window of , the exploration weights) and the tuned fixed fraction by rolling-origin validation on cumulative seizures within steps 1 to 34, on windows containing a distribution change, each model trained only on earlier steps. No step from 35 to 49 informed any choice, and Figure 3(b) is post-hoc. We used all 166 features rather than the 94 local ones, because the 72 aggregated neighborhood features carry structure that novelty reads off; with the local features alone post-shift recovery falls by about 0.04 for every policy. One replay of the 15 steps takes 4.3 min on 16 CPU cores, and all runs take 28 h.
4.5. Results
Table 1 reports the main comparison. Before the shift DAT and pure exploitation both reach 0.81, so the exploration share costs little while the distribution is stable. After the shift exploitation retains 0.29, that is 36% of its pre-shift F1, and DAT retains 0.42, or 52%. These seven steps hold 169 of the replay’s 1083 illicit transactions, and two of them hold 5 and 2, so the post-shift column is a small-sample estimate and carries more uncertainty than the seed deviations show. DAT catches 707 illicit transactions against 680, a margin larger than the seed-to-seed deviation of either, so over the replay the exploration share is not paid for out of enforcement output.
Two comparisons locate the gain, and together they separate it from simply retraining more often. The static model ends at 0.24 post-shift; retraining on exploitation-selected labels adds 14 seizures and 0.05 F1, and reallocating the same budget adds a further 27 and 0.13. Reallocation is therefore worth about twice what retraining on the same budget is in seizures and about two and a half times in post-shift F1. Uncertainty sampling reaches 0.37 post-shift but catches 282, and random sampling 113, near the 109 the 6.5% illicit rate predicts, so the budget has to be split rather than switched. The tuned fixed mixture reaches 683 / 0.34, which DAT exceeds by 24 seizures and 0.08 post-shift F1, beyond the seed deviation in F1; its criterion is cumulative seizures, which is why it beats the untuned 0.15 on seizures, 683 against 677, and not on post-shift F1, 0.34 against 0.36. The drift-triggered policy is the strongest baseline on seizures, 692, which DAT exceeds by 15, inside its own seed deviation, but it retains only 42% of its pre-shift F1 against 52% for DAT. Reacting to drift recovers the seizures; reacting continuously rather than in one five-step burst recovers the model. Our exploitation baseline reproduces the degradation Weber et al. report at step 43 [7].
4.6. Ablation Study
We removed one component at a time (Table 2). Removing the divergence signal costs 23 seizures and 0.07 post-shift F1, and removing the novelty criterion 22 and 0.02. The divergence signal causes the largest loss on both metrics, consistent with its role as the only signal that does not wait for analyst labels; every variant still exceeds pure exploitation in mean on both metrics, so the result comes from the combination rather than from one mechanism.
4.7. Sensitivity to Budget and Label Delay
Exploration pays off only after the delay d, and its cost grows as the budget shrinks, so we swept both (Table 3). Delay erodes the seizure margin at every budget, and under the smallest budget with the slowest feedback (, ) it reverses to , the one cell where exploration is not repaid within the horizon. The post-shift F1 margin stays positive in all nine cells, between and , and grows with the budget at every delay.
4.8. Adaptation Dynamics
Figure 3(a) traces over steps 35 to 49 for DAT and the drift-triggered policy and the per-channel hit rate of DAT, and Figure 3(b) the trade-off between seizures and post-shift recovery as varies. Because is computed from step t’s features before its alerts are chosen, can rise at step 43 already, whereas the hit-rate term reacts only at step . The detection hit rate falls from 0.89 at step 42 to 0.07 at step 43 and rises from 0.18 to 0.32, reaching 0.40 at step 45; the controller then releases budget back to detection as the divergence decays from 0.71 to 0.22 and the hit rate recovers to 0.43 by step 49, leaving at 0.27. ADWIN fires at step 44, after which the drift-triggered policy holds its share for five steps. The exploration-channel hit rate stays below the detection channel’s at every step except step 46, where both are zero. Table 4 lists , and the illicit count per step; after step 42 the few illicit transactions present bound what either channel can catch.
Panel (b) is post-hoc sensitivity, not the selection procedure. Seizures peak at with 707 caught and fall to 696 at 0.60, while post-shift F1 gains only 0.019 above 0.40, so the selected ceiling coincides with the post-hoc optimum.
4.9. Robustness to Analyst Error and Model Family
Analyst error attacks both the hit-rate signal and the training data. We simulated analysts who miss an illicit transaction with probability and wrongly confirm a licit one with probability , for , and we repeated the comparison with a gradient-boosted tree [23] in place of the random forest. Here “Caught” counts reviewed transactions whose ground-truth label is illicit and that the simulated analyst confirmed, so a missed illicit transaction is not counted as caught. As rises to 0.2 the seizure margin moves from 27 to 24 and the post- shift margin from 0.13 to 0.11, and with a gradient-boosted tree in place of the random forest they are 30 and 0.13 (Table 5). Neither margin closes under either perturbation, which we attribute to the divergence signal: it is computed from features alone and bounds how far a noisy hit rate can move the split.
5. Discussion
The evidence supports a modest, adaptive exploration share rather than a fixed one: starting at 15% and free to widen to 40% under drift, it costs no seizures and recovers more of the model after the shift than any constant share we tried. A small budget with a long label delay is the condition a team should check first, the only cell of Table 3 where DAT catches fewer illicit transactions, because labels bought today may arrive too late to become seizures.
Limitations. Our simulation assumes uniform review cost, a fixed budget and case-independent analyst error, whereas real errors concentrate on hard cases and a real team can surge capacity. We simulate feedback only on the labeled transactions, 46,564 of the 203,769 in the dataset, so the pool is richer in illicit cases than a real alert queue, the budget is a fraction of it rather than of the full stream, and absolute seizure counts do not transfer to deployment. Our post-shift figures rest on the seven steps after step 43, which hold far fewer illicit transactions, so they carry wider uncertainty than the seed-to-seed deviations suggest.
Future work. We will extend the allocation to analysts who differ in expertise and capacity [17].
6. Conclusions
References
- Dal Pozzolo, A.; Boracchi, G.; Caelen, O.; Alippi, C.; Bontempi, G. Credit Card Fraud Detection: A Realistic Modeling and a Novel Learning Strategy. IEEE Trans. Neural Netw. Learn. Syst. 2018, 29, 3784–3797. [Google Scholar] [CrossRef] [PubMed]
- Grzenda, M.; Gomes, H.M.; Bifet, A. Delayed Labelling Evaluation for Data Streams. Data Min. Knowl. Discov. 2020, 34, 1237–1266. [Google Scholar] [CrossRef]
- Le Borgne, Y.A.; Siblini, W.; Lebichot, B.; Bontempi, G. Reproducible Machine Learning for Credit Card Fraud Detection – Practical Handbook. In Université Libre de Bruxelles; 2022; Available online: https://fraud-detection-handbook.github.io/fraud-detection-handbook/.
- Settles, B. Active Learning Literature Survey. Computer Sciences Technical Report 1648; University of Wisconsin–Madison, Department of Computer Sciences, 2009.
- Carcillo, F.; Le Borgne, Y.A.; Caelen, O.; Bontempi, G. Streaming Active Learning Strategies for Real-Life Credit Card Fraud Detection: Assessment and Visualization. Int. J. Data Sci. Anal. 2018, 5, 285–300. [Google Scholar] [CrossRef]
- Soemers, D.; Brys, T.; Driessens, K.; Winands, M.; Nowé, A. Adapting to Concept Drift in Credit Card Transaction Data Streams Using Contextual Bandits and Decision Trees. In Proceedings of the Proc. AAAI Conference on Artificial Intelligence (IAAI track), 2018; Vol. 32. [Google Scholar] [CrossRef]
- Weber, M.; Domeniconi, G.; Chen, J.; Weidele, D.K.I.; Bellei, C.; Robinson, T.; Leiserson, C.E. Anti-Money Laundering in Bitcoin: Experimenting with Graph Convolutional Networks for Financial Forensics. KDD 2019 Workshop Anom. Detect. Financ. 2019, arXiv:1908.02591. [Google Scholar] [CrossRef]
- Gama, J.; Žliobaitė, I.; Bifet, A.; Pechenizkiy, M.; Bouchachia, A. A Survey on Concept Drift Adaptation. ACM Comput. Surv. 2014, 46, 1–37. [Google Scholar] [CrossRef] [PubMed]
- Kipf, T.N.; Welling, M. Semi-Supervised Classification with Graph Convolutional Networks. In Proceedings of the Proc. International Conference on Learning Representations (ICLR), 2017; p. 1609.02907. [Google Scholar]
- Pareja, A.; Domeniconi, G.; Chen, J.; Ma, T.; Suzumura, T.; Kanezashi, H.; Kaler, T.; Schardl, T.; Leiserson, C. EvolveGCN: Evolving Graph Convolutional Networks for Dynamic Graphs. Proc. Proc. AAAI Conf. Artif. Intell. 2020, Vol. 34, 5363–5370. [Google Scholar] [CrossRef]
- Elmougy, Y.; Liu, L. Demystifying Fraudulent Transactions and Illicit Nodes in the Bitcoin Network for Financial Forensics. In Proceedings of the Proc. 29th ACM SIGKDD Conference on Knowledge Discovery and Data Mining (KDD), 2023; pp. 3979–3990. [Google Scholar] [CrossRef]
- Altman, E.; Blanuša, J.; von Niederhäusern, L.; Egressy, B.; Anghel, A.; Atasu, K. Realistic Synthetic Financial Transactions for Anti-Money Laundering Models. In Proceedings of the Advances in Neural Information Processing Systems 36 (NeurIPS), Datasets and Benchmarks Track, 2023; pp. 29851–29874, [2306.16424. [Google Scholar]
- Carcillo, F.; Dal Pozzolo, A.; Le Borgne, Y.A.; Caelen, O.; Mazzer, Y.; Bontempi, G. SCARFF: A Scalable Framework for Streaming Credit Card Fraud Detection with Spark. Inf. Fusion 2018, 41, 182–194. [Google Scholar] [CrossRef]
- Saito, T.; Rehmsmeier, M. The Precision-Recall Plot Is More Informative than the ROC Plot When Evaluating Binary Classifiers on Imbalanced Datasets. PLoS ONE 2015, 10, e0118432. [Google Scholar] [CrossRef] [PubMed]
- Madras, D.; Pitassi, T.; Zemel, R. Predict Responsibly: Improving Fairness and Accuracy by Learning to Defer. In Proceedings of the Advances in Neural Information Processing Systems 31 (NeurIPS), 2018; p. 1711.06664. [Google Scholar]
- Mozannar, H.; Sontag, D. Consistent Estimators for Learning to Defer to an Expert. Proc. Proc. 37th Int. Conf. Mach. Learn. (ICML) 2020, Vol. 119, PMLR, 7076–7087. [Google Scholar]
- Alves, J.V.; Leitão, D.; Jesus, S.; Sampaio, M.O.P.; Liébana, J.; Saleiro, P.; Figueiredo, M.A.T.; Bizarro, P. Cost-Sensitive Learning to Defer to Multiple Experts with Workload Constraints. Trans. Mach. Learn. Res. 2024, 2403.06906. [Google Scholar]
- Lewis, D.D.; Gale, W.A. A Sequential Algorithm for Training Text Classifiers. In Proceedings of the Proc. 17th Annual International ACM SIGIR Conference on Research and Development in Information Retrieval, 1994; pp. 3–12. [Google Scholar] [CrossRef]
- Ren, P.; Xiao, Y.; Chang, X.; Huang, P.Y.; Li, Z.; Gupta, B.B.; Chen, X.; Wang, X. A Survey of Deep Active Learning. ACM Comput. Surv. 2021, 54, 1–40. [Google Scholar] [CrossRef]
- Lorenz, J.; Silva, M.I.; Aparício, D.; Ascensão, J.T.; Bizarro, P. Machine Learning Methods to Detect Money Laundering in the Bitcoin Blockchain in the Presence of Label Scarcity. In Proceedings of the Proc. 1st ACM International Conference on AI in Finance (ICAIF), 2020; pp. 1–8. [Google Scholar] [CrossRef]
- Barata, R.; Leite, M.; Pacheco, R.; Sampaio, M.O.P.; Ascensão, J.T.; Bizarro, P. Active Learning for Imbalanced Data under Cold Start. In Proceedings of the Proc. 2nd ACM International Conference on AI in Finance (ICAIF), 2021; pp. 1–9. [Google Scholar] [CrossRef]
- Bifet, A.; Gavaldà, R. Learning from Time-Changing Data with Adaptive Windowing. In Proceedings of the Proc. 7th SIAM International Conference on Data Mining (SDM), 2007; pp. 443–448. [Google Scholar] [CrossRef]
- Ke, G.; Meng, Q.; Finley, T.; Wang, T.; Chen, W.; Ma, W.; Ye, Q.; Liu, T.Y. LightGBM: A Highly Efficient Gradient Boosting Decision Tree. In Proceedings of the Advances in Neural Information Processing Systems 30 (NeurIPS), 2017; pp. 3146–3154. [Google Scholar]
Figure 1.
The review budget of one step has to buy two things. Spending all of it on the highest-scoring alerts confirms illicit transactions today but leaves a laundering pattern the model has not learned unreviewed. DAT holds back a share for exploration, clusters those candidates, and widens the share when the analyst hit rate falls and the transaction distribution moves away from the training window (schematic, illustrative bars).
Figure 1.
The review budget of one step has to buy two things. Spending all of it on the highest-scoring alerts confirms illicit transactions today but leaves a laundering pattern the model has not learned unreviewed. DAT holds back a share for exploration, clusters those candidates, and widens the share when the analyst hit rate falls and the transaction distribution moves away from the training window (schematic, illustrative bars).
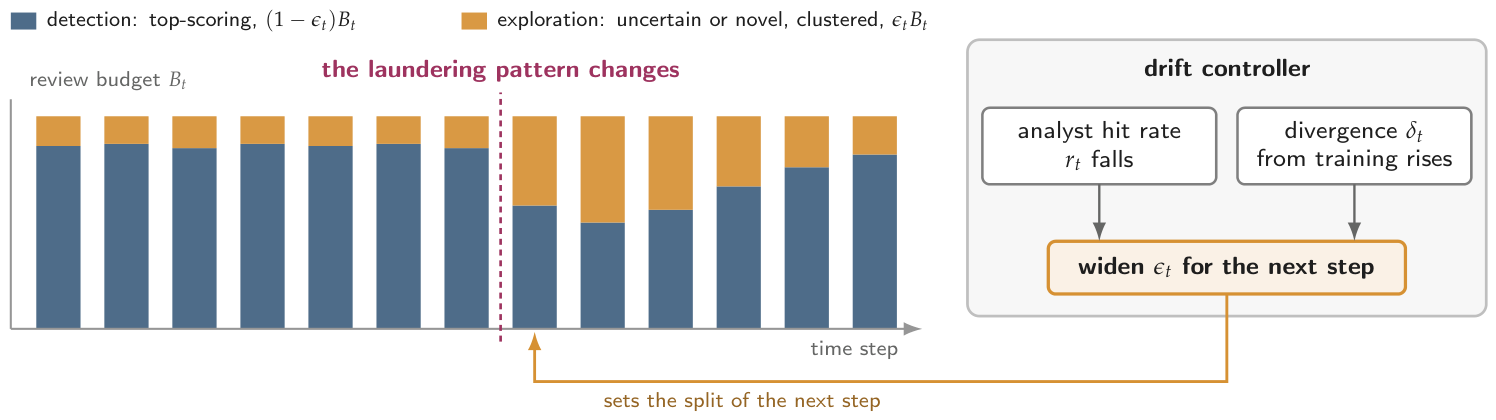
Figure 2.
Overview of DAT. The split is the only quantity the policy controls. The detection channel reproduces the conventional ranking; the exploration channel scores candidates on uncertainty and novelty and clusters them. Every alert carries the tag of its channel; the hit rate is read off the seizure channel, and the divergence needs no labels.
Figure 2.
Overview of DAT. The split is the only quantity the policy controls. The detection channel reproduces the conventional ranking; the exploration channel scores candidates on uncertainty and novelty and clusters them. Every alert carries the tag of its channel; the hit rate is read off the seizure channel, and the divergence needs no labels.
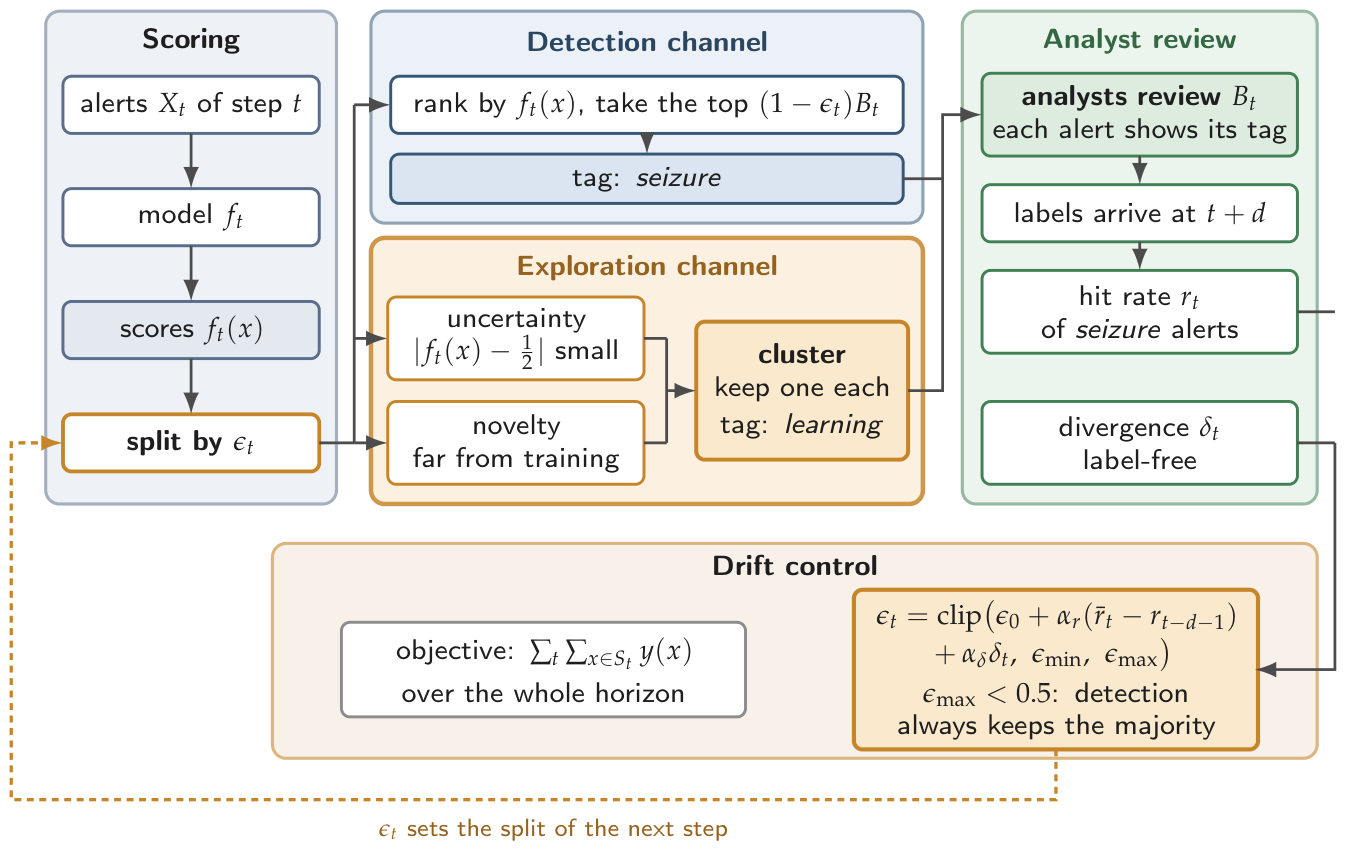
Figure 3.
Adaptation dynamics around the shift at step 43. (a) The exploration share of DAT and the drift-triggered policy and the per-channel analyst hit rate of DAT over the replay (, ), with the number of illicit transactions per step (gray bars, right axis). (b) Seizures and post-shift recovery as the ceiling varies (post-hoc sensitivity).
Figure 3.
Adaptation dynamics around the shift at step 43. (a) The exploration share of DAT and the drift-triggered policy and the per-channel analyst hit rate of DAT over the replay (, ), with the number of illicit transactions per step (gray bars, right axis). (b) Seizures and post-shift recovery as the ceiling varies (post-hoc sensitivity).
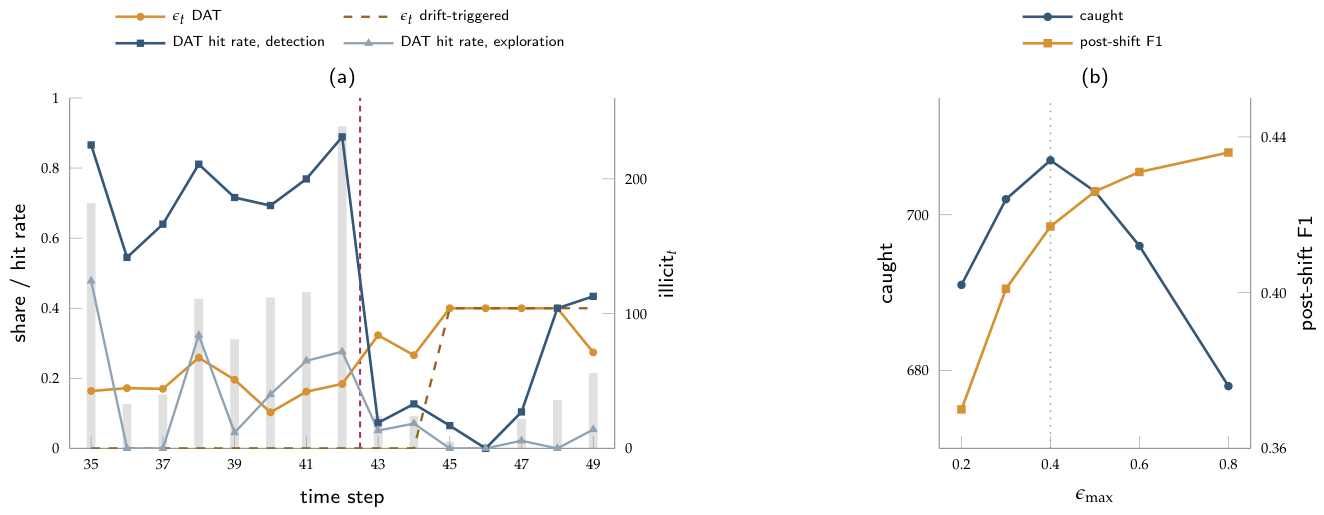

Table 1.
Cumulative illicit transactions caught, illicit-class F1 before and after the shift, and post-shift AUPRC, at and (mean ± s.d., 10 seeds). Best mean per column in bold.
Table 1.
Cumulative illicit transactions caught, illicit-class F1 before and after the shift, and post-shift AUPRC, at and (mean ± s.d., 10 seeds). Best mean per column in bold.
| Policy | Caught | Post F1 | Pre F1 | Post AUPRC |
|---|---|---|---|---|
| Static | 666 ± 15 | 0.24 ± 0.01 | 0.79 ± 0.01 | 0.31 ± 0.01 |
| Exploitation | 680 ± 16 | 0.29 ± 0.01 | 0.81 ± 0.01 | 0.37 ± 0.02 |
| Uncertainty | 282 ± 16 | 0.37 ± 0.02 | 0.77 ± 0.01 | 0.47 ± 0.02 |
| Random | 113 ± 8 | 0.33 ± 0.02 | 0.78 ± 0.01 | 0.42 ± 0.02 |
| Fixed mixture | 677 ± 13 | 0.36 ± 0.02 | 0.80 ± 0.01 | 0.43 ± 0.01 |
| Fixed, tuned | 683 ± 22 | 0.34 ± 0.02 | 0.80 ± 0.01 | 0.44 ± 0.01 |
| Drift-triggered | 692 ± 13 | 0.34 ± 0.01 | 0.81 ± 0.01 | 0.42 ± 0.01 |
| DAT (ours) | 707 ± 18 | 0.42 ± 0.02 | 0.81 ± 0.01 | 0.47 ± 0.02 |
Table 2.
Ablation at , (caught / post-shift F1, mean ± s.d.). Pure exploitation: 680 / 0.29.
| Variant | Caught | Post-shift F1 |
|---|---|---|
| DAT (full) | 707 ± 18 | 0.42 ± 0.02 |
| w/o novelty criterion | 685 ± 11 | 0.40 ± 0.02 |
| w/o cluster diversification | 691 ± 16 | 0.40 ± 0.02 |
| w/o hit-rate signal | 702 ± 9 | 0.37 ± 0.02 |
| w/o divergence signal | 684 ± 17 | 0.35 ± 0.02 |
Table 3.
DAT minus exploitation: illicit transactions caught / post-shift F1, by budget and label delay d; positive favors DAT.
Table 3.
DAT minus exploitation: illicit transactions caught / post-shift F1, by budget and label delay d; positive favors DAT.
| +14 / +0.09 | +6 / +0.06 | −5 / +0.02 | |
| +34 / +0.16 | +27 / +0.13 | +14 / +0.08 | |
| +42 / +0.17 | +36 / +0.15 | +24 / +0.10 |
Table 4.
Labeled transactions , review budget at , and illicit transactions per replay step.
| Step | 35 | 36 | 37 | 38 | 39 | 40 | 41 | 42 | 43 | 44 | 45 | 46 | 47 | 48 | 49 |
|---|---|---|---|---|---|---|---|---|---|---|---|---|---|---|---|
| 1418 | 527 | 596 | 1203 | 1094 | 1268 | 1231 | 1544 | 1209 | 1067 | 1023 | 948 | 1117 | 1074 | 1351 | |
| 142 | 53 | 60 | 121 | 110 | 127 | 124 | 155 | 121 | 107 | 103 | 95 | 112 | 108 | 136 | |
| Illicit | 182 | 33 | 40 | 111 | 81 | 112 | 116 | 239 | 24 | 24 | 5 | 2 | 22 | 36 | 56 |
Table 5.
Robustness at , : caught / post-shift F1.
| Setting | Exploitation | DAT |
|---|---|---|
| Random forest, | 680 / 0.29 | 707 / 0.42 |
| Random forest, | 657 / 0.27 | 682 / 0.39 |
| Random forest, | 631 / 0.24 | 655 / 0.35 |
| Gradient-boosted tree, | 671 / 0.27 | 701 / 0.40 |
Disclaimer/Publisher’s Note: The statements, opinions and data contained in all publications are solely those of the individual author(s) and contributor(s) and not of MDPI and/or the editor(s). MDPI and/or the editor(s) disclaim responsibility for any injury to people or property resulting from any ideas, methods, instructions or products referred to in the content. |
© 2026 by the author. Licensee MDPI, Basel, Switzerland. This article is an open access article distributed under the terms and conditions of the Creative Commons Attribution (CC BY) license.
Copyright: This open access article is published under a Creative Commons CC BY 4.0 license, which permit the free download, distribution, and reuse, provided that the author and preprint are cited in any reuse.