

Submitted:
16 October 2026
Posted:
20 October 2026
You are already at the latest version
Abstract
Fungal communities inhabiting high-altitude environments are exposed to multiple environmental constraints, yet their diversity and genomic characteristics remain poorly characterized. Here, we investigated fungal diversity across 10 high-altitude localities in the Chilean Altiplano and Central Mountain region using ITS amplicon sequencing, complemented by comparative genomic analyses of 11 yeast isolates. Fungal commu-nities were evaluated based on taxonomic composition, alpha diversity, co-occurrence patterns, and relationships among sampling localities. Yeast isolates were analyzed using genomic similarity, synteny, functional profiles, stress-associated proteins, enzyme homologs, and mitochondrial genome characteristics. Ascomycota was the dominant phylum, but fungal community composition and alpha diversity varied among localities, with geographic structuring evident at the genus level. Co-occurrence networks revealed highly connected fungal communities, while many ASVs remained unclassified at lower taxonomic levels. Genome-scale analyses supported the classification of three isolates as Sporobolomyces salmonicolor and eight as Naganishia spp., highlighting the value of ge-nome-based approaches for resolving taxonomic relationships. Functional profiles were broadly conserved, but differences in GPI-anchor biosynthesis, galactose metabolism, steroid biosynthesis, and mitophagy were detected between isolates. In addition, stress-related and potentially biotechnologically relevant enzyme homologs were iden-tified. Mitochondrial genomes showed a conserved core of oxidative phosphorylation genes but substantial variation in introns, ORFs, and synteny, indicating marked mi-tochondrial genomic diversity. Together, these findings demonstrate substantial eco-logical and genomic diversity among fungi from high-altitude environments in Chile and reveal functional and genomic features that may be relevant to environmental adaptation and biotechnology.
Keywords:
Chilean Altiplano
; fungal diversity
; yeast isolates
; ITS metabarcoding
; comparative genomics
; mitochondrial genomes
; fungal taxonomy
; taxonomic identification
1. Introduction
Fungi are ecologically versatile and physiologically flexible organisms capable of persisting across a broad range of environmental conditions, including cold, dry, nutrient-limited, and otherwise stressful habitats. They are essential components of soil ecosystems, where they contribute to organic matter decomposition, nutrient cycling, and plant–microbe interactions. Fungi inhabiting persistently cold environments or experiencing periodic freezing have evolved physiological and biochemical adaptations that enable them to grow and survive at low temperatures while coping with associated stresses, including limited nutrient availability, low water activity, oxidative stress, and freeze–thaw fluctuations [1,2,3]. Cold environments encompass extensive areas of the Earth’s surface, including polar regions, high-mountain ecosystems, and the deep sea [4,5]. Despite their ecological importance, fungal communities inhabiting many of these environments remain comparatively understudied.
Among high-altitude environments, the Tibetan Plateau has received increasing attention, with recent studies based on ITS amplicon sequencing reporting diverse fungal communities dominated primarily by Ascomycota and Basidiomycota [6,7,8,9,10,11,12,13,14]. These studies highlight the considerable fungal diversity in high-altitude ecosystems and provide evidence that fungal communities can persist under the combination of environmental restrictions for life characteristic of these regions. The Altiplano, the second-largest high plateau in the world, extends across the central Andes of South America. The Chilean Altiplano has a mean elevation of approximately 3,700 m above sea level and is characterized by low precipitation, intense solar radiation, low atmospheric pressure and humidity, and pronounced diurnal and interannual temperature variability [15,16]. The simultaneous occurrence of high elevation, aridity, intense radiation, and substantial thermal variability creates a highly demanding environment for microbial life and provides a natural laboratory for investigating microbial communities exposed to multiple environmental stresses. Although microbial research in the Altiplano has historically focused more strongly on bacteria [17,18,19,20], recent studies have begun to characterize the diversity and composition of its fungal communities. In the Bolivian Altiplano, ITS-based analyses identified Ascomycota as the dominant phylum, with Fusarium and Didymella among the most abundant genera [21]. Similarly, ITS2 sequencing of soils from the Salar de Huasco in the Chilean Altiplano revealed diverse fungal communities dominated by Ascomycota and Basidiomycota [22]. More recently, analyses of soil fungal communities from the northern Chilean Altiplano also found a predominance of Ascomycota and Basidiomycota, while unclassified families and genera were prevalent at several sites, highlighting the substantial fraction of fungal diversity that remains taxonomically unresolved [23].
Among fungi, yeasts represent a biotechnologically important microbial group, particularly those adapted to cold environments. Cold-adapted yeasts have evolved a range of physiological and biochemical mechanisms, including changes in fatty acid composition to maintain membrane function, accumulation of cryoprotective compounds, and secretion of cold-active extracellular enzymes that facilitate the utilization of available carbon sources [24,25,26,27]. Recent next-generation sequencing studies have revealed substantial genomic diversity among cold-adapted yeasts, with genome sizes ranging from approximately 11 to 40 Mb and variation in GC content, reflecting diverse genomic and evolutionary characteristics [28,29,30]. Comparative genomic analyses of Glaciozyma antarctica identified lineage-specific genes, including those encoding cold-shock domain proteins [31], while analyses of Naganishia vishniacii identified genes associated with cold adaptation, including those involved in fatty-acid desaturation and trehalose biosynthesis [32] . In Mrakia psychrophila, the presence of numerous Major Facilitator Superfamily (MFS) transporter genes has been proposed to facilitate nutrient uptake under the nutrient-limited conditions characteristic of the Qinghai–Tibet Plateau [33,34]. Similarly, genomic and transcriptomic studies of eight Antarctic and four Alpine yeasts identified numerous orthologs associated with responses to cold and other environmental stresses, including genes involved in membrane remodeling, compatible-solute biosynthesis, protein folding, and responses to oxidative and osmotic stress [29,30,35].
A largely unexplored aspect of environmental yeasts is their mitochondrial genome (mitogenome), which encodes functions essential for cellular metabolism and energy production. The mitogenome is a mosaic of prokaryotic ancestry and eukaryotic innovation, exhibiting considerable evolutionary plasticity [36]. Although a conserved core of oxidative phosphorylation genes, including cytochrome components and ATP synthase subunits, is generally retained, fungal mitogenomes show extensive variation in size, gene order, intron content, and accessory elements. This diversity has been associated with processes such as intron proliferation, the accumulation of mobile genetic elements, horizontal gene transfer, and expansion of intergenic regions [37,38]. Fungal mitogenomes are predominantly circular, although linear forms also occur, and their sizes can range from approximately 12 to 236 kb. Their organization may vary substantially even among closely related or conspecific isolates, with frequent gene rearrangements likely mediated by intrachromosomal recombination, highlighting the dynamic nature of mitochondrial genome evolution [39]. In pathogenic fungi such as Cryptococcus neoformans and Candida albicans, mitogenomic variation has been associated with metabolic regulation, virulence, and antifungal resistance [40]. Similarly, mitogenomes of Trichoderma and Fusarium exhibit lineage-specific gene rearrangements, differences in tRNA gene content, and horizontally acquired or positively selected ORFs, further illustrating the evolutionary dynamism of fungal mitochondrial genomes [38].
In this work, we investigated fungal diversity in soils from 10 localities spanning high-altitude environments in Chile using two complementary approaches. First, we characterized fungal community composition through ITS amplicon sequencing to assess patterns of diversity and taxonomic distribution across these environments. Second, we conducted comparative genomic analyses of 11 yeast isolates recovered from different sites, including three isolates putatively assigned to the same species and eight isolates putatively belonging to the same genus. These analyses aimed to characterize genomic variation and identify genomic features potentially associated with the occurrence of these yeasts across contrasting environmental conditions, including variation in both nuclear and mitochondrial genomes. Together, these approaches provide complementary community- and genome-level perspectives on fungal diversity and genomic variation in high-altitude Chilean soils.
2. Results
2.1. Taxonomic Composition of Fungal Communities Across Sites
The relative abundance of fungal taxa at the phylum, family, and genus levels was calculated for each site. The ten sites showed variation in fungal community composition, with differences becoming more pronounced at lower taxonomic levels (Figure 1; supplementary Table S1). At the phylum level, Ascomycota was predominant at most sites, except at Paso Sico 3 (PS3), where most ASVs were unclassified, and at Salar Maricunga 2 (SM2), where Basidiomycota was slightly more abundant than Ascomycota.
At the family and genus levels, a large proportion of ASVs remained unclassified, with the highest proportions observed at Paso Sico 3 (PS3), Bofedal Maricunga 3 (BM3), and Laguna del Inca (LI1). Among the five most abundant taxa at each site, Herpotrichiellaceae and Hydnodontaceae were the most frequently represented families, while Subulicystidium, Cladosporium, Neophaeococcomyces, and Sporobolomyces were the most frequently represented genera. At the individual-site level, Hydnodontaceae was particularly abundant at Salar Maricunga 2 (SM2), Aspergillaceae at Ojos del Salado 1 (OS1), and Sporormiaceae at Bofedal Maricunga (BM1). Similarly, Subulicystidium was particularly abundant at SM2, Penicillium at OS1, and Preussia at BM1.
The structural organization and co-occurrence patterns of the fungal communities were evaluated through co-occurrence network analyses conducted at the family and genus levels. The resulting networks showed a densely connected topology, with a high density of associations among taxonomic groups at both levels (Figure 2). At the family level, central hub nodes, identified by high node degree (up to 20), were predominantly represented by Hydnodontaceae, Venturiaceae, and Pyrenotrichaceae, whereas at the genus level, the main hub nodes were Neophaeococcomyces, Subulicystidium, Penicillium, and Solicoccozyma.
2.2. Fungal Diversity Metrics and Comparative Analysis
Shannon diversity (H′) varied across sampling localities at both the family and genus levels, ranging from 0.6 at PS3 to 2.1 at Cristo Redentor 5 (CR5) for families and from 0.5 at PS3 to 1.7 at OS1 for genera. These differences were associated with contrasting combinations of taxon richness (S) and Pielou’s evenness (J′) among localities (supplementary Table S2). The site with the lowest family H′ (PS3) was characterized by low richness and evenness, whereas the site with the highest H′ (CR5) showed high family richness (S = 44) and relatively high evenness (J′ = 0.6). The remaining sites exhibited contrasting combinations of these components: BM3 had relatively high richness but lower evenness and H′; Bofedal Maricunga 1 (BM1) had low richness but intermediate H′ and moderate evenness; Salar Maricunga 3 (SM3) combined relatively high richness with moderately high H′; and OS1 showed low richness but relatively high evenness and H′. Similar patterns were observed at the genus level, where OS1 exhibited the highest H′ despite relatively low richness (S = 21) and high evenness (J′ = 0.6), whereas PS3 showed the lowest evenness and H′. When sampling localities were ordered by increasing Shannon diversity, the trajectory of Pielou’s evenness broadly paralleled that of H′, whereas taxon richness showed no consistent increase and fluctuated substantially among localities (Figure 3). This pattern was particularly evident in localities such as BM1 and OS1, which exhibited relatively high H′ despite lower richness than several sites with lower H′, coinciding with comparatively higher evenness.
Sites were compared based on the presence and abundance of fungal families and genera, with pairwise correlations and hierarchical clustering summarized in Figure 4. Positive correlations were observed among sites at both taxonomic levels. At the family level, the highest correlations (r = 0.6) occurred between PS2 and PS3, SM2 and SM3, and OS1 and PS3, whereas the lowest correlations (r = 0.2) were observed for five site pairs, including BM3–CR5 and LI1–PS2. At the genus level, the highest correlation was observed between SM2 and SM3 (r = 0.6), followed by correlations of r = 0.5 among CR6, LI1, PS2, and PS3. The lowest genus-level correlations (r = 0.1) occurred between CR5–OS1, BM3–CR5, and BM1–CR5. Hierarchical clustering revealed groupings consistent with the geographic distribution of the sampling sites, particularly at the genus level. Sites from the Altiplano formed distinct clusters comprising BM1–BM3, SM2–SM3, and PS2–PS3–OS1, whereas sites from the Central Mountain formed a cluster comprising CR5–CR6–LI1.
2.3. Yeast Genomic Characterization and Comparative Analysis
Yeasts isolated from Altiplano and Central Mountain sites in this study and in our previous study [23] were preliminarily assigned based on ITS region sequencing and comparison of the resulting sequences against the NCBI nr_clust database using BLASTn. Isolates showing high-confidence species-level matches to the same species but originating from different sampling sites were selected for genome sequencing (supplementary Table S3). Draft genomes were generated for 11 yeast isolates, all showing >90% complete BUSCOs (C), with genome sizes ranging from 20 to 39 Mbp and GC contents ranging from 51% to 61% (Figure 5A). The draft genomes were subjected to additional taxonomic analyses. Single-copy BUSCO sequences were extracted from each genome and compared against the NCBI nr_clust database using DIAMOND. The resulting hits were tabulated, and the taxonomic identities of the matching organisms were counted to determine the predominant taxonomic affiliations of each isolate. For most isolates, the predominant affiliations were consistent with those obtained from the ITS-based BLASTn analysis. The exception was isolate LI1-17, for which the ITS-based analysis yielded predominantly matches to Sporobolomyces salmonicolor, whereas the BUSCO-based analysis yielded predominantly matches to Naganishia albida and Filobasidium floriforme (supplementary Table S4). The reference genomes for the taxa identified in the previous analyses were downloaded and compared with the draft genomes using average nucleotide identity (ANI). The ANI comparisons yielded the highest similarities to reference genomes of Naganishia for eight isolates: N. antarctica for LC2-15 (83%), N. diffluens for CR5-9 and LC4-24 (79%), N. kalamii for BP6-25 and LI1-17 (89%) and CR2-8 (80%), and N. vaughanmartiniae for BP6-7 (84%) and LC2-21 (93%) (supplementary Table S4). The remaining three isolates showed the highest similarities to S. salmonicolor: BP6-19 (99%), LC2-23 (100%), and NP14-27 (100%). Considering the combined results from ITS-based identification, BUSCO-derived taxonomic affiliations, and ANI comparisons, eight isolates were putatively assigned to Naganishia spp., whereas three were putatively assigned to S. salmonicolor.
As a first comparative assessment, synteny analysis was performed across all 11 draft genomes. As shown in Figure 5B, the genomes formed distinct groups, with high-tier syntenic blocks shared predominantly among isolates assigned to the same genus. This pattern was particularly evident among the S. salmonicolor isolates collected from different Altiplano localities: LC2-23 and NP14-27 shared 319 high-tier syntenic blocks, BP6-19 and LC2-23 shared 263, and BP6-19 and NP14-27 shared 250. Isolates assigned to Naganishia sp. showed variable synteny patterns, with a higher number of shared blocks between the Altiplano isolates BP6-7 (Bofedal Parinacota) and LC2-21 (Lago Chungara), which shared 352 blocks. Notably, high numbers of shared blocks were also observed between isolates from the Altiplano and Central Mountain: BP6-25 (Bofedal Parinacota) and LI1-17 (Laguna del Inca) shared 517 blocks, whereas CR5-9 (Cristo Redentor) and LC4-24 (Lago Chungara) shared 399 blocks. In contrast, CR2-8 (Cristo Redentor) and LC2-15 (Lago Chungara) shared a relatively low number of syntenic blocks (99). The three isolate pairs showing higher levels of synteny block sharing also showed their highest ANI values against the same reference genomes: BP6-25 and LI1-17 against Naganishia kalamii (GCA_022813745.1), CR5-9 and LC4-24 against Naganishia diffluens (GCA_037832395.1), and BP6-7 and LC2-21 against Naganishia vaughanmartiniae (GCA_030039245.1). These findings indicate that isolates collected from different localities and preliminarily assigned to the same genus share greater genomic similarity with the same Naganishia reference genomes. The concordance between synteny patterns and ANI similarities further supports their assignment to Naganishia and suggests that these isolates may represent genetically differentiated lineages within the genus, a possibility that could be investigated through additional taxonomic analyses.
2.4. Yeast Genomic Functional Characterization and Comparative Analysis
The number of predicted genes ranged from 6,624 in the genome of the isolate NP14-27 to 15,921 in BP6-25 (Figure 5A). Predicted genes were functionally classified into COG categories, and the number of genes assigned to each category was normalized across isolates (Z-scores) and compared across the 11 yeast isolates. Hierarchical clustering based on these profiles revealed patterns of functional similarity among the genomes (Figure 6A). The resulting clustermap separated the isolates into two main branches. The larger branch comprised six Naganishia isolates with broadly similar overall COG profiles. Within this branch, LI1-17 and CR2-8 (both from Central Mountain), LC4-24 and CR5-9 (from Altiplano and Central Mountain, respectively), and LC2-21 and LC2-15 (both from Altiplano) clustered more closely. The smaller branch comprised the three Altiplano S. salmonicolor isolates and the putative Naganishia isolate BP6-25.
To further compare functional genomic profiles among the yeast isolates, hierarchical clustering was performed based on the percentage completeness of predicted KEGG pathways and functional modules. Both analyses produced similar clustering patterns, separating the three S. salmonicolor isolates (BP6-19, LC2-23, and NP14-27) from the putative Naganishia isolates (Figure 6B). Overall, functional profiles were broadly similar among isolates; however, several KEGG pathways showed notable differences in mean completeness between the two groups (Figure 6C). GPI-anchor biosynthesis (map00563), basal transcription factors (map03022), other glycan degradation (map00511), and valine, leucine, and isoleucine degradation (map00280) showed, on average, 10–13% higher completeness in S. salmonicolor than in the putative Naganishia isolates. In contrast, steroid biosynthesis (map00100) and mitophagy—yeast (map04139) showed, on average, 10–11% higher completeness in the putative Naganishia isolates than in S. salmonicolor. Regarding module completeness, overall similarity was also observed among isolates; however, larger differences in completeness were observed for some modules between the S. salmonicolor and putative Naganishia isolates (Figure 6 D and E). The largest difference was observed for the UDP-Gal biosynthesis, Gal → UDP-Gal module (M00554), which showed 0% completeness across all putative Naganishia isolates, compared with 50–100% completeness among the S. salmonicolor isolates. In addition, the Galactose degradation, Leloir pathway, galactose → α-D-glucose-1P module (M00632) showed, on average, 42% higher completeness in the S. salmonicolor isolates than in the putative Naganishia isolates.
The predicted protein sequences from each genome were compared against the NCBI nr_clust database using DIAMOND BLASTp. The taxonomic distribution of the resulting hits broadly reflected the patterns described above. The isolates BP6-7, BP6-25, CR2-8, CR5-9, LC2-15, LC2-21, LC4-24, and LI1-17 yielded the highest numbers of hits associated with Naganishia albida (1,188–1,374), followed by hits associated with Filobasidium floriforme (811–865) (Figure 7A). In contrast, BP6-19, LC2-23, and NP14-27 showed the highest numbers of hits associated with Sporobolomyces salmonicolor (2,596–3,192). The second most frequent taxonomic association was with Cystobasidium minutum MCA 4210 in BP6-19 and with Rhodotorula toruloides in LC2-23 and NP14-27. Principal component analysis (PCA) of the protein similarity profiles revealed clear separation among the isolates along the first two principal components (Figure 7B). PC1 accounted for 56.1% of the total variance and separated the isolates into two main groups. BP6-25, LI1-17, CR2-8, LC4-24, LC2-15, CR5-9, BP6-7, and LC2-21 clustered together, whereas LC2-23, NP14-27, and BP6-19 formed a distinct group. PC2 explained an additional 10.67% of the variance and provided further differentiation within these groups. BP6-25 and LI1-17 were positioned toward positive PC2 values, whereas LC2-21 and BP6-7 clustered near the negative extreme of this axis. Among the isolates associated with S. salmonicolor, BP6-19 showed a slight displacement along PC2 relative to the closely positioned LC2-23 and NP14-27. Overall, the PCA pattern was consistent with the separation observed in the protein-level taxonomic profiles and further supported the distinction of these isolates into two broad groups.
Among the approximately 7,300 protein hits detected, we focused on those associated with stress responses and sterol homeostasis. The distribution of hits associated with different stress types was relatively homogeneous across the yeast isolates (Figure 7C). The highest numbers of hits were associated with the general stress, proteotoxic, and starvation response categories across all isolates, ranging from approximately 72 in CR5-9 to more than 91 in BP6-25. Fewer BLASTp hits were observed for the other categories. Across all 11 isolates, approximately 400 hits were associated with osmotic, salt, and desiccation responses, with individual isolate counts ranging from 31 in BP6-19 to 45 in LC2-21. Similarly, approximately 300 hits were associated with temperature and oxidative responses across all isolates, with individual counts ranging from 19 in LC2-21 to 31 in BP6-19 for temperature, and from 17 in BP6-7 to 30 in CR2-8 for oxidative responses. The xenobiotic, drug, and metal categories showed individual isolate counts ranging from 30 in BP6-7 to 46 in LI1-17. The distributions of lipid-related metabolic functions were more variable across the yeast isolates (Figure 7D). The highest numbers of BLASTp hits were associated with sterol and ergosterol biosynthesis and metabolism, with the highest counts observed in LC2-23 and NP14-27. Lipid transport, binding, and homeostasis represented the second most frequent category, with hit counts ranging from 13 in LC2-21 to 21 in both LC2-23 and NP14-27. In contrast, relatively few hits were associated with sterol esterification and storage, with counts ranging from 1 in BP6-25, BP6-7, LC2-21, and LI1-17 to 7 in both LC2-23 and NP14-27.
The potential of the studied yeasts as sources of enzymes with commercial and biotechnological applications was assessed by comparing BLASTp results against a set of 41 industrially relevant enzymes reported in the literature. Putative homologs for all 41 enzymes were identified in at least one yeast isolate (Figure 8), with enzymes associated with metabolic and biotransformation processes being particularly well represented. Esterases were among the most common, followed by glutathione S-transferases, β-glucosidases, alcohol dehydrogenases, and aldehyde dehydrogenases. Notably, putative homologs associated with antifreeze proteins, including the antifreeze glycopeptide AFGP polyprotein and antifreeze glycoprotein, were identified in nine yeast isolates, highlighting the occurrence of candidate proteins potentially involved in adaptation to low-temperature environments and of interest for biotechnological applications. In contrast, other industrially relevant enzyme families, including amylases, cellulases, lipases, and ureases, were detected at low frequencies or were absent from most of the analyzed genomes.
2.5. Mitochondrial Genomes Assembly and Functional Annotation
Mitochondrial genomes were assembled and annotated for all yeast isolates, and the resulting putative mitogenomes are summarized in Table 1. A single contig corresponding to a putative mitochondrial genome was recovered for all isolates except BP6-19, for which two contigs were retained as putative mitogenome sequences. The lengths of the assembled mitogenomes ranged from 19,670 nt in BP6-25 to 33,593 nt in CR5-9, while GC content ranged from 31.3% in BP6-25 to 38.8% in LC4-24. Assessment of genome circularity indicated that three mitochondrial sequences were likely circular: contig 2 of BP6-19, LI1-17, and CR5-9. The mitochondrial origin of these assemblies was further supported by the identification of mitochondrial genes and other characteristic mitochondrial features through functional annotation.
The specific mitochondrial genes, structural elements, and intronic features were predicted using MFannot (Figure 9A). Core protein-coding genes involved in oxidative phosphorylation, including apocytochrome b (cob), ATP synthase subunits F0-8, F0-a, and F0-c, cytochrome c oxidase subunits 1–3 (cox1–3), and NADH dehydrogenase subunits 1–6 and 4L (nad1–6 and nad4L), were detected across nearly all isolates and showed a largely conserved distribution. Ribosomal and transfer RNA genes were also widely represented, whereas genes encoding small- and large-subunit rRNAs and ribonuclease P RNA showed more variable or isolate-specific distributions. Intronic features, including group I-derived, group IA1, group IB, group IB 3′ intronic variants, group ID intron 2, and generic introns 1, 3, and 4, displayed greater variation among isolates. BP6-7, CR5-9, LC2-15, and LC2-21 exhibited richer and more diverse intronic profiles, whereas BP6-25 showed notable reductions or absences of several intron categories. MFannot-predicted exons were consistently detected across all analyzed contigs and isolates, with intermediate quantitative values.
In each putative mitogenome, open reading frames (ORFs) were predicted using the yeast mitochondrial genetic code, translated, and functionally annotated. Comparison of the predicted proteins against the NCBI nr_clust database (Figure 9B) identified ORFs with significant similarity to core oxidative phosphorylation proteins, including cytochrome b, cytochrome c oxidase subunit 1 (COX1), and several ATP synthase subunits. The number of ORFs with nr_clust hits varied among isolates, with cytochrome b being represented across multiple isolates. Other core mitochondrial components, including ribosomal protein S3 and NADH dehydrogenase subunits, were also broadly distributed among isolates. In contrast, endonucleases and other mobile genetic element-associated proteins, including homing and intron-encoded endonucleases, showed restricted and isolate-specific distributions. Overall, BP6-25 exhibited the fewest ORFs with nr_clust protein hits among the analyzed mitogenomes. Functional classification of ORFs into Clusters of Orthologous Groups (COGs) showed that most ORFs with COG assignments belonged to the energy production and conversion category across the analyzed isolates (Figure 9C). Other COG categories detected across multiple isolates, but represented by fewer ORFs, included translation, ribosomal structure and biogenesis, and secondary metabolite biosynthesis, transport, and catabolism. KEGG pathway annotation identified oxidative phosphorylation as the only pathway consistently assigned across all isolates. Synteny analysis of the putative mitogenomes revealed distinct patterns of genomic conservation among the isolates (Figure 9D). BP6-25, LC2-23, LC2-15, and CR2-8 showed higher levels of synteny with three other isolates each. The highest levels of synteny were observed between the isolate pairs CR5-9 and LC4-24, BP6-7 and LC2-21, and CR2-8 and LI1-17.
3. Discussion
3.1. Metagenomic Diversity
The predominance of Ascomycota across most sampling sites is consistent with previous studies of fungal communities in high-elevation and arid environments, including the Chilean and Bolivian Altiplano [21,23]. At a broader scale, Ascomycota is also a dominant component of global soil fungal communities, particularly through widespread and environmentally tolerant lineages [41]. However, differences become more apparent at lower taxonomic levels when comparing our results with other high-plateau regions. Studies from the Qaidam Basin, Loess Plateau, and Bolivian Altiplano have reported different dominant genera, including Inocybe, Penicillium, and Humicola [7,9,42]. Within the Chilean Altiplano itself, our results also differ from those reported for other localities, where Coniochaetaceae, Sporormiaceae, and Teratosphaeriaceae were the most abundant families [23]. In contrast, Herpotrichiellaceae and Hydnodontaceae were frequently represented in the present study, highlighting local variation in fungal community composition even within the same broader geographic region. However, the high proportion of unclassified ASVs at the family and genus levels limits taxonomic resolution and should be considered when interpreting differences in community composition among sites. In environmental fungal metabarcoding, incomplete reference database coverage and unresolved taxonomy can constrain taxonomic assignment below higher taxonomic levels, particularly for environmental lineages that remain poorly represented in reference databases [43,44]. Despite this limitation, the co-occurrence networks revealed a densely connected organization of fungal communities at both the family and genus levels, with numerous inferred associations suggesting potential relationships among taxa. Despite this limitation, the co-occurrence networks revealed a densely connected organization of fungal communities at both the family and genus levels, with numerous inferred associations among taxa. These associations may indicate potential ecological relationships among taxa [45], but may also reflect shared environmental constraints or statistical effects [46,47,48]. In the present study, Hydnodontaceae, Venturiaceae, and Pyrenotrichaceae exhibited the highest inferred network connectivity at the family level, whereas Neophaeococcomyces, Subulicystidium, Penicillium, and Solicoccozyma showed the highest at the genus level. This differs from the previous study of the Altiplano at the family level, but Penicillium appeared in high inferred network connectivity in both studies [23].
Fungal α-diversity varied among sampling sites, with differences in Shannon diversity (H′) reflecting contrasting patterns of taxon richness and abundance distribution. Overall, variation in H′ appeared to be more strongly associated with variation in evenness than with variation in richness, suggesting that the distribution of abundances among taxa was an important component of the observed diversity patterns. Similar variation in fungal α-diversity has been reported along high-elevation gradients, where changes in richness and community structure have been associated with environmental variables such as temperature, soil pH, and nutrient availability [9].
Pairwise comparisons of family and genus abundances revealed generally positive associations among sites. Hierarchical clustering broadly reflected geographic grouping, particularly at the genus level, with several Altiplano sites clustering together and Central Mountain sites forming a separate cluster. Similar geographic structuring of fungal communities has been reported in other extreme environments, although differences in community composition may reflect both geographic distance and local environmental conditions [49,50].
3.2. Yeast Genomic Analysis Properties
The combined use of ITS sequences, protein-level taxonomic affiliations, ANI, and genome-level structural and functional analyses provided complementary evidence to differentiate the 11 yeast isolates and identify groups with greater genomic similarity. Overall, these approaches supported the grouping of three S. salmonicolor-associated isolates and eight Naganishia-associated isolates. The discrepancy observed for LI1-17 between ITS- and genome-based assignments highlights the limitations of relying on a single marker for resolving closely related fungal taxa and the value of multilocus and genome-scale comparisons for improving taxonomic resolution [51,52].
The KEGG pathway and functional module profiles were broadly similar among the yeast isolates, although several functions differed in predicted completeness between the S. salmonicolor and putative Naganishia groups. S. salmonicolor showed greater predicted completeness of GPI-anchor biosynthesis, basal transcription factors, glycan degradation, and branched-chain amino acid degradation, whereas the putative Naganishia isolates showed greater completeness of steroid biosynthesis and yeast mitophagy. The largest difference among functional modules was observed for UDP-Gal biosynthesis (M00554), which was incomplete in all putative Naganishia isolates but 50–100% complete in S. salmonicolor; the Leloir pathway (M00632) also showed higher mean completeness in S. salmonicolor. Among these differences, GPI-anchor biosynthesis and galactose-related metabolism provide notable examples of pathways that may warrant further investigation. GPI-anchored proteins contribute to cell-wall organization, adhesion, and nutrient acquisition [53,54], while UDP-galactose and the Leloir pathway are involved in glycan biosynthesis and galactose metabolism, respectively [55]. These results provide bioinformatic evidence of variation in the predicted functional repertoire and point to specific cellular and metabolic processes for future experimental study.
Predicted protein-level analyses showed broadly similar distributions of stress-related functions across the yeast isolates, with general stress, proteotoxic, and starvation responses among the most frequent categories. These patterns were shared by both the S. salmonicolor-associated and putative Naganishia-associated isolates, suggesting a relatively conserved stress-related protein repertoire. In contrast, lipid-associated functions varied more among isolates, with LC2-23 and NP14-27 showing the highest numbers of homologous protein hits related to sterol and ergosterol biosynthesis and metabolism, lipid transport, homeostasis, and sterol storage. Steroid biosynthesis also showed higher mean pathway completeness in the putative Naganishia isolates. Overall, these patterns suggest that stress-related functions are broadly conserved, whereas lipid-associated functions show greater variation among isolates and between the putative taxonomic groups. These differences provide candidates for future studies examining their potential physiological relevance.
The repertoire of putative homologs of enzymes with established industrial applications identified across the yeast isolates indicates a diversity of candidate genes with potential biotechnological relevance. The detection of antifreeze-related protein homologs is also noteworthy and may reflect genetic potential relevant to persistence under low-temperature conditions. More broadly, this repertoire highlights these yeasts as potential sources of candidate genes for heterologous expression in industrially scalable hosts such as Saccharomyces cerevisiae or Pichia pastoris. Similar approaches have previously been used to express pectinase [56], β-galactosidase [57], lipase [58], and cellulase [59] genes from psychrophilic fungi.
The mitochondrial genomes of the yeast isolates contained a conserved set of genes involved in oxidative phosphorylation and mitochondrial translation, together with substantial variation in intronic features, ORF content, and genome organization. This combination of conserved gene content and variable non-core regions is consistent with patterns reported in basidiomycetous yeasts, where mitochondrial genomes retain common core genes but differ in intron content and gene arrangement [60]. Variation in introns and intron-associated endonucleases is also consistent with the known mobility of fungal mitochondrial introns and their contribution to mitogenome structural diversity [61,62]. In contrast, differences in synteny indicate variation in mitochondrial genome organization, with some isolates sharing more similar gene arrangements than others. Notably, the strongest synteny associations were not restricted to isolates from the same locality, suggesting that geographic proximity alone does not explain the observed mitochondrial similarities. These patterns provide a basis for future studies investigating whether mitochondrial genomic variation is associated with differences in environmental or physiological contexts.
4. Materials and Methods
4.1. Soil Samples Collection
Bulk soil samples were collected at a depth of 5–10 cm using sterile 50-mL tubes, avoiding plant material and roots. Samples were immediately sealed and maintained at 4 °C during transport to the laboratory, where they were stored at −80 °C until further processing. Sampling sites were distributed across the Chilean Altiplano, including the Atacama and Antofagasta regions (3,777-4,092 m a.s.l.), and the Central Mountain in the Valparaiso region (2,853–3,817 m a.s.l.) (Figure 10).
4.2. General Molecular Procedures
DNA purification, quantification, characterization, electrophoresis, PCR, and spectroscopic analyses were performed according to standardized molecular biology methodologies [63]. Procedures involving commercial kits were performed according to the respective manufacturers’ instructions.
4.3. Soil DNA Extraction, ITS Sequencing, and ASV Inference
DNA was extracted in triplicate from 0.5–1.0 g of each soil sample using the PowerSoil DNA Isolation Kit (MO BIO Laboratories Inc., Carlsbad, CA, USA) according to the manufacturer’s instructions. DNA concentration was measured using a Qubit 4 fluorometer (Invitrogen, USA), and the amplifiability of the ITS1-5.8S-ITS2 region was verified by PCR using the ITS1 (5′-TCCGTAGGTGAACCTGCGG-3′) and ITS4 (5′-TCCTCCGCTTATTGATATGC-3′) primers. Samples that passed these quality-control steps were submitted to Omics2View Consulting (Kiel, Germany) for library preparation, sequencing, and initial bioinformatics processing. Briefly, ITS2 libraries were prepared by PCR amplification using indexed ITS3/ITS4 fusion primers and purified with Agencourt AMPure XP beads. PCR products were heat-denatured and circularized using a splint oligonucleotide to generate single-stranded circular DNA (ssCirDNA), followed by rolling-circle amplification to produce DNA nanoballs (DNBs). Libraries were sequenced using cPAS technology [64] on an MGI DNBSEQ-G400 platform in paired-end 2 × 300 bp mode. Sequencing results are summarized in supplementary Table S5. Amplicon sequence variants (ASVs) were inferred from the raw paired-end reads using the DADA2 pipeline implemented in the R package dada2 v1.32.0 [65]. Briefly, primer sequences were removed using BBTools v39.19, and reads were quality-filtered based on expected-error thresholds of ≤2 for forward reads and ≤4 for reverse reads. Error-corrected paired-end reads were merged into contiguous sequences using a minimum overlap of 20 bp and allowing a maximum of one mismatch in the overlap region. Chimeric sequences were identified and removed using the consensus method implemented in DADA2, resulting in a set of non-chimeric ASVs. Representative ASV sequences were exported in FASTA format using the Biostrings package [66]. For each ASV and sampling site, ASVs detected in at least two of the three replicates were retained for downstream analysis.
4.4. Taxonomic Assignment
Representative ASV sequences were taxonomically classified using the IDTAXA algorithm implemented in the DECIPHER package for R [67,68]. A custom IDTAXA training set was generated from the UNITE reference database (UNITE_public_19.02.2025) using reference sequences and their associated taxonomic annotations. Reference sequences with valid taxonomic information were retained and used to train the classifier with the LearnTaxa function implemented in DECIPHER. The resulting training set was used to classify representative ASV sequences with the IdTaxa function using a classification threshold of 50, corresponding to a minimum confidence of 50% for assignment at each taxonomic level. Relative abundance of each taxon at each sampling site was calculated from the number of reads assigned to that taxon relative to the total number of reads obtained for the corresponding site.
4.5. Co-Occurrence Network Analysis
Network inference was performed using the SPIEC-EASI framework with Sparse Graphical Lasso regularization to estimate the inverse covariance (precision) matrix [69]. Edge weights and interaction signs, distinguishing positive associations from negative associations (mutual exclusion), were derived from partial correlation coefficients calculated from the estimated precision matrix. Community structures and network modules were identified using the Louvain community detection algorithm [70]. Network topological characteristics, including node degree, node strength, closeness centrality, and betweenness centrality, were calculated to characterize network structure and identify highly connected and central taxa.
4.6. Fungal Community Composition and Diversity Analysis
To evaluate fungal ecological diversity and variation in community structure among sampling localities, taxon richness (S), the Shannon diversity index (H′) [71], and Pielou’s evenness (J′) [72] were calculated. Relationships among richness, evenness, and overall diversity were evaluated using linear regression and variance decomposition analyses to assess the contribution of these components to variation in fungal diversity. Metric values were additionally standardized as Z-scores and ordered spatially by locality to examine patterns and trajectories along ecological gradients across the sampled sites.
4.7. Isolation and Identification of Yeasts
One gram of soil sample was mixed with 1 mL of sterile water and vigorously vortexed for 10 min. After coarse particulate material was settled, 200 μL of the aqueous suspension was spread onto YM 1.5%-agar plates containing 0.3% yeast extract, 0.3% malt extract, and 0.5% peptone, supplemented with 1% glucose, 100 μg/mL chloramphenicol, and 100 μg/mL ampicillin. Plates were incubated at 4, 15, and 22 °C and inspected daily. When a yeast-like colony was observed, it was transferred to a fresh plate and incubated at the same temperature as the source plate. For initial molecular identification, the ITS1-5.8S-ITS2 region was amplified by colony PCR using the ITS1 and ITS4 primers [73] in thermal cyclers (Applied Biosystems). Amplicons were separated by electrophoresis on 1.5% agarose gels, purified using the Wizard® SV Gel and PCR Clean-Up System (Promega, Madison, WI, USA), and sent to the DNA sequencing service of the Pontificia Universidad Católica de Chile (https://biologia.uc.cl/investigacion/plataformas/secuenciacion-y-tecnologias-omicas). The resulting sequences were analyzed and compared using BLASTn against the NCBI database. Isolates were putatively classified at the species level when the sequence showed ≥99.5% identity to the corresponding database hit.
4.8. DNA Sequencing, Genome Assembly, and Quality Assessment
Yeast isolates grown on agar medium were submitted to SeqCenter (Pittsburgh, PA, USA) for genomic DNA extraction and whole-genome sequencing. Genomic DNA was extracted from approximately 50–100 mg of biomass using the ZymoBIOMICS DNA Miniprep Kit, and DNA concentration was quantified using the Qubit 1X dsDNA Assay with a Qubit fluorometer (Thermo Fisher Scientific). Illumina sequencing libraries were prepared using the Illumina DNA Prep kit, a tagmentation- and PCR-based library preparation protocol, with custom IDT 10-bp unique dual indices (UDIs), targeting an insert size of approximately 280 bp. Libraries were sequenced on an Illumina NovaSeq X Plus platform in one or more multiplexed, shared flow-cell runs, generating 2 × 151-bp paired-end reads. Demultiplexing, quality assessment, and adapter trimming were performed using bcl-convert v4.2.4. Raw paired-end RNA-seq reads were processed using fastp v0.23.2 [74] to remove adapter sequences and low-quality bases. Minimum read-length thresholds were adjusted according to the sequencing read length (≥50 bp for 150-bp reads, ≥40 bp for 100-bp reads, and ≥30 bp for 75-bp reads). Bases with Phred quality scores below 20 were trimmed, and reads failing to meet the minimum length and quality thresholds were discarded. fastp was also used to remove poly-G and poly-X artifacts while maintaining proper paired-end relationships. For genome assembly and quality assessment, high-quality paired-end sequencing reads were assembled independently for each yeast isolate using SPAdes v4.2.0 [75]. Assemblies were generated using multiple k-mer sizes (21, 33, 55, and 77) with the automatic coverage cutoff option (--cov-cutoff auto). Assembly quality was evaluated using QUAST v5.3.0 [76,77]. Assembly statistics, including total assembly length, GC content, number of contigs, and N50, were obtained from the QUAST reports. Genome completeness was assessed using BUSCO v6.1.0 with the fungi_odb10 lineage dataset from OrthoDB [78,79,80]. The proportions of complete BUSCO genes, including single-copy and duplicated genes, as well as fragmented and missing genes, were used to assess genome completeness.
To evaluate pairwise genomic relatedness, Average Nucleotide Identity (ANI) was calculated between query and reference genomes using FastANI [81]. An ANI threshold of 95.0% was used as a reference criterion for species-level similarity, with genome pairs showing ANI ≥95.0% considered consistent with the same species, and pairs below this threshold considered to have lower genomic similarity.
4.9. Gene Prediction and Functional Annotation
For structural gene annotation, ab initio and evidence-informed gene prediction was performed using the BRAKER2 pipeline [82]. Assembled genomes were annotated using pre-existing clade-specific fungal models or, when required, by training species-specific parameter sets with GeneMark [83] and AUGUSTUS [84] in unsupervised training mode (--esmode). Annotations were generated using soft-masked genome sequences (--softmasking), producing standardized GFF3 annotation files and predicted amino acid sequences. Predicted protein sequences were functionally annotated using DIAMOND BLASTp against the NCBI non-redundant (nr) protein database, and through KEGG Orthology assignment using KAAS [85] and functional annotation using eggNOG-mapper [86].
4.10. Synteny Profiling of Genomes
Predicted protein sequences from all genomes were compared against a DIAMOND database constructed from the combined set of predicted proteins from all genomes using an all-against-all DIAMOND BLASTp approach, with an e-value cutoff of ≤1 × 10⁻¹⁰, to identify homologous anchors. For each match, genomic coordinates, e-values, bit scores, sequence identity, and alignment coverage ratios were retained. Homologous loci were evaluated under three nested stringency levels based on sequence identity, bit score, and coverage ratio: low (≥25% identity, bit score ≥40, coverage ratio 0.4–2.5), medium (≥35% identity, bit score ≥50, coverage ratio 0.6–1.8), and high (≥50% identity, bit score ≥80, coverage ratio 0.8–1.2). Redundant matches were removed by retaining the highest-bit-score hit for each genomic locus. Filtered homologous anchors were ordered by genomic coordinates and clustered into syntenic blocks using a gap-aware approach, allowing a maximum distance of 15 kb between consecutive anchors and up to 3 intervening unmatched loci. Block orientation was classified as forward, inverted, or mixed based on the relative orientation of genomic coordinates. For short blocks, orientation was determined from the predominant coordinate direction, whereas for longer blocks, Pearson’s correlation coefficient between genomic positions was used, with |r| ≥ 0.65 indicating a consistent coordinate relationship.
4.11. Assembly and Functional Annotation of Mitochondrial Genomes
Mitochondrial genomes were de novo assembled from paired-end sequencing reads using the GetOrganelle toolkit. Assemblies were generated with get_organelle_from_reads.py using the fungal mitochondrial database profile (-F fungus_mt). Assembly graphs were constructed using a multi-k-mer strategy with k-mer lengths of 21, 45, 65, 85, and 105 (-k 21, 45, 65, 85, 105), with up to 10 extension rounds per sample. Mitochondrial genome annotation was performed using the MFannot toolkit [87], with RNAWeasel [88] used to identify mitochondrial RNA features. Open reading frames (ORFs) were predicted from assembled mitochondrial contigs using the yeast mitochondrial genetic code. The resulting protein sequences were functionally characterized using DIAMOND BLASTp searches against the NCBI nr_clust protein database, and by assigning KEGG Orthology (KO) terms using KAAS [85] and eggNOG-mapper [86].
4.12. Data Processing and Statistical Analysis
Normality was assessed for each dataset using the Kolmogorov–Smirnov test, with p-values ≤ 0.05 indicating a significant deviation from normality. As the normality assumption was not met, statistical comparisons were performed using the non-parametric Kruskal–Wallis test, followed by Dunn’s post hoc test, with a significance threshold of p ≤ 0.05. Data visualization and statistical analyses were conducted using a custom Python workflow based on pandas, NumPy, scipy.stats, Matplotlib, scikit-learn, and seaborn [89,90,91,92].
5. Conclusions
Although Ascomycota predominated in soils across the ten Chilean high-elevation sites, fungal community composition varied markedly at lower taxonomic levels. Herpotrichiellaceae and Hydnodontaceae were among the most ubiquitous and relatively abundant families, with Hydnodontaceae also occupying central positions in a densely connected co-occurrence network. Fungal diversity patterns differed among sites in terms of taxon richness and evenness, with evenness showing a more consistent relationship with Shannon diversity. For the yeast isolates obtained from these localities, integrated ITS and genome-scale analyses supported the identification of three isolates as S. salmonicolor and eight as Naganishia spp. Comparative analyses of synteny, functional genomic profiles, and protein-level profiles revealed genus-associated patterns that clearly differentiated S. salmonicolor from Naganishia. Variation in putative mitochondrial genomes was primarily associated with intron content and mobile genetic elements. Additionally, the identification of potentially biotechnologically relevant enzymes and stress-associated genes highlighted candidate genomic features for future investigation. Overall, these findings reveal the ecological and genomic diversity of high-elevation fungi in Chile and provide a foundation for future studies investigating their environmental adaptation, evolutionary relationships, and biotechnological potential.
Supplementary Materials
The following supporting information can be downloaded at the website of this paper posted on Preprints.org, Table S1. Relative abundance (%) of identified fungal taxa at each sampling site. Table S2. Diversity parameters calculated at the family and genus levels for each sampling site. Table S3. ITS amplicon sequences and corresponding BLASTn search results. Table S4. DIAMOND BLASTP search results for single-copy BUSCO sequences against the NCBI nr_clust database and average nucleotide identity (ANI) values between isolate draft genomes and reference genomes. Table S5. Sequencing analysis report.
Author Contributions
MB conceived and managed the project, collected soil samples, conducted the methodology and data analysis, and contributed to manuscript writing. JA conducted the methodology and data analysis and contributed to manuscript writing. CV collected soil samples and contributed to the methodology and data analysis. MG contributed to the methodology and data analysis. All authors read and approved the final manuscript.
Funding
This research was funded by Grant Fondecyt 1230427 from the Agencia Nacional de Investigación y Desarrollo de Chile.
Institutional Review Board Statement
Not applicable.
Informed Consent Statement
Not applicable.
Data Availability Statement
The datasets generated and analyzed in this study are available from the National Center for Biotechnology Information BioProject PRJNA1261431 and in the Supplementary Materials.
Acknowledgments
Sequencing, bioinformatic processing, and some statistical analyses were coordinated by omics2view.consulting GbR (Kiel, Germany). The authors thank Dionisia Sepulveda and Salvador Barahona for their technical assistance.
Conflicts of Interest
The authors declare no conflicts of interest.
Abbreviations
The following abbreviations are used in this manuscript:
| ASV | Amplicon sequence variant |
| ITS | Internal transcribed spacer |
| CLR | Centered log-ratio |
| H′ | Shannon diversity |
| S | Taxon richness |
| J′ | Pielou’s evenness |
| ANI | Average nucleotide identity |
| COG | Clusters of orthologous groups |
| PCA | Principal component analysis |
| KEGG | Kyoto encyclopedia of genes and genomes |
| ORF | Open reading frame |
| BUSCO | Benchmarking universal single-copy orthologs |
| BLAST | Basic local alignment search tool |
| BLASTp | Protein BLAST |
| BLASTn | Nucleotide BLAST |
| BM1 | Sampling site Bofedal Maricunga |
| BM3 | Sampling site Bofedal Maricunga |
| CR5 | Sampling site Cristo Redentor |
| CR6 | Sampling site Cristo Redentor |
| LI1 | Sampling site Laguna del Inca |
| OS1 | Sampling site Ojos del Salado |
| PS2 | Samling site Paso Sico |
| PS3 | Samling site Paso Sico |
| SM2 | Sampling site Salar Maricunga |
| SM3 | Sampling site Salar Maricunga |
References
- Coleine, C.; Stajich, J.E.; Selbmann, L. Fungi are key players in extreme ecosystems. Trends Ecol. Evol. 2022, 37, 517–528. [Google Scholar] [CrossRef] [PubMed]
- Selbmann, L.; et al. Biodiversity, evolution and adaptation of fungi in extreme environments. Plant Biosyst. 2013, 147, 237–246. [Google Scholar] [CrossRef]
- Bahram, M.; Netherway, T. Fungi as mediators linking organisms and ecosystems. FEMS Microbiol. Rev. 2022, 46, fuab058. [Google Scholar] [CrossRef] [PubMed]
- Margesin, R.; Collins, T. Microbial ecology of the cryosphere (glacial and permafrost habitats): current knowledge. Appl. Microbiol. Biotechnol. 2019, 103, 2537–2549. [Google Scholar] [CrossRef] [PubMed]
- Harrison, J.P.; Gheeraert, N.; Tsigelnitskiy, D.; Cockell, C.S. The limits for life under multiple extremes. Trends Microbiol. 2013, 21, 204–212. [Google Scholar] [CrossRef] [PubMed]
- Liu, L.; et al. Altitudinal distribution patterns of AM fungal assemblages in a Tibetan alpine grassland. FEMS Microbiol. Ecol. 2015, 91, fiv078. [Google Scholar] [CrossRef] [PubMed]
- Liu, D.; Wang, H.; An, S.; Bhople, P.; Davlatbekov, F. Geographic distance and soil microbial biomass carbon drive biogeographical distribution of fungal communities in Chinese Loess Plateau soils. Sci. Total Environ. 2019, 660, 1058–1069. [Google Scholar] [CrossRef] [PubMed]
- Zhang, T.; Wang, N.; Yu, L. Soil fungal community composition differs significantly among the Antarctic, Arctic, and Tibetan Plateau. Extremophiles 2020, 24, 821–829. [Google Scholar] [CrossRef] [PubMed]
- Xing, R.; Gao, Q.B.; Zhang, F.Q.; Wang, J.L.; Chen, S.L. Environmental filtering affects fungal communities more than dispersal limitation in a high-elevation hyperarid basin on Qinghai-Tibet Plateau. FEMS Microbiol. Lett. 2021, 368, fnab033. [Google Scholar] [CrossRef] [PubMed]
- Hussain, S.; et al. Distribution and Assembly Processes of Soil Fungal Communities along an Altitudinal Gradient in Tibetan Plateau. J. Fungi 2021, 7, 1082. [Google Scholar] [CrossRef] [PubMed]
- Chen, J.; et al. Altitudinal Variation Influences Soil Fungal Community Composition and Diversity in Alpine-Gorge Region on the Eastern Qinghai-Tibetan Plateau. J. Fungi 2022, 8, 807. [Google Scholar] [CrossRef] [PubMed]
- Li, J.; et al. Climate and geochemistry at different altitudes influence soil fungal community aggregation patterns in alpine grasslands. Sci. Total Environ. 2023, 881, 163375. [Google Scholar] [CrossRef] [PubMed]
- Zeng, Q.; et al. Stable functional structure despite high taxonomic variability across fungal communities in soils of old-growth montane forests. Microbiome 2023, 11, 217. [Google Scholar] [CrossRef] [PubMed]
- Li, X.; et al. Soil fungal communities varied across aspects of restored grassland in former mining areas of the Qinghai-Tibet Plateau. PLoS ONE 2024, 19, e0295019. [Google Scholar] [CrossRef] [PubMed]
- Aceituno, P. Elementos del clima en el Altiplano Sudamericano. Rev. Geofísica-IPGH 1996, 44, 63–69. [Google Scholar]
- Tapia, J.; Murray, J.; Ormachea, M.; Tirado, N.; Nordstrom, D.K. Origin, distribution, and geochemistry of arsenic in the Altiplano-Puna plateau of Argentina, Bolivia, Chile, and Perú. Sci. Total Environ. 2019, 678, 309–325. [Google Scholar] [CrossRef] [PubMed]
- Aszalós, J.M.; Szabó, A.; Megyes, M.; Anda, D.; Nagy, B.; Borsodi, A.K. Bacterial Diversity of a High-Altitude Permafrost Thaw Pond Located on Ojos del Salado (Dry Andes, Altiplano-Atacama Region). Astrobiology 2020, 20, 754–765. [Google Scholar] [CrossRef] [PubMed]
- Demergasso, C.; et al. Prokaryotic diversity pattern in high-altitude ecosystems of the Chilean Altiplano. J. Geophys Res. Biogeosci 2010, 115, n/a–n/a. [Google Scholar] [CrossRef]
- Maza, F.; et al. Soil Bacterial Communities From the Chilean Andean Highlands: Taxonomic Composition and Culturability. Front Bioeng. Biotechnol. 2019, 7, 10. [Google Scholar] [CrossRef] [PubMed]
- Scott, S.; et al. Microbial diversity and trophic components of two high altitude wetlands of the Chilean Altiplano. Earth Sci. Ecol. Environ. Biol. 2015, 79, 45–56. [Google Scholar] [CrossRef]
- Gomez-Montano, L.; et al. Do bacterial and fungal communities in soils of the Bolivian Altiplano change under shorter fallow periods. Soil Biol. Biochem 2013, 65, 50–59. [Google Scholar] [CrossRef]
- Corona Ramirez, A.; et al. Assessment of fungal spores and spore-like diversity in environmental samples by targeted lysis. BMC Microbiol. 2023, 23, 68. [Google Scholar] [CrossRef] [PubMed]
- Alcaíno, J.; Veloso, C.; Coche, M.; Troncoso, D.; Baeza, M. Fungi in the Chilean Altiplano: Analyses of Diversity and Yeasts with Applied Enzymatic Potential. J. Fungi 2025, 11, 561. [Google Scholar] [CrossRef] [PubMed]
- Buzzini, P.; Margesin, R. Cold-adapted yeasts. Biodiversity, adaptation strategies and biotechnological significance Cold-adapted yeasts Biodiversity, adaptation strategies and biotechnological significance; Springer, 2014. [Google Scholar]
- Alcaíno, J.; Cifuentes, V.; Baeza, M. Physiological adaptations of yeasts living in cold environments and their potential applications. World J. Microbiol. Biotechnol. 2015, 31, 1467–1473. [Google Scholar] [CrossRef] [PubMed]
- Baeza, M.; Flores, O.; Alcaíno, J.; Cifuentes, V. Yeast Thriving in Cold Terrestrial Habitats: Biodiversity and Industrial/Biotechnological Applications. In Fungi in Extreme Environments: Ecological Role and Biotechnological Significance; Springer International Publishing: Cham, 2019; pp. 253–268. [Google Scholar]
- Majewska, E.; Twarda-Clapa, A.; Jędrzejczak-Krzepkowska, M.; Kamińska-Dwórznicka, A.; Zakłos-Szyda, M.; Białkowska, A.M. Antifreeze proteins produced by Antarctic yeast from the genus Glaciozyma as cryoprotectants in food storage. PLoS ONE 2025, 20, e0318459. [Google Scholar] [CrossRef] [PubMed]
- Brejová, B.; et al. Draft Genome Sequence of an Obligate Psychrophilic Yeast, Candida psychrophila NRRL Y-17665T. Genome Announc. 2017, 5, e00851-17. [Google Scholar] [CrossRef] [PubMed]
- Baeza, M.; et al. Response to Cold: A Comparative Transcriptomic Analysis in Eight Cold-Adapted Yeasts. Front Microbiol. 2022, 13, 1–15. [Google Scholar] [CrossRef] [PubMed]
- Turchetti, B.; Buzzini, P.; Baeza, M. A genomic approach to analyze the cold adaptation of yeasts isolated from Italian Alps. Front Microbiol. 2022, 13, 1026102. [Google Scholar] [CrossRef] [PubMed]
- Yusof, N.A.; Hashim, N.H.F.; Bharudin, I. Cold Adaptation Strategies and the Potential of Psychrophilic Enzymes from the Antarctic Yeast, Glaciozyma antarctica PI12. J. Fungi 2021, 7, 528. [Google Scholar] [CrossRef] [PubMed]
- Nizovoy, P.; et al. Unique genomic traits for cold adaptation in Naganishia vishniacii, a polyextremophile yeast isolated from Antarctica. FEMS Yeast Res. 2021, 21, foaa056. [Google Scholar] [CrossRef] [PubMed]
- Perlin, M.H.; Andrews, J.; Toh, S.S. Essential letters in the fungal alphabet: ABC and MFS transporters and their roles in survival and pathogenicity. Adv. Genet 2014, 85, 201–253. [Google Scholar] [CrossRef] [PubMed]
- Su, Y.; et al. Genomic, Transcriptomic and Proteomic Analysis Provide Insights into the Cold Adaptation Mechanism of the Obligate Psychrophilic Fungus Mrakia psychrophila. G3 2016, 6, 3603–3613. [Google Scholar] [CrossRef] [PubMed]
- Baeza, M.; Zúñiga, S.; Peragallo, V.; Barahona, S.; Alcaino, J.; Cifuentes, V. Identification of Stress-Related Genes and a Comparative Analysis of the Amino Acid Compositions of Translated Coding Sequences Based on Draft Genome Sequences of Antarctic Yeasts. Front Microbiol. 2021, 12, 1–17. [Google Scholar] [CrossRef] [PubMed]
- Ni, Y.; Gao, X. Uncovering the role of mitochondrial genome in pathogenicity and drug resistance in pathogenic fungi. Front Cell Infect. Microbiol. 2025, 15, 1576485. [Google Scholar] [CrossRef] [PubMed]
- Freel, K.C.; Friedrich, A.; Schacherer, J. Mitochondrial genome evolution in yeasts: an all-encompassing view. FEMS Yeast Res. 2015, 15, fov023. [Google Scholar] [CrossRef] [PubMed]
- Wang, X.; Wang, Z.; Yang, F.; Lin, R.; Liu, T. Assembly, Annotation, and Comparative Analysis of Mitochondrial Genomes in Trichoderma. Int. J. Mol. Sci. 2024, 25, 12140. [Google Scholar] [CrossRef] [PubMed]
- Zardoya, R. Recent advances in understanding mitochondrial genome diversity. F1000Res 2020, 9, F1000 Faculty Rev–270. [Google Scholar] [CrossRef] [PubMed]
- Zaccaron, A.Z.; Stergiopoulos, I. The dynamics of fungal genome organization and its impact on host adaptation and antifungal resistance. J. Genet Genom. 2025, 52, 628–640. [Google Scholar] [CrossRef] [PubMed]
- Egidi, E.; et al. A few Ascomycota taxa dominate soil fungal communities worldwide. Nat. Commun. 2019, 10, 2369. [Google Scholar] [CrossRef] [PubMed]
- Barnes, C.J.; Maldonado, C.; Frøslev, T.G.; Antonelli, A.; Rønsted, N. Unexpectedly High Beta-Diversity of Root-Associated Fungal Communities in the Bolivian Andes. Front Microbiol. 2016, 7, 1377. [Google Scholar] [CrossRef] [PubMed]
- Kõljalg, U.; et al. Towards a unified paradigm for sequence-based identification of fungi. Mol. Ecol. 2013, 22, 5271–5277. [Google Scholar] [CrossRef] [PubMed]
- Nilsson, R.H.; et al. The UNITE database for molecular identification of fungi: handling dark taxa and parallel taxonomic classifications. Nucleic Acids Res. 2019, 47, D259–D264. [Google Scholar] [CrossRef] [PubMed]
- Faust, K.; Raes, J. Microbial interactions: from networks to models. Nat. Rev. Microbiol. 2012, 10, 538–550. [Google Scholar] [CrossRef] [PubMed]
- Röttjers, L.; Faust, K. From hairballs to hypotheses-biological insights from microbial networks. FEMS Microbiol. Rev. 2018, 42, 761–780. [Google Scholar] [CrossRef] [PubMed]
- Freilich, M.A.; Wieters, E.; Broitman, B.R.; Marquet, P.A.; Navarrete, S.A. Species co-occurrence networks: Can they reveal trophic and non-trophic interactions in ecological communities. Ecology 2018, 99, 690–699. [Google Scholar] [CrossRef] [PubMed]
- Berry, D.; Widder, S. Deciphering microbial interactions and detecting keystone species with co-occurrence networks. Front Microbiol. 2014, 5, 219. [Google Scholar] [CrossRef] [PubMed]
- Kivlin, Stephanie N.; Winston, G.C.; Goulden, Michael L.; Treseder, Kathleen K. Environmental filtering affects soil fungal community composition more than dispersal limitation at regional scales. Fungal Ecol. 2014, 14–25. [Google Scholar] [CrossRef]
- Hazard, C.; Gosling, P.; van der Gast, C.J.; Mitchell, D.T.; Doohan, F.M.; Bending, G.D. The role of local environment and geographical distance in determining community composition of arbuscular mycorrhizal fungi at the landscape scale. ISME J. 2013, 7, 498–508. [Google Scholar] [CrossRef] [PubMed]
- Kiss, L. Limits of nuclear ribosomal DNA internal transcribed spacer (ITS) sequences as species barcodes for Fungi. Proc. Natl. Acad. Sci. U S A 2012, 109, E1811, author reply E1812. [Google Scholar] [CrossRef] [PubMed]
- Lücking, R.; et al. Unambiguous identification of fungi: where do we stand and how accurate and precise is fungal DNA barcoding? IMA Fungus 2020, 11, 14. [Google Scholar] [CrossRef] [PubMed]
- Pittet, M.; Conzelmann, A. Biosynthesis and function of GPI proteins in the yeast Saccharomyces cerevisiae. Biochim Biophys. Acta 2007, 1771, 405–420. [Google Scholar] [CrossRef] [PubMed]
- Komath, S.S.; Singh, S.L.; Pratyusha, V.A.; Sah, S.K. Generating anchors only to lose them: The unusual story of glycosylphosphatidylinositol anchor biosynthesis and remodeling in yeast and fungi. IUBMB Life 2018, 70, 355–383. [Google Scholar] [CrossRef] [PubMed]
- Sellick, C.A.; Campbell, R.N.; Reece, R.J. Galactose metabolism in yeast-structure and regulation of the leloir pathway enzymes and the genes encoding them. Int. Rev. Cell Mol. Biol. 2008, 269, 111–150. [Google Scholar] [CrossRef] [PubMed]
- Carrasco, M.; Rozas, J.M.; Alcaíno, J.; Cifuentes, V.; Baeza, M. Pectinase secreted by psychrotolerant fungi: identification, molecular characterization and heterologous expression of a cold-active polygalacturonase from Tetracladium sp. Microb. Cell Fact. 2019, 18, 45. [Google Scholar] [CrossRef] [PubMed]
- Gutierrez, F.; Alcaino, J.; Cifuentes, V.; Baeza, M. Identification and characterization of a novel β-galactosidase active at low temperatures from the Antarctic fungus Tetracladium sp., expressed in Saccharomyces cerevisiae. Microb. Cell Fact. 2025, 24, 223. [Google Scholar] [CrossRef] [PubMed]
- Florczak, T.; et al. Purification, characterisation and expression in Saccharomyces cerevisiae of LipG7 an enantioselective, cold-adapted lipase from the Antarctic filamentous fungus Geomyces sp. P7 with unusual thermostability characteristics. Enzym. Microb. Technol. 2013, 53, 18–24. [Google Scholar] [CrossRef] [PubMed]
- HOU, Y.; WANG, T.; LONG, H.; ZHU, H. Cloning, Sequencing and Expression Analysis of the First Cellulase Gene Encoding Cellobiohydrolase 1 from a Cold-adaptive Penicillium chrysogenum FS010. Acta Biochim. Et. Biophys. Sin. 2007, 39, 101–107. [Google Scholar] [CrossRef] [PubMed]
- Zhao, X.Q.; Aizawa, T.; Schneider, J.; Wang, C.; Shen, R.F.; Sunairi, M. Complete mitochondrial genome of the aluminum-tolerant fungus Rhodotorula taiwanensis RS1 and comparative analysis of Basidiomycota mitochondrial genomes. Microbiologyopen 2013, 2, 308–317. [Google Scholar] [CrossRef] [PubMed]
- Hao, W. From Genome Variation to Molecular Mechanisms: What we Have Learned From Yeast Mitochondrial Genomes? Front Microbiol. 2022, 13, 806575. [Google Scholar] [CrossRef] [PubMed]
- Wolters, J.F.; LaBella, A.L.; Opulente, D.A.; Rokas, A.; Hittinger, C.T. Mitochondrial genome diversity across the subphylum Saccharomycotina. Front Microbiol. 2023, 14, 1268944. [Google Scholar] [CrossRef] [PubMed]
- Sambrook, J.; Russell, D. Molecular Cloning: A Laboratory Manual; Ed Cold Spring Harbor Lab Press: New York, 2001. [Google Scholar]
- Fehlmann, T.; et al. cPAS-based sequencing on the BGISEQ-500 to explore small non-coding RNAs. Clin. Epigenet. 2016, 8, 123. [Google Scholar] [CrossRef] [PubMed]
- Callahan, B.J.; McMurdie, P.J.; Rosen, M.J.; Han, A.W.; Johnson, A.J.; Holmes, S.P. DADA2: High-resolution sample inference from Illumina amplicon data. Nat. Methods 2016, 13, 581–583. [Google Scholar] [CrossRef] [PubMed]
- Pagès, H. A.P.; Gentleman, R.; DebRoy, S. Biostrings: Efficient manipulation of biological strings. 2025. [Google Scholar] [CrossRef]
- Murali, A.; Bhargava, A.; Wright, E.S. IDTAXA: a novel approach for accurate taxonomic classification of microbiome sequences. Microbiome 2018, 6, 140. [Google Scholar] [CrossRef] [PubMed]
- Wright, E.S. Using DECIPHER v2. 0 to analyze big biological sequence data in R. R J. 2016, 8, 352–359. [Google Scholar] [CrossRef]
- Kurtz, Z.D.; Müller, C.L.; Miraldi, E.R.; Littman, D.R.; Blaser, M.J.; Bonneau, R.A. Sparse and compositionally robust inference of microbial ecological networks. PLoS Comput Biol. 2015, 11, e1004226. [Google Scholar] [CrossRef] [PubMed]
- Blondel, V.D.; Guillaume, J.-L.; Lambiotte, R.; Lefebvre, E. Fast unfolding of communities in large networks. J. Stat. Mech. Theory Exp. 2008, 2008, P10008. [Google Scholar] [CrossRef]
- Shannon, C.E. A mathematical theory of communication. Bell Syst. Tech J. 1948, 27, 379–423. [Google Scholar] [CrossRef]
- Pielou, E.C. The measurement of diversity in different types of biological collections. J. Theor. Biol. 1966, 13, 131–144. [Google Scholar] [CrossRef]
- Fujita, S.I.; Senda, Y.; Nakaguchi, S.; Hashimoto, T. Multiplex PCR using internal transcribed spacer 1 and 2 regions for rapid detection and identification of yeast strains. J. Clin. Microbiol. 2001, 39, 3617–3622. [Google Scholar] [CrossRef] [PubMed]
- Chen, S.; Zhou, Y.; Chen, Y.; Gu, J. fastp: an ultra-fast all-in-one FASTQ preprocessor. Bioinformatics 2018, 34, i884–i890. [Google Scholar] [CrossRef] [PubMed]
- Bankevich, A.; et al. SPAdes: a new genome assembly algorithm and its applications to single-cell sequencing. J. Comput Biol. 2012, 19, 455–477. [Google Scholar] [CrossRef] [PubMed]
- Gurevich, A.; Saveliev, V.; Vyahhi, N.; Tesler, G. QUAST: quality assessment tool for genome assemblies. Bioinformatics 2013, 29, 1072–1075. [Google Scholar] [CrossRef] [PubMed]
- Mikheenko, A.; Prjibelski, A.; Saveliev, V.; Antipov, D.; Gurevich, A. Versatile genome assembly evaluation with QUAST-LG. Bioinformatics 2018, 34, i142–i150. [Google Scholar] [CrossRef] [PubMed]
- Simão, F.A.; Waterhouse, R.M.; Ioannidis, P.; Kriventseva, E.V.; Zdobnov, E.M. BUSCO: assessing genome assembly and annotation completeness with single-copy orthologs. Bioinformatics 2015, 31, 3210–3212. [Google Scholar] [CrossRef] [PubMed]
- Kriventseva, E.V.; et al. OrthoDB v10: sampling the diversity of animal, plant, fungal, protist, bacterial and viral genomes for evolutionary and functional annotations of orthologs. Nucleic Acids Res. 2019, 47, D807–D811. [Google Scholar] [CrossRef] [PubMed]
- Manni, M.; Berkeley, M.R.; Seppey, M.; Zdobnov, E.M. BUSCO: Assessing Genomic Data Quality and Beyond. Curr. Protoc. 2021, 1, e323. [Google Scholar] [CrossRef] [PubMed]
- Jain, C.; Rodriguez-R, L.M.; Phillippy, A.M.; Konstantinidis, K.T.; Aluru, S. High throughput ANI analysis of 90K prokaryotic genomes reveals clear species boundaries. Nat. Commun. 2018, 9, 5114. [Google Scholar] [CrossRef] [PubMed]
- Brůna, T.; Hoff, K.J.; Lomsadze, A.; Stanke, M.; Borodovsky, M. BRAKER2: automatic eukaryotic genome annotation with GeneMark-EP+ and AUGUSTUS supported by a protein database. NAR Genom. Bioinform. 2021, 3, lqaa108. [Google Scholar] [CrossRef] [PubMed]
- Lomsadze, A.; Ter-Hovhannisyan, V.; Chernoff, Y.O.; Borodovsky, M. Gene identification in novel eukaryotic genomes by self-training algorithm. Nucleic Acids Res. 2005, 33, 6494–6506. [Google Scholar] [CrossRef] [PubMed]
- Stanke, M.; Tzvetkova, A.; Morgenstern, B. AUGUSTUS at EGASP: using EST, protein and genomic alignments for improved gene prediction in the human genome. Genome Biol. 2006, 7 Suppl 1, S11.1–8. [Google Scholar] [CrossRef] [PubMed]
- Moriya, Y.; Itoh, M.; Okuda, S.; Yoshizawa, A.C.; Kanehisa, M. KAAS: an automatic genome annotation and pathway reconstruction server. Nucleic Acids Res. 2007, 35, W182–5. [Google Scholar] [CrossRef] [PubMed]
- Cantalapiedra, C.P.; Hernández-Plaza, A.; Letunic, I.; Bork, P.; Huerta-Cepas, J. eggNOG-mapper v2: Functional Annotation, Orthology Assignments, and Domain Prediction at the Metagenomic Scale. Mol. Biol. Evol. 2021, 38, 5825–5829. [Google Scholar] [CrossRef] [PubMed]
- Lang, B.F.; Beck, N.; Prince, S.; Sarrasin, M.; Rioux, P.; Burger, G. Mitochondrial genome annotation with MFannot: a critical analysis of gene identification and gene model prediction. Front Plant Sci. 2023, 14, 1222186. [Google Scholar] [CrossRef] [PubMed]
- Lang, B.F.; Laforest, M.J.; Burger, G. Mitochondrial introns: a critical view. Trends Genet 2007, 23, 119–125. [Google Scholar] [CrossRef] [PubMed]
- Harris, C.R.; et al. Array programming with NumPy. Nature 2020, 585, 357–362. [Google Scholar] [CrossRef] [PubMed]
- Hunter, J.D. Matplotlib: A 2D graphics environment. Comput Sci. Engi 2007, 9, 90–95. [Google Scholar] [CrossRef]
- Michel, V.; Gramfort, A.; Varoquaux, G.; Eger, E.; Keribin, C.; Thirion, B. A supervised clustering approach for fMRI-based inference of brain states. Pattern Recognit. 2012, 45, 2041–2049. [Google Scholar] [CrossRef]
- Waskom, M. seaborn: statistical data visualization. J. Open Source Softw. 2021, 6, 3021. [Google Scholar] [CrossRef]
Figure 1.
Taxonomic composition of fungal communities across sites. The relative abundance of each taxon was calculated for each site. CLR-transformed values are represented by circle color, with the absolute values of the CLR-transformed ratios represented by circle size.
Figure 1.
Taxonomic composition of fungal communities across sites. The relative abundance of each taxon was calculated for each site. CLR-transformed values are represented by circle color, with the absolute values of the CLR-transformed ratios represented by circle size.
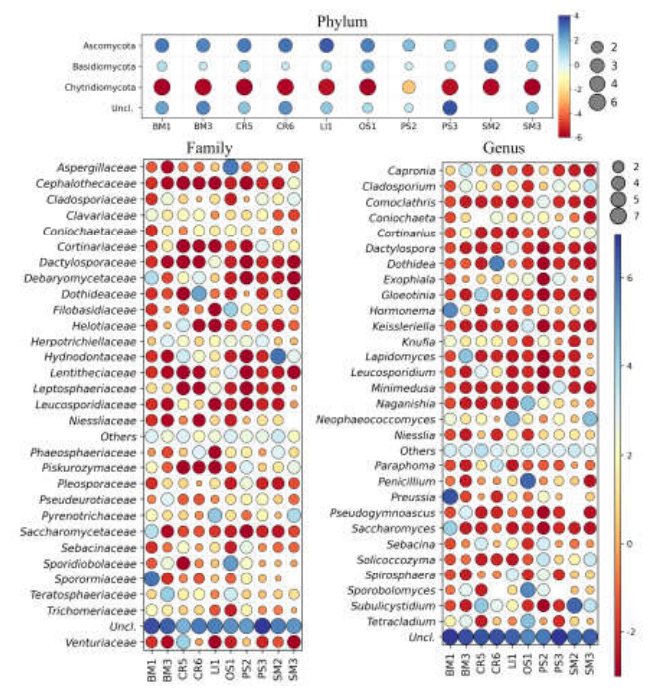
Figure 2.
Co-occurrence network analysis of fungal families and genera across sampling sites. Nodes represent taxa, with node size proportional to degree and node color indicating community assignment based on Louvain modularity clustering. The network was visualized using the Fruchterman–Reingold force-directed layout. Edges represent inferred associations between taxa. For clarity, only the 50% most abundant taxa are shown, and the 10% of nodes with the highest degree are labeled.
Figure 2.
Co-occurrence network analysis of fungal families and genera across sampling sites. Nodes represent taxa, with node size proportional to degree and node color indicating community assignment based on Louvain modularity clustering. The network was visualized using the Fruchterman–Reingold force-directed layout. Edges represent inferred associations between taxa. For clarity, only the 50% most abundant taxa are shown, and the 10% of nodes with the highest degree are labeled.
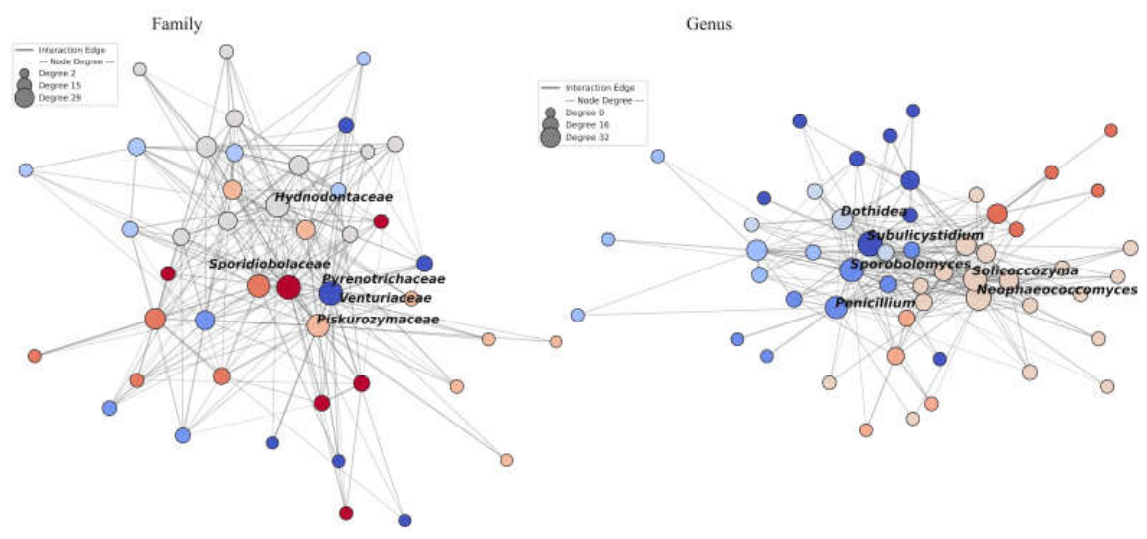
Figure 3.
Alpha diversity metrics at the family and genus levels across sampling localities. Values represent mean normalized Z-scores for Shannon diversity (H′), taxon richness (S), and Pielou’s evenness (J′). Sampling localities were ordered along the x-axis by increasing Shannon diversity (H′).
Figure 3.
Alpha diversity metrics at the family and genus levels across sampling localities. Values represent mean normalized Z-scores for Shannon diversity (H′), taxon richness (S), and Pielou’s evenness (J′). Sampling localities were ordered along the x-axis by increasing Shannon diversity (H′).
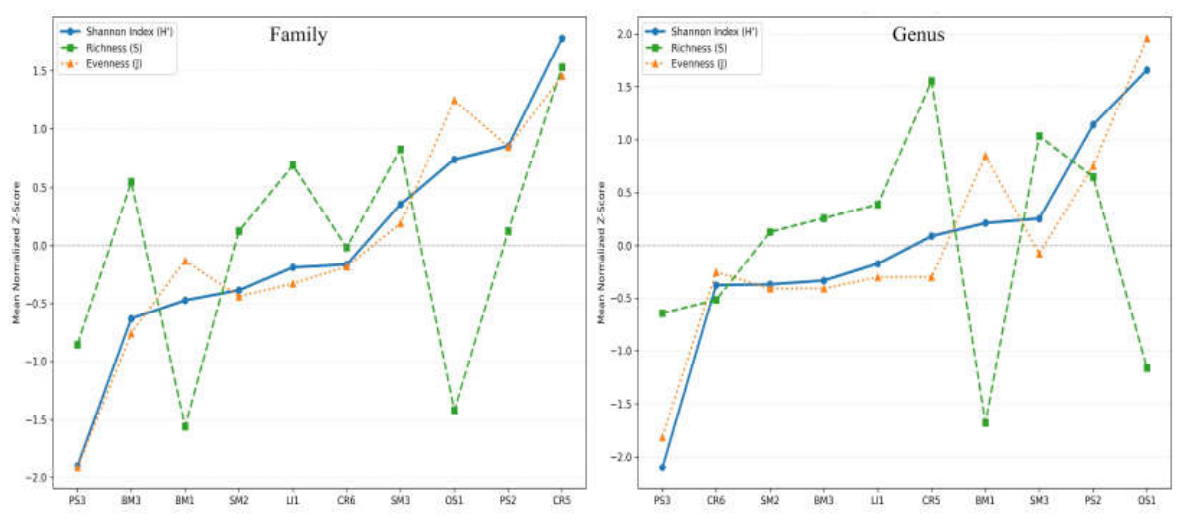
Figure 4.
Pairwise correlation heatmaps with hierarchical clustering dendrograms based on the presence and abundance of fungal families and genera across sampling sites. Correlation coefficients (r) are shown in the heatmaps, with statistical significance indicated by asterisks according to false discovery rate (FDR) thresholds (*FDR < 0.05, **FDR < 0.01, ***FDR < 0.001).
Figure 4.
Pairwise correlation heatmaps with hierarchical clustering dendrograms based on the presence and abundance of fungal families and genera across sampling sites. Correlation coefficients (r) are shown in the heatmaps, with statistical significance indicated by asterisks according to false discovery rate (FDR) thresholds (*FDR < 0.05, **FDR < 0.01, ***FDR < 0.001).
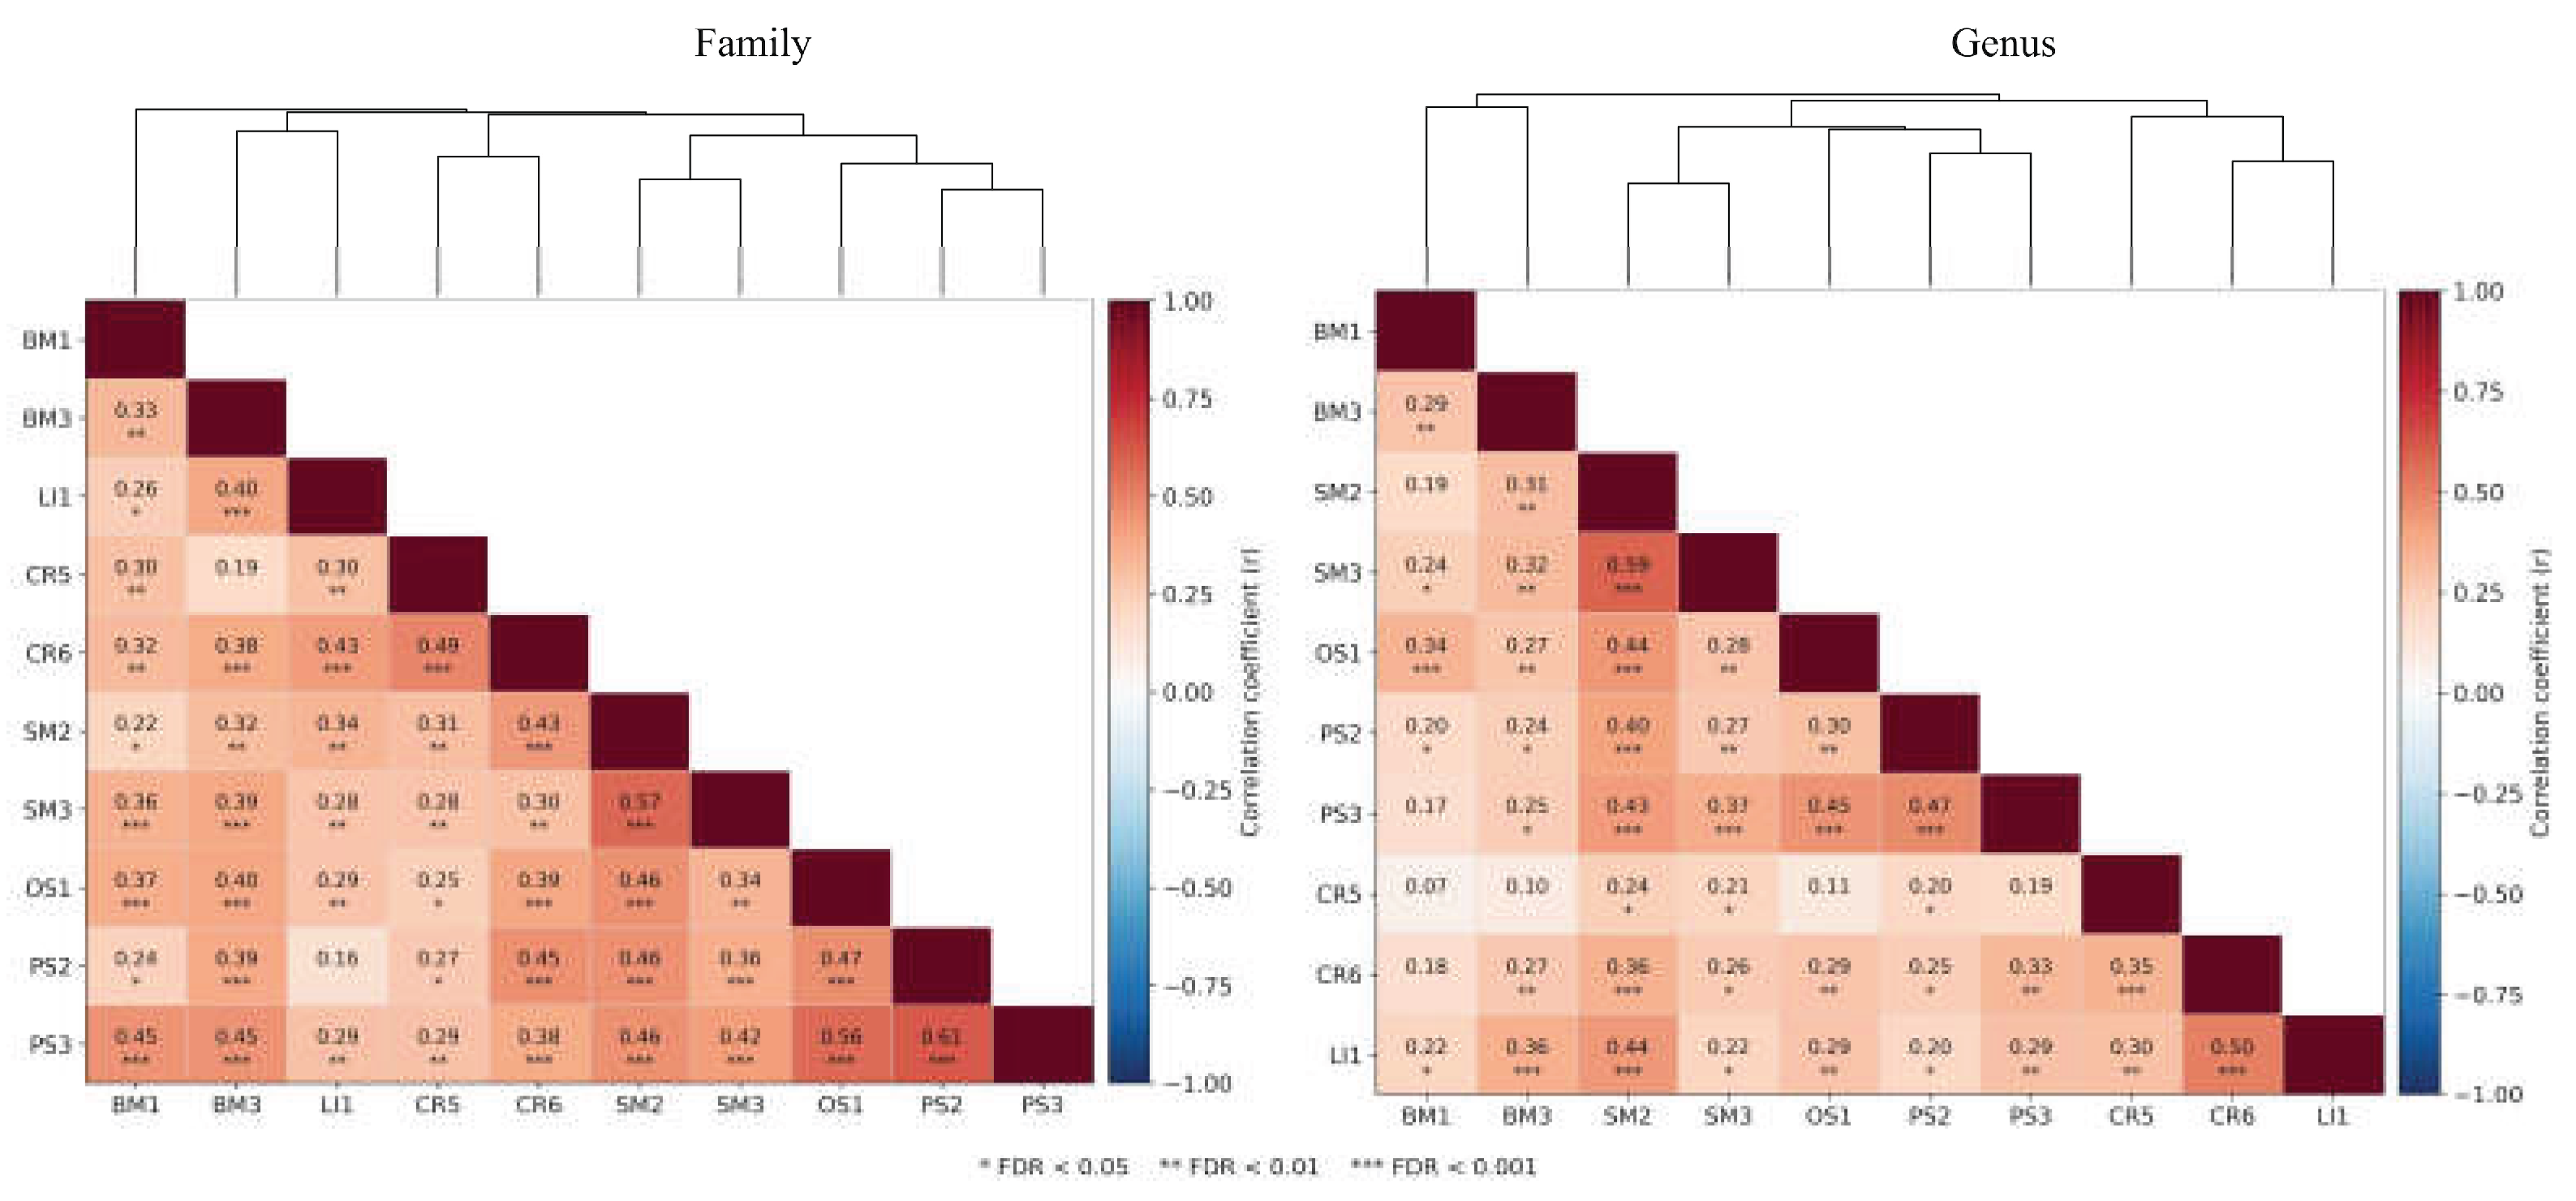
Figure 5.
Genome assembly metrics and synteny analysis of the 11 yeast isolates. (A) Genome assembly parameters for the 11 yeast isolates. (B) Circos plot showing syntenic blocks shared between pairs of yeast isolates. Syntenic blocks are color-coded according to confidence tier (low, medium, or high), as indicated in the bottom legend.
Figure 5.
Genome assembly metrics and synteny analysis of the 11 yeast isolates. (A) Genome assembly parameters for the 11 yeast isolates. (B) Circos plot showing syntenic blocks shared between pairs of yeast isolates. Syntenic blocks are color-coded according to confidence tier (low, medium, or high), as indicated in the bottom legend.
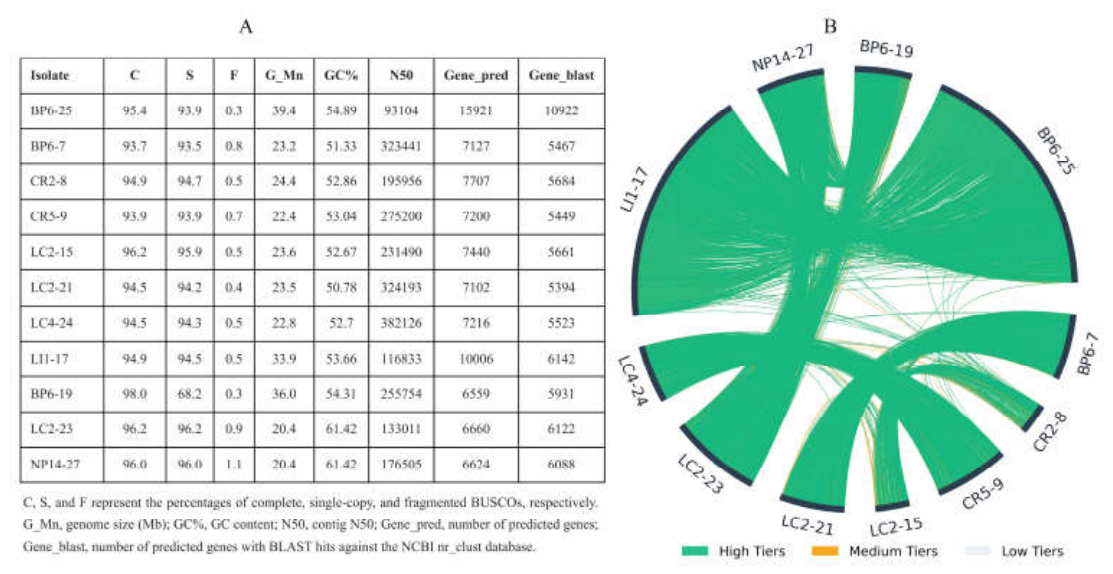
Figure 6.
Functional characterization and comparison of yeast isolates. (A) Heatmap with hierarchical clustering showing the Z-score-normalized distribution of Clusters of Orthologous Groups (COG) functional categories across the 11 yeast isolates. (B–E) Hierarchical clustering based on the completeness of KEGG pathways and functional modules across the yeast isolates. Heatmaps show the percentage completeness of predicted KEGG pathways (B, C) and functional modules (D, E), with isolates hierarchically clustered according to their completeness profiles. Panels C and E show the 20 pathways and modules, respectively, exhibiting the greatest differences in mean completeness between the putative S. salmonicolor and Naganishia isolates.
Figure 6.
Functional characterization and comparison of yeast isolates. (A) Heatmap with hierarchical clustering showing the Z-score-normalized distribution of Clusters of Orthologous Groups (COG) functional categories across the 11 yeast isolates. (B–E) Hierarchical clustering based on the completeness of KEGG pathways and functional modules across the yeast isolates. Heatmaps show the percentage completeness of predicted KEGG pathways (B, C) and functional modules (D, E), with isolates hierarchically clustered according to their completeness profiles. Panels C and E show the 20 pathways and modules, respectively, exhibiting the greatest differences in mean completeness between the putative S. salmonicolor and Naganishia isolates.
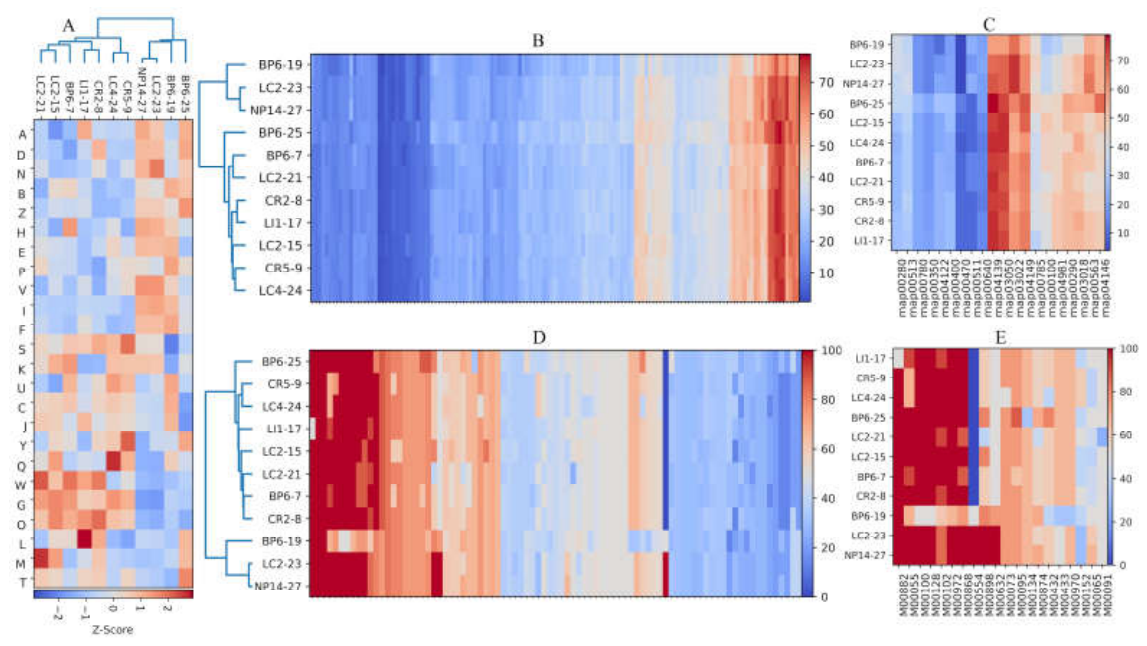
Figure 7.
Comparison of predicted protein sequences across yeast isolates using DIAMOND BLASTp. (A) Taxonomic distribution of BLASTp hits. (B) Principal component analysis (PCA) of protein similarity profiles. (C) BLASTp hits associated with stress responses. (D) BLASTp hits associated with lipid homeostasis. In panels A, C, and D, heatmaps show the number of BLASTp hits.
Figure 7.
Comparison of predicted protein sequences across yeast isolates using DIAMOND BLASTp. (A) Taxonomic distribution of BLASTp hits. (B) Principal component analysis (PCA) of protein similarity profiles. (C) BLASTp hits associated with stress responses. (D) BLASTp hits associated with lipid homeostasis. In panels A, C, and D, heatmaps show the number of BLASTp hits.
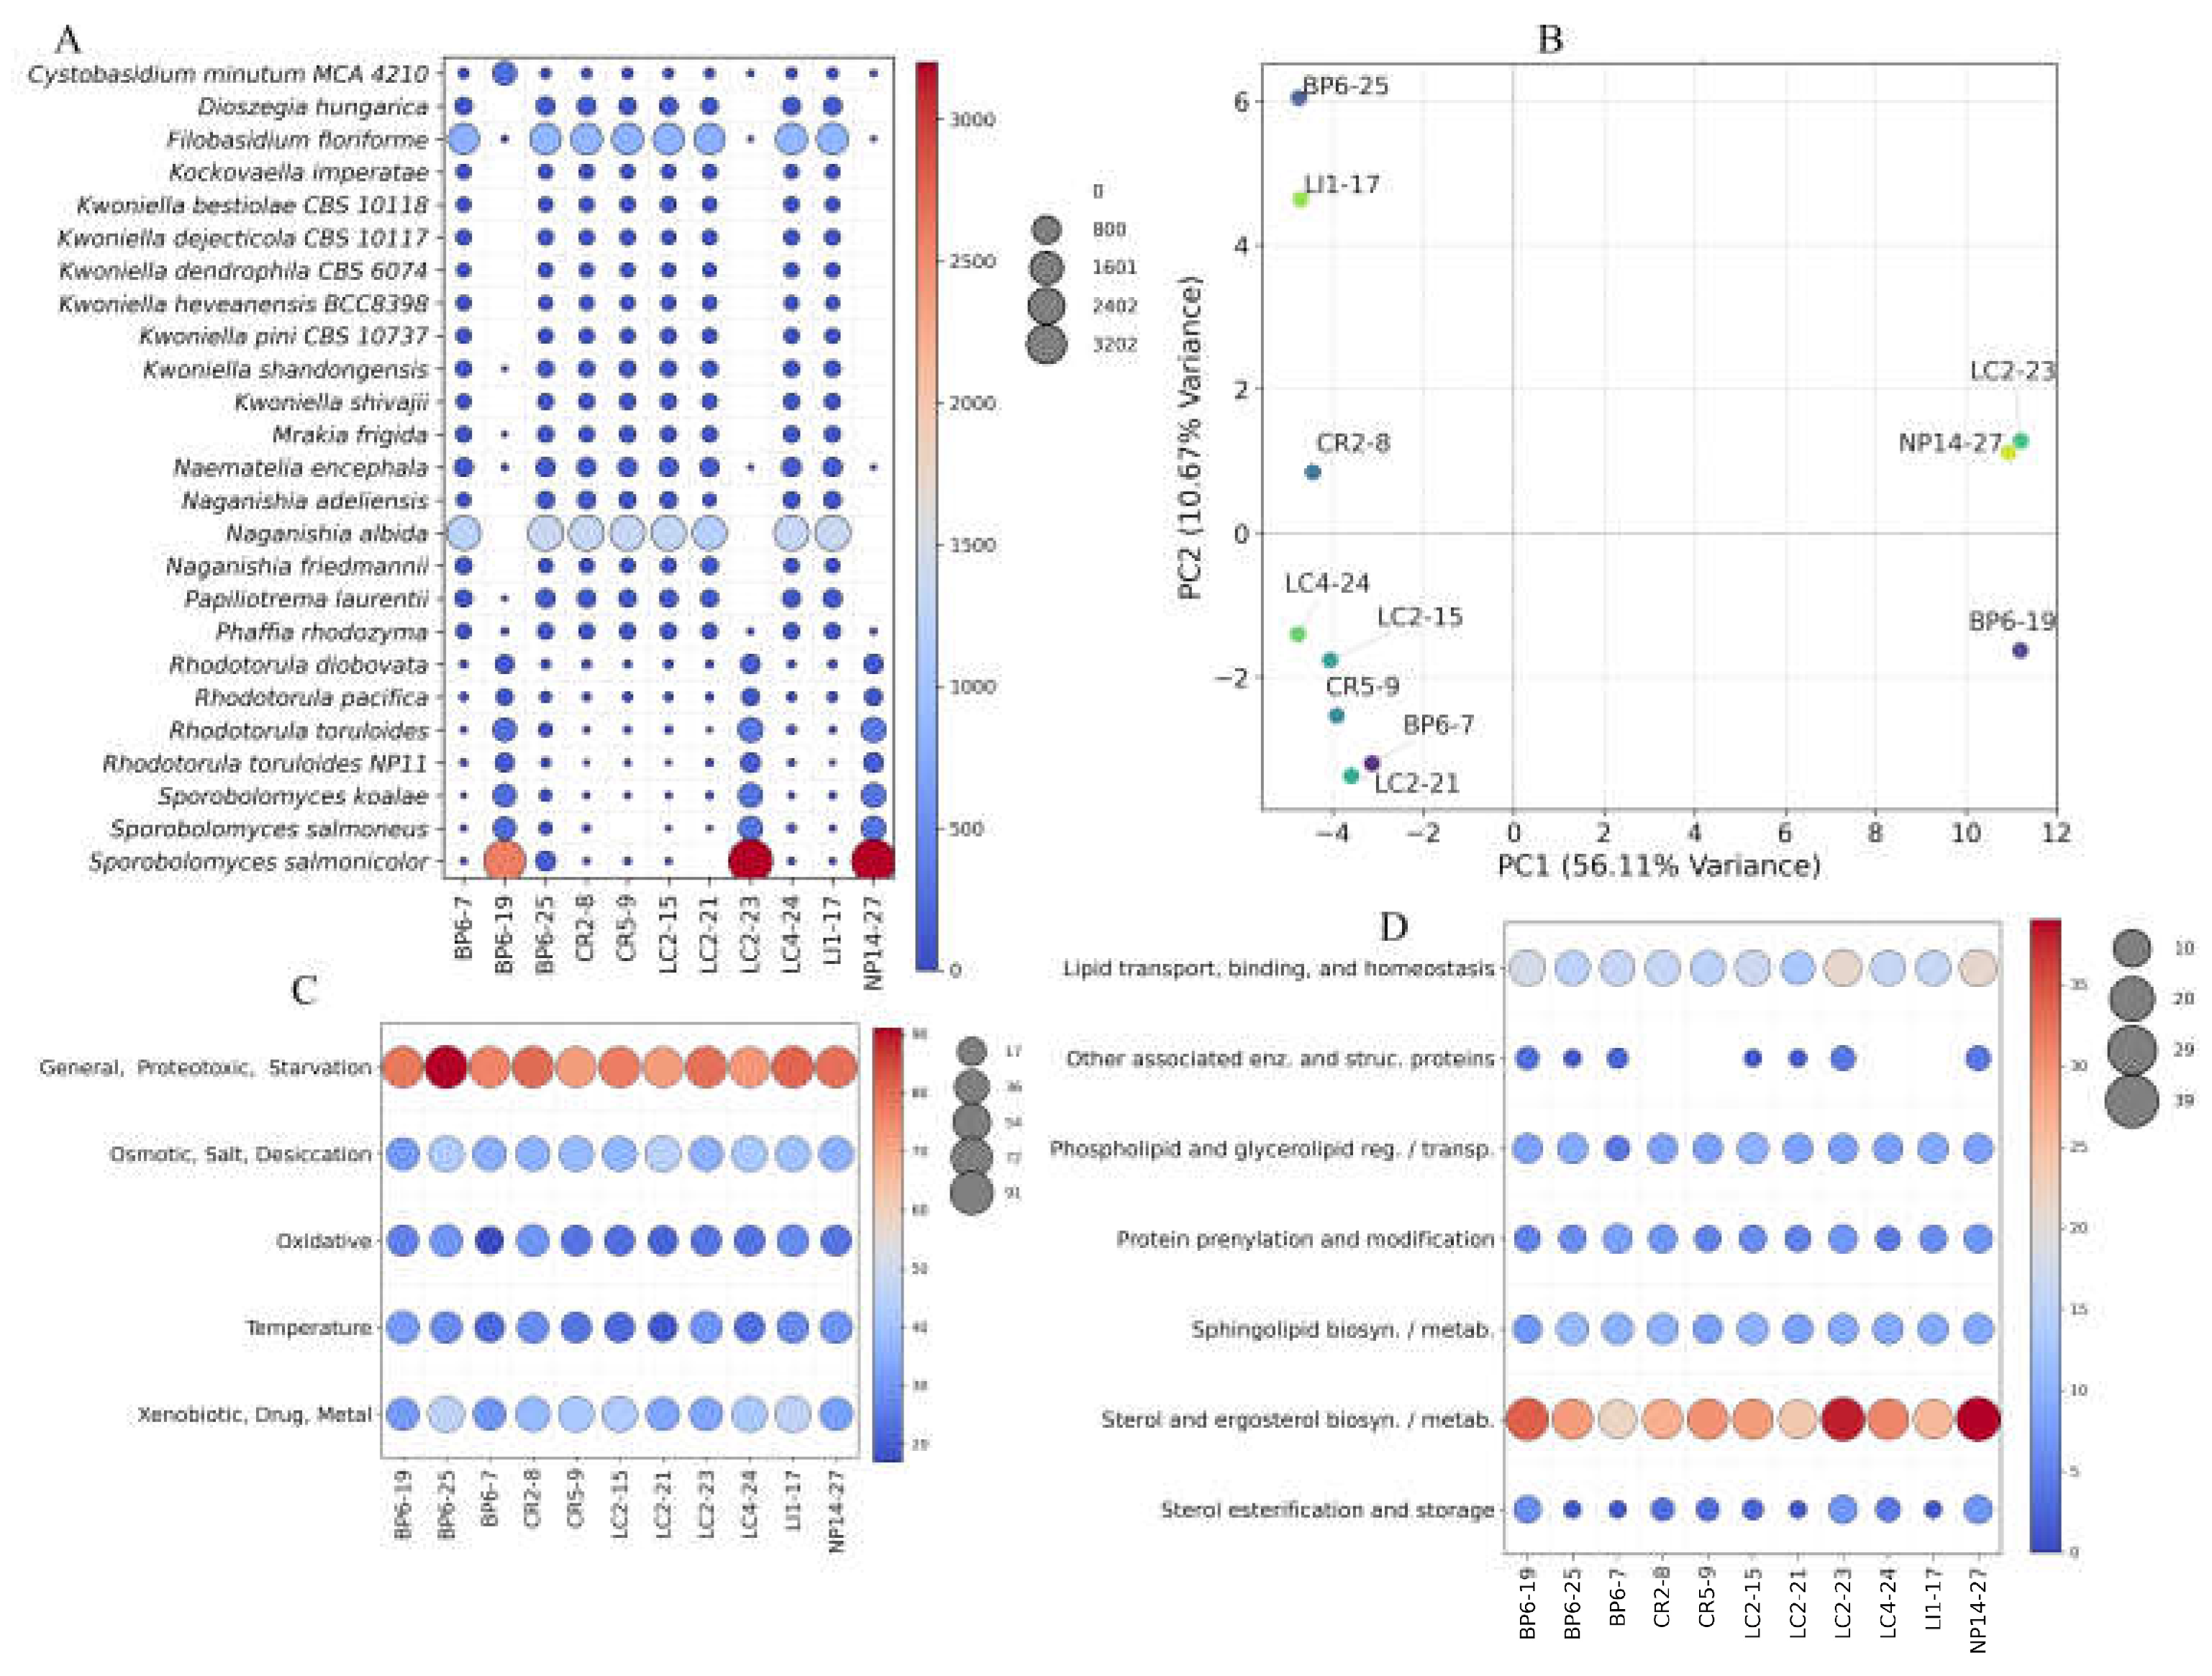
Figure 8.
Potential of yeasts as sources of enzymes of biotechnological interest. Heatmap showing the number of BLASTp hits corresponding to genes encoding enzymes with industrial applications across yeast isolates.
Figure 8.
Potential of yeasts as sources of enzymes of biotechnological interest. Heatmap showing the number of BLASTp hits corresponding to genes encoding enzymes with industrial applications across yeast isolates.
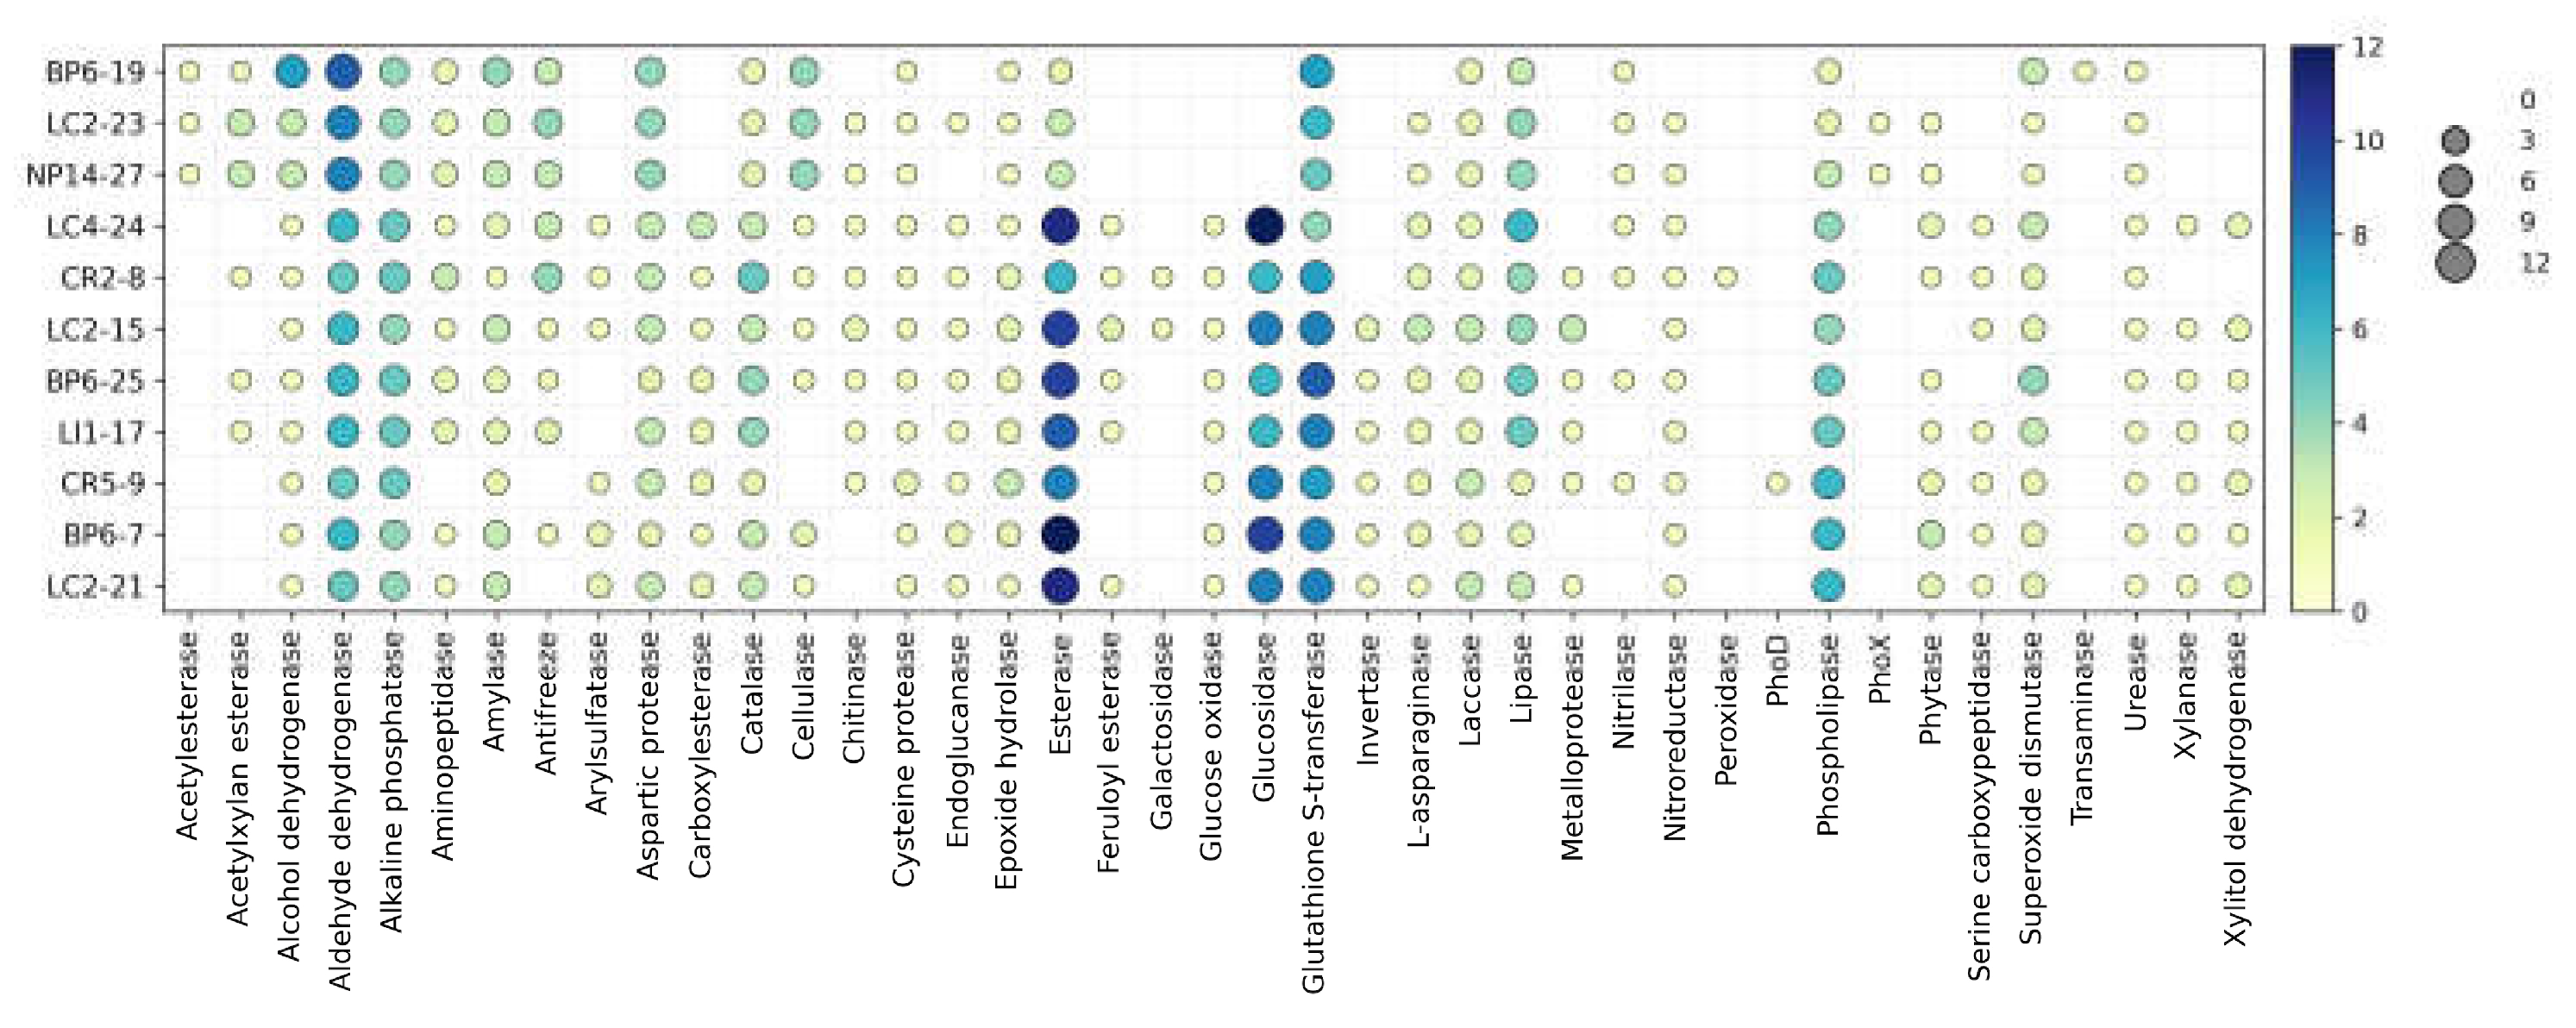
Figure 9.
Mitochondrial functional annotation and comparative analysis across yeast isolates. (A) Mitochondrial genes, structural elements, and intronic features were predicted using MFannot. (B) Open reading frames (ORFs) were predicted using the yeast mitochondrial genetic code and functionally annotated by comparison with the NCBI nr_clust database. (C) ORFs were functionally annotated into Clusters of Orthologous Groups (COGs) and KEGG pathways. Asterisks (*) placed next to pathway labels indicate KEGG pathway annotations. (D) Synteny analysis of the putative mitogenomes.
Figure 9.
Mitochondrial functional annotation and comparative analysis across yeast isolates. (A) Mitochondrial genes, structural elements, and intronic features were predicted using MFannot. (B) Open reading frames (ORFs) were predicted using the yeast mitochondrial genetic code and functionally annotated by comparison with the NCBI nr_clust database. (C) ORFs were functionally annotated into Clusters of Orthologous Groups (COGs) and KEGG pathways. Asterisks (*) placed next to pathway labels indicate KEGG pathway annotations. (D) Synteny analysis of the putative mitogenomes.
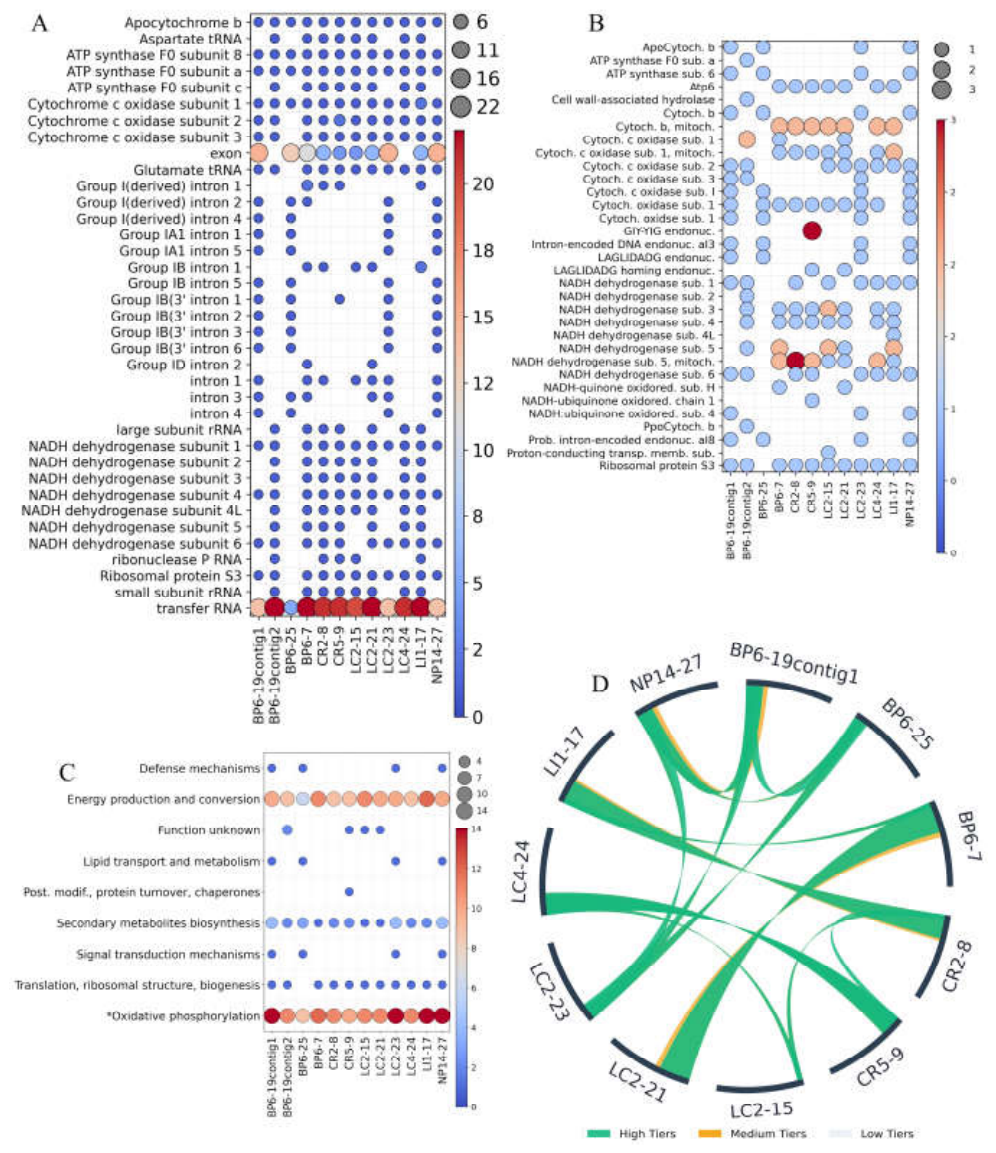
Figure 10.
Geographic distribution of the sampling sites. The inset table provides the geographic coordinates and elevation of each sampling site.
Figure 10.
Geographic distribution of the sampling sites. The inset table provides the geographic coordinates and elevation of each sampling site.
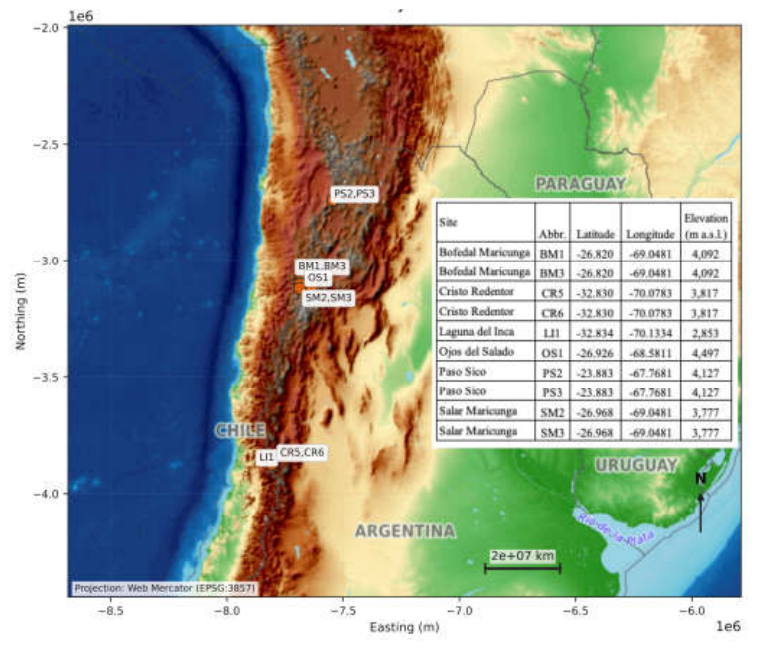

Table 1.
Mitochondrial genome assembly parameters.
| Isolate | Length (nt) | %GC | Circular |
| BP6-19contig1 | 31,121 | 31.5 | no |
| BP6-19contig2 | 22,087 | 38.0 | yes |
| BP6-25 | 19,670 | 31.3 | no |
| BP6-7 | 28,094 | 36.7 | no |
| CR2-8 | 28,016 | 38.4 | no |
| CR5-9 | 33,593 | 38.7 | yes |
| LC2-15 | 25,064 | 38.3 | no |
| LC2-21 | 28,232 | 37.1 | no |
| LC2-23 | 31,121 | 31.5 | no |
| LC4-24 | 27,278 | 38.8 | no |
| LI1-17 | 30,641 | 38.2 | yes |
| NP14-27 | 31,121 | 31.5 | no |
Disclaimer/Publisher’s Note: The statements, opinions and data contained in all publications are solely those of the individual author(s) and contributor(s) and not of MDPI and/or the editor(s). MDPI and/or the editor(s) disclaim responsibility for any injury to people or property resulting from any ideas, methods, instructions or products referred to in the content. |
© 2026 by the authors. Licensee MDPI, Basel, Switzerland. This article is an open access article distributed under the terms and conditions of the Creative Commons Attribution (CC BY) license.
Copyright: This open access article is published under a Creative Commons CC BY 4.0 license, which permit the free download, distribution, and reuse, provided that the author and preprint are cited in any reuse.