

Submitted:
14 October 2026
Posted:
16 October 2026
You are already at the latest version
Abstract
Background: Hemoglobin β-Val1 glycation may influence oxygen binding through altered electrostatics, 2,3-bisphosphoglycerate (2,3-BPG) interactions, conformational redistribution, or heme electronic perturbation. We investigated these mechanisms and their potential relevance to the Glycohypoxia hypothesis. Methods: We performed crystallographic reanalysis of PDB 3B75, 2DN1, and 2DN2; Cα structural superposition; 4.5-Å residue-contact network analysis; and exploratory MMFF94 optimization of valine and fructosyl-valine fragments. Published nonglycated QM/MM oxygen-binding energies and experimental oxygen- and BPG-affinity ratios were quantitatively reanalyzed. Affinity ratios were converted to standard binding free-energy equivalents assuming 310.15 K. Results: PDB 3B75 contained three glucose and two fructose ligands but no explicitly modeled covalent fructosyl-Val1 adduct; the nearest N-terminal nitrogen–carbohydrate separation was approximately 10.4 Å. Across five β chains, oxygenated-reference Cα RMSDs were 0.383–0.670 Å, deoxygenated-reference RMSDs were 0.687–0.951 Å, and β-Val1–heme-iron distances were 19.425–20.119 Å. Contact networks contained 653–682 edges and 19–22 heme-adjacent residues. Two-edge geometric paths involved Val1–Leu81–Phe85 (four chains) or Val1–Val133–Val137 (one chain). Published QM/MM R-minus-T electronic-energy contrasts were −7.1 kcal/mol (α) and −9.0 kcal/mol (β). A reported tenfold oxygen-affinity increase corresponded to −1.419 kcal/mol; 2.6- and 1.7-fold BPG-affinity reductions corresponded to +0.589 and +0.327 kcal/mol, respectively. Thirty conformers per molecular fragment were successfully optimized. Conclusions: β-Val1 glycation may influence oxygen binding through central-cavity electrostatics, BPG-dependent allostery, and conformational redistribution, with direct heme electronic effects remaining untested. Static structural connectivity and affinity-derived energetic equivalents do not establish glycation-specific molecular causality or impaired tissue oxygenation. These findings provide a quantitative framework for testing Glycohypoxia.
Keywords:
hemoglobin A1c
; β-Val1 glycation
; hemoglobin allostery
; oxygen-binding thermodynamics
; oxygenomics of diabetes
; Glycohypoxia
1. Introduction
Hemoglobin is not merely an oxygen-binding metalloprotein but a highly regulated molecular system in which electronic interactions at the heme iron are coupled to tertiary and quaternary conformational changes throughout the α₂β₂ tetramer [1]. The reversible binding of molecular oxygen to ferrous heme is governed by the local coordination environment, interactions involving the proximal and distal histidines, intersubunit communication, and the relative stability of distinct ligation and conformational states [2]. Consequently, hemoglobin oxygen-binding behavior cannot be fully explained by the geometry or electronic properties of the Fe–O₂ interaction alone; rather, it must be understood within the broader structural, allosteric, and thermodynamic landscape of the protein [3]. High-resolution crystallographic investigations have provided an essential structural foundation for examining these relationships by characterizing human hemoglobin in distinct oxygenation and conformational states [4].
Among the post-translational chemical modifications affecting hemoglobin, nonenzymatic glycation is of particular physiological and clinical significance [5]. Hemoglobin A1c (HbA1c) is formed through the reaction of glucose with the N-terminal amino groups of the β-chain valine residues, followed by Amadori rearrangement to generate relatively stable N-terminal fructosyl-valine adducts [6]. Although HbA1c is widely established as a biomarker of chronic glycemic exposure, its formation also raises questions concerning the molecular consequences of introducing a covalent modification into a functionally regulated protein. The β-chain N-terminal region contributes to the electrostatic environment of the central hemoglobin cavity, which is involved in the binding of the endogenous allosteric effector 2,3-bisphosphoglycerate (2,3-BPG) [7]. Glycation at β-Val1 therefore modifies a region associated with allosteric regulation rather than the immediate coordination environment of the heme iron [8].
Experimental investigations have provided evidence that N-terminal glycation can alter the ligand-binding properties of hemoglobin. Coletta and colleagues reported substantial differences between naturally glycated HbA1c and native HbA0, including an approximately tenfold increase in T-state oxygen affinity under the experimental conditions examined [9]. Subsequently, De Rosa and colleagues investigated the effects of glycation on hemoglobin function and its interactions with physiological allosteric effectors. Their study reported reductions in 2,3-BPG affinity of approximately 2.6-fold in the T state and 1.7-fold in the R state, together with molecular-modeling evidence of altered interactions and electrostatic organization within the central cavity [10].
These findings suggest that β-chain N-terminal glycation may influence hemoglobin function through changes in allosteric regulation. Nevertheless, experimentally observed differences in oxygen affinity do not, by themselves, establish whether the underlying mechanism involves direct perturbation of heme electronic interactions, redistribution of conformational-state populations, altered effector binding, or a combination of these processes [11]. A complementary perspective has emerged from quantum-mechanical and multiscale investigations of oxygen binding in nonglycated hemoglobin. Using quantum mechanics/molecular mechanics (QM/MM) calculations, Bringas and colleagues demonstrated that calculated oxygen-binding electronic energies depend on both subunit identity and the surrounding protein conformation, with distinct energetic behavior in α and β subunits and in T- and R-like environments [12]. These findings establish the sensitivity of heme–oxygen electronic interactions to the structural organization of the globin environment. However, electronic binding energies obtained for nonglycated hemoglobin cannot be interpreted as glycation-induced energetic changes. Furthermore, electronic interaction energies must be distinguished from equilibrium oxygen-binding free energies, which depend on additional contributions from solvation, conformational sampling, entropy, and the thermodynamic definition of the binding process.
An important unresolved question therefore concerns how a chemical modification at the β-chain N-terminus might influence oxygen-binding regulation at a spatially distant heme center. At least two mechanistic possibilities warrant consideration. First, glycation could alter local or long-range electrostatic interactions, potentially affecting the electronic environment and intrinsic oxygen-binding energetics of the heme within a defined conformational state. Second, glycation could primarily modify the relative stability, accessibility, or statistical populations of hemoglobin conformations, thereby altering observed oxygen-binding behavior without necessarily producing a substantial direct electronic perturbation within an individual conformational microstate. These possibilities are not mutually exclusive and may coexist with changes in allosteric effector binding, ligand accessibility, or oxygen association and dissociation kinetics. Distinguishing among them requires an analytical framework that separates structural connectivity, electronic energetics, and ensemble-dependent thermodynamic effects.
Crystallographic coordinate reanalysis provides an initial means of investigating the structural relationships between the β-chain N-terminal region and the heme environment. Publicly deposited human hemoglobin structures, including PDB entries 3B75 [13], 2DN1 [14], and 2DN2 [15], provide experimentally determined atomic coordinates suitable for assessing interatomic distances, comparing backbone conformations, and constructing residue-contact networks.
Such networks can identify geometric connections between spatially separated protein regions and define candidate residues for subsequent investigation. However, static residue-contact pathways do not establish functional allosteric communication, and structural comparisons between independently determined crystal structures must account for differences in ligand occupancy, crystallographic conditions, and the chemical representation of glycation. In particular, the biochemical identification of a glycated hemoglobin preparation should not be assumed to imply that its deposited coordinate model explicitly resolves the covalent fructosyl-Val1 modification.
A complementary quantitative approach involves integrating published electronic-structure calculations with experimentally measured ligand-binding affinities. Previously reported QM/MM oxygen-binding energies provide reference scales for conformationally dependent electronic interactions, whereas experimentally determined affinity ratios can be transformed into corresponding standard binding free-energy differences under explicitly defined thermodynamic assumptions. Such transformations facilitate comparison of energetic magnitudes while preserving the distinction between electronic binding energies and equilibrium free energies. Importantly, they do not substitute for glycation-specific quantum-mechanical calculations or direct measurements of oxygen-binding thermodynamics.
The potential physiological relevance of these molecular questions extends to the regulation of erythrocyte oxygen unloading. An increase in hemoglobin oxygen affinity may, under appropriate physiological conditions, reduce oxygen release at a given tissue oxygen tension. Nevertheless, whole-blood oxygen unloading depends on multiple determinants, including 2,3-BPG concentration, pH, carbon dioxide, temperature, hemoglobin composition, and the distribution of glycated and nonglycated hemoglobin species. These considerations are relevant to the proposed Glycohypoxia hypothesis, which examines whether chronic glycemic exposure may contribute to impaired erythrocyte oxygen unloading and tissue oxygen-transfer abnormalities despite preserved arterial oxygenation. The molecular contribution of β-Val1 glycation to this proposed phenotype remains unresolved, and structural or thermodynamic associations alone cannot establish its physiological or pathological causality.
Against this background, the present study was designed as a reproducible crystallographic reanalysis, exploratory molecular-modeling investigation, and quantitative thermodynamic synthesis focused on β-chain N-terminal glycation in human hemoglobin. Using deposited PDBx/mmCIF coordinates, we examined the explicit chemical representation of glycation, quantified the spatial separation between β-Val1 and heme iron, compared β-chain backbone conformations against oxygenated and deoxygenated structural references, and constructed static residue-contact networks to identify candidate geometric connections between the N-terminal region and heme-adjacent residues.
We additionally generated and optimized isolated valine and fructosyl-valine molecular fragments as preliminary chemical models for subsequent investigations. In parallel, published QM/MM oxygen-binding energies and experimentally reported oxygen- and 2,3-BPG-affinity ratios were reanalyzed to establish quantitative electronic and thermodynamic reference scales. Rather than presupposing a direct quantum-mechanical effect of glycation, this investigation aims to distinguish conclusions supported by existing crystallographic and thermodynamic evidence from mechanisms requiring further chemically explicit simulation and experimental validation. By integrating structural geometry, residue-contact connectivity, exploratory molecular modeling, and energetic constraints, the study seeks to define a testable framework for investigating whether glycation-associated alterations in hemoglobin function involve direct heme electronic perturbation, conformational redistribution, changes in allosteric effector interactions, or coupled mechanisms, and to clarify their potential relevance to the molecular basis of Glycohypoxia.
2. Materials and Methods
2.1. Study Design and Evidence Classification
This retrospective computational investigation combined crystallographic coordinate reanalysis, static residue-contact modeling, exploratory molecular-fragment preparation, and quantitative reinterpretation of published oxygen- and 2,3-bisphosphoglycerate (2,3-BPG)-binding evidence. Three evidence classes were distinguished: (i) original measurements derived from deposited atomic coordinates; (ii) secondary calculations based on published affinity ratios and quantum mechanics/molecular mechanics (QM/MM) results; and (iii) molecular-mechanics preparation of isolated chemical fragments. No new full-tetramer molecular-dynamics (MD), density-functional theory (DFT), or QM/MM calculation of glycated hemoglobin was performed.
2.2. Crystallographic Structures and Coordinate Processing
Human hemoglobin structures were obtained in PDBx/mmCIF format from the Protein Data Bank: 3B75, a structure associated with glycated hemoglobin [13]; 2DN1, an oxygenated reference [14]; and 2DN2, a deoxygenated reference [15]. The first coordinate model was parsed using Biopython MMCIFParser. Five β chains of 3B75 (B, D, F, H, and T) were analyzed separately. Standard protein residues, heme groups, and nonpolymeric ligands were identified from deposited records. Residue numbering was retained as parsed. No missing atoms, glycation adducts, or unresolved residues were reconstructed, and no protein relaxation or energy minimization was applied. All coordinate-derived results therefore describe deposited crystal models, not solution-state conformational ensembles.
2.3. Assessment of the Deposited Glycation Representation
Nonpolymeric carbohydrate entries, including glucose (GLC) and fructose (FRU), were identified independently of any presumed protein attachment. For each resolved β-Val1 backbone nitrogen, its minimum separation from carbohydrate heavy atoms was calculated. Pairwise Cartesian distance was defined as:
Distances and coordinate connectivity were inspected to determine whether the deposited model explicitly represented a covalent N-terminal fructosyl-valine adduct. Absence of an explicit modeled linkage was treated as a coordinate-representation limitation, not proof of absence of glycation in the crystallized preparation.
2.4. Cα Structural Alignment and Residue Displacements
Each 3B75 β chain was aligned independently to β chain B of oxygenated 2DN1 using matched Cα atoms at residues 2–146 (145 atom pairs). Separate alignments to β chains B and D of deoxygenated 2DN2 used residues 1–146 (146 atom pairs). Optimal rigid-body rotation and translation were obtained with Biopython Superimposer. For mobile coordinates rᵢ, reference coordinates sᵢ, and N matched atoms, backbone RMSD was:
The corresponding residue-level displacement after superposition was:
RMSD, median displacement, and 95th-percentile displacement were retained for each alignment; individual residue displacements were exported for plotting. Distinct crystallographic structures may differ in ligand state, packing, occupancy, or coordinate uncertainty. Accordingly, no between-structure difference was attributed specifically to glycation.
2.5. β-Val1–Heme Spatial Measurements
The resolved backbone nitrogen of β-Val1 served as the N-terminal reference atom. Iron atoms were identified in deposited heme (HEM) groups, and the nearest iron was assigned geometrically for each analyzed β chain. The measured separation was:
This nearest-iron procedure was not independently validated as a biological chain-to-heme assignment. Chain-specific distances were preserved; no electronic coupling or binding-energy inference was made from distance alone.
2.6. Static Residue-Contact Network Construction
Each β chain was represented by an undirected graph G = (V, E), with standard amino-acid residues as vertices and residue proximity as edges. Carbon, nitrogen, oxygen, and sulfur atoms were included; hydrogen atoms were excluded. For distinct residues i and j, minimum inter-residue heavy-atom distance was defined as:
An undirected edge was assigned when Dᵢⱼ ≤ 4.5 Å; the adjacency rule and edge count were:
SciPy cKDTree was used to identify qualifying atom pairs, which were mapped to unique residue pairs. Sequentially adjacent residues were not excluded, so the graph includes local backbone-associated contacts as well as nonlocal proximity. The 4.5 Å cutoff is an operational geometric criterion, not a validated allosteric threshold.
2.7. Heme-Adjacent Residues and Shortest Paths
A residue was classified as heme-adjacent if at least one eligible residue heavy atom lay within 4.5 Å of an eligible atom of the geometrically assigned heme group (including iron). The heme-adjacent residue set H and shortest unweighted graph distance from Val1 were defined as:
Breadth-first search identified a minimum-edge path from Val1 to H for each chain. Path residues, terminal heme-adjacent residue, and edge count were recorded. Because graphs were static and unweighted, paths were interpreted only as geometric connections; they did not measure signal propagation, energetic coupling, persistence, or directional allostery.
2.8. Reanalysis of Published QM/MM Benchmarks
Electronic oxygen-binding energies, Fe–O distances, and oxygen population charges were taken from the published nonglycated hemoglobin QM/MM study of Bringas and colleagues [12].
These values were external reference data, not newly generated electronic-structure results. For each subunit, the R-minus-T binding-energy contrast and the difference between β- and α-subunit contrasts were calculated as:
Reported Fe–O distances and oxygen population charges were compared descriptively across conformational environments. Charge values retain the meaning and limitations of the population-analysis method in the source study. No glycation-induced electronic-energy difference was inferred from these nonglycated reference calculations.
2.9. Thermodynamic Conversion of Published Oxygen Affinity
The approximately tenfold T-state oxygen-affinity ratio reported by Coletta and colleagues [9] was transformed into an illustrative standard binding free-energy equivalent. For consistent association-equilibrium and standard-state conventions:
The published glycated-to-native association-affinity ratio was denoted qO₂. Conversions used R = 0.0019872043 kcal mol⁻¹ K⁻¹ and an assumed T = 310.15 K. This temperature was a calculation convention, not a claim about the precise conditions of the original experiment. The resulting value is a conditional thermodynamic equivalent of the published ratio, not a measured in vivo oxygen-unloading change or Fe–O₂ electronic interaction energy.
2.10. Thermodynamic Conversion of Published 2,3-BPG Affinity
T- and R-state BPG-affinity reduction factors were taken from De Rosa and colleagues [10]. For each state, f was defined as native divided by glycated BPG association affinity, yielding:
State-specific penalties were calculated separately, and their contrast was:
The same assumed temperature and gas constant were applied. Oxygen- and BPG-affinity conversions describe distinct binding reactions and were neither added nor interpreted as a complete thermodynamic cycle. The original studies’ experimental uncertainty was not reconstructed.
2.11. Distinction Between Electronic and Equilibrium Energetics
To avoid conflating fundamentally different quantities, electronic oxygen-binding energy was distinguished from equilibrium free energy. For a consistently specified electronic model, a schematic electronic binding-energy expression is:
Equilibrium free energy also incorporates entropic, solvent, and conformational contributions and satisfies ΔG = ΔH − TΔS under its thermodynamic definition. No matched HbA0/HbA1c electronic-energy difference, binding free-energy surface, or enthalpy–entropy decomposition was calculated. Published QM/MM energies and affinity-derived free energies were therefore maintained as separate evidence categories.
2.12. Exploratory Valine and Fructosyl-Valine Fragment Preparation
Isolated unmodified valine and an N-substituted open-chain fructosyl-valine ketoamine representation were constructed from stereochemically annotated SMILES using RDKit. These free molecular fragments were not embedded in a β-chain peptide or intact hemoglobin. The fructosyl-valine input represented one selected chemical form rather than an experimentally validated distribution of physiological HbA1c microstates. Explicit hydrogens were added, and 30 conformers per fragment were generated using ETKDGv3 with fixed random seed 20261012. Each conformer was optimized with MMFF94 (maximum 400 iterations); convergence was evaluated from the optimization status. The lowest-energy converged conformer of each species was selected and exported as SDF:
MMFF94 energies were used solely to rank conformers within each molecular species. Because valine and fructosyl-valine differ in composition, their absolute force-field energies were not subtracted to estimate glycation reaction energetics. Fragment optimization does not establish full-protein structure, oxygen-binding effects, or allosteric behavior.
2.13. Data Handling, Reproducibility, and Statistical Scope
Python-based scripts used Biopython for coordinate parsing and structural superposition, NumPy for numerical calculations, SciPy for neighbor searches, and RDKit for molecular-fragment preparation. Chain-level alignments, residue-displacement profiles, structural comparisons, N–Fe distances, contact counts, shortest paths, and fragment descriptors were exported to CSV, with analysis metadata in JSON.
Deterministic coordinate calculations can be reproduced from the same inputs and definitions; fragment conformer generation used the fixed seed specified above. Exact software-version capture, input checksums, and permanent public code deposition were not completed as part of the reported workflow.
All analyses were descriptive. The five 3B75 β chains were treated as distinct crystallographic coordinate instances, not independent biological replicates; no patient-level data, inferential hypothesis tests, confidence intervals, or P values were generated. Systematic sensitivity analysis of contact cutoffs, explicit crystallographic symmetry contacts, and solution-state conformational sampling were not performed.
2.14. Mechanistic Scope and Prospective Validation
The analyses were used to frame three nonexclusive hypotheses: direct electrostatic/electronic perturbation at heme, redistribution of conformational-state populations, and altered allosteric-effector interactions. None was tested causally by the present coordinate reanalysis. Future discrimination would require a chemically validated β-Val1 fructosyl adduct embedded in matched HbA0/HbA1c structures, verified chain-specific heme assignments, controlled protonation and ligand states, explicit-solvent conformational sampling, and matched electronic-structure and binding free-energy calculations. Subsequent physiological validation would require direct oxygen-equilibrium and unloading measurements under controlled BPG, pH, temperature, and oxygenation conditions. Accordingly, this study was restricted to original static structural descriptors, exploratory fragment models, and secondary energetic transformations of published data. These outputs provide candidate geometric and thermodynamic constraints for future tests of glycation-associated oxygen-binding mechanisms, including their proposed relevance to Glycohypoxia, without establishing a direct causal effect on tissue oxygen delivery.
3. Results
3.1. Chemical Representation of Glycation in the Deposited Crystallographic Model
Inspection of the deposited 3B75 coordinate model identified three glucose (GLC) and two fructose (FRU) ligand entries, but no explicitly modeled covalent fructosyl-Val1 adduct at the N-termini of the five analyzed β chains (B, D, F, H, and T). The shortest observed distance between a β-Val1 N-terminal nitrogen and a carbohydrate heavy atom was approximately 10.4 Å, inconsistent with a directly represented covalent linkage. The structural references and the extent of their chemical representation are summarized in Table 1 [13,14,15]. This finding distinguishes the chemical information present in the deposited coordinates from the biochemical status of the crystallized preparation. It does not demonstrate absence of glycation in the experimental sample.
Accordingly, 3B75 was used for geometric characterization but not as a chemically explicit glycated structure for glycation-specific electronic-energy calculations.
The glycation description concerns deposited coordinates, not necessarily the experimental sample.
3.2. Backbone Structural Comparisons and Residue-Level Displacements
Independent alignment of each 3B75 β chain against β chain B of oxygenated 2DN1 [14] used 145 corresponding Cα atoms (residues 2–146). As shown in Table 2 and Figure 1, RMSDs ranged from 0.3831 to 0.6704 Å; chains B and D showed the smallest deviations, and chain F the largest. Median residue-level displacements ranged from 0.2755 to 0.4522 Å, and 95th-percentile displacements ranged from 0.7222 to 1.4184 Å. The residue-resolved profiles (Figure 2) reveal localized displacement peaks within otherwise relatively conserved backbones.
As reported in Table 3 and Figure 1, additional comparisons with β chains B and D of deoxygenated 2DN2 [15] used 146 corresponding Cα atoms and yielded RMSDs of 0.6865–0.9507 Å across ten comparisons. The smallest values occurred for 3B75 chain F versus 2DN2 chain B (0.6865 Å) and chain D (0.6873 Å). Because the structures were determined independently and differ in experimental context, these deviations cannot be attributed specifically to glycation.
3.3. Spatial Separation Between β-Val1 and Heme Iron
The β-Val1 N-terminal nitrogen-to-nearest-heme-iron distances ranged from 19.425 to 20.119 Å across the five chains (Table 4; Figure 3). This approximately 20 Å separation places the N-terminal modification site outside the immediate heme coordination sphere in the deposited conformations. The nearest-heme assignment was geometric, and the distances alone neither establish nor exclude long-range electronic or allosteric effects.
Nearest-heme assignment is geometric; networks use a 4.5 Å heavy-atom cutoff.
3.4. Static Residue-Contact Networks and Shortest Geometric Paths
Static residue-contact graphs constructed using a 4.5 Å minimum heavy-atom distance threshold contained 653–682 unique edges and 19–22 heme-adjacent residues per β chain (Table 4). Breadth-first search identified a two-edge shortest geometric path from β-Val1 to a heme-adjacent residue in all five chains. As illustrated schematically in Figure 4, Val1–Leu81–Phe85 was identified in chains B, F, H, and T, whereas Val1–Val133–Val137 was identified in chain D. These paths are static geometric connections, not experimentally demonstrated routes of allosteric signal transmission. No cutoff-sensitivity analysis, contact persistence, directional coupling, or glycation-induced network perturbation was determined.
3.5. Published QM/MM Oxygen-Binding Electronic-Energy Benchmarks
Published QM/MM calculations for nonglycated hemoglobin by Bringas et al. [12] reported oxygen-binding electronic energies of −23.1 and −30.2 kcal/mol for α subunits in T- and R-like environments, respectively, and −21.7 and −30.7 kcal/mol for β subunits (Table 5; Figure 5). The derived R-minus-T contrasts were −7.1 kcal/mol (α) and −9.0 kcal/mol (β), differing in magnitude by 1.9 kcal/mol.
The published Fe–O distances and O₂ population charges are reported separately in Table 6. These values are literature-based benchmarks, not new glycation-specific QM/MM calculations.
3.6. Thermodynamic Equivalent of Published T-State Oxygen-Affinity Changes
The approximately tenfold T-state oxygen association-affinity increase reported by Coletta et al. [9] was converted into an illustrative standard binding free-energy equivalent using the association-affinity convention below. The resulting value is presented alongside the BPG-affinity transformations in Table 7 and Figure 6:
At an explicitly assumed temperature of 310.15 K, q = 10 corresponds to ΔΔG°(O₂) = −1.419 kcal/mol. The negative value indicates more favorable oxygen association under this convention. This is a secondary transformation of a published ratio, not a new measurement, an electronic Fe–O₂ energy, or a physiological whole-blood P₅₀ estimate.
3.7. Thermodynamic Equivalents of Published 2,3-BPG Affinity Changes
De Rosa et al. [10] reported approximately 2.6-fold and 1.7-fold reductions in BPG association affinity in T- and R-state hemoglobin, respectively. Defining f as the native-to-glycated association-affinity ratio, the corresponding standard free-energy penalty was calculated as follows; the derived values are compared in Table 7 and Figure 6:
At 310.15 K, the derived BPG-binding penalties were +0.589 kcal/mol (T state) and +0.327 kcal/mol (R state). Their difference was +0.262 kcal/mol. Because oxygen and BPG binding describe distinct reactions, these values were not summed as a single glycation-associated free-energy change.
Conversions assume 310.15 K and are not direct experimental free-energy measurements.
3.8. Exploratory Molecular-Fragment Preparation
Isolated valine and open-chain fructosyl-valine models were generated using RDKit, with 30 three-dimensional conformers optimized for each species using MMFF94. All 30 conformers converged in each set. As summarized in Table 8 and the molecular-model illustration designated Figure 7, the lowest identified MMFF94 energies were 25.4047 kcal/mol for valine and 124.9188 kcal/mol for fructosyl-valine. These absolute force-field energies refer to molecules of different composition and cannot be subtracted to estimate a glycation reaction energy.
The optimized fragments are preliminary chemical models, not protein-embedded glycated β-chain residues. No intact glycated hemoglobin simulation, glycation-specific electronic-energy calculation, or equilibrium oxygen-binding free-energy calculation was performed.
3.9. Integrated Structural and Energetic Findings
The crystallographic analysis identified approximately 19.4–20.1 Å separation between β-Val1 and the nearest heme iron, along with recurrent short geometric contact paths linking the N-terminal region to heme-adjacent residues. Deposited 3B75 coordinates did not explicitly encode a covalent fructosyl-Val1 modification. Independently, literature-based QM/MM benchmarks and affinity-derived free-energy equivalents provided reference scales for electronic and equilibrium-binding phenomena without isolating a glycation-specific electronic effect. Together, the findings define a reproducible exploratory framework for future investigation of hemoglobin glycation, allosteric regulation, and the Glycohypoxia hypothesis. They do not establish that β-Val1 glycation changes intrinsic Fe–O₂ bonding, physiological oxygen unloading, or tissue oxygenation. Distinguishing direct electronic perturbation from conformational and effector-mediated mechanisms requires chemically matched models and experimental validation.
4. Discussion
The present investigation provides an integrated molecular and thermodynamic assessment of the potential relationship between hemoglobin β-chain N-terminal glycation and oxygen-binding regulation. By combining crystallographic coordinate reanalysis, static residue-contact network analysis, published quantum mechanics/molecular mechanics (QM/MM) benchmarks, affinity-derived thermodynamic calculations, and exploratory molecular-fragment preparation, the study addresses how a covalent modification at β-Val1 might influence a spatially distant oxygen-binding center. The findings support a mechanistic framework in which glycation-associated changes in electrostatic organization, allosteric effector interactions, and conformational equilibria could influence hemoglobin function. However, they do not establish direct glycation-induced changes in heme electronic structure or demonstrate impaired physiological oxygen unloading. This distinction is central to the interpretation of the study: the analyses establish structural relationships and quantitative energetic constraints, whereas the proposed molecular mechanisms remain hypotheses requiring chemically explicit computational and experimental validation.
An important finding concerns the crystallographic representation of glycation itself. Although PDB 3B75 is associated with the investigation of glycated hemoglobin [13], its deposited coordinates do not explicitly represent a covalently attached fructosyl-Val1 modification at the analyzed β-chain N-termini. Three glucose and two fructose ligand entries were identified, but the nearest resolved carbohydrate heavy atoms were approximately 10.4 Å from the relevant N-terminal nitrogen atoms, rather than positioned in a geometry compatible with direct covalent attachment. This observation does not establish that the crystallized protein preparation lacked glycation; instead, it demonstrates that the deposited coordinate model is insufficient for directly characterizing the chemical geometry or electronic consequences of the Amadori adduct. The distinction is consequential because a glycated experimental specimen and a chemically explicit glycated structural model are not interchangeable. Without an atomically represented fructosyl-Val1 group, differences between 3B75 and other hemoglobin structures cannot be attributed specifically to glycation, and glycation-dependent electrostatic fields, steric interactions, or quantum-mechanical perturbations cannot be calculated directly from the deposited coordinates.
The structural comparisons nevertheless establish the extent of backbone similarity across the analyzed crystallographic references. Independent alignment of the five β chains in 3B75 against the oxygenated reference 2DN1 yielded Cα root-mean-square deviations of 0.383–0.670 Å across 145 matched positions [14].
Median residue displacements were approximately 0.276–0.452 Å, indicating substantial conservation of the β-globin backbone, whereas the larger 95th-percentile displacements of approximately 0.722–1.418 Å revealed localized positional differences. Comparisons with the deoxygenated reference 2DN2 produced RMSDs of approximately 0.687–0.951 Å across 146 matched positions [15]. Although these findings place the analyzed models within a relatively conserved structural framework, the differing residue sets prevent strict numerical equivalence between oxygenated- and deoxygenated-reference RMSDs. More importantly, isolated β-chain superposition does not measure the tetramer's quaternary conformational equilibrium. In hemoglobin, oxygen affinity emerges from coupled tertiary and quaternary structural states, and relatively small backbone deviations may coexist with functionally important differences in side-chain orientation, electrostatic interactions, or intersubunit contacts. Conversely, structural differences between independently determined crystal models may reflect experimental conditions rather than a specific biochemical modification. The present comparisons therefore provide descriptive conformational context without demonstrating glycation-induced redistribution between low- and high-affinity states [12].
The β-Val1-to-heme geometry further emphasizes the importance of indirect molecular regulation. Across the five analyzed β chains, the N-terminal nitrogen-to-nearest-heme-iron distances ranged from 19.425 to 20.119 Å. Glycation therefore occurs outside the immediate heme coordination environment and does not chemically modify the iron–oxygen complex itself. However, hemoglobin is an allosterically coupled protein rather than a collection of independent oxygen-binding sites. The energetic influence of a peripheral chemical modification need not propagate through a single continuous covalent route; it may instead arise from changes in local charge distribution, hydrogen-bond organization, residue packing, solvent interactions, and the relative stability of accessible protein conformations. The measured separation consequently constrains the spatial scale of a proposed effect but does not exclude long-range coupling. At the same time, the nearest-iron assignment used here is a reproducible geometric procedure, not an independent validation of the biological chain-to-heme correspondence, and should be confirmed before assigning residue-specific communication mechanisms.
Static residue-contact analysis identified a geometric basis for investigating such coupling. At a 4.5 Å heavy-atom cutoff, the five β-chain networks contained 653–682 unique residue-contact edges and 19–22 heme-adjacent residues. The shortest connection from β-Val1 to a heme-adjacent residue was Val1–Leu81–Phe85 in four chains and Val1–Val133–Val137 in the remaining chain, with two graph edges in each case.
These pathways demonstrate topological proximity within the selected contact representation, but their short graph length should not be interpreted as evidence that mechanical or electronic information preferentially travels through those residues. Contact networks defined from single crystallographic conformations lack the temporal and energetic information required to identify functional allosteric pathways. They do not quantify interaction strengths, contact persistence, correlated fluctuations, solvent-mediated communication, or intersubunit transmission. Furthermore, the identity of a shortest path may change with the contact cutoff or local atomic coordinates. The identified residues are therefore best regarded as candidates for subsequent dynamic network and energetic-coupling analyses. Their value lies in defining testable structural hypotheses rather than establishing a direct causal route between the glycation site and the heme.
A more specific mechanistic connection arises from the location of β-Val1 within the electrostatic environment of the central hemoglobin cavity. The N-terminal amino groups contribute to a region involved in binding the highly anionic allosteric effector 2,3-bisphosphoglycerate (2,3-BPG). Formation of the N-terminal fructosyl-valine adduct changes the chemical identity and steric environment of this region and may alter its protonation-dependent charge distribution, hydrogen-bonding possibilities, hydration, and accessibility to the effector. These effects cannot be reduced to a simple assumption that glycation uniformly removes a positive charge, because the protonation state of the modified amino group and its interactions depend on the local chemical environment. Instead, glycation may redistribute the positive electrostatic potential and modify the geometry of the BPG-binding pocket. This interpretation is supported by De Rosa and colleagues, who reported approximately 2.6-fold lower BPG affinity in the T state and 1.7-fold lower affinity in the R state of HbA1c compared with HbA0 [10]. Their molecular-modeling analysis also indicated altered BPG-binding geometry and a restricted range of favorable effector orientations in the glycated protein. Importantly, their findings did not indicate complete abolition of BPG binding, but rather a modification of the interaction environment. This distinction supports a model of altered allosteric regulation rather than simple loss of effector recognition [10].
The functional implications of these interactions can be considered within the thermodynamic linkage between oxygen binding and allosteric effector association. Because 2,3-BPG preferentially stabilizes deoxygenated, lower-affinity hemoglobin conformations, a reduction in its binding affinity could weaken this stabilization and favor oxygen-binding behavior associated with higher-affinity states under suitable conditions. This provides a plausible mechanism through which modification of the β-chain N-terminus could influence oxygen affinity without directly changing the electronic bonding of oxygen to heme iron. However, the effect cannot be predicted from a single BPG-affinity ratio alone [16].
The response depends on the effector concentration, the affinities of different conformational states, the degree of glycation, and other allosteric regulators. Moreover, the classical T–R description is a useful thermodynamic framework but does not capture the full range of tertiary substates and conformational heterogeneity that can contribute to oxygen binding. A chemically modified hemoglobin molecule could therefore display altered functional behavior through shifts within a broader conformational ensemble, even when its global backbone geometry remains largely conserved [17].
The published functional findings are consistent with this possibility. Coletta and colleagues reported an approximately tenfold increase in T-state oxygen affinity in naturally glycated HbA1c under their experimental conditions [9]. Their investigation also documented altered ligand-binding kinetics, including slower oxygen dissociation, and interpreted the functional changes as consistent with a more relaxed T-state environment. These observations are mechanistically important because equilibrium affinity reflects the balance between association and dissociation processes, whereas an altered dissociation rate provides additional information about ligand retention. Nevertheless, a reduction in oxygen dissociation rate does not uniquely identify a stronger intrinsic Fe–O₂ electronic bond. Ligand escape can also be influenced by distal-pocket interactions, protein conformational fluctuations, and the accessibility of pathways between the heme pocket and solvent. Thus, the reported kinetic and equilibrium changes support altered ligand-binding regulation without distinguishing direct electronic effects from conformational or allosteric mechanisms.
The present thermodynamic reinterpretation provides a quantitative perspective on the magnitude of these observations. At an explicitly assumed temperature of 310.15 K, a tenfold increase in oxygen association affinity corresponds to a standard binding free-energy equivalent of approximately −1.419 kcal/mol. Although the affinity ratio is substantial, its logarithmic relationship with binding free energy demonstrates that comparatively modest energetic differences can produce marked changes in equilibrium behavior. This is particularly relevant to hemoglobin, whose cooperative function depends on a finely balanced distribution of molecular states. However, the calculated value is conditional on the reported ratio and the selected temperature. It is not a newly measured oxygen-binding free energy, a direct estimate of the energetic contribution of fructosyl-Val1, or a reconstruction of the original experiment's complete thermodynamic conditions. Similarly, the published BPG-affinity reductions correspond to estimated standard binding free-energy penalties of +0.589 kcal/mol for the T state and +0.327 kcal/mol for the R state, yielding a difference of approximately +0.262 kcal/mol under the same assumed temperature.
The larger penalty in the T state is compatible with a disproportionate weakening of BPG association in the lower-affinity conformational environment.
Nevertheless, these values quantify distinct BPG-binding reactions and cannot be directly added to the oxygen-affinity free-energy equivalent. A complete mechanistic interpretation would require a thermodynamic linkage model describing oxygenation, effector binding, glycation state, and conformational populations within a consistent reference framework. Without such a model, the calculated energetic quantities provide useful constraints but do not establish how much of the observed oxygen-affinity difference is caused by altered BPG binding.
The quantum-mechanical interpretation requires an additional distinction between equilibrium binding free energies and electronic interaction energies. Bringas and colleagues used QM/MM calculations to investigate the dependence of oxygen-binding electronic energetics on hemoglobin subunit identity and conformational environment [12]. Their reported nonglycated reference values were −23.1 and −30.2 kcal/mol for α-subunit T- and R-like environments and −21.7 and −30.7 kcal/mol for the corresponding β-subunit environments. The derived R-minus-T contrasts were −7.1 kcal/mol for the α subunit and −9.0 kcal/mol for the β subunit. These findings demonstrate that the protein environment can substantially influence the electronic component of oxygen binding, but they do not represent calculations on glycated hemoglobin. Furthermore, the reported electronic-energy differences cannot be equated with equilibrium oxygen-binding free-energy changes because they do not, by themselves, include the complete entropic, solvation, and conformational contributions required to describe an experimental binding equilibrium.
At the electronic-structure level, oxygen binding to ferrous heme involves more than a classical localized bond between an isolated Fe²⁺ ion and a neutral O₂ molecule. The electronic structure of the oxygenated heme complex has substantial metal–ligand covalency and can be described using contributions from iron–dioxygen and iron–superoxide-like electronic configurations. The relative contributions of these configurations depend on the electronic-structure method, the local coordination environment, and interactions involving the proximal histidine, distal pocket, and surrounding protein [18,19]. Changes in hydrogen bonding, local electric fields, and protein geometry may therefore influence orbital interactions, charge distribution, spin coupling, and oxygen-binding energetics. These considerations provide a physically plausible basis for investigating whether a distant chemical modification could alter heme electronic behavior indirectly through protein-mediated electrostatic or conformational effects. However, neither the present crystallographic analysis nor the published nonglycated QM/MM benchmarks establish that β-Val1 glycation changes any particular orbital interaction, electron-transfer process, or spin-state distribution. Such claims require matched glycated and nonglycated electronic-structure calculations.
A further distinction concerns the mechanism by which a distant modification might influence a heme center. Classical electrostatic interactions and conformational coupling provide established physical routes through which changes at one protein site can affect another. Quantum mechanics is required to describe the electronic structure of the heme–oxygen complex accurately, but the existence of long-range allosteric regulation does not imply coherent quantum information transfer or direct electron tunneling between β-Val1 and the heme. A chemically meaningful computational strategy would therefore distinguish two linked levels of analysis: the effect of glycation on the protein's conformational and electrostatic environment, and the response of heme electronic structure to those altered environments. Matched-state QM/MM calculations could compare oxygen-binding electronic energies, Fe–O₂ bond characteristics, and electron- or spin-density distributions while controlling for conformational state. Complementary conformational sampling would be needed to determine whether glycation alters the statistical distribution of protein configurations and thereby changes ensemble-averaged oxygen-binding behavior. Only their integration could clarify whether the dominant mechanism is an intrinsic electronic perturbation, a shift in conformational populations, or coupling between the two.
The published Fe–O distances and oxygen population charges illustrate the need for this separation. In the nonglycated QM/MM reference calculations, Fe–O distances were approximately 1.77 Å in both α-subunit environments and 1.84 and 1.83 Å in β-subunit T- and R-like environments, respectively. The corresponding oxygen population charges were −0.285 and −0.270 e for the α subunit and −0.326 and −0.308 e for the β subunit [12]. These values demonstrate method-dependent electronic differences across subunit environments, but they do not establish glycation-dependent charge redistribution. Population charges are not uniquely observable physical quantities and depend on the partitioning scheme used in the underlying electronic-structure calculation. Consequently, comparisons of such descriptors are most informative when performed using identical methods and matched chemical models. The present study cannot determine whether fructosyl-Val1 modifies heme electron density, Fe–O₂ bond order, or the relative stability of electronic configurations.
The exploratory molecular-fragment preparation represents a preliminary step toward constructing chemically explicit glycation models. Thirty conformers of valine and thirty conformers of an open-chain fructosyl-valine representation were generated and optimized using MMFF94, with all conformers converging under the selected procedure. The lowest calculated force-field energies were approximately 25.405 and 124.919 kcal/mol, respectively. These energies are suitable for comparing conformers of the same molecular species within the selected model but cannot be subtracted to obtain a glycation reaction energy because the molecules differ in composition.
The fructosyl-valine fragment also lacks the constraints imposed by the β-globin backbone, the hemoglobin tetramer, solvent, heme, and allosteric effectors. Its optimized geometry therefore cannot establish the orientation, hydration, protonation state, or energetic consequences of the modification in intact HbA1c. A future protein-level model would need to account for the chemical linkage, relevant stereochemical and tautomeric states, and the possible effects of glycation on one or both β chains.
The potential physiological significance of these molecular mechanisms lies in the distinction between oxygen affinity and oxygen delivery. Increased hemoglobin oxygen affinity generally favors oxygen retention at a given oxygen partial pressure and, under otherwise comparable conditions, may reduce oxygen release across a defined tissue oxygen-pressure interval. However, whole-blood oxygen transport depends on the oxygen dissociation curve, hemoglobin concentration, arterial oxygenation, blood flow, microvascular exchange, and local metabolic demand. It is also influenced by erythrocyte 2,3-BPG concentration, pH, carbon dioxide, temperature, and the proportions of modified and unmodified hemoglobin species. Therefore, a change in the oxygen affinity of purified HbA1c cannot be translated directly into a predicted whole-blood P₅₀ shift or tissue oxygen deficit. The magnitude of any physiological effect would depend on the distribution of glycated hemoglobin within circulating erythrocytes and on the extent to which other regulatory mechanisms compensate for altered intrinsic ligand-binding behavior [20]. The Bohr effect provides another potentially relevant connection between β-Val1 glycation and tissue oxygen unloading. In native hemoglobin, proton-linked changes in oxygen affinity contribute to oxygen release in metabolically active tissues, where local acidification and elevated carbon dioxide favor deoxygenation. De Rosa and colleagues reported a reduced Bohr effect in HbA1c compared with HbA0 [10]. This finding suggests that glycation may affect not only interactions with 2,3-BPG but also the proton-linked regulation of oxygen binding. Because protonation equilibria and electrostatic interactions are coupled to hemoglobin conformation, modification of the N-terminal chemical environment could plausibly alter the response to tissue pH. Nevertheless, the specific contribution of β-Val1 glycation to the Bohr effect cannot be quantified from the present structural analyses, and the reported functional difference should not be assumed to produce a uniform impairment of oxygen unloading under all physiological conditions [21]. These mechanisms have potential relevance to the Glycohypoxia hypothesis, which proposes that chronic glycemic exposure may contribute to impaired erythrocyte oxygen unloading and tissue oxygen-transfer abnormalities even when arterial oxygenation is preserved. A possible mechanistic sequence would begin with increased glycation of hemoglobin β-chain N-termini, followed by altered central-cavity electrostatics, modified BPG interactions, and changes in proton-linked or conformational regulation.
Under conditions in which these molecular changes increase effective oxygen affinity or slow oxygen release, the amount of oxygen unloaded over a physiologically relevant tissue oxygen-pressure range could decrease. Such an effect might become particularly relevant when microvascular oxygen delivery is already constrained. However, this sequence is a proposed causal pathway, not an established result of the present investigation. The study did not measure whole-blood oxygen dissociation curves, P₅₀, erythrocyte oxygen-release kinetics, tissue oxygen extraction, or tissue oxygen tension, and it cannot determine whether β-Val1 glycation makes a clinically meaningful contribution to impaired oxygen delivery in diabetes [22,23].
At the tissue level, sustained reductions in oxygen availability can influence oxygen-sensitive metabolic and transcriptional pathways. Hypoxia-inducible factor signaling, mitochondrial redox regulation, and changes in cellular energy metabolism are potential downstream processes through which genuine tissue hypoxia could contribute to organ dysfunction. Nevertheless, the activation of hypoxia-responsive pathways in diabetes is multifactorial and may arise from altered perfusion, mitochondrial metabolism, inflammation, or other metabolic disturbances independently of hemoglobin glycation [24]. It would therefore be premature to infer that β-Val1 glycation directly activates HIF signaling or produces a defined tissue hypoxic phenotype. Within the proposed Glycohypoxia framework, these pathways represent possible downstream consequences to be investigated only after demonstrating that glycation produces a measurable change in erythrocyte oxygen unloading and tissue oxygen availability. Establishing such a relationship would require physiological measurements that distinguish oxygen supply from cellular oxygen utilization and separate hemoglobin-mediated effects from microvascular and metabolic determinants.
The investigation also highlights the importance of distinguishing the specific chemistry of HbA1c from the broader biochemical environment of chronic hyperglycemia. Increased glycemic exposure can coexist with changes in erythrocyte metabolism, oxidative modifications, acid–base regulation, red-cell age distribution, and vascular function. Any association between HbA1c concentration and altered oxygen unloading could therefore reflect direct effects of the fructosyl-Val1 adduct, correlated metabolic changes, or both. A definitive mechanistic study would require chemically characterized hemoglobin preparations with controlled glycation fractions, ideally including matched native and glycated species evaluated under identical pH, temperature, ionic-strength, and effector conditions. Measurements of oxygen equilibrium, cooperativity, association and dissociation kinetics, and BPG responsiveness could then establish whether the modification alters intrinsic protein function.
Subsequent studies in intact erythrocytes and whole blood would be necessary to determine whether such effects persist within the physiological intracellular environment. Several limitations define the evidential scope of the present work. The principal structural limitation is the absence of an explicitly modeled covalent fructosyl-Val1 adduct in 3B75. The independently deposited structural references are not chemically matched native–glycated pairs, and their differences cannot be attributed exclusively to glycation. The five analyzed β chains are coordinate instances from a single crystallographic deposition rather than independent biological replicates. The contact-network analysis is static, restricted to individual β chains, and dependent on a single geometric cutoff; it therefore cannot establish dynamic or energetic allosteric communication. The nearest-heme assignment also requires independent biological verification. The thermodynamic conversions rely on published affinity ratios and an assumed temperature, without propagating uncertainty from the original measurements. The QM/MM benchmarks describe nonglycated hemoglobin and do not provide glycation-specific electronic energies. Finally, the isolated molecular-fragment calculations use classical molecular mechanics rather than quantum chemistry or full-tetramer simulation. These limitations prevent causal attribution but also identify the precise computational and experimental steps needed to advance the analysis.
The next stage should prioritize chemically explicit, matched-state models of HbA0 and HbA1c, incorporating validated fructosyl-Val1 attachment, appropriate protonation and stereochemical states, and consistent heme and oxygen descriptions. Explicit-solvent molecular dynamics could then assess the effects of glycation on central-cavity hydration, BPG-binding geometry, conformational populations, intersubunit contacts, and the persistence of candidate residue-network connections. Free-energy calculations could quantify changes in effector association or conformational-state stability, while matched QM/MM or density-functional calculations could evaluate glycation-associated differences in heme–oxygen electronic interactions under controlled structural conditions. Such analyses should include sensitivity testing for contact definitions, conformational sampling, and electronic-structure methodology. Their results would need to be interpreted alongside direct experimental measurements rather than used as substitutes for physiological evidence. Overall, the present findings support a mechanistically coherent but not yet causally resolved relationship between β-chain N-terminal glycation and hemoglobin oxygen-binding regulation. The approximately 20 Å separation between β-Val1 and heme iron, the geometric contact-network connections, and the published alterations in oxygen affinity, ligand dissociation, 2,3-BPG binding, and proton-linked regulation collectively favor investigation of allosteric and effector-mediated pathways.
At the same time, the sensitivity of heme–oxygen electronic interactions to the surrounding protein environment provides a rationale for testing, rather than assuming, a direct electronic contribution. The principal contribution of this study is to integrate these lines of evidence into a quantitatively constrained framework while explicitly identifying the limits of the available structural models and energetic calculations. In relation to Glycohypoxia, β-Val1 glycation emerges as a plausible molecular candidate for altered oxygen-unloading regulation, but its contribution to whole-blood oxygen transport, tissue hypoxia, and diabetic complications remains an open question requiring multiscale validation.
5. Conclusions
This study integrates crystallographic reanalysis, residue-contact networks, published QM/MM benchmarks, and affinity-derived thermodynamics to investigate the molecular implications of hemoglobin β-Val1 glycation. Although the analyzed glycation-associated structure lacked an explicitly modeled fructosyl-Val1 adduct, β-Val1 was located approximately 20 Å from heme iron and connected geometrically to heme-adjacent residues through short contact-network paths. Published oxygen- and 2,3-BPG-affinity changes corresponded to distinct thermodynamic equivalents, supporting investigation of electrostatic, effector-mediated, and conformational mechanisms without establishing their causal contributions. Nonglycated QM/MM benchmarks demonstrated conformational sensitivity of heme–oxygen electronic interactions but did not establish glycation-specific quantum effects. Collectively, these findings identify plausible molecular pathways linking N-terminal glycation to oxygen-binding regulation while preserving the distinction between structural connectivity and functional causality. Chemically explicit HbA1c modeling, matched-state electronic calculations, and physiological oxygen-unloading measurements are required to determine whether these mechanisms contribute to Glycohypoxia.
Funding
The authors received no financial support for the research and publication of this article.
Conflicts of Interest
The authors declare that there are no conflicts of interest.
Data Availability Statement
The datasets analyzed for this study are available from the corresponding author upon reasonable request.
Author Contributions
Maher Monir Akl: Conception and design, data collection, analysis, and interpretation; writing and critical revision. Amr Ahmed: Supervision. No statistical expertise, funding, administrative, technical, or material support was received.
Declaration of AI and AI-assisted Technologies in the Writing Process
The authors declare that no generative artificial intelligence (AI) or AI-assisted technologies were used in the preparation of this manuscript.
References
- Ahmed, M. H.; Ghatge, M. S.; Safo, M. K. Hemoglobin: Structure, Function and Allostery. Sub-Cell. Biochem. 2020, 94, 345–382. [Google Scholar] [CrossRef] [PubMed]
- Friedman, J. M.; Scott, T. W.; Stepnoski, R. A.; Ikeda-Saito, M.; Yonetani, T. The iron-proximal histidine linkage and protein control of oxygen binding in hemoglobin. A transient Raman study. J. Biol. Chem. 1983, 258(17), 10564–10572. [Google Scholar] [CrossRef]
- Makinen, M. W.; Churg, A. K.; Glick, H. A. Fe-O2 bonding and oxyheme structure in myoglobin. Proc. Natl. Acad. Sci. USA 1978, 75(5), 2291–2295. [Google Scholar] [CrossRef] [PubMed]
- Park, S. Y.; Yokoyama, T.; Shibayama, N.; Shiro, Y.; Tame, J. R. 1.25 A resolution crystal structures of human haemoglobin in the oxy, deoxy and carbonmonoxy forms. J. Mol. Biol. 2006, 360(3), 690–701. [Google Scholar] [CrossRef] [PubMed]
- Burman, M. D.; Bag, S.; Ghosal, S.; Bhowmik, S. Glycation of Proteins and Its End Products: From Initiation to Natural Product-Based Therapeutic Preventions. ACS Pharmacol. Transl. Sci. 2025, 8(3), 636–653. [Google Scholar] [CrossRef] [PubMed]
- Chen, Z.; Shao, L.; Jiang, M.; Ba, X.; Ma, B.; Zhou, T. Interpretation of HbA1c lies at the intersection of analytical methodology, clinical biochemistry and hematology (Review). Exp. Ther. Med. 2022, 24(6), 707. [Google Scholar] [CrossRef] [PubMed]
- Nadolny, C.; Kempf, I.; Zundel, G. Specific interactions of the allosteric effector 2,3-bisphosphoglycerate with human hemoglobin--a difference FTIR study. Biol. Chem. Hoppe-Seyler 1993, 374(6), 403–407. [Google Scholar] [CrossRef] [PubMed]
- Bunn, H. F. Post-translational modifications of hemoglobin. Haematologia 1984, 17(2), 179–186. [Google Scholar] [PubMed]
- Coletta, M.; Amiconi, G.; Bellelli, A.; Bertollini, A.; Carsky, J.; Castagnola, M.; Condò, S.; Brunori, M. Alteration of T-state binding properties of naturally glycated hemoglobin, HbA1c. J. Mol. Biol. 1988, 203(1), 233–239. [Google Scholar] [CrossRef] [PubMed]
- De Rosa, M. C.; Sanna, M. T.; Messana, I.; Castagnola, M.; Galtieri, A.; Tellone, E.; Scatena, R.; Botta, B.; Botta, M.; Giardina, B. Glycated human hemoglobin (HbA1c): functional characteristics and molecular modeling studies. Biophys. Chem. 1998, 72(3), 323–335. [Google Scholar] [CrossRef] [PubMed]
- Mozzarelli, A.; Rivetti, C.; Rossi, G. L.; Eaton, W. A.; Henry, E. R. Allosteric effectors do not alter the oxygen affinity of hemoglobin crystals. Protein Sci. A Publ. Protein Soc. 1997, 6(2), 484–489. [Google Scholar] [CrossRef] [PubMed]
- Bringas, M.; Petruk, A. A.; Estrin, D. A.; Capece, L.; Martí, M. A. Tertiary and quaternary structural basis of oxygen affinity in human hemoglobin as revealed by multiscale simulations. Sci. Rep. 2017, 7(1), 10926. [Google Scholar] [CrossRef] [PubMed]
- Saraswathi, N. T.; Syakhovich, V. E.; Bokut, S. B.; Moras, D.; Ruff, M. Crystal structure of glycated human haemoglobin [Data set]; Protein Data Bank, 2008. [Google Scholar] [CrossRef]
- Park, S.-Y.; Yokoyama, T.; Shibayama, N.; Shiro, Y.; Tame, J. R. H. 1.25 Å resolution crystal structure of human hemoglobin in the oxy form [Data set]. In Protein Data Bank; 2006. [Google Scholar] [CrossRef]
- Park, S.-Y.; Yokoyama, T.; Shibayama, N.; Shiro, Y.; Tame, J. R. H. 1.25 Å resolution crystal structure of human hemoglobin in the deoxy form [Data set]. In Protein Data Bank; 2006. [Google Scholar] [CrossRef]
- Yonetani, T.; Laberge, M. Protein dynamics explain the allosteric behaviors of hemoglobin. Biochim. Et. Biophys. Acta 2008, 1784(9), 1146–1158. [Google Scholar] [CrossRef] [PubMed]
- Mihailescu, M. R.; Russu, I. M. A signature of the. Proc. Natl. Acad. Sci. USA 2001, 98(7), 3773–3777. [Google Scholar] [CrossRef] [PubMed]
- Shikama, K. Nature of the FeO2 bonding in myoglobin and hemoglobin: A new molecular paradigm. Prog. Biophys. Mol. Biol. 2006, 91(1-2), 83–162. [Google Scholar] [CrossRef] [PubMed]
- Braun, A.; Titus, C. J.; Gee, L. B.; Baker, M. L.; Waters, M. D. J.; Yan, J. J.; Lee, S. J.; Nordlund, D.; Doriese, W. B.; O'Neil, G. C.; Schmidt, D. R.; Swetz, D. S.; Ullom, J. N.; Irwin, K. D.; Solomon, E. I. Description of the Electronic Structure of Oxyhemoglobin Using Fe L-Edge X-ray Absorption Spectroscopy. J. Am. Chem. Soc. 2025, 147(25), 21313–21318. [Google Scholar] [CrossRef] [PubMed]
- Hess, W. Die Sauerstoffaffinität des Hämoglobins--ihre Bedeutung unter physiologischen und pathologischen Bedingungen [Affinity of oxygen for hemoglobin--its significance under physiological and pathological conditions]. Der Anaesthesist 1987, 36(9), 455–467. [Google Scholar] [PubMed]
- Harris, D. R.; Palmer, A. F. Modern cross-linking strategies for synthesizing acellular hemoglobin-based oxygen carriers. Biotechnol. Prog. 2008, 24(6), 1215–1225. [Google Scholar] [CrossRef] [PubMed]
- Akl, M. M.; Ahmed, A. Glycohypoxia: a hypothesis linking chronic hyperglycemia to functional hypoxia and diabetic complications in type 2 diabetes. Med. Gas. Res. 2026, 16(4), 454–461. [Google Scholar] [CrossRef] [PubMed]
- Akl, M.; Ahmed, A. Quantitative and preliminary clinical assessment of glycohypoxia as an oxygen-unloading defect linking chronic hyperglycemia to low-grade tissue hypoxia in type 2 diabetes: a targeted translational meta-regression with exploratory blood-sample validation. Front. Clin. Diabetes Healthc. 2026, 7, 1897413. [Google Scholar] [CrossRef] [PubMed]
- Bouhamida, E.; Morciano, G.; Perrone, M.; Kahsay, A. E.; Della Sala, M.; Wieckowski, M. R.; Fiorica, F.; Pinton, P.; Giorgi, C.; Patergnani, S. The Interplay of Hypoxia Signaling on Mitochondrial Dysfunction and Inflammation in Cardiovascular Diseases and Cancer: From Molecular Mechanisms to Therapeutic Approaches. Biology 2022, 11(2), 300. [Google Scholar] [CrossRef] [PubMed]
Figure 1.
Chain-Resolved Cα Backbone RMSD Comparisons of PDB 3B75 with Oxygenated and Deoxygenated Hemoglobin Reference Structures. Cα root-mean-square deviations (RMSDs) for five β chains (B, D, F, H, and T) from PDB 3B75 independently superimposed onto β chain B of oxygenated hemoglobin (PDB 2DN1) and β chains B and D of deoxygenated hemoglobin (PDB 2DN2). The five oxygenated-reference comparisons included 145 corresponding Cα atoms (residues 2–146), with RMSDs of 0.3831–0.6704 Å. The ten deoxygenated-reference comparisons included 146 corresponding Cα atoms (residues 1–146), with RMSDs of 0.6865–0.9507 Å. These values describe structural differences among independently determined crystallographic models and do not establish glycation-induced conformational changes. The two reference groups use different aligned residue sets.
Figure 1.
Chain-Resolved Cα Backbone RMSD Comparisons of PDB 3B75 with Oxygenated and Deoxygenated Hemoglobin Reference Structures. Cα root-mean-square deviations (RMSDs) for five β chains (B, D, F, H, and T) from PDB 3B75 independently superimposed onto β chain B of oxygenated hemoglobin (PDB 2DN1) and β chains B and D of deoxygenated hemoglobin (PDB 2DN2). The five oxygenated-reference comparisons included 145 corresponding Cα atoms (residues 2–146), with RMSDs of 0.3831–0.6704 Å. The ten deoxygenated-reference comparisons included 146 corresponding Cα atoms (residues 1–146), with RMSDs of 0.6865–0.9507 Å. These values describe structural differences among independently determined crystallographic models and do not establish glycation-induced conformational changes. The two reference groups use different aligned residue sets.
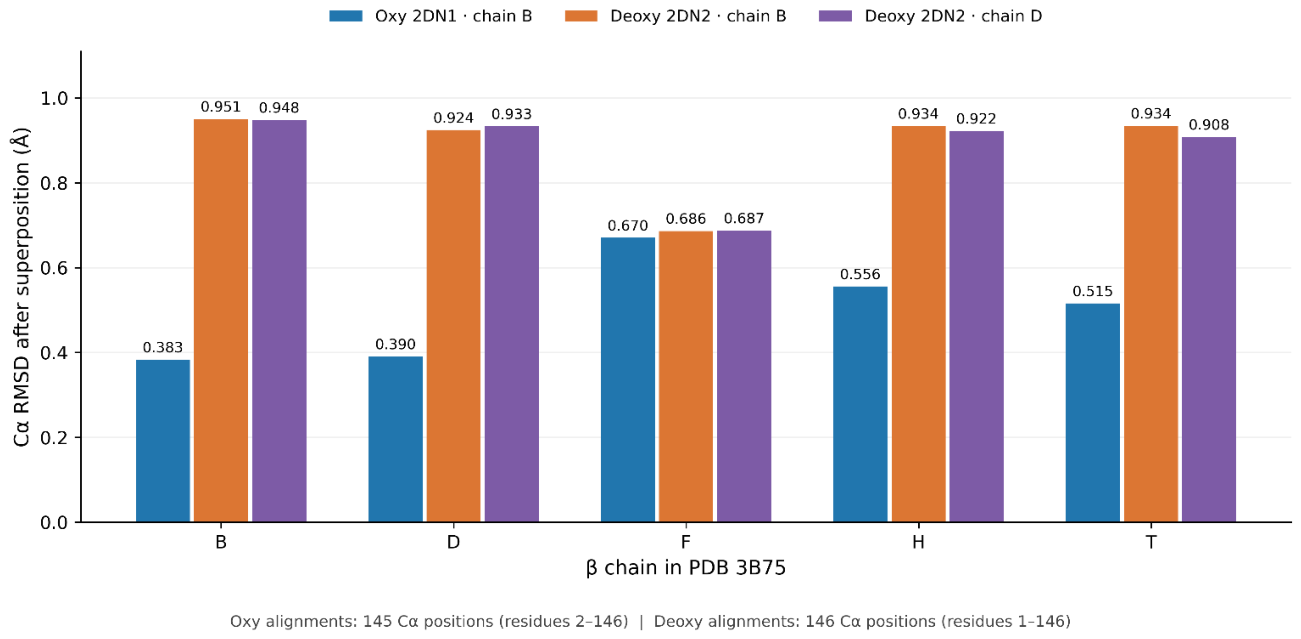
Figure 2.
Residue-Resolved Cα Backbone Displacement Profiles of PDB 3B75 β Chains Relative to Oxygenated Hemoglobin. Residue-specific Cα positional displacements for five β chains (B, D, F, H, and T) from PDB 3B75 following independent structural superposition onto β chain B of oxygenated hemoglobin (PDB 2DN1). Each alignment included 145 corresponding Cα atoms spanning residues 2–146. Median displacements ranged from 0.2755 to 0.4522 Å, and 95th-percentile displacements ranged from 0.7222 to 1.4184 Å. The profiles reveal localized positional differences within otherwise relatively conserved β-chain backbones. These displacements represent differences between crystallographic coordinate models rather than experimentally measured molecular flexibility or glycation-induced conformational dynamics.
Figure 2.
Residue-Resolved Cα Backbone Displacement Profiles of PDB 3B75 β Chains Relative to Oxygenated Hemoglobin. Residue-specific Cα positional displacements for five β chains (B, D, F, H, and T) from PDB 3B75 following independent structural superposition onto β chain B of oxygenated hemoglobin (PDB 2DN1). Each alignment included 145 corresponding Cα atoms spanning residues 2–146. Median displacements ranged from 0.2755 to 0.4522 Å, and 95th-percentile displacements ranged from 0.7222 to 1.4184 Å. The profiles reveal localized positional differences within otherwise relatively conserved β-chain backbones. These displacements represent differences between crystallographic coordinate models rather than experimentally measured molecular flexibility or glycation-induced conformational dynamics.
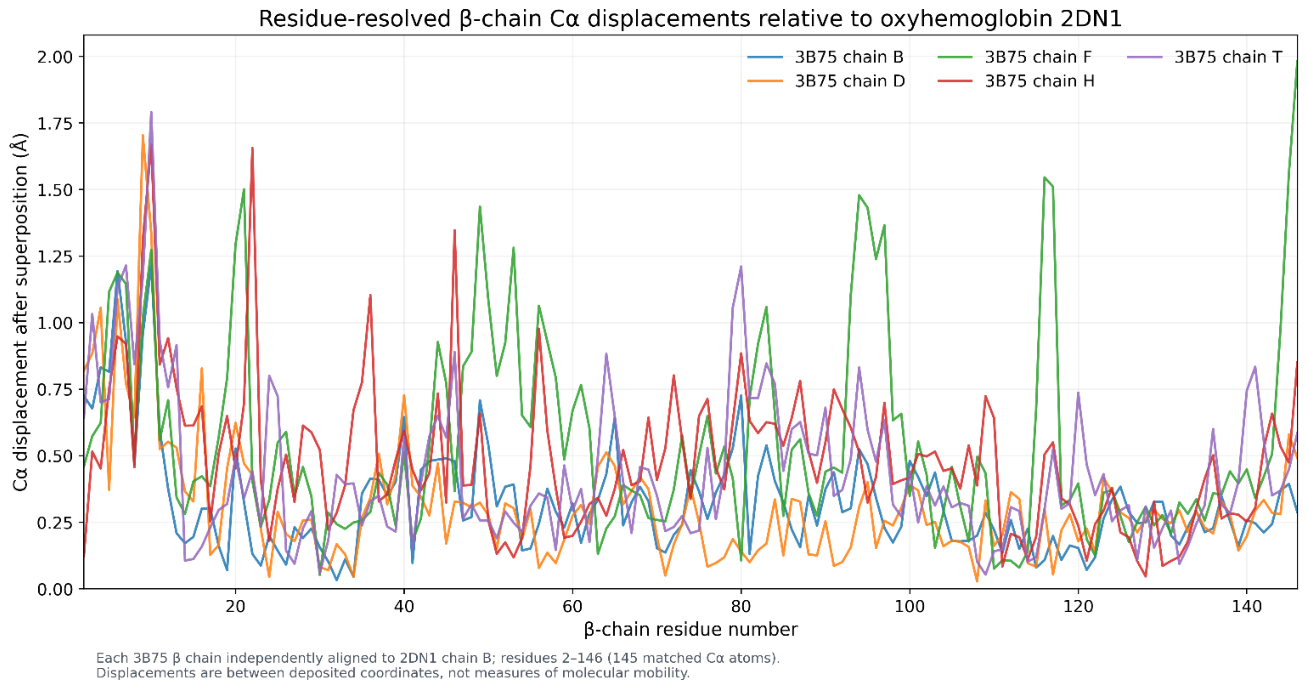
Figure 3.
Spatial Separation Between the β-Val1 N-Terminal Nitrogen and the Nearest Heme Iron in PDB 3B75. Chain-resolved geometric distances between the β-Val1 N-terminal nitrogen and the nearest heme iron for five β chains (B, D, F, H, and T) of PDB 3B75. The corresponding N–Fe distances were 19.899, 20.119, 19.642, 19.425, and 19.849 Å, respectively. The figure combines illustrative molecular representations with a quantitative comparison of the measured distances. Heme assignment was based on geometric proximity. The molecular illustrations are schematic rather than coordinate-validated renderings of PDB 3B75; therefore, the depicted atomic positions and distance lines should not be interpreted as independently verified crystallographic geometry. The approximately 20 Å separation places the N-terminal site outside the immediate heme coordination sphere but does not establish or exclude long-range allosteric or electronic effects.
Figure 3.
Spatial Separation Between the β-Val1 N-Terminal Nitrogen and the Nearest Heme Iron in PDB 3B75. Chain-resolved geometric distances between the β-Val1 N-terminal nitrogen and the nearest heme iron for five β chains (B, D, F, H, and T) of PDB 3B75. The corresponding N–Fe distances were 19.899, 20.119, 19.642, 19.425, and 19.849 Å, respectively. The figure combines illustrative molecular representations with a quantitative comparison of the measured distances. Heme assignment was based on geometric proximity. The molecular illustrations are schematic rather than coordinate-validated renderings of PDB 3B75; therefore, the depicted atomic positions and distance lines should not be interpreted as independently verified crystallographic geometry. The approximately 20 Å separation places the N-terminal site outside the immediate heme coordination sphere but does not establish or exclude long-range allosteric or electronic effects.
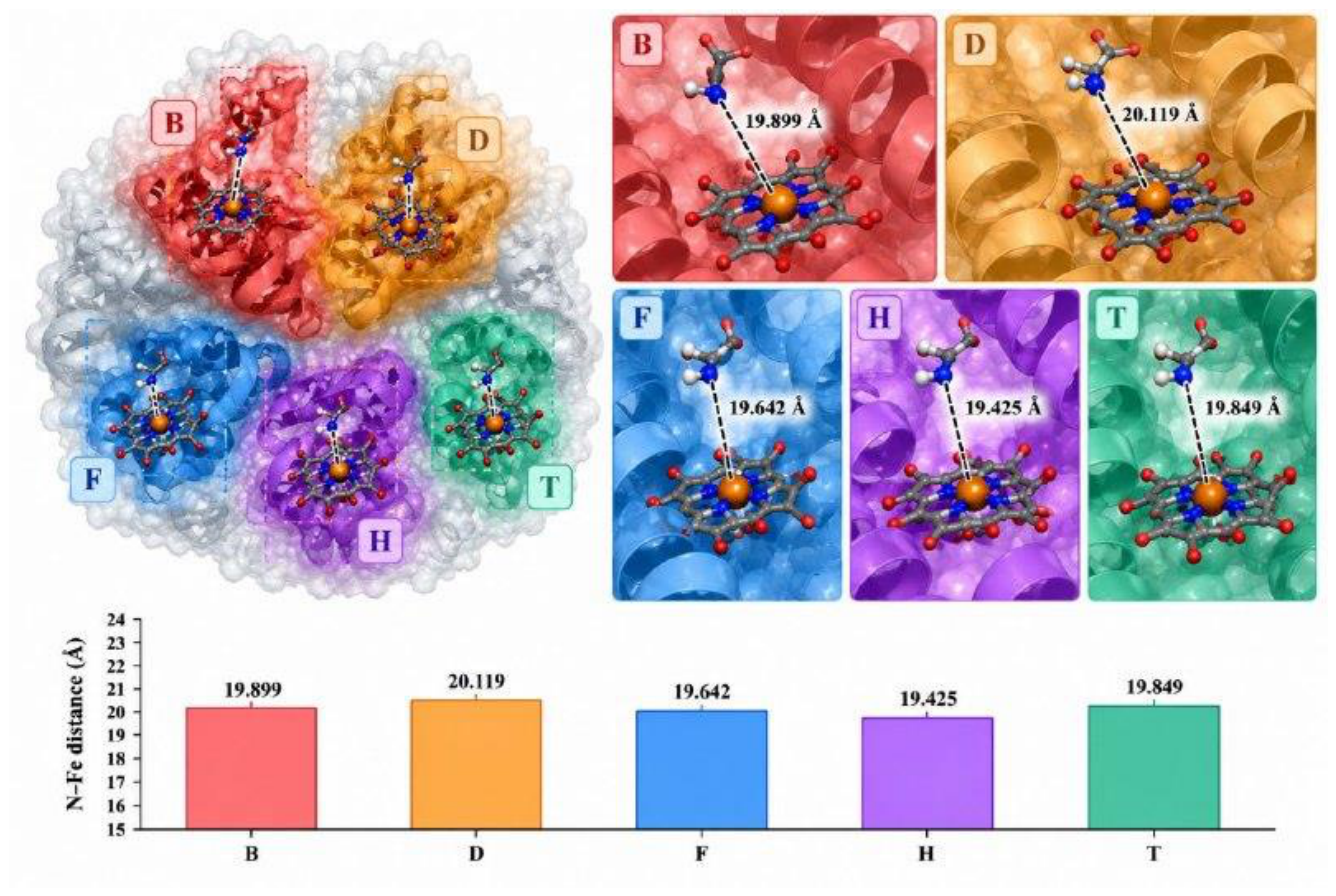
Figure 4.
Static Residue-Contact Networks and Shortest Geometric Paths from β-Val1 to Heme-Adjacent Residues in PDB 3B75. Schematic representation of shortest geometric paths identified within residue-contact networks constructed for five β chains (B, D, F, H, and T) of PDB 3B75 using a 4.5 Å minimum heavy-atom distance cutoff. Each network contained 653–682 unique residue-contact edges and 19–22 heme-adjacent residues. Breadth-first search identified a two-edge shortest path from β-Val1 to a heme-adjacent residue in every chain. The path Val1–Leu81–Phe85 was identified in chains B, F, H, and T, whereas Val1–Val133–Val137 was identified in chain D. These pathways represent static geometric connectivity rather than experimentally validated allosteric signal-transmission routes. No contact persistence, cutoff sensitivity, directional coupling, or glycation-induced network changes were assessed. Molecular illustrations and network layouts are schematic and should not be interpreted as coordinate-validated structural renderings.
Figure 4.
Static Residue-Contact Networks and Shortest Geometric Paths from β-Val1 to Heme-Adjacent Residues in PDB 3B75. Schematic representation of shortest geometric paths identified within residue-contact networks constructed for five β chains (B, D, F, H, and T) of PDB 3B75 using a 4.5 Å minimum heavy-atom distance cutoff. Each network contained 653–682 unique residue-contact edges and 19–22 heme-adjacent residues. Breadth-first search identified a two-edge shortest path from β-Val1 to a heme-adjacent residue in every chain. The path Val1–Leu81–Phe85 was identified in chains B, F, H, and T, whereas Val1–Val133–Val137 was identified in chain D. These pathways represent static geometric connectivity rather than experimentally validated allosteric signal-transmission routes. No contact persistence, cutoff sensitivity, directional coupling, or glycation-induced network changes were assessed. Molecular illustrations and network layouts are schematic and should not be interpreted as coordinate-validated structural renderings.
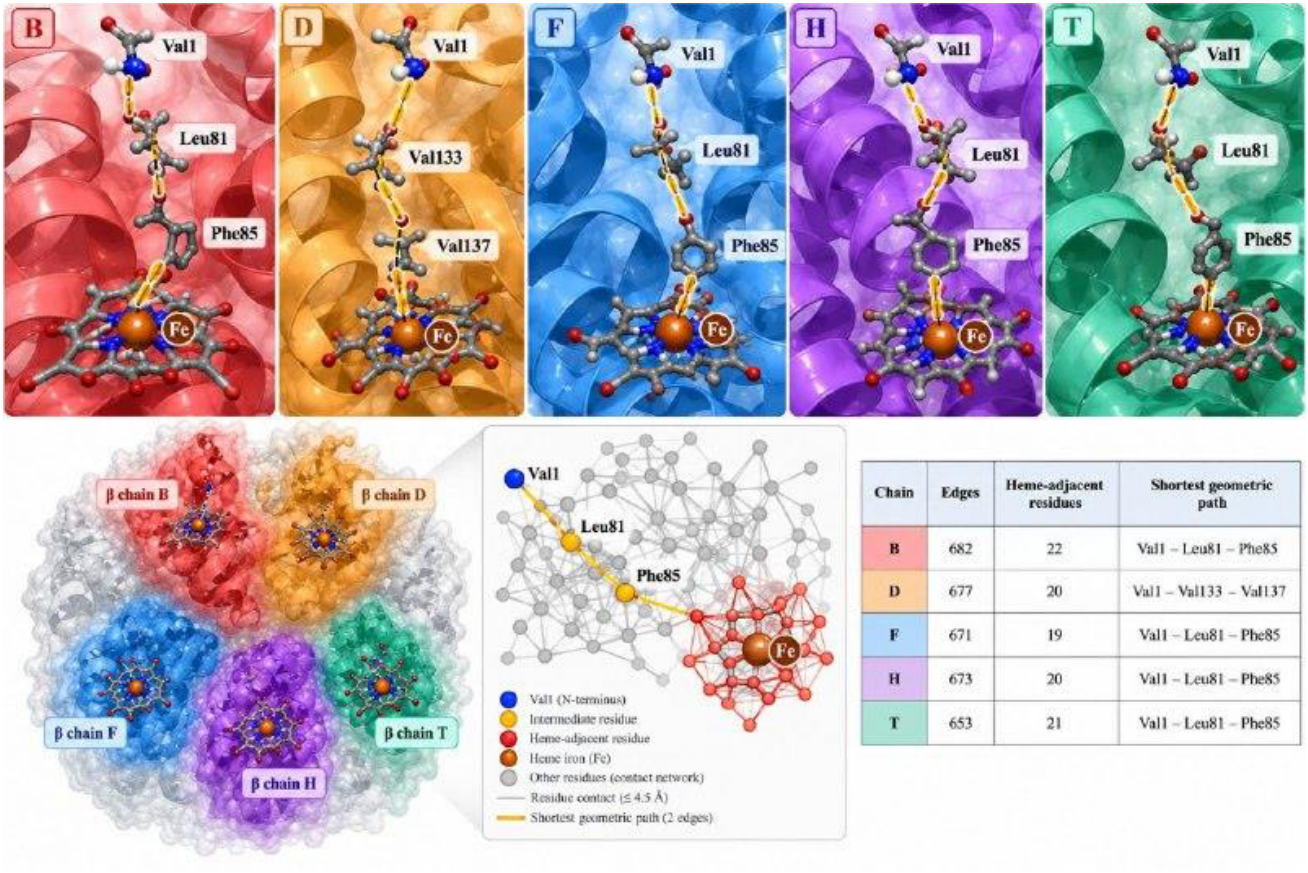
Figure 5.
Published QM/MM Oxygen-Binding Electronic-Energy Benchmarks for Nonglycated Hemoglobin. (A) Oxygen-binding electronic energies reported by Bringas et al. [12] for α and β subunits in T-like and R-like environments. The corresponding energies were −23.1 and −30.2 kcal/mol for the α subunit and −21.7 and −30.7 kcal/mol for the β subunit, yielding calculated R-minus-T contrasts of −7.1 and −9.0 kcal/mol, respectively. (B) Published Fe–O distances and O₂ population charges for the same four computational environments. These literature-derived QM/MM electronic energies are not experimental oxygen-binding free energies and do not represent new calculations or glycation-specific effects.
Figure 5.
Published QM/MM Oxygen-Binding Electronic-Energy Benchmarks for Nonglycated Hemoglobin. (A) Oxygen-binding electronic energies reported by Bringas et al. [12] for α and β subunits in T-like and R-like environments. The corresponding energies were −23.1 and −30.2 kcal/mol for the α subunit and −21.7 and −30.7 kcal/mol for the β subunit, yielding calculated R-minus-T contrasts of −7.1 and −9.0 kcal/mol, respectively. (B) Published Fe–O distances and O₂ population charges for the same four computational environments. These literature-derived QM/MM electronic energies are not experimental oxygen-binding free energies and do not represent new calculations or glycation-specific effects.
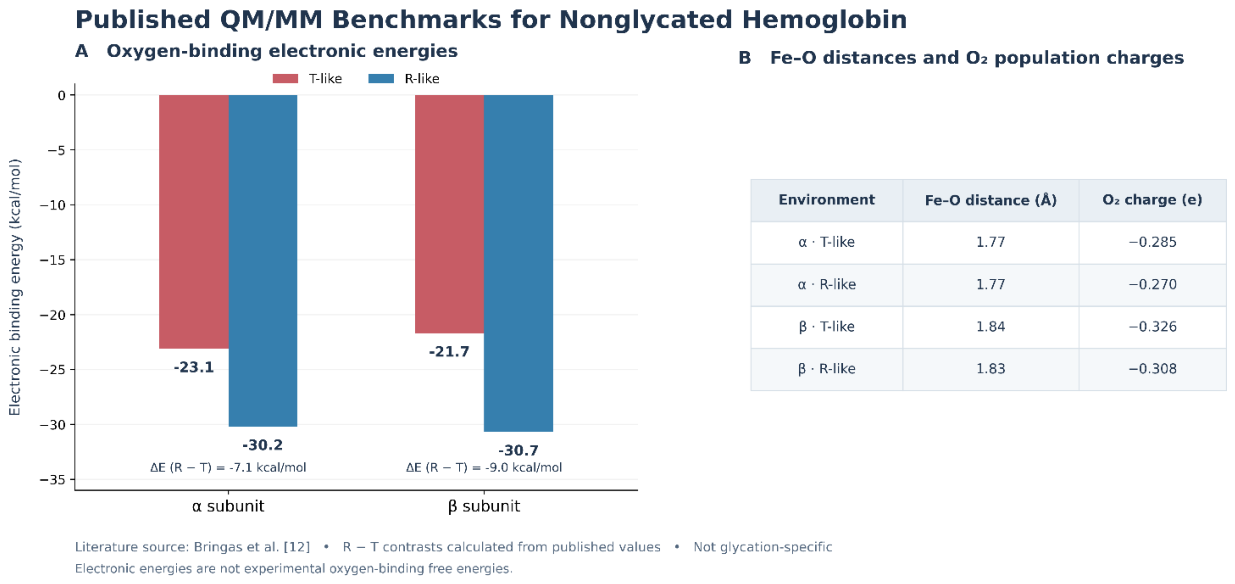
Figure 6.
Illustrative Standard Binding Free-Energy Equivalents Derived from Published Hemoglobin Oxygen- and 2,3-BPG-Affinity Ratios. Figure legend: Thermodynamic transformations of published affinity ratios using the association-affinity convention, ΔΔG° = −RT ln(q), at an explicitly assumed temperature of 310.15 K (R = 1.987 × 10⁻³ kcal mol⁻¹ K⁻¹). (A) An approximately tenfold increase in T-state oxygen association affinity reported by Coletta et al. [9] corresponds to an illustrative standard binding free-energy change of −1.419 kcal/mol. (B) The negative value indicates more favorable oxygen association under the specified convention. (C) Published reductions in 2,3-bisphosphoglycerate (2,3-BPG) association affinity of approximately 2.6-fold in the T state and 1.7-fold in the R state, reported by De Rosa et al. [10], correspond to positive standard binding free-energy changes of approximately +0.589 and +0.327 kcal/mol, respectively, when expressed as association-affinity ratios of 1/2.6 and 1/1.7. These values are secondary mathematical transformations of published affinity ratios, not newly measured thermodynamic quantities. The oxygen- and BPG-binding transformations refer to distinct binding processes and must not be summed or interpreted as direct estimates of whole-blood P₅₀, oxygen unloading, or glycation-specific electronic binding energies.
Figure 6.
Illustrative Standard Binding Free-Energy Equivalents Derived from Published Hemoglobin Oxygen- and 2,3-BPG-Affinity Ratios. Figure legend: Thermodynamic transformations of published affinity ratios using the association-affinity convention, ΔΔG° = −RT ln(q), at an explicitly assumed temperature of 310.15 K (R = 1.987 × 10⁻³ kcal mol⁻¹ K⁻¹). (A) An approximately tenfold increase in T-state oxygen association affinity reported by Coletta et al. [9] corresponds to an illustrative standard binding free-energy change of −1.419 kcal/mol. (B) The negative value indicates more favorable oxygen association under the specified convention. (C) Published reductions in 2,3-bisphosphoglycerate (2,3-BPG) association affinity of approximately 2.6-fold in the T state and 1.7-fold in the R state, reported by De Rosa et al. [10], correspond to positive standard binding free-energy changes of approximately +0.589 and +0.327 kcal/mol, respectively, when expressed as association-affinity ratios of 1/2.6 and 1/1.7. These values are secondary mathematical transformations of published affinity ratios, not newly measured thermodynamic quantities. The oxygen- and BPG-binding transformations refer to distinct binding processes and must not be summed or interpreted as direct estimates of whole-blood P₅₀, oxygen unloading, or glycation-specific electronic binding energies.
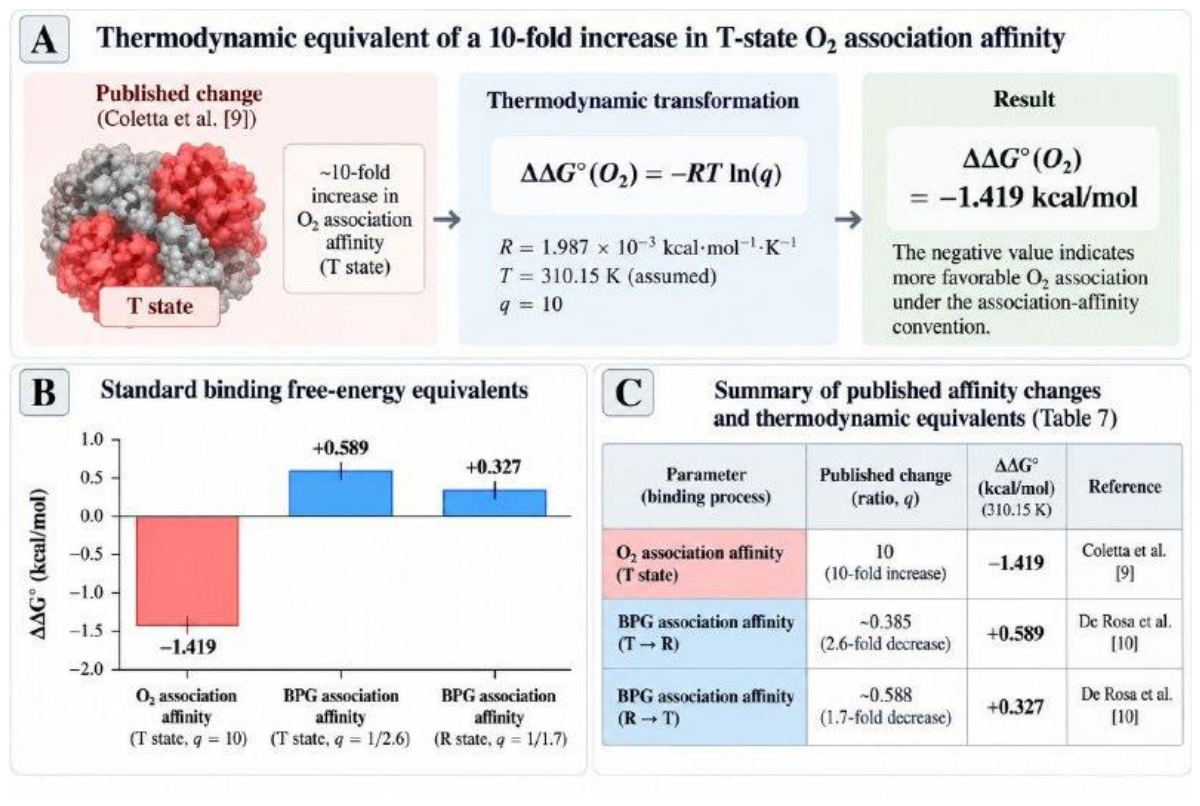
Figure 7.
Exploratory Fragment Preparation and MMFF94 Conformer Optimization of Valine and Fructosyl-Valine. (A) Comparison of conformer generation and optimization outcomes for isolated valine and open-chain fructosyl-valine models prepared using RDKit. Thirty three-dimensional conformers were generated for each species, and all 30 converged during MMFF94 optimization. (B) Comparison of molecular masses (left vertical axis) and the lowest MMFF94 energies identified among the optimized conformers (right vertical axis): 117.148 g/mol and 25.4047 kcal/mol for valine, and 279.289 g/mol and 124.9188 kcal/mol for fructosyl-valine, respectively. These energies represent separate force-field evaluations of chemically distinct isolated fragments and cannot be subtracted to estimate a glycation reaction energy. No intact glycated hemoglobin simulation or glycation-specific oxygen-binding energy calculation was performed.
Figure 7.
Exploratory Fragment Preparation and MMFF94 Conformer Optimization of Valine and Fructosyl-Valine. (A) Comparison of conformer generation and optimization outcomes for isolated valine and open-chain fructosyl-valine models prepared using RDKit. Thirty three-dimensional conformers were generated for each species, and all 30 converged during MMFF94 optimization. (B) Comparison of molecular masses (left vertical axis) and the lowest MMFF94 energies identified among the optimized conformers (right vertical axis): 117.148 g/mol and 25.4047 kcal/mol for valine, and 279.289 g/mol and 124.9188 kcal/mol for fructosyl-valine, respectively. These energies represent separate force-field evaluations of chemically distinct isolated fragments and cannot be subtracted to estimate a glycation reaction energy. No intact glycated hemoglobin simulation or glycation-specific oxygen-binding energy calculation was performed.
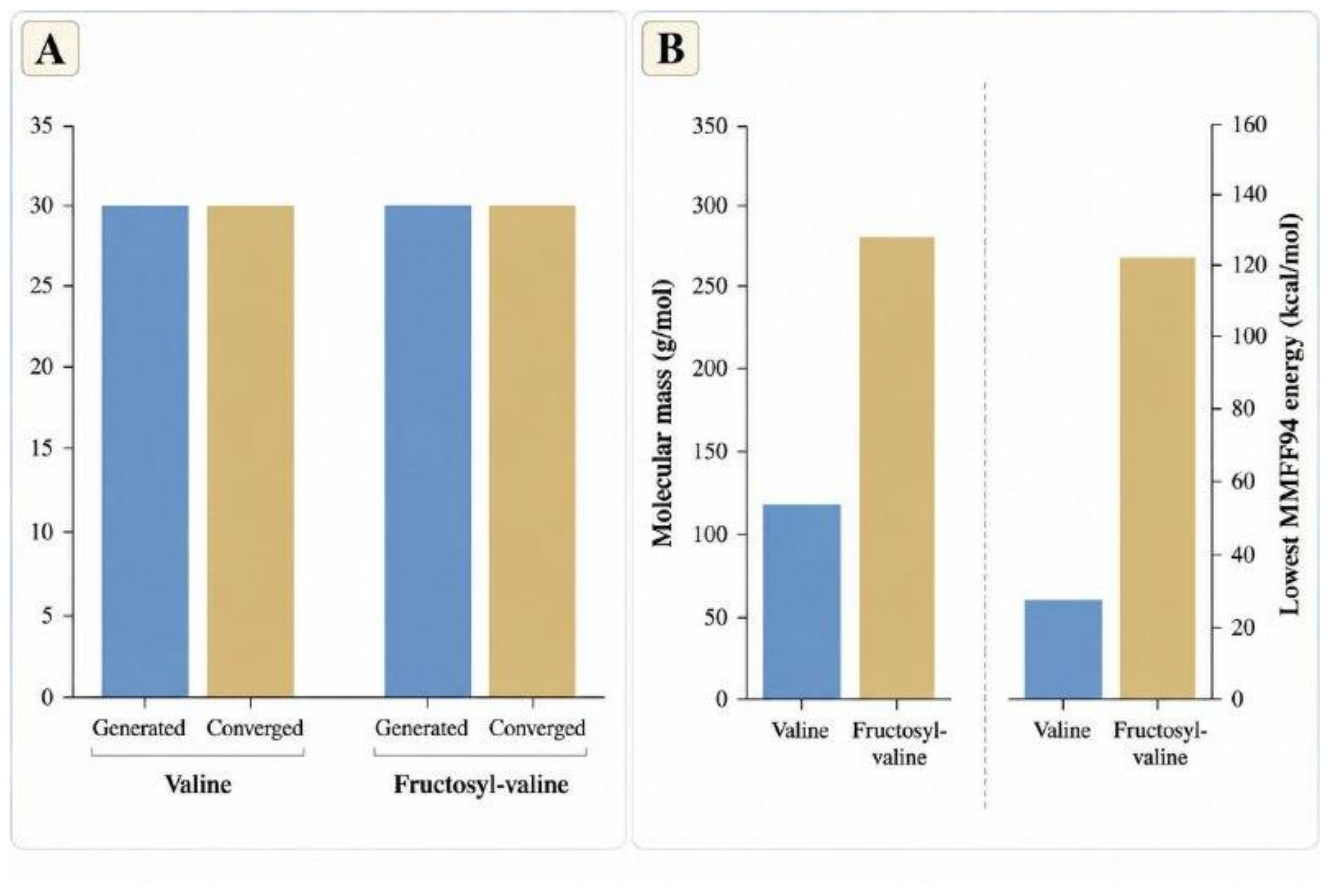

Table 1.
Structural datasets and chemical representation used in the analysis.
| PDB | Analytical role | Representation |
|---|---|---|
| 3B75 [13] | N-terminal geometry; alignment; contact networks | No explicitly modeled covalent β-Val1 fructosyl adduct |
| 2DN1 [14] | Oxygenated reference for Cα alignment | Nonglycated structural reference |
| 2DN2 [15] | Deoxygenated reference for Cα alignment | Nonglycated structural reference |
Table 2.
β-chain structural superposition against oxygenated 2DN1 [14].
Table 2.
β-chain structural superposition against oxygenated 2DN1 [14].
| Chain | Cα atoms | RMSD (Å) | Median (Å) | 95th percentile (Å) |
|---|---|---|---|---|
| B | 145 | 0.3831 | 0.288 | 0.7222 |
| D | 145 | 0.3904 | 0.2755 | 0.7622 |
| F | 145 | 0.6704 | 0.4334 | 1.4184 |
| H | 145 | 0.5558 | 0.4522 | 0.9374 |
| T | 145 | 0.5154 | 0.3502 | 0.9301 |
Table 3.
β-chain RMSDs against deoxygenated 2DN2 [15].
Table 3.
β-chain RMSDs against deoxygenated 2DN2 [15].
| 3B75 chain | 2DN2 chain B (Å) | 2DN2 chain D (Å) |
|---|---|---|
| B | 0.9507 | 0.9478 |
| D | 0.9243 | 0.9334 |
| F | 0.6865 | 0.6873 |
| H | 0.9339 | 0.9222 |
| T | 0.9342 | 0.908 |
Table 4.
N-terminal–heme distances and static contact-network descriptors.
| Chain | N–Fe (Å) | Edges | Heme-adjacent | Shortest path |
|---|---|---|---|---|
| B | 19.899 | 682 | 22 | 1–81–85 |
| D | 20.119 | 677 | 20 | 1–133–137 |
| F | 19.642 | 671 | 19 | 1–81–85 |
| H | 19.425 | 673 | 20 | 1–81–85 |
| T | 19.849 | 653 | 21 | 1–81–85 |
Table 5.
Published nonglycated hemoglobin QM/MM energies and derived contrasts [12].
Table 5.
Published nonglycated hemoglobin QM/MM energies and derived contrasts [12].
| Subunit | T (kcal/mol) | R (kcal/mol) | R−T (kcal/mol) |
|---|---|---|---|
| α | -23.1 | -30.2 | -7.1 |
| β | -21.7 | -30.7 | -9.0 |
Table 6.
Published Fe–O distances and O₂ population charges [12].
Table 6.
Published Fe–O distances and O₂ population charges [12].
| Environment | Fe–O (Å) | O₂ charge (e) |
|---|---|---|
| α T | 1.77 | -0.285 |
| α R | 1.77 | -0.27 |
| β T | 1.84 | -0.326 |
| β R | 1.83 | -0.308 |
| Binding process | Published relationship | ΔΔG° (kcal/mol) |
|---|---|---|
| T-state O₂ | 10-fold greater affinity | −1.419 |
| T-state BPG | 2.6-fold lower affinity | +0.589 |
| R-state BPG | 1.7-fold lower affinity | +0.327 |
| BPG penalty difference (T−R) | Derived contrast | +0.262 |
Table 8.
Exploratory fragment preparation and optimization.
| Parameter | Valine | Fructosyl-valine |
|---|---|---|
| Molecular mass (g/mol) | 117.148 | 279.289 |
| Generated conformers | 30 | 30 |
| Converged conformers | 30 | 30 |
| Lowest MMFF94 energy (kcal/mol) | 25.4047 | 124.9188 |
Disclaimer/Publisher’s Note: The statements, opinions and data contained in all publications are solely those of the individual author(s) and contributor(s) and not of MDPI and/or the editor(s). MDPI and/or the editor(s) disclaim responsibility for any injury to people or property resulting from any ideas, methods, instructions or products referred to in the content. |
© 2026 by the authors. Licensee MDPI, Basel, Switzerland. This article is an open access article distributed under the terms and conditions of the Creative Commons Attribution (CC BY) license (http://creativecommons.org/licenses/by/4.0/).
Copyright: This open access article is published under a Creative Commons CC BY 4.0 license, which permit the free download, distribution, and reuse, provided that the author and preprint are cited in any reuse.