

Submitted:
14 October 2026
Posted:
16 October 2026
You are already at the latest version
Abstract
Whole-genome sequencing (WGS) enables genomic prediction of antimicrobial resistance (AMR) by linking bacterial genetic features to resistance phenotypes. Although genomic prediction can complement standard antimicrobial susceptibility testing, its performance depends on how genomic information is represented and how models are evaluated. Resistance-associated genes and genomic variants help with accurate prediction. Prediction performance can change due to several factors, including genomic representation, genetic background, population structure, sampling, and validation strategy. These limitations raise the question of whether gene expression provides predictive information beyond that recoverable from genomic sequence. This review explores the genome-to-phenotype antimicrobial resistance prediction issue through three primary aspects. The review examines three primary aspects: genomic representation (how genetic information is structured), population generalisation (how findings apply across groups), and biological state. There are diverse ways of encoding the same sequence information that can change predictions. Determinant-based, pangenome-wide, biologically constrained, and interaction-aware methods show this clearly. Lineage-held-out and external validation further show that within-population performance does not establish transferability. These findings indicate that poor prediction does not, by itself, establish that genomic information is insufficient. Gene expression provides a more direct test of this distinction. In Pseudomonas aeruginosa, transcriptomic profiles can predict AMR. Genomic sequences also help predict transcriptional changes. These observations do not establish whether measured gene expression provides predictive information beyond that recoverable from genomic sequence. A direct comparison of genome-only, genome-plus-genome-predicted-expression, and genome-plus-measured-expression models under matched population-aware and independent-cohort validation would help distinguish information recoverable from sequence from information contributed by measured biological state. This framework would help identify where predictive information is lost along the genome-to-phenotype pathway and determine whether measured expression contributes information beyond that recoverable from genomic sequence. The findings could inform the evaluation of genomic AMR prediction and surveillance, including in African populations.
Keywords:
antimicrobial resistance
; genotype-phenotype prediction
; whole-genome sequencing
; genomic representation
; population structure
; bacterial evolution
; gene expression
; Pseudomonas aeruginosa
; computational genomics
; antimicrobial susceptibility
1. Introduction
Antimicrobial resistance (AMR) is a major public health threat impacting infectious disease management. In 2019, bacterial AMR caused a huge global burden, including 1.27 million deaths (Antimicrobial Resistance Collaborators, 2022). In 2021, bacterial AMR was estimated to have caused 1.14 million direct deaths and was associated with approximately 4.71 million deaths globally, with the future burden projected to increase if current trends continue (GBD 2021 Antimicrobial Resistance Collaborators, 2024). Pseudomonas aeruginosa is one of the key priority pathogens causing this burden and serves as a major focus for AMR surveillance and diagnostics development (WHO, 2024).
Whole-genome sequencing (WGS) provides comprehensive resolution of bacterial genetic variation, serving as a critical tool for monitoring and predicting AMR. World Health Organization (WHO) guidelines highlight WGS as a key tool for detecting resistance mechanisms and supporting surveillance networks, emphasising laboratory capacity, standardised protocols, and accurate interpretation (WHO GLASS, 2020; WHO, FAO, UNEP, & WOAH, 2026; Djordjevic et al., 2024; Musicha et al., 2024). The transition from sequence to phenotype, however, is not a single inference. This workflow requires representing sequences as features, linking those features to phenotypes via statistical or machine-learning models, and validating performance across independent populations. Prediction performance depends on both the underlying biological relationship between genotype and phenotype and the analytical choices governing feature encoding and model evaluation.
The representation of the genome is central to this process, where curated resistance databases find known determinants. However, a genome also has sequence variation, gene content, and copy number changes. It includes regulatory regions, genetic background, and interactions among loci. Broader pan-genomic and pathogenomic methods can find signals that standard methods often miss (Bortolaia et al., 2020; Feldgarden et al., 2019; Hyun et al., 2020, 2023; Lees et al., 2020). Genomic representation can affect predictive performance and the extent to which learned relationships generalise across genetically distinct populations. Bacterial genes interact with one another. This genetic interaction and co-adaptation can change how genotypes relate to phenotypes. It also influences evolutionary paths (Cummins et al., 2026). Madden et al. (2024) provide an example of how expanded genomic representations can improve AMR prediction in Pseudomonas aeruginosa.
Population structure creates a separate problem. Closely related isolates can share resistance traits and genetic features. These similarities may reflect shared ancestry, linkage, transmission history, or sampling practices. A model can do well if the training and test samples come from similar populations. However, it might not learn a relationship that works with new genetic backgrounds. Recent studies show that biased sampling and phylogenetic structure can affect AMR prediction. Cross-population research shows performance varies across different geographic datasets (Avershina et al., 2021; Yu et al., 2025; Nsubuga et al., 2024; Verschuuren et al., 2022).
These issues raise a more specific question: how much predictive information about the AMR phenotype can be recovered from genomic sequence? This depends on having a good representation and validation strategy. Gene expression provides a useful test because it sits between genotype and phenotype, and its genomic architecture, regulatory variation, and environmental factors shape it. Physiological conditions also play a role (Dötsch et al., 2015; Hughes & Andersson, 2017). In P. aeruginosa, expression levels predict AMR phenotypes. Sequence-based models predict transcriptional states (Khaledi et al., 2020; Wiatrak et al., 2024).
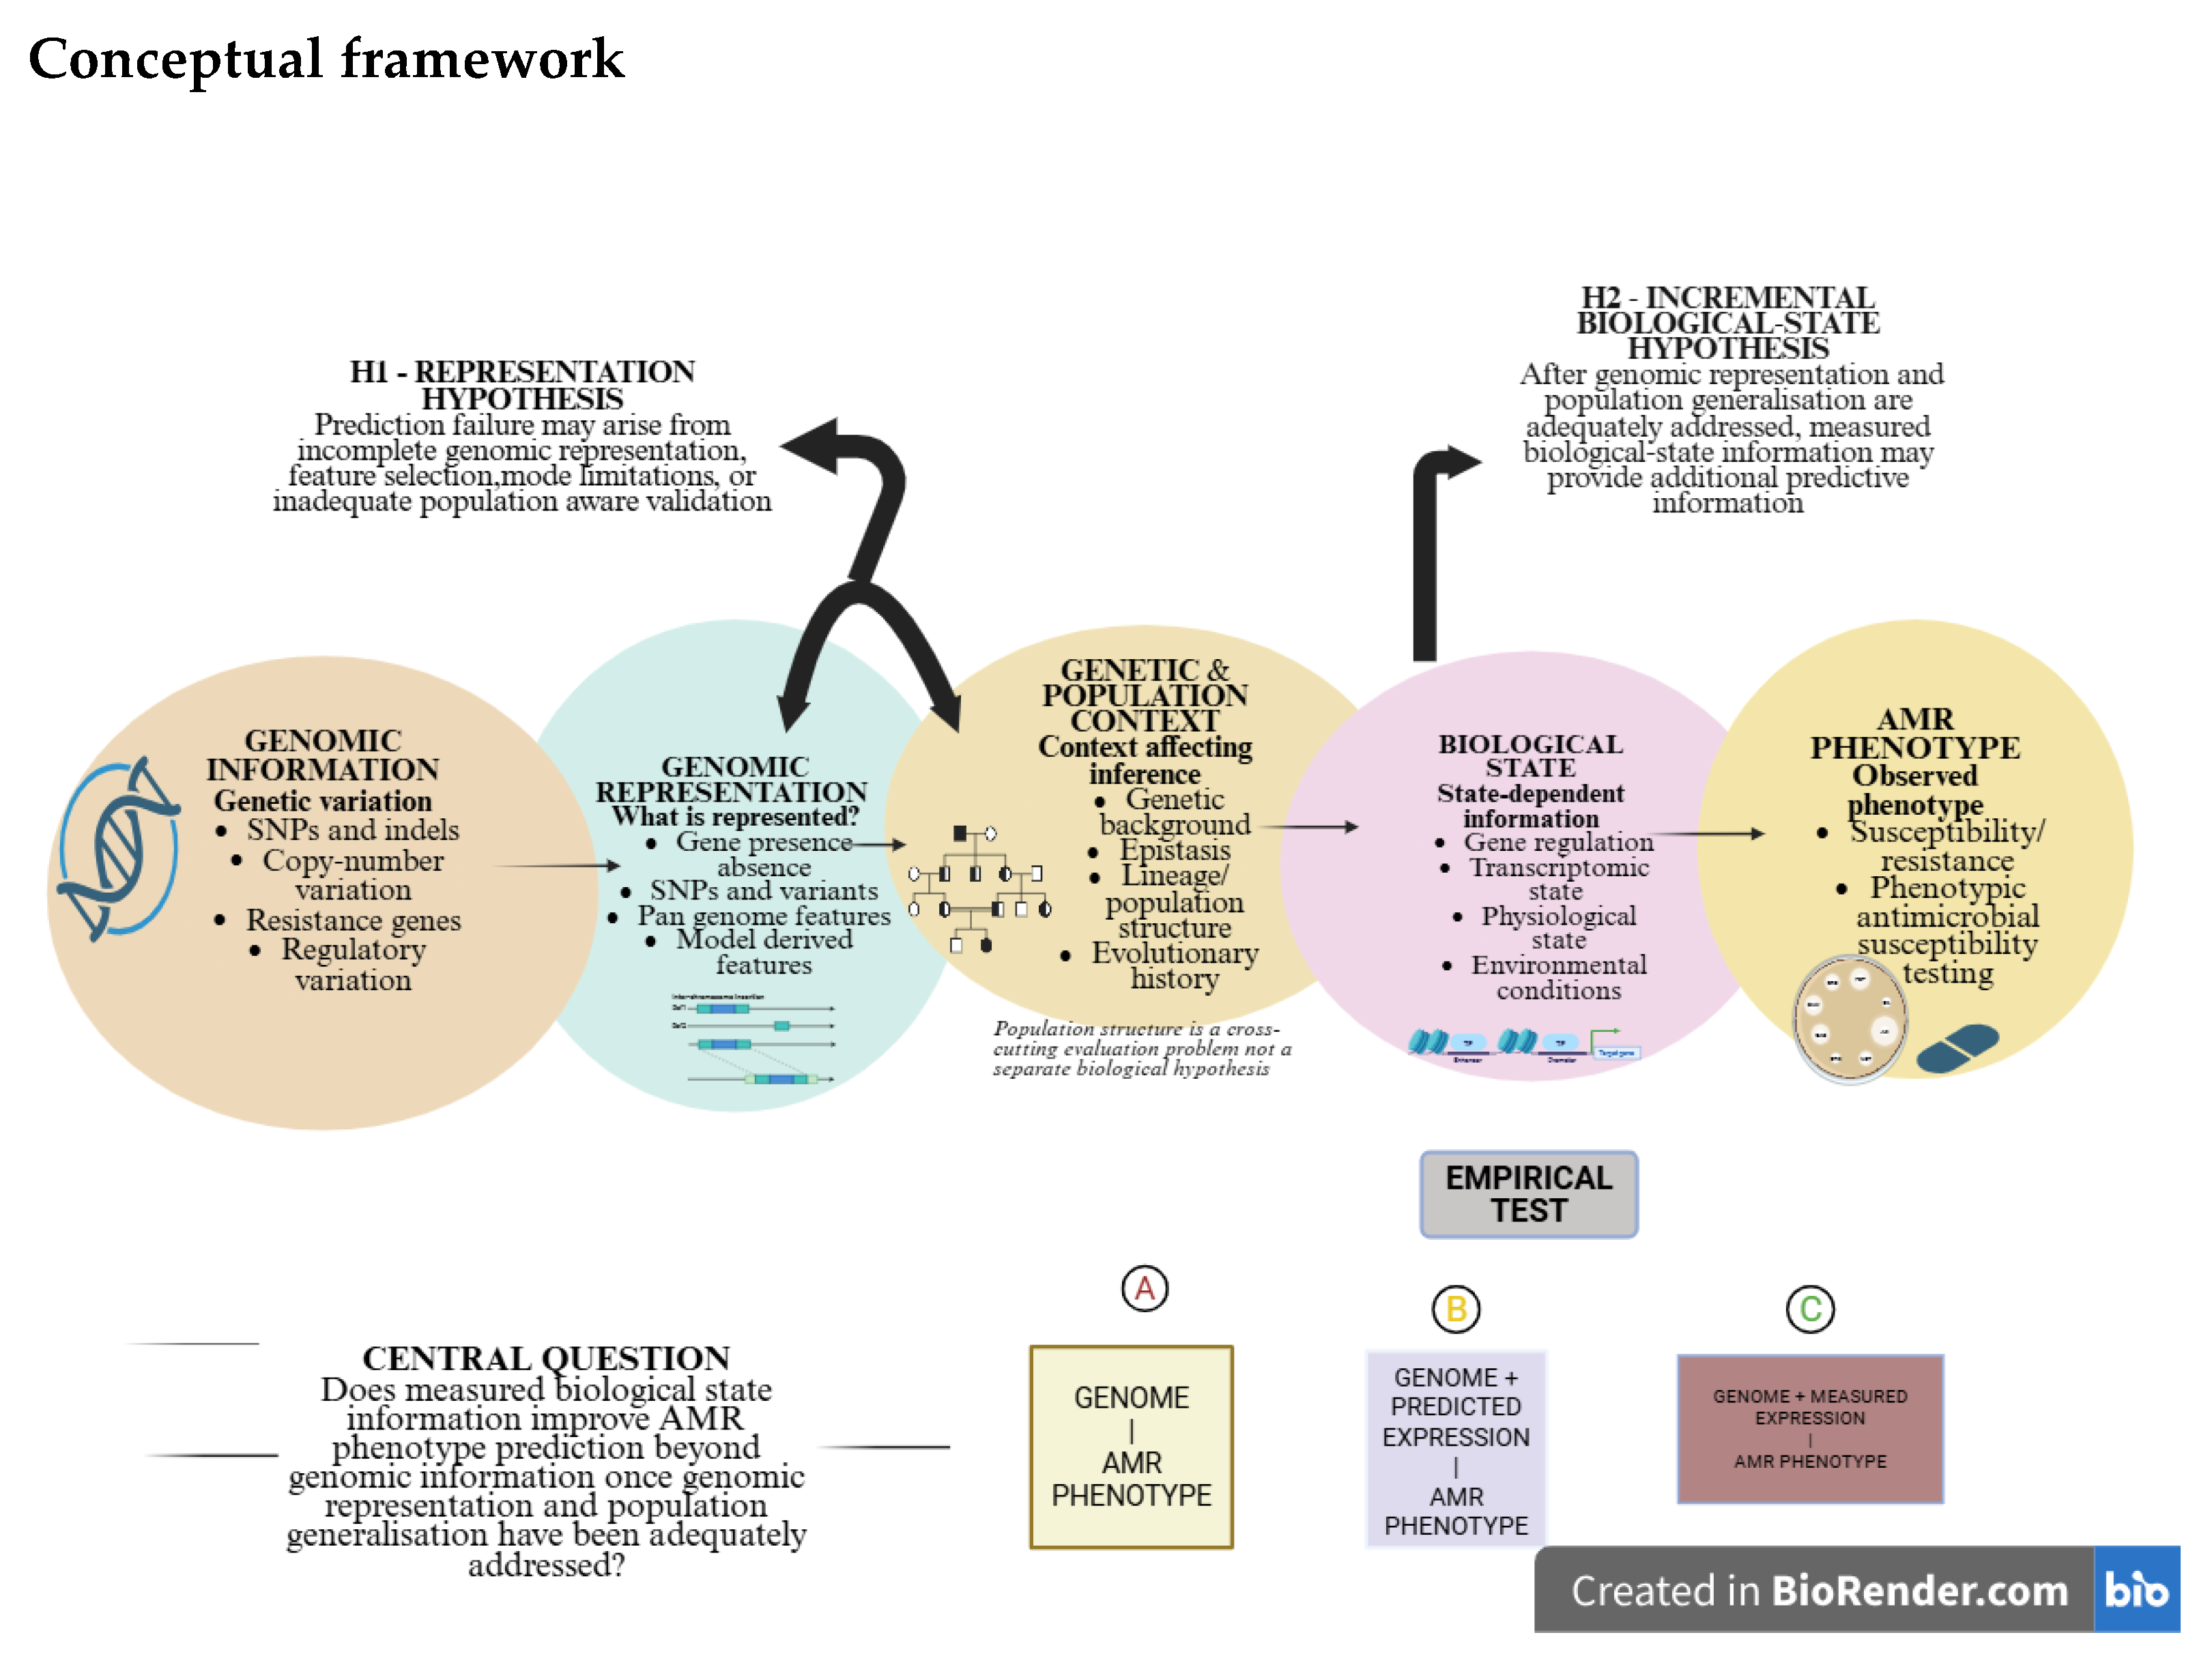
This review addresses two hypotheses. H1, the representation hypothesis, proposes that genotype-to-phenotype prediction errors can be reduced by enhancing genomic feature representation, refining model structure, and implementing population-aware validation without requiring non-genomic measurements. The incremental biological-state hypothesis, H2, proposes that measured gene expression provides incremental predictive value beyond what is recoverable from genomic sequence alone, even after optimising representation and accounting for population.
Population structure is treated as an evaluation challenge affecting model generalisation rather than a standalone biological hypothesis. The primary objective is to determine whether measured gene expression contributes non-redundant predictive signal once genomic representation and population generalisation are addressed.
The following sections examine, in turn, the mathematical limits of genotype-to-phenotype prediction, the genomic and environmental sources of context-dependence, direct evidence for the representation hypothesis, the role of population structure as a confound, and the specific contribution of gene expression as a test case for the incremental biological-state hypothesis.
Figure 1.
Conceptual framework for genome-to-phenotype prediction in antimicrobial resistance. The framework links genomic information to its representation, population structure, biological state, and antimicrobial resistance. It shows the gap between gains from genomic sequences and what relates to measured biological states.
Figure 1.
Conceptual framework for genome-to-phenotype prediction in antimicrobial resistance. The framework links genomic information to its representation, population structure, biological state, and antimicrobial resistance. It shows the gap between gains from genomic sequences and what relates to measured biological states.
2. The Mathematical Limits of Genotype-to-Phenotype Prediction
Genotype-to-phenotype prediction is not merely an algorithmic challenge but a question of whether underlying relationships can be reliably identified from observational data. James et al. (2025) formalise bacterial genomic prediction as a potentially ill-posed problem Hadamard sense, which requires that a solution exists, is unique and is stable under small input perturbations. These criteria are difficult to satisfy in bacterial genomics due to extensive linkage disequilibrium, limited sample sizes, representation-induced information loss, unmeasured confounding, observational noise, and model parameterisation constraints. Demonstrating across 4,140 Staphylococcus aureus isolates, they show how these factors produce non-unique or unstable model solutions despite high apparent predictive accuracy.
High predictive accuracy does not demonstrate that a learned genotype-phenotype mapping is unique or causal. Linkage disequilibrium and clonal inheritance generate correlated genomic variants carrying identical predictive signals, described as non-injectivity. James et al. (2025) Thus, multiple distinct feature combinations yield equivalent predictive performance, allowing models to predict resistance accurately without identifying the causal biological determinant.
This non-injectivity separates statistical prediction from causal interpretation. Feature importance metrics and attribution scores identify genomic patterns associated with resistance, but these outputs reflect lineage markers or transmission history. Models exploiting such lineage-correlated features achieve high within-dataset accuracy but fail to generalise when applied to genetically distinct populations (James et al., 2025).
Kulkarni et al. (2026) demonstrate finite-sample constraints by training convolutional neural networks to predict quantitative minimum inhibitory concentrations (MICs) across 14,834 Mycobacterium tuberculosis complex isolates. Model performance was bounded by the representation of specific drug-variant combinations in the training distribution. Low-frequency resistance mutations required specialised data augmentation, illustrating that true biological effects cannot be learned if the corresponding genotype-phenotype space is insufficiently sampled. Consequently, performance relies on coverage of the genotype-phenotype space rather than sequence volume alone.
These constraints outline distinct failure modes in genomic prediction: non-unique feature associations, limited space coverage, model mis-specification, and distributional shifts. These analytical limitations must not be collapsed into a single assumption of “missing biological information”. Prediction error following model fitting does not inherently demonstrate that the uncaptured signal lies outside the genome.
The mathematical framework reshapes the central question. The relevant question is not whether genomic sequences can predict antimicrobial resistance, as existing studies clearly demonstrate they can under defined representations, populations, and phenotypic settings (Ransom et al., 2020; James et al., 2025; Kulkarni et al., 2026). Rather, it is whether that predictive signal has been adequately represented, successfully learned, and demonstrated to transfer across the operational target population. Only after satisfying these analytical conditions can residual prediction error be interpreted as evidence for an uncaptured biological state, such as transcriptomic variation.
3. Feature Capture and Discard Across Genomic Representations
The whole genome sequence provides richer data than standard resistance markers. Curated resources like CARD, ResFinder, and AMRFinderPlus operationalise known resistance determinants to enable standardised phenotypic forecasting (Bortolaia et al., 2020; Feldgarden et al., 2019, 2021). NCBI’s AMRFinderPlus integrates protein annotations and nucleotide assemblies within the Pathogen Detection pipeline to identify known resistance genes and point mutations. (NCBI, 2026). However, determinant-based representations discard sequence variations outside curated target regions, including novel regulatory mutations and non-canonical resistance factors.
Machine learning models utilising pan genomic features capture resistance signals beyond predefined marker sets. Pangenome-wide association studies and ensemble learning frameworks identify candidate resistance determinants across accessory genomes, while pangenome-spanning regression models improve predictive accuracy by incorporating pan-genomic gene content (Hyun et al., 2020, 2023; Lees et al., 2020).
Gene copy number variation represents another feature dimension discarded by binary presence/absence encodings. Fistarol et al. (2025) demonstrated that gene copy-number encodings outperformed single-nucleotide polymorphism (SNP)-based models in predicting resistance across 4,255 S. aureus isolates. Their comparison shows that representation affects both predictive performance and cross-lineage transfer.
Genetic interactions, including epistasis and compensatory evolution, further modify resistance phenotypes. Durão et al. (2018) demonstrated how compensatory mutations alleviate the fitness costs of resistance alleles, while epistatic interactions modify the phenotypic expressivity of resistance variants in Neisseria gonorrhoeae and Escherichia coli (Schubert et al., 2019; Jangir et al., 2022). Cummins et al. (2026) emphasise that modelling locus-locus interactions is critical for mapping bacterial genotypes to phenotypes. Additive feature representations that treat loci independently overlook co-adaptive genetic structures.
Curation boundaries in AMR databases introduce additional constraints. Centner et al. (2026) highlight challenges regarding coverage, standardisation, and annotation lagging emerging resistance mechanisms. False-susceptible predictions from determinant-based models often reflect feature selection limitations rather than an absence of genomic signal.
Recent work in M. tuberculosis illustrates that modifying feature representation can recover predictive signal from a fixed set of determinants. Kulkarni et al. (2026) found that nucleotide encodings alone failed to differentiate functionally distinct mutation types when predicting MICs. Incorporating amino acid physicochemical properties and lineage annotations resolved these functional distinctions, achieving 89% prediction accuracy within one doubling dilution. This demonstrates that altered genomic representation can recover predictive information without introducing non-genomic measurements.
Madden et al. (2024) similarly demonstrated that expanding genomic feature sets improved AMR prediction in P. aeruginosa. Furthermore, Boolchandani et al. (2019) emphasised that genomic information is not a monolithic feature set; detectable signal depends entirely on sequence extraction, feature filtering, and structural encoding. Determinant-centric models provide interpretable diagnostic outputs, whereas broader pan-genomic encodings preserve accessory content and genetic context necessary for comprehensive phenotype mapping.
4. Context-Dependence of Resistance Phenotype
The mapping from genotype to resistance phenotype is modulated by environmental conditions and genetic background. Pseudomonas aeruginosa exhibits extensive phenotypic plasticity, adapting to diverse infection niches through metabolic reconfiguration and regulatory modulation (Letizia et al., 2025). Comparative analyses across clinical and environmental isolates demonstrate that phenotypic resistance varies across isolation contexts.
4.1. Environmental Context Can Modify Antimicrobial Responses.
Nutrient availability, growth phase, biofilm formation, temperature, and metabolite concentration can affect bacterial physiology and antimicrobial susceptibility (Hughes and Andersson, 2017; Letizia et al., 2025; Harrington et al., 2022, 2026). While WGS captures genetic makeup, it omits environmental growth conditions. Robinson et al. (2026) demonstrated that temperature shifts and growth phase transitions induced extensive reprogramming in Pseudomonas aeruginosa, generating distinct gene expression profiles during exponential and stationary phases. This indicates that biological states vary across environments despite identical genetic backgrounds.
This distinction does not demonstrate that environmental information is required as an input for AMR prediction. A model tested under laboratory conditions can learn patterns that are specific to those conditions. The key question for prediction is whether the deployment environment differs sufficiently from the training environment to alter the learned genotype–phenotype relationship. Environmental modulation therefore represents a potential source of context dependence but does not by itself explain failures in genome-based prediction.
Environmental modulation must be evaluated relative to the target deployment environment. Models trained on standardised laboratory susceptibility data learn relationships conditioned on those specific assay parameters. Furthermore, environmental effects require a clear distinction between inherited resistance and transient tolerance. Liu et al. (2023) showed that nutrient availability modulates antibiotic tolerance in P. aeruginosa through metabolic shifts; however, metabolic tolerance does not constitute inherited resistance and should not be confused with genetic prediction failure.
4.2. Genetic Background, Epistasis, and Regulatory Architecture
The expressivity of a resistance determinant depends on the host genetic background. Secondary mutations, epistatic interactions, and modifier loci alter phenotypic susceptibility and evolutionary trajectories (Durao et al., 2018). Unlike environmental variables, background genetic variations are captured within WGS data. Epistatic interactions influence resistance in N. gonorrhoeae (Schubert et al., 2019), while pre-existing chromosomal variation governs colistin resistance evolution in E. coli. Carrying mcr-1 (Jangir et al., 2022). Petrungaro et al. (2026) confirmed that background genetic variation accounts for substantial differences in resistance trajectories across hundreds of E. coli strains.
Regulatory networks link genetic variation to physiological state. Zhang et al. (2017) identified small regulatory RNAs in P. aeruginosa that modulate expression of the OprD porin, directly altering carbapenem susceptibility. Wardell et al. (2021) showed how long-term infection adaptations rewire transcriptional landscapes. Although mechanistic, this interaction underscores that transcriptomic state is constrained by regulatory architecture encoded within the genome.
Gene expression occupies an intermediate position between genomic sequence and phenotypic expression. Transcriptional states reflect genomic regulatory encoding while actively responding to environmental stimuli. The genome defines the physiological state space, whereas environmental inputs determine the instantaneous state within that space.
Consequently, prediction failure under variable contexts does not automatically demonstrate a requirement for transcriptomic profiling. Model failure may reflect unmodeled epistasis, inadequate feature representation, or evaluation across mismatched genetic backgrounds. An incremental contribution from biological-state measurements () is supported only if measured expression improves prediction after fully optimising genomic feature representation and accounting for population structure.
5. Testing the Representation Hypothesis
The representation hypothesis (H1) asserts that genotype-to-phenotype prediction errors can be reduced by optimising sequence feature encoding and model structure without incorporating non-genomic data. Evidence supporting H1 comes from frameworks that integrate biological domain knowledge into feature engineering.
Kavvas et al. (2020) developed the Metabolic Allele Classifier (MAC), integrating genome-scale metabolic structure, including pathway relationships, stoichiometry, and flux constraints, into microbial genome-wide association analysis. Evaluated on 1,595 drug-tested Mycobacterium tuberculosis strains, MAC achieved an area under the receiver operating characteristic curve (AUC) of 0.93 for isoniazid resistance. Instead of treating variants independently, MAC structures interpret within metabolic constraints, extracting predictive signals without requiring transcriptomic inputs.
Fistarol et al. (2025) evaluated feature representation performance across 4,255 Staphylococcus aureus isolates tested with six antibiotics. Gene copy-number representation outperformed SNP-based models in both standard cross-validation and lineage-held-out evaluations.
Figure 2.
Genomic representation influences AMR prediction performance and cross-lineage generalisation. The figure compares macro-average F1-scores for SNP-based and gene copy number methods in Staphylococcus aureus that differ across six antibiotics under standard and lineage-out evaluation. Gene copy number models scored F1-scores between 0.925 and 0.988. In contrast, SNP-based models scored between 0.838 and 0.935. In the lineage-held-out evaluation, gene copy-number models scored between 0.875 and 0.904. In contrast, SNP-based models dropped to scores of 0.557 to 0.638. The figure summarises values from Fistarol et al. (2025). The ranges show performance across different antibiotics.
Figure 2.
Genomic representation influences AMR prediction performance and cross-lineage generalisation. The figure compares macro-average F1-scores for SNP-based and gene copy number methods in Staphylococcus aureus that differ across six antibiotics under standard and lineage-out evaluation. Gene copy number models scored F1-scores between 0.925 and 0.988. In contrast, SNP-based models scored between 0.838 and 0.935. In the lineage-held-out evaluation, gene copy-number models scored between 0.875 and 0.904. In contrast, SNP-based models dropped to scores of 0.557 to 0.638. The figure summarises values from Fistarol et al. (2025). The ranges show performance across different antibiotics.
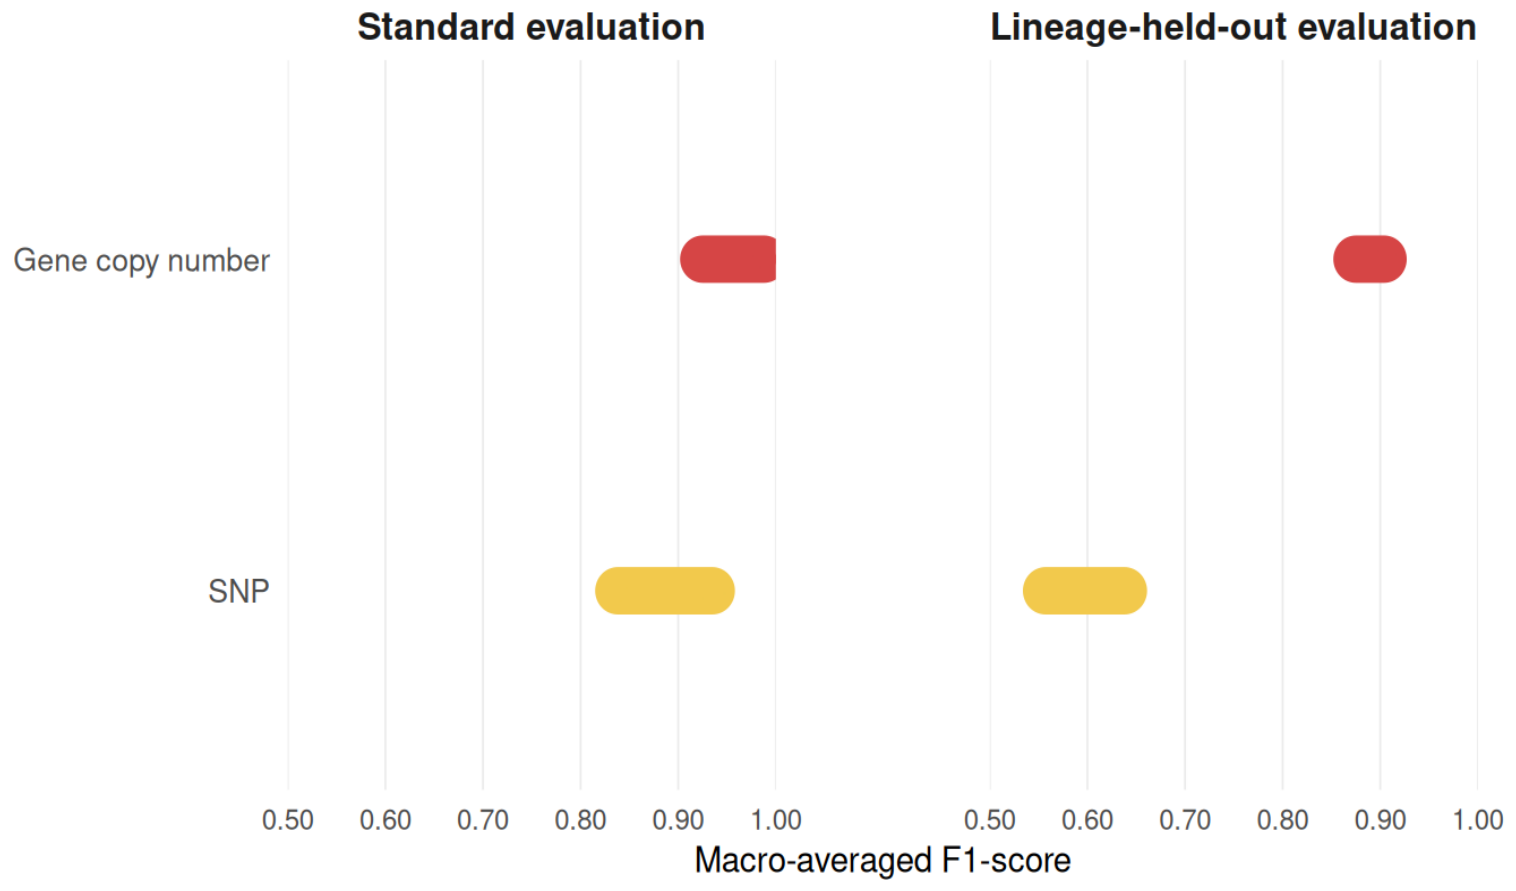
Because both models utilised identical sequence data, performance differences demonstrate that feature encoding governs both predictive capacity and cross-lineage transferability. However, these findings do not prove that genomic sequence is sufficient for all resistance phenotypes.
Recent graph neural network architectures further expand feature integration. Nguyen et al. (2026) developed AMR-GNN for P. aeruginosa, integrating high-dimensional sequence features and clonal relationships into graph structures to address feature dimensionality and population structure. Similarly, Xu et al. (2026) combined gene-context -mers with gene-synergy networks in S. aureus, capturing non-additive feature interactions overlooked by single-marker analyses.
These studies demonstrate a bounded form of the representation hypothesis: alternative encodings, metabolic constraints, copy number features, and gene-interaction networks recover predictive signals obscured within simple SNP encodings. Consequently, poor performance from a basic genomic model does not establish that non-genomic biological measurements are required.
6. Consolidated Framework on Population Structure and Generalisation.
Evaluating machine learning models across structured bacterial populations exposes critical transferability limits. Bacterial populations are stratified by clonal lineage, recombination history, geographic origin, and sampling bias. When resistance phenotypes colocalise with population structure, models frequently learn lineage-specific background markers rather than causal resistance determinants. Consequently, high within-population accuracy degrades when models are evaluated on unrepresented lineages.
Yu et al. (2025) evaluated this phenomenon across 6,740 machine-learning trained on over 24,000 whole-genome sequences in five species (Escherichia coli, Klebsiella pneumoniae, Salmonella enterica, Staphylococcus aureus, and Streptococcus pneumoniae). Their analysis demonstrated that phylogenetic sampling bias confounds AMR prediction. Models relied on lineage-associated proxy features, resulting in poor performance when evaluated on held-out clades. Increasing sample size failed to resolve these transfer limits, establishing that volume alone cannot overcome structural sampling bias.
Evaluating predictive models requires aligning validation protocols with operational deployment goals. Three distinct validation tiers define model performance: Random cross-validation allows related isolates across folds, overstating generalisability. Lineage- or clade-held-out validation excludes entire phylogenetic clades from training, evaluating whether learned features transfer across distinct genetic backgrounds. Performance drops under this design highlight reliance on lineage-specific markers. Independent External Cohort Validation: Tests models on independently collected datasets spanning differing geographic, temporal, or clinical settings. Nsubuga et al. (2024) illustrated this challenge by training E. coli AMR models on England datasets and evaluating them on external cohorts from Uganda, Nigeria, and Tanzania. Model performance varied widely across antibiotics and international cohorts, complicated by class imbalance and differing local epidemiological structures, demonstrating that transferability cannot be assumed across geographic boundaries.
Aselstyne et al. (2026) confirmed that choices regarding -mer length, feature matrix truncation, model architecture, and validation strategy heavily influence measured AMR prediction performance, underscoring that apparent generalisation failures often reflect validation design rather than missing biological variables. Validation failures highlight transfer limitations rather than missing biological-state information.
Disentangling generalisation failures from missing biological variables requires careful analytical controls. Cross-lineage prediction drops may result from unrepresented genomic variation, unmodeled epistasis, or assay variance across laboratories. Farhat et al. (2019) demonstrated this in M. tuberculosis, showing that incorporating non-coding promoter mutations alongside coding variants enabled predictive transfer across an independent cohort of 792 isolates. Similarly, Snitkin et al. (2017) demonstrated that integrating genomic relationships with epidemiological context clarifies transmission pathways without requiring transcriptomic inputs.
These findings directly impact international public health and genomic surveillance initiatives. National programmes, such as Kenya’s capacity-building efforts for AMR tracking (Kigen et al., 2023; WHO, 2022, 2023), and regional consortia, such as SeqAfrica, which generated 29,269 genomes across 21 African nations (Nilsson et al., 2025), provide the diverse population-level datasets required to train and validate robust, population-aware AMR models. Population structure must be controlled before residual prediction errors can be attributed to uncaptured biological states.
7. Gene Expression as a Pivotal Test Case
Gene expression occupies an intermediate position between genomic sequence and phenotype, providing a rigorous test case for evaluating whether measured biological states contribute a non-redundant predictive signal (Dötsch et al., 2015; Hughes & Andersson, 2017).
7.1. Predictability vs Incremental Value of Expression
Wiatrak et al. (2024) developed GeneBac, demonstrating that sequence-based deep learning models can predict gene expression profiles and susceptibility phenotypes from WGS data. In Pseudomonas aeruginosa, genome-predicted expression showed strong concordance with measured transcription for core genes in held-out strains.
This predictability establishes that transcriptomic variation is partially encoded within the genome. Crucially, a distinction must be drawn between expression predictability (whether WGS can reconstruct transcriptional states) and expression increment (whether measured expression enhances phenotype prediction beyond optimised genomic models). Demonstrating that sequence predicts expression does not establish that sequence captures all phenotype-relevant transcriptomic variation.
7.2. Predictive Signal of Measured Expression
Khaledi et al. (2020) conducted the primary direct comparison of paired genomic and measured transcriptomic features across 414 clinical Pseudomonas aeruginosa isolates. Incorporating gene expression alongside gene presence/absence improved prediction accuracy for meropenem, ceftazidime, and tobramycin, whereas SNP-based models performed best for ciprofloxacin. Expression contributions were antibiotic-specific. Ransom et al. (2020) contextualised these findings, emphasising that clinical deployment of predictive models requires linking sequence features directly to biological mechanisms.
Yasir et al. (2022) analysed transcriptomic data from 410 multidrug-resistant Pseudomonas aeruginosa isolates to predict resistance to meropenem, ciprofloxacin, and ceftazidime. Shahreen et al. (2025) and Kula et al. (2026) confirmed that transcriptomic signatures yield high predictive power using 414 clinical isolates. These studies demonstrate the predictive potential of transcriptomic features, although their results should not be treated as independent biological replication unless the degree of overlap between their underlying datasets has been established. Unmeasured batch effects, clinical recruitment biases, or sample preparation artefacts within that single cohort could generate reproducible expression-phenotype associations that fail to generalise to independent populations.
7.3. Analytical Framework: The Three-Arm Comparison
Determining whether measured expression provides a non-redundant predictive signal requires evaluating three distinct model formulations across identical dataset partitions.
Model A (Direct Genome): G AMR Phenotype
Model B (Genome-Predicted Expression) G + → AMR Phenotype: where Model C (Genome plus Measured Expression): G + → AMR phenotype.
Expressed as:
where G is genomic information, E is measured expression, and is expression predicted from genomic data.
Because is generated from G, Model B cannot introduce information outside the sequence. Its value is representational, re-encoding complex sequence variation into biologically structured pathway features.

Table 1.
Overview of the three-arm model benchmarking framework for evaluating direct genomic and transcriptomic contributions to antimicrobial resistance prediction. Summary of input features, underlying assumptions, and primary analytical objectives across direct genomic models (), genome-predicted expression models (), and measured expression models ().
Table 1.
Overview of the three-arm model benchmarking framework for evaluating direct genomic and transcriptomic contributions to antimicrobial resistance prediction. Summary of input features, underlying assumptions, and primary analytical objectives across direct genomic models (), genome-predicted expression models (), and measured expression models ().
| Model Formulation | Input Features | Underlying Assumption | Primary Analytical Purpose |
|---|---|---|---|
| Model A (Direct Genomic) | (SNPs, copy number, -mers) | Direct sequence features capture phenotype associations. | Baseline genomic predictive capacity |
| Model B (Genome-Predicted Expression) | (where ) | Transcriptional re-encoding uncovers latent sequence signals. | Test representational gains without new biological data. |
| Model C (Genome + Measured Expression) | () | Measured expression captures an unencoded biological state. | Test incremental value of measured biological state () |
Performance comparisons across these three arms yield five distinct outcomes:
A ≈ B ≈ C; genomic data provides sufficient predictive information within the tested framework; measured expression adds no incremental value.
A < B ≈ C, genome-predicted expression recovers the predictive signal of measured transcriptomics, demonstrating that observed transcriptomic benefits reflect representational re-encoding of genomic sequence.
A < B < C, genome-predicted expression captures structural sequence signals, but measured expression retains incremental predictive value, supporting A ≈ B < C, direct genomic features and predicted expression fail to capture predictive signals present exclusively within measured transcriptional states.
A > B, the predicted expression introduces noise or loses predictive information present within direct genomic encodings.
7.4. Population-Aware Validation Protocols
Sequence-to-expression models () must be trained exclusively within training partitions. Predicted expression values for held-out evaluation isolates must be generated completely out-of-sample, strictly preventing transcriptomic or phenotypic data from held-out isolates from leaking into feature selection, hyperparameter tuning, or model fitting. Lineage-held-out splits and independent multi-center cohort validations are mandatory to ensure that observed performance gains reflect transferable biological signals rather than lineage-correlated noise.
7.5. Mechanistic Interpretation
If measured expression maintains superior predictive accuracy (), the residual signal must be evaluated experimentally to determine its biological basis. A predictive expression feature may reflect causal resistance mechanisms, downstream stress responses, or transient environmental adaptation. Disentangling these possibilities requires a systematic progression: genomic sequence () to predicted biological state (), followed by phenotype prediction, verification of biological state reproducibility across cohorts, and targeted mechanistic testing. Condition-matched assays, longitudinal sampling, and targeted gene knockouts are required to confirm whether residual transcriptomic signals represent stable, targetable resistance mechanisms.
8. Critical Synthesis and Research Strategy
8.1. Translational Implications for Diagnostics and Surveillance
Genomic prediction models are increasingly integrated into clinical diagnostics and public health surveillance. Snitkin et al. (2017) demonstrated that integrating genomic sequencing with patient transfer networks tracks the transmission of multidrug-resistant K. pneumoniae and prevents healthcare-associated outbreaks. Hayden et al. (2026) reviewed the broader role of whole-genome sequencing in healthcare-associated infection prevention, surveillance, and outbreak investigation. Similarly, health economic and mathematical modelling studies by Reichert et al. (2023) and Ekanayake-Weber et al. (2026) show that resistance prediction informs targeted treatment strategies and surveillance resource allocation for drug-resistant gonorrhoea. While not directly evaluating gene expression, these studies demonstrate that predictive models deliver clinical utility only when their learned relationships remain robust across operational populations.
This supports a tiered diagnostic framework:
- Tier 1 (Genomic Screening): WGS provides baseline prediction using curated resistance determinants and pangenomic features.
- Tier 2 (Structured Representation): Sequence-derived expression models () re-encode genomic variants into structured pathway features to resolve complex phenotypes.
- Tier 3 (Targeted Phenotypic / Transcriptomic Testing): Measured transcriptomics or phenotypic susceptibility testing is deployed selectively when genomic models indicate high prediction uncertainty.
This layered architecture optimises diagnostic accuracy while minimising unnecessary sequencing and processing costs.
8.2. Evidence Synthesis
The literature supports two non-mutually exclusive hypotheses:
- H1 (Representation Hypothesis): Supported by evidence that copy-number features, pangenomic encodings, and metabolic constraints recover predictive signals obscured within basic SNP encodings.
- H2 (Incremental Biological-State Hypothesis): Supported by observations that measured transcriptomics improves prediction for specific antibiotics in P. aeruginosa, though unvalidated across independent cohorts.
Population structure acts as an analytical confounder that modulates the evaluation of both hypotheses. Model degradation under cross-lineage evaluation reflects generalisation limits rather than definitive proof of missing non-genomic variables.
8.3. Sequential Research Strategy
To resolve whether measured expression provides non-redundant predictive value without repeating baseline definitions established earlier, research should proceed through a 6-step operational workflow:
- Establish Baseline Genomic Models: Fit direct genomic models (G) using optimised feature encodings (gene copy number, pangenome content, epistatic networks).
- Execute Population-Aware Validation: Benchmark models using lineage-held-out cross-validation and independent geographic cohorts to quantify cross-lineage transferability.
- Generate Out-of-Sample Expression Predictions: Fit sequence-to-expression models ( strictly within training partitions and generate out-of-sample predictions for test isolates.
- Conduct a Three-Arm Benchmark: Compare Models A (), B (), and C () across matched isolates, identical phenotype definitions, and standardised validation splits.
- Evaluate Residual Signal Reproducibility: Verify whether performance advantages in Model C persist across independent external cohorts to rule out cohort-specific batch artefacts.
- Perform Mechanistic Validation: Conduct targeted gene knockouts, promoter perturbations, and longitudinal assays on persistent residual transcriptomic features to confirm causal biological involvement.
9. Conclusions and Recommendations
9.1. Conclusions
Genotype-to-phenotype prediction in antimicrobial resistance is constrained by the biological complexity of resistance mechanisms and by how genomic features are represented, modelled, and evaluated. Alternative genomic representations recover predictive signals that simple models miss, whereas population structure limits the transferability of learned associations across genetic backgrounds. Therefore, poor performance from a single genomic model does not establish that predictive information is absent from the genome.
Gene expression provides a framework to resolve these analytical limits. Measured transcriptomics improves AMR prediction for specific pathogen-drug combinations, while genomic sequence can predict core transcriptional states. However, current literature does not differentiate whether transcriptomic predictive gains reflect representational re-encoding of sequence data or non-redundant biological-state information.
For Pseudomonas aeruginosa, benchmarking direct genomic (), genome-predicted expression (), and genome-plus-measured-expression () models clarifies this distinction. If genome-predicted expression captures the predictive capacity of measured transcriptomics, observed transcriptomic benefits reflect genomic signals uncaptured by direct models. If measured expression maintains a reproducible advantage following rigorous controls, this confirms an incremental contribution from biological-state measurements.
9.2. Recommendations
Future research should establish a strong genomic baseline before evaluating the additional predictive contribution of biological-state information. Researchers should compare different genomic representations, requiring the modelling of genomic interactions and transparent reporting of feature engineering and model selection protocols. Genome-based models need validation that matches their intended use because standard random cross-validation is insufficient for evaluating generalisability.
Population structure should be integrated into experimental design rather than being considered only as a post hoc explanation. Lineage- or clade-held-out evaluations should be employed to test transferability across genetic backgrounds. Independent geographic, temporal, or clinical cohorts must be evaluated to confirm whether predictive relationships generalise beyond the original dataset, and maintaining consistent population stratification ensures that observed performance differences reflect variations in underlying information rather than cohort composition.
The proposed three-arm comparison should be conducted in P. aeruginosa using matched genomic, transcriptomic, and phenotypic data where available. Genome-to-expression prediction should happen within training partitions; accordingly, expression data from held-out isolates must be strictly excluded from model development. Genome-only, genome-predicted expression, and measured expression models should use the same phenotype definitions, matched populations, and identical modelling workflows. Performance should be evaluated based on discrimination, calibration, transferability, and reproducibility across independent groups.
Finally, investigation should extend beyond predictive performance to examine the mechanistic contributions of measured expression. Controlled experiments and replicated transcriptomic assays can determine whether residual expression signals reflect stable biological states. Longitudinal sampling and targeted perturbation of key regulatory pathways can evaluate the functional involvement of these states in resistance. This shift from prediction to reproducibility and mechanism can help determine whether measured biological-state data provides reproducible information not recovered by the genomic models evaluated. The goal is not to replace genomic prediction with transcriptomic profiling but to determine when supplementary biological information provides sufficient predictive value to warrant acquisition in clinical diagnostics and genomic surveillance.
Author Contributions
The author developed the review concept, conducted the literature search, evaluated and synthesized the relevant evidence, interpreted the findings, and wrote and revised the review.
Funding
No specific funding was received for this work.
Conflicts of Interest
The author declares no competing interests.
References
- Antimicrobial Resistance Collaborators. Global burden of bacterial antimicrobial resistance in 2019: A systematic analysis. The Lancet 2022, 399(10325), 629–655. [Google Scholar] [CrossRef] [PubMed]
- Aselstyne, A.; Karthik, E. N.; El Azami, M.; Pogorelcnik, R.; Fournier, Q.; amp; Chandar, S. A systematic analysis of machine learning pipelines for robust antimicrobial resistance prediction [Preprint]; bioRxiv, 2026. [Google Scholar] [CrossRef]
- Avershina, E.; Sharma, P.; Tax, A. M.; et al. AMR-Diag: Neural network-based genotype-to-phenotype prediction of resistance towards β-lactams in Escherichia coli and Klebsiella pneumoniae. Comput. Struct. Biotechnol. J. 2021, 19, 1896–1906. [Google Scholar] [CrossRef] [PubMed]
- Boolchandani, M.; D’Souza, A. W.; amp; Dantas, G. Sequencing-based methods and resources to study antimicrobial resistance. Nat. Rev. Genet. 2019, 20, 356–370. [Google Scholar] [CrossRef] [PubMed]
- Bortolaia, V.; Kaas, R. S.; Ruppe, E.; Roberts, M. C.; Schwarz, S.; Cattoir, V.; et al. ResFinder 4.0 for predictions of phenotypes from genotypes. J. Antimicrob. Chemother. 2020, 75(12), 3491–3500. [Google Scholar] [CrossRef] [PubMed]
- Centner, C. M.; Di Gregorio, S.; Argimón, S.; Brankin, A.; Dean, A.; Marcano Zamora, D.; et al. Antimicrobial resistance databases: Opportunities and challenges for public health. npj Antimicrob. Resist. 2026, 4, 1. [Google Scholar] [CrossRef] [PubMed]
- Cummins, E. A.; Raikwar, P. S.; Hallett, E.; amp; Sheppard, S. K. Epistasis and co-adaptation in bacterial genome evolution. Nat. Rev. Genet. 2026, 27, 547–562. [Google Scholar] [CrossRef] [PubMed]
- Djordjevic, S. P.; Jarocki, V. M.; Seemann, T.; Cummins, M. L.; Watt, A. E.; Drigo, B.; et al. Genomic surveillance for antimicrobial resistance: A one-health perspective. Nat. Rev. Genet. 2024, 25, 142–157. [Google Scholar] [CrossRef] [PubMed]
- Durão, P.; Balbontín, R.; amp; Gordo, I. Evolutionary mechanisms shaping the maintenance of antibiotic resistance. Trends Microbiol. 2018, 26(8), 677–691. [Google Scholar] [CrossRef] [PubMed]
- Dötsch, A.; Schniederjans, M.; Khaledi, A.; Hornischer, K.; Schulz, S.; Bielecka, A.; et al. The Pseudomonas aeruginosa transcriptional landscape is shaped by environmental heterogeneity and genetic variation. mBio 2015, 6(4), e00749-15. [Google Scholar] [CrossRef] [PubMed]
- Ekanayake-Weber, M. S.; Rönn, M. M.; Yin, X.; Hsu, K.; Li, Y.; Gift, T. L.; et al. Measuring the health benefits and costs of antimicrobial-resistant gonorrhoea surveillance in the United States: An agent-based model and cost-effectiveness analysis. Lancet Reg. 2026. [Google Scholar] [CrossRef] [PubMed]
- Health – Am. 62, 101582. [CrossRef] [PubMed]
- Farhat, M. R.; Freschi, L.; Calderon, R.; Ioerger, T.; Snyder, M.; Meehan, C. J.; et al. GWAS for quantitative resistance phenotypes in Mycobacterium tuberculosis reveals resistance genes and regulatory regions. Nat. Commun. 2019, 10, 2128. [Google Scholar] [CrossRef] [PubMed]
- Feldgarden, M.; Brover, V.; Gonzalez-Escalona, N.; Frye, J. G.; Haendiges, J.; Haft, D. H.; et al. AMRFinderPlus and the Reference Gene Catalogue facilitate examination of the genomic links among antimicrobial resistance, stress response, and virulence. Sci. Rep. 2021, 11, 12728. [Google Scholar] [CrossRef] [PubMed]
- Feldgarden, M.; Brover, V.; Haft, D. H.; Prasad, A. B.; Slotta, D. J.; Tolstoy, I.; et al. Validating the AMRFinder tool and resistance gene database by using antimicrobial resistance genotype-phenotype correlations in a collection of isolates. Antimicrob. Agents Chemother. 2019, 63(11), e00483-19. [Google Scholar] [CrossRef] [PubMed]
- Fistarol, B. F.; Gervasio, J. D.; amp; Szöllősi, G. J. Gene copy-number features generalise better than SNPs for antimicrobial resistance prediction in Staphylococcus aureus. npj Antimicrob. Resist. 2025, 3, 100. [Google Scholar] [CrossRef] [PubMed]
- GBD 2021 Antimicrobial Resistance Collaborators. Global burden of bacterial antimicrobial resistance 1990–2021: A systematic analysis with forecasts to 2050. The Lancet 2024, 404(10459), 1199–1226. [Google Scholar] [CrossRef] [PubMed]
- Harrington, N. E.; Allen, F.; Garcia Maset, R.; amp; Harrison, F. Pseudomonas aeruginosa gene expression changes during established biofilm infection in a cystic fibrosis lung model. Microbiology 2026, 172(3), 001678. [Google Scholar] [CrossRef] [PubMed]
- Harrington, N. E.; Littler, J. L.; amp; Harrison, F. Transcriptome analysis of Pseudomonas aeruginosa biofilm infection in an ex vivo pig model of the cystic fibrosis lung. Appl. Environ. Microbiol. 2022, 88(3), e01789-21. [Google Scholar] [CrossRef] [PubMed]
- Hayden, M. K.; Sansom, S. E.; amp; Snitkin, E. S. Genome sequencing for prevention of healthcare-associated bacterial infections. Nat. Rev. Microbiol. 2026, 24, 255–269. [Google Scholar] [CrossRef] [PubMed]
- Hughes, D.; amp; Andersson, D. I. Environmental and genetic modulation of the phenotypic expression of antibiotic resistance. FEMS Microbiol. Rev. 2017, 41(3), 374–391. [Google Scholar] [CrossRef] [PubMed]
- Hyun, J. C.; Kavvas, E. S.; Monk, J. M.; amp; Palsson, B. O. Machine learning with random subspace ensembles identifies antimicrobial resistance determinants from pan-genomes of three pathogens. PLoS Comput. Biol. 2020, 16(3), e1007608. [Google Scholar] [CrossRef] [PubMed]
- Hyun, J. C.; Monk, J. M.; Szubin, R.; Hefner, Y.; amp; Palsson, B. O. Global pathogenomic analysis finds known and new genetic factors for antimicrobial resistance in twelve species. Nat. Commun. 2023, 14, 7690. [Google Scholar] [CrossRef] [PubMed]
- James, T.; Williamson, B.; Tino, P.; amp; Wheeler, N. E. Whole-genome phenotype prediction with machine learning: Open problems in bacterial genomics. Bioinformatics 2025, 41(7), btaf206. [Google Scholar] [CrossRef] [PubMed]
- Jangir, P. K.; Yang, Q.; Shaw, L. P.; et al. Pre-existing chromosomal polymorphisms in pathogenic E. coli potentiate the evolution of resistance to a last-resort antibiotic. eLife 2022, 11, e78834. [Google Scholar] [CrossRef] [PubMed]
- Kavvas, E. S.; Yang, L.; Monk, J. M.; Heckmann, D.; amp; Palsson, B. O. A biochemically interpretable machine learning classifier for microbial GWAS. Nat. Commun. 2020, 11, 2580. [Google Scholar] [CrossRef] [PubMed]
- Khaledi, A.; Weimann, A.; Schniederjans, M.; et al. Predicting antimicrobial resistance in Pseudomonas aeruginosa with machine learning-enabled molecular diagnostics. EMBO Mol. Med. 2020, 12(3), e10264. [Google Scholar] [CrossRef] [PubMed]
- Kigen, C.; Muraya, A.; Kyanya, C.; Kingwara, L.; Mmboyi, O.; Hamm, T.; amp; Musila, L. Enhancing capacity for national genomics surveillance of antimicrobial resistance in public health laboratories in Kenya. Microb. Genom. 2023, 9(8), mgen001098. [Google Scholar] [CrossRef] [PubMed]
- Kula, C.; Erguven, I.; Ozcelik, B.; Gulfidan, G.; amp; Arga, K. Y. Transcriptome-based machine learning models to predict antimicrobial resistance in. Pseudomonas Aeruginosa OMICS A J. Integr. Biol. 2026, 30(2), 94–104. [Google Scholar] [CrossRef] [PubMed]
- Kulkarni, S. G.; Green, A. G.; Mann, B. C.; Malatesta, S.; Kulkarni-Goodwin, S.; Cesare, N.; et al. Convolutional neural networks quantify antibiotic resistance in Mycobacterium tuberculosis with diagnostic grade accuracy and predict treatment response. Nat. Commun. 2026, 17, 5667. [Google Scholar] [CrossRef] [PubMed]
- Lees, J. A.; Mai, T. T.; Galardini, M.; Wheeler, N. E.; Chaguza, C.; et al. Improved prediction of bacterial genotype-phenotype associations using interpretable pangenome-spanning regressions. mBio 2020, 11(4), e01344-20. [Google Scholar] [CrossRef] [PubMed]
- Letizia, M.; Diggle, S. P.; amp; Whiteley, M. Pseudomonas aeruginosa: Ecology, evolution, pathogenesis and antimicrobial susceptibility. Nat. Rev. Microbiol. 2025, 23, 701–717. [Google Scholar] [CrossRef]
- Liu, H.; Wang, Y.; Zhang, Z.; Qi, H.; Zhang, Y.; Li, W.; et al. Nutrient condition modulates the antibiotic tolerance of Pseudomonas aeruginosa. Sci. Total Environ. 2023, 904, 166749. [Google Scholar] [CrossRef]
- Madden, D. E.; Baird, T.; Bell, S. C.; et al. Keeping up with the pathogens: Improved antimicrobial resistance detection and prediction from Pseudomonas aeruginosa genomes. Genome Med. 2024, 16, 78. [Google Scholar] [CrossRef] [PubMed]
- Musicha, P.; Morse, T.; Cocker, D.; Mugisha, L.; Jewell, C. P.; amp; Feasey, N. A. Time to define One Health approaches to tackling antimicrobial resistance. Nat. Commun. 2024, 15, 8782. [Google Scholar] [CrossRef] [PubMed]
- National Center for Biotechnology Information. AMRFinderPlus. NCBI Pathogen Detection. 2026. Available online: https://www.ncbi.nlm.nih.gov/pathogens/antimicrobial-resistance/AMRFinder/ (accessed on 13 October 2026).
- Nguyen, H. A.; Peleg, A. Y.; Wisniewski, J. A.; Wang, X.; Wang, Z.; Blakeway, L. V.; et al. AMR-GNN: A multi-representation graph neural network framework to enable genomic antimicrobial resistance prediction. Nat. Commun. 2026, 17, 3555. [Google Scholar] [CrossRef] [PubMed]
- Nilsson, P.; Gibson, C. T.; Thornval, N. R.; Lacy-Roberts, N.; Odgaard, C.; Owusu-Nyantakyi, C.; et al. SeqAfrica: Empowering Africa’s fight against antimicrobial resistance through genomics. Front. Public Health 2025, 13, 1716498. [Google Scholar] [CrossRef] [PubMed]
- Nsubuga, M.; Galiwango, R.; Jjingo, D.; amp; Mboowa, G. Generalisability of machine learning in predicting antimicrobial resistance in E. coli: A multi-country case study in Africa. BMC Genom. 2024, 25, 287. [Google Scholar] [CrossRef] [PubMed]
- Petrungaro, G.; Fink, T.; Fernando, B.; Ansmann, G.; et al. Function-specific epistasis shapes evolutionary trajectories towards antibiotic resistance. Nat. Commun. 2026, 17, 7564. [Google Scholar] [CrossRef] [PubMed]
- Ransom, E. M.; Potter, R. F.; Dantas, G.; amp; Burnham, C.-A. D. Genomic prediction of antimicrobial resistance: Ready or not, here it comes! Clin. Chem. 2020, 66(10), 1278–1289. [Google Scholar] [CrossRef] [PubMed]
- Reichert, E.; Yaesoubi, R.; Rönn, M. M.; Gift, T. L.; Salomon, J. A.; amp; Grad, Y. H. Resistance-minimising strategies for introducing a novel antibiotic for gonorrhoea treatment: A mathematical modelling study. Lancet Microbe 2023, 4(10), e781–e789. [Google Scholar] [CrossRef] [PubMed]
- Robinson, R. E.; Gebhardt, M. J.; amp; Goldberg, J. B. The interplay between temperature and growth phase shapes the transcriptional landscape of Pseudomonas aeruginosa. J. Bacteriol. 2026, 208, e00385-25. [Google Scholar] [CrossRef] [PubMed]
- Schubert, B.; Maddamsetti, R.; Nyman, J.; Farhat, M. R.; amp; Marks, D. S. Genome-wide discovery of epistatic loci affecting antibiotic resistance in Neisseria gonorrhoeae using evolutionary couplings. Nat. Microbiol. 2019, 4, 328–338. [Google Scholar] [CrossRef] [PubMed]
- Shahreen, N.; Shahid, S. A.; Subhani, M.; Al-Siyabi, A.; amp; Saha, R. Minimal gene signatures enable high-accuracy prediction of antibiotic resistance in Pseudomonas aeruginosa. npj Syst. Biol. Appl. 2025, 11, 108. [Google Scholar] [CrossRef] [PubMed]
- Snitkin, E. S.; Won, S.; Pirani, A.; Lapp, Z.; Weinstein, R. A.; Lolans, K.; amp; Hayden, M. K. Integrated genomic and interfacility patient-transfer data reveal the transmission pathways of multidrug-resistant Klebsiella pneumoniae in a regional outbreak. Sci. Transl. Med. 2017, 9(417), eaan0093. [Google Scholar] [CrossRef] [PubMed]
- Verschuuren, T.; Bosch, T.; Mascaro, V.; Willems, R.; amp; Kluytmans, J. External validation of WGS-based antimicrobial susceptibility prediction tools, KOVER-AMR and ResFinder 4.1, for Escherichia coli clinical isolates. Clin. Microbiol. Infect. 2022, 28(11), 1465–1470. [Google Scholar] [CrossRef] [PubMed]
- Wiatrak, M.; Weimann, A.; Dinan, A. M.; Brbić, M.; amp; Floto, R. A. Sequence-based modelling of bacterial genomes enables accurate antibiotic resistance prediction [Preprint; bioRxiv, 2024. [Google Scholar] [CrossRef]
- World Health Organization; Food and Agriculture Organization of the United Nations; United Nations Environment Programme; amp; World Organisation for Animal Health. Quadripartite guidance on One Health integrated surveillance of antimicrobial resistance and use. 2026. Available online: https://www.who.int/publications/b/79427.
- World Health Organization. GLASS whole-genome sequencing for surveillance of antimicrobial resistance. 2020. Available online: https://www.who.int/publications/i/item/9789240011007.
- World Health Organization. Global antimicrobial resistance and use surveillance system (GLASS) report: 2022. 2022. Available online: https://www.who.int/publications-detail.
- World Health Organization. GLASS manual for antimicrobial resistance surveillance in common bacteria causing human infection. 2023. Available online: https://www.who.int/publications/i/item/9789240076600.
- World Health Organization. WHO bacterial priority pathogens list, 2024: Bacterial pathogens of public health importance to guide research, development, and strategies to prevent and control antimicrobial resistance. 2024. Available online: https://www.who.int/publications/i/item/9789240093461.
- Yasir, M.; Karim, A. M.; Malik, S. K.; Bajaffer, A. A.; amp; Azhar, E. I. Application of decision-tree-based machine learning algorithms for prediction of antimicrobial resistance. Antibiotics 2022, 11(11), 1593. [Google Scholar] [CrossRef] [PubMed]
- Yu, Y.; Wheeler, N. E.; amp; Barquist, L. Biased sampling driven by bacterial population structure confounds machine learning prediction of antimicrobial resistance. PLoS Biol. 2025, 23(12), e3003539. [Google Scholar] [CrossRef] [PubMed]
- Zhang, Y.-F.; Han, K.; Chandler, C. E.; Tjaden, B.; Ernst, R. K.; amp; Lory, S. Probing the sRNA regulatory landscape of Pseudomonas aeruginosa: Post-transcriptional control of determinants of pathogenicity and antibiotic susceptibility. Mol. Microbiol. 2017, 106(6), 919–937. [Google Scholar] [CrossRef] [PubMed]
Disclaimer/Publisher’s Note: The statements, opinions and data contained in all publications are solely those of the individual author(s) and contributor(s) and not of MDPI and/or the editor(s). MDPI and/or the editor(s) disclaim responsibility for any injury to people or property resulting from any ideas, methods, instructions or products referred to in the content. |
© 2026 by the authors. Licensee MDPI, Basel, Switzerland. This article is an open access article distributed under the terms and conditions of the Creative Commons Attribution (CC BY) license (http://creativecommons.org/licenses/by/4.0/).
Copyright: This open access article is published under a Creative Commons CC BY 4.0 license, which permit the free download, distribution, and reuse, provided that the author and preprint are cited in any reuse.