
Submitted:
13 October 2026
Posted:
14 October 2026
You are already at the latest version
Abstract
This study presents results from comprehensive investigations of scapolite samples exhibiting natural or thermally induced photoluminescence. A range of analytical techniques, including single-crystal X-ray diffraction, Fourier transform infrared spectroscopy, Raman spectroscopy, photoluminescence spectroscopy and electron paramagnetic resonance spectroscopy was employed to characterize sulphur-related defect centers within the scapolite anionic cages. Differential scanning calorimetry combined with thermogravimetry and mass spectrometry was used to analyze the stages of degassing and quantify the volatile components. A new interpretation of the electron density distribution within the scapolite anionic cage has been proposed. This enables the localization of possible precursors of S2•- radicals, the later acting as luminescent centers. Key parameters, including atomic positions, occupancies, and bond lengths, were determined for the newly observed moieties. Furthermore, a novel methodology approach was developed to quantify SO42- and CO32- ratios in the structure based on the occupancy of their oxygen sites. Finally, the conditions necessary for the formation of persistent S2•- radicals in fluorescent scapolites were discussed, with an emphasis on the required cationic environment and charge-transfer conditions.
Keywords:
scapolite
; photoluminescence
; thermally induced luminescence
; sulphur-related defects
1. Introduction
Minerals of the scapolite group are common rock-forming aluminosilicates that occur in a wide variety of metamorphic and altered igneous rocks. Their wide distribution in metamorphic terrains as well as their high stability over a wide range of pressures and temperatures makes scapolites potential geothermometers and geobarometers, providing the opportunity to obtain information on the redox potential Eh (from Fen+ valence) and pH (from anion speciation) of their formation [1]. Scapolites store volatiles in the lower crust and upper mantle and are indicators of the activities of the volatile components indicating that they may play a natural role in the capture and storage of greenhouse gases [2]. In the second half of the 20th century, it was widely accepted that natural scapolites form a solid-solution series between the two theoretical end-members: Na4Al3Si9O24Cl (marialite) and Ca4A16Si6O24CO3 (meionite). In 1998, a third end-member of this group of minerals has been approved under the name silvialite – Ca4A16Si6O24SO4 [3].
In recent years, in connection with the preparation of new functional materials, researchers have paid increasing attention to materials that exhibit photochromism and/or photoluminescence. Such phenomena are observed in some of the members of the scapolite group as well as in some of the crystallo-chemically related feldspathoids of the cancrinite and sodalite groups [4,5,6,7,8,9]. The interpretation that yellow–orange emission in natural and synthetic scapolite involves (di)sulphide radicals incorporated in the crystal structure and forming photoluminescence centers is increasingly supported by experimental and theoretical evidence [5,6,10,11,12,13] .
Previous studies on scapolite samples from Bulgarian localities as well as from some world-famous deposits of the mineral such as Slyudyanka (Ural, Russia) and Madagascar (private collection) address issues related to the choice of space group for these compounds [14]. Results of preliminary mineralogical characterization of scapolite exhibiting characteristic yellow photoluminescence under long-wave ultraviolet light (LW UL) from Central Rhodopes, Bulgaria were recently reported [15]. These findings initiated further single-crystal X-ray diffraction (SCXRD) experiments, aiming at elucidating the structural origin of luminescence of scapolites. Special attention was paid to the extra-framework species and in particular, to the atomic configurations in the anionic part of these compounds, which were supposed to contain the sulphur species responsible for the observed phenomenon. New interpretations of the observed electron densities have been made, which has led to revisions of our previous approach in specifying the anionic species in the scapolite crystal structure.
The present work reports results of comprehensive studies of natural scapolite samples from Bulgarian deposits, that exhibit natural or thermally induced photoluminescence. The SCXRD studies play a key role and aim to provide possible evidence and information for the presence, orientation, and geometry of sulphur dimers in the scapolite structures. A combination of spectroscopic methods was further employed to search for sulphur-related defect centers located in the extra-framework cage: Infrared (IR) absorption, Raman scattering, photoluminescence (PL) emission, and electron paramagnetic resonance (EPR). Differential Scanning Calorimetry – Thermogravimetry (DSC-TG), accompanied by mass spectroscopic (MS) data, provide information about the type, stages of separation, and quantitative relationships of the volatile components in the studied samples.
2. Previous Works
2.1. General Notes on the Crystal Chemistry of Scapolites
The general formula of this mineral group is M4[T12O24]A. M designates interstitial framework cations (IFCs)-type cations, which are predominantly Са2+ and Na+ but may also consist of K+, Mg2+, Sr2+, Ba2+, and traces of other elements such as Fe2+, Mn2+ etc. T stands for tetrahedrally coordinated cations, which are mainly Si4+ and Аl3+, and less commonly Fe3+ [16]. Together with the framework oxygen atoms, this group of cations is further on designated as framework atoms (FRAs). A is represented by an impressive diversity of negative ions, anionic groups, molecules and radicals. These are most often Cl−, (CO3)2− and (SO4)2−, hydrogen can also be present in various forms such as HCO3−, HSO4−, OH−, H2O, etc. [17]. The presence of S2•- centers, which are responsible for the yellow fluorescence of scapolite, has been reported [18]. These species are further on designated as interstitial framework anions (IFAs). There are three types of heterovalent isomorphism for scapolite group members, generally represented as follows: Si⇿Al (FRAs); Ca⇿Na (IFCs) and CO3⇿SO4⇿Cl (IFAs). Relations between the three schemes are not always explicit and unambiguous, but essentially, their joint manifestation leads to electroneutrality. The meionite component (Me, %) of scapolite on the marialite-meionite series was defined as Me% = 100xCa/(Na + Ca) [19], which is still in active use by researchers.
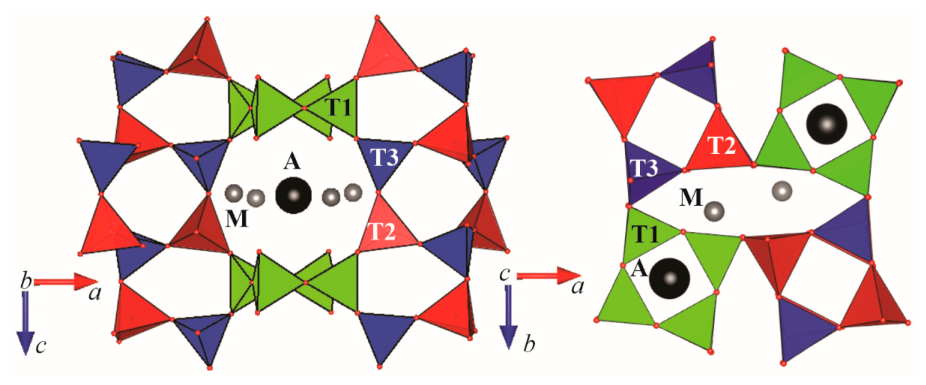
In a simplified version, the crystal structure of scapolites can be represented as composed of a [T12O24] framework, containing eight- and four-membered rings of tetrahedra. IFCs are located in oval-shaped channels, formed by the eight-membered rings; IFAs inhibit channels formed by the four-membered rings. Together IFCs and IFAs occupy space in and around center of the scapolite anion cage (SAC) [20,21] (Fig. 1).
Typically, scapolite crystal structure is described in tetragonal I4/m or P42/n space groups. Recent studies, however, give reason to assume that a more correct choice of space group for describing the structures in the entire range of scalpolites is P42/n [14]. Materials and Methods should be described with sufficient detail to allow others to replicate and build on the published results. Please note that the publication of your manuscript implies that you must make all materials, data, computer code, and protocols associated with the publication available to readers. Please disclose at the submission stage any restrictions on the availability of materials or information. New methods and protocols should be described in detail while well-established methods can be briefly described and appropriately cited.
Figure 1.
View of scapolite anion cage containing the interstitial framework cations (M) and anions (A) [14].
Figure 1.
View of scapolite anion cage containing the interstitial framework cations (M) and anions (A) [14].
2.2. Approaches for Solving the Crystal Structures of Scapolites from X-Ray Diffraction Data
Pauling proposed the first model for the crystal structure of scapolite [22]. Тhe research groups that had devoted efforts to solving the crystal structures of various members of this group of minerals are listed by [16]. A brief overview of the approaches to address the challenges of the scapolite structure related to the three groups of atoms (FRAs, IFCs, and IFAs) is given below:
- (i)
- Framework atoms (FRAs) - determination of the Si/Al ratio. Since the scattering factors of silicon (Z = 14) and aluminium (Z = 13) are similar, it is well known that the XRD method cannot be used directly to refine the T-site occupancies. Instead, the difference in ionic radius between tetrahedrally coordinated aluminium and silicon is used, as this directly affects the T–O bond lengths and therefore the Si and Al occupancies at each tetrahedral site can be evaluated and assigned [14]. Besides, the FRAs' crystallographic sites of scapolite are assumed to be fully occupied (100%).
- (ii)
- Interstitial framework cations (IFCs) – population and occupancy. Various factors influencing the IFCs characteristics were reported [14,16,23,24,25]. The usual practice is to fix the occupancy of these cation sites according to their chemical composition, as determined by independent analytical methods. The presence of vacances cannot be ruled out [16]. Sometimes, when processing chemical analyses, certain negligible amounts of detected di- and monovalent extra-framework cations together with possible vacancies have been treated as a monovalent fictive cation M+ in the structure refinements [14].
- (iii)
- Interstitial framework anions (IFAs) - atomic model derivation. It is adopted to present the contents of C, Cl, and S obtained by chemical analyses as CO₃²⁻, Cl⁻, and SO₄²⁻. Because electron microprobe (EMP) carbon measurements are prone to contamination, carbon content is typically calculated using charge balance or simplified empirical formulas SCXRD studies indicate that anionic groups are located in SAC [14,16,20,21,25,26,27,28,29].
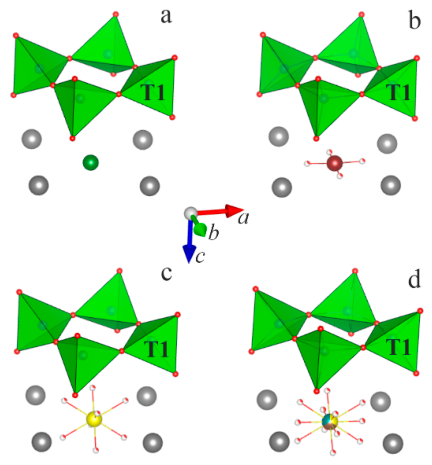
In predominantly chlorine-containing samples, a single Wyckoff position (2a or 2b) is identified in the electron density distribution map (Fig. 2a). In carbonate- or sulphate-bearing samples, additional electron density appears around this axis, lying on or outside the plane perpendicular to the four-fold axis and at distances corresponding to C–O or S–O bonds in carbonate or sulphate groups. Such distribution of electron density in SAC is interpreted as follows: In the position lying on the four-membered axis chlorine, carbon or sulphur are positioned, and in the positions located around the four-membered axis, the carbonate and sulphate oxygen atoms are placed (Fig. 2b,c). This interpretation cannot account for the trigonal symmetry of the carbonate group. A model was proposed in which the carbon atom is slightly offset by about 0.3 Å from the four-fold axis, and in addition the density located at a distance of 1.35 Å from the carbon is distributed over three symmetry-independent positions, so as to obtain four carbonate groups around the four-fold axis [21,26]. This structural model requires fixing the geometric parameters of the carbonate group during refinement. It is important to note, however, that in the majority of published crystal structures, no splitting of either the central or oxygen positions is reported, e.g., in the structure of natural silvialite [3].
Figure 2.
Atomic configurations characteristic of the A-position and its vicinity in the structure of scapolite; a) – Cl- (green); b) – CO32- (C - brown); c) – SO42- (S - yellow); d) – combined view of all species. Other designations and crystallographic orientation are similar to those in Figure 1.
2.3. Cause for the Yellow-Orange Photoluminescence of Scapolites
The coloration and luminescent properties of scapolites have long attracted the attention of both jewelers and researchers seeking to unravel the mechanisms that cause them. In one of the early reports on this subject, Shaw suggested that the strong fluorescence of the yellow scapolite from Grenville, Quebec was due to the presence of small amounts of uranium, which is the activating agent [19]. Over the years, it has been established that, even with low contents, other extra-framework cations (Fe3+, Mn2+, Ce3+) can also cause luminescence of various colors [8,9]. Recently, more researchers have come together around the opinion that the characteristic yellow-orange photoluminescence of scapolites is associated with S2•- centers [10,18,30]. In 2008, Sidike et al. reported that the relative efficiency of yellow photoluminescence from natural scapolite sample investigated by them was increased up to 117 times by heat treatment at 1000 °C for 2 h in air. The enhancement of yellow photoluminescence was ascribed to the alteration of SO32- and SO42- to S2•- [18].
Important characteristics of such sulphur dimers (either S22- or S2•-) having direct relevance to the present studies, are: (i) position, (ii) quantity, (iii) orientation, and (iv) S-S bond length in scapolite structures.
(i) Typically, SACs are accepted as the location of S2•- centers. The latter are surrounded by IFCs being in a square configuration (IFCs square).
(ii) So far, no specific data have been reported on the concentrations of sulphur dimers in the structures of natural scapolites exhibiting yellow photoluminescence. Possible reasons for this are: low amounts of the registered element; possibility of the co-presence of several sulphur species; previously applied methodologies for determining IFAs by SCXRD. One should always take into account general considerations for photoluminescence activator’s concentrations, the increase of which can lead to enhancement of this phenomenon, as already have been observed [18]. It is however also possible to come to a “concentration quenching” and inhibition of the photoluminescence.
(iii) Two very different views have been reported regarding the structural orientation of the sulphur dimer in scapolites. One of them presented the S2•- centers in an anion cage as S-S pairs that lie along the diagonal of the IFCs square planes [18,31]. The other one states that this is incorrect and the sulphur dimer is located perpendicular to the IFCs square [10].
(iv) The S-S bond lengths for S2•- species in natural and synthetic scapolites were calculated using the vibronic structure of the emission spectra applying Steudel’s formula [10,13]. The obtained values fall within the range of 1.99–2.04 Å (mean value 2.02 Å). Data for interatomic distances in the sulphur dimer in other inorganic compounds can be obtained by calculations or direct measurements. For example, values in the range ~ 2.03 to ~ 2.36 Å with the caveat that they depend strongly on the nature of the countercation and on the physical properties of the crystal were reported [32]. Distances varying from 2.1 to 2.4 Å were measured for monoclinic lazurite containing several sulphur species such as SO42-, SO2, and S2 groups [33]. A S−S (S22-) bond length of 2.13 Å was reported for S-doped sodalites [11]. The authors, however, noted that under UV irradiation charge transfer occurred and that the optimized geometry revealed a shorter S−S distance (2.00 Å).
3. Materials and Methods
3.1. Materials and Heat Treatment Procedure
In this work, natural scapolite samples from two localities situated in the Rila-Rhodope massif in Bulgaria, were investigated. These are Urdini lakes (UL) in Northwestern Rila Mtn. (Me~70%) [34] and Mishevsko (Msh), Central Rhodopes (Ме>60%) [15]. While the UL samples are massive and relatively homogeneous in composition (plagioclase and zeolite below 10%), the Msh scapolites are highly fractured and intimately intergrown with other phases such as diopside, plagioclase and calcite (total up to 50%).
The untreated Msh samples exhibit characteristic yellow photoluminescence under LW UV excitation, whereas the untreated samples from UL show no detectable photoluminescence under the same conditions. Thermal treatment of samples from both localities was undertaken in accordance with Sidike's work in an attempt to verify the proposed by the authors sulphur species alteration [18]. Therefore, the heat treatment was performed in Carbolite Gero CWF 1300 laboratory chamber furnaces at 1000 °C for 1 h in air at heating rate 10 °C/min and sample weights of 1-5 g. After heating, the samples from Urdini Lakes developed yellow photoluminescence under UV excitation, with luminescent areas constituting less than 20%. The induced luminescent state is persistent and, in the present case, has remained observable for more than five months after thermal treatment.
3.2. Single-Crystal X-Ray Diffraction (SCXRD) Analyses
Single-crystal analyses were performed on at least 10 heated and unheated samples from each locality. Crystals with dimensions of approximately 0.05x0.05x0.05 mm, were mounted on a glass capillary and used for single-crystal diffraction analysis. All the measured Msh crystals and only part of the heated UL exhibit photoluminescence. Data collection experiments were performed on a Bruker D8 Venture diffractometer, MoKα(0.7107Å), both at room temperature (RT, 273K) and low temperature (LT, 150K) conditions. The determination of unit cell parameters, data integration, scaling and absorption corrections were performed using the APEX4 software package. All the crystal structures were solved by direct methods and refined by full-matrix least squares methods on F2 using SHELXT software program [35].
In the present work, particular attention was focused on the most reliable determination of the positions and quantitative ratios of the anionic components. Our approach was based on consistency with the experimental electron density distribution, while minimizing the use of constraints in the structural model. The following considerations were taken into account when positioning the anionic components: All atoms building up the structure of scapolite, except for the oxygen atoms in the carbonate group, are subject to tetragonal symmetry. The latter however contribute negligibly little to the value of the structure factors, because they are a very small part of the stoichiometric formula of scapolite and even in the ideal case, Ca4Al6Si6O24CO3, represent 5% by weight. Accordingly, when calculating the electron density distribution map based on the experimental data, the information about the trigonal symmetry of the carbonate oxygen atoms remains “masked” by the impact of the rest of atoms; Chlorine, carbonate carbon, and sulphate sulphur atoms occupy one and the same crystallographic site – A-position.
The steps we have followed to determine and refine the crystal structure are listed below. Explanations are also provided. At each step the parameters from the previous one keeps to be refined.
(i) From the initial electron density distribution map, the positions of FRAs, IFCs, the position of the central atom of the anionic groups as well as those ones of the oxygen atoms of the IFAs species (e.g., CO32- and SO42-) have been assigned. In this step structural model, only Si, Ca, and Cl for the FRA cations, IFCs, the central atom of the anionic groups, respectively have been used. Further procedure includes refinement of all atomic positions and the occupancies of IFCs and IFAs sites assuming unity for all FRAs positions. The refined occupancies invariably fall below 100%.
(ii) The Al/Si ratio in the three symmetrically independent tetrahedra (solely P42/n used) has been fixed in compliance with the measured averaged T–O distances. Upon acceptance of 100 % occupancy for the IFCs positions further on the Ca/Na ratio has been refined.
(iii) Chlorine, carbon, and sulphur have been placed in A-position. The initial amounts of carbon and sulphur have been determined in accordance to the obtained in the previous step occupancies of the surrounding oxygen atoms. In a couple of cycles, anisotropic displacement parameters of FRAs and IFCs as well as the amounts of Cl, CO32, and SO42- have been refined. As a result, it has been found that the A-position in all of the studied samples is filled to about 80-90% and residual electron density (1-1.5 e- Å-3) has now been observed at a distance of 1.06-1.15 Å from the central A-position. Such positive peak values are borderline. This suggests either their disregard as a possible atomic position or assignment to a specific species.
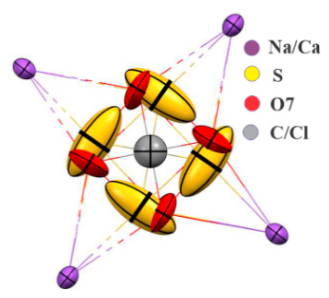
(iv) In accordance with the results of other analytical methods, our choice is to place sulphur in this position. The tetragonal symmetry of the studied object predetermines four such symmetry-equivalent sites confined to the ab-plane. For the selected samples, the distance between opposite positions in this configuration varies from 2.1 to 2.3 Å. This geometry is best described by the presence of a sulphur dimer (S22– or S2•-). The final refinement includes isotropic displacement parameters and the occupancy of this position. We only refined the isotropic parameters for this position because the anisotropic parameters showed significantly higher values than those of the other atoms in the structure. However, it is worth noting that in all studied samples, the thermal ellipsoids at this position are strongly elongated along a diagonal of the IFCs square (Fig. 3). Such behaviour can be explained by atomic disorder at these positions. Assuming the presence of S2 species, the elongation of the ellipsoids may indicate dimers with significant variations in S–S bond length.
Structural data for the discussed below samples are available in the Cambridge Structural Database: CSD 2581398-2581405.
Figure 3.
Displacement ellipsoids of IFAs and IFCs for the untreated Msh sample.
3.3. Photoluminescence Spectroscopy (PL)
Samples from natural, thermally untreated Mishevsko (photoluminescent) and Urdini Lakes (non-luminescent), as well as heated photoluminescent scapolites from both localities, were analyzed. Photoluminescence (PL) emission and excitation spectra for all samples were measured at room temperature with a Spectrofluorometer FluoroLog3-22, 2014 (Horiba Jobin-Yvon).
3.4. Electron Paramagnetic Resonance (EPR)
Samples of natural, untreated scapolites from Mishevsko (photoluminescent) and the Urdini Lakes (non-luminescent) were analyzed. Samples from both localities heated to 1000 °C were also analyzed, with a photoluminescent specimen selected from the Urdini Lakes. The EPR analysis was performed on a Bruker BioSpin EMXplus10/12 instrument (Karlsruhe, Germany). All measurements were conducted in the X-band at a frequency of electromagnetic radiation 9.45 GHz. For low-temperature measurements, the temperature-variable system ER4141VTM was used. The UV irradiation experiment was carried out using a 100 W Hg lamp (type LSB610).
3.5. Vibrational Spectroscopy
Fourier-transform infrared (FTIR) spectra of powdered samples of natural, untreated scapolites from Mishevsko (photoluminescent) and the Urdini Lakes (non-luminescent) were recorded using a Bruker Tensor 37 spectrometer in the spectral range of 400–4000 cm−1 with a spectral resolution of 4 cm−1. Spectra were acquired from KBr pellets by averaging 128 scans.
Raman spectra of the same samples were collected from polished sections using a LabRAM HR Raman spectrometer (Horiba Jobin Yvon) equipped with an Olympus BH2 microscope. Measurements were performed on spots approximately 2 μm in diameter using a 633 nm He–Ne laser. Spectra were recorded in backscattering geometry with a 50× objective over the spectral range of 100–1200 cm−1. Spectral processing and figure preparation were carried out using OriginPro 9.0 software (OriginLab Corporation, Northampton, MA, USA).
3.6. Thermal Analyses (DSC-TG) — Mass Spectrometry (MS)
The thermal behavior of untreated samples from both localities was investigated using DSC-TG analyzer SETSYS2400, SETARAM in the following conditions: atmosphere of Ar flow (30 mL min−1); heating rate of 10 ° min−1. About 10 mg of each sample were placed in a corundum crucible, and another empty crucible was used as a reference. Empty crucible run for baseline slope correction of both experimental DSC and TG signals at the same set profile was applied. Simultaneous analysis for detection and quantification of the evolved gases was performed via mass spectrometer OmniStarTM PFEIFFER, coupled to the DSC-TG analyzer by a transfer line heated to 180 °C. The intensities related to the mass-to-charge ratio (m/z) value of the following species: OH— (17), CO2 (44), Cl— (34, 35) and SO2(64) were examined. Specialized CALISTO thermal analysis software was used for conducting the experiments and data processing.
4. Results and Discussion
4.1. Single-Crystal X-Ray Diffraction (SCXRD) Analyses
Table 1 and Table 2 present the main parameters of the single-crystal diffraction experiments, reliability factors and structural parameters of representative samples of the studied materials. Laboratory untreated samples from both localities were measured at low (Msh-LT and UL-LT) and room (Msh-RT and UL-RT) temperatures. Heated samples were measured at room temperature. Two samples from Mishevsko – containing (Msh-H1-RT) and not containing (Msh-H1-RT) SO42- - groups and two samples from Urdini Lakes – exhibiting (UL-H1-RT) and not exhibiting (UL-H2-RT) luminescence are presented (Table 2). The obtained stoichiometric formulas correspond to the reported previously chemical analyses data [14,15,34] and define the samples from both localities as meionites in the range Me57 – Me71. Chlorine content varying from 0.08-0.24 apfu is higher for the samples from Mishevsko, whereas for Urdini Lakes Cl is about 0.04 apfu. Sulphate groups present in all studied samples from Urdini Lakes and in only one of the measured samples from Mishevsko. Sulphur dimers were identified in all studied samples, with the highest contents noted for Mishevsko. Regarding the charge imbalance, we can comment that in some samples an excess of positive charge is observed, which may be an indication for the presence of vacancies among the IFCs instead of the full occupancy of these positions assumed in this study. OH— groups, the presence of which can be verified by the results of the thermal - mass spectroscopic and IR analyses, can probably compensate the observed excess of negative charge. The unit cell volumes for Mishevsko samples are larger than those from Urdini Lakes.
The distances and angles characterizing the geometry of the aluminosilicate framework are comparable to those of previously described natural scapolites crystal structures. Table 3 and Table 4 list the geometric parameters of the atomic species populating the SACs. The following notations are used in the studied structures: S - sulphur in the A-position (SO4); S1 – dimer sulphur; O7 – oxygen of the CO3 group; O8 and O9 – oxygen of the SO4 group.
Carbon-oxygen distances of 1.33 – 1.34 Å are typical of carbonate group (Table 3 and Table 4). Slight elongation of this bond is observed in the heated samples. Distances of about 1.5 Å and O8-S-O8 and O9-S-O9 angles close to 109° suggest the presence of SO4 groups for the following samples: Msh-H1-RT, UL-LT, UL-H2-RT. Significant deviations from these values have been observed for UL-RT and UL-H1-RT. Similar deviations, especially with regard to the angles in the sulphate tetrahedron, have been found in already published structures of natural scapolites [16]. A possible explanation is the presence of other suphur species in SACs. The S1-S1 distance varies and for individual samples its decrease is observed in heated samples. This can be explained with an increase of the (S2•-) radical amount at the expense of S22– ions. Similar considerations have been made by [11].
The data from Table 1, Table 2, Table 3 and Table 4 illustrate a relatively wide range of compositions of the studied scapolites even within a single locality. This is particularly true for the species populating the SACs. For IFAs, the picture is further complicated by the species diversity and their low contents. This makes correct identification and quantification based on X-ray diffraction data a non-routine task, often requiring additional information obtained through other analytical methods. The proposed here refinement approach allows for more precise determination of the amount and type of anionic groups as well as of the possible positions of the S-S dimers.
The items below are those that we believe deserve attention in the structural determination of scapolites.
(i) Upon refinement of the CO3 group, we do not apply the model proposed by [21,26], because it does not correspond to our experimental data. This model suggests a displacement of the carbon atom from the central A-position and three equally occupied positions for its oxygen atoms. We do not observe a displacement of the carbon atom from the A-position, nor do we find suitable oxygen positions for the disordered CO3 group. Instead, in the ab-plane, we identify two different electron density maxima distanced at approx. 1.35 and 1.1 Å from the center of the SAC, correspondingly. Based on their parameters, the first one is ascribed to the oxygen atoms surrounding a carbon atom located at the A-position and we further on designate them as O7. The other is identified as S1, indicating the possible position of the sulphur dimer within the structure. Therefore, our model does not require constraints to satisfy the equivalence conditions for angles, distances, and site occupancies in the CO3 group.
(ii) The presented approach has also been applied to samples of natural scapolites from other Bulgarian localities, as well as from some world-famous deposits of the mineral such as Slyudyanka (Ural, Russia) and Madagascar. For all of them, with the exception of the latter locality, a low residual electron density was found at a distance of about 1.05-1.15 Å from the central A-position, which in this work we denote as S1. It can only be surmised that similar electron density was observed at the indicated location in previous studies as well, but the authors designated it as the position of an oxygen atom from a disordered CO3 group.
(iii) The presence of SO₄²⁻ groups can be reliably established by the manifestation of the appropriate electron density outside the ab-plane. It is supposed to correspond to the characteristic tetrahedral configuration of the oxygen atoms. Due to its low content and doubt of its existence, a good indicator of its presence is the direction of elongation of the thermal ellipsoids of the oxygen atoms from the carbonate group along the c-axis.
4.2. Photoluminescence Spectroscopy (PL)
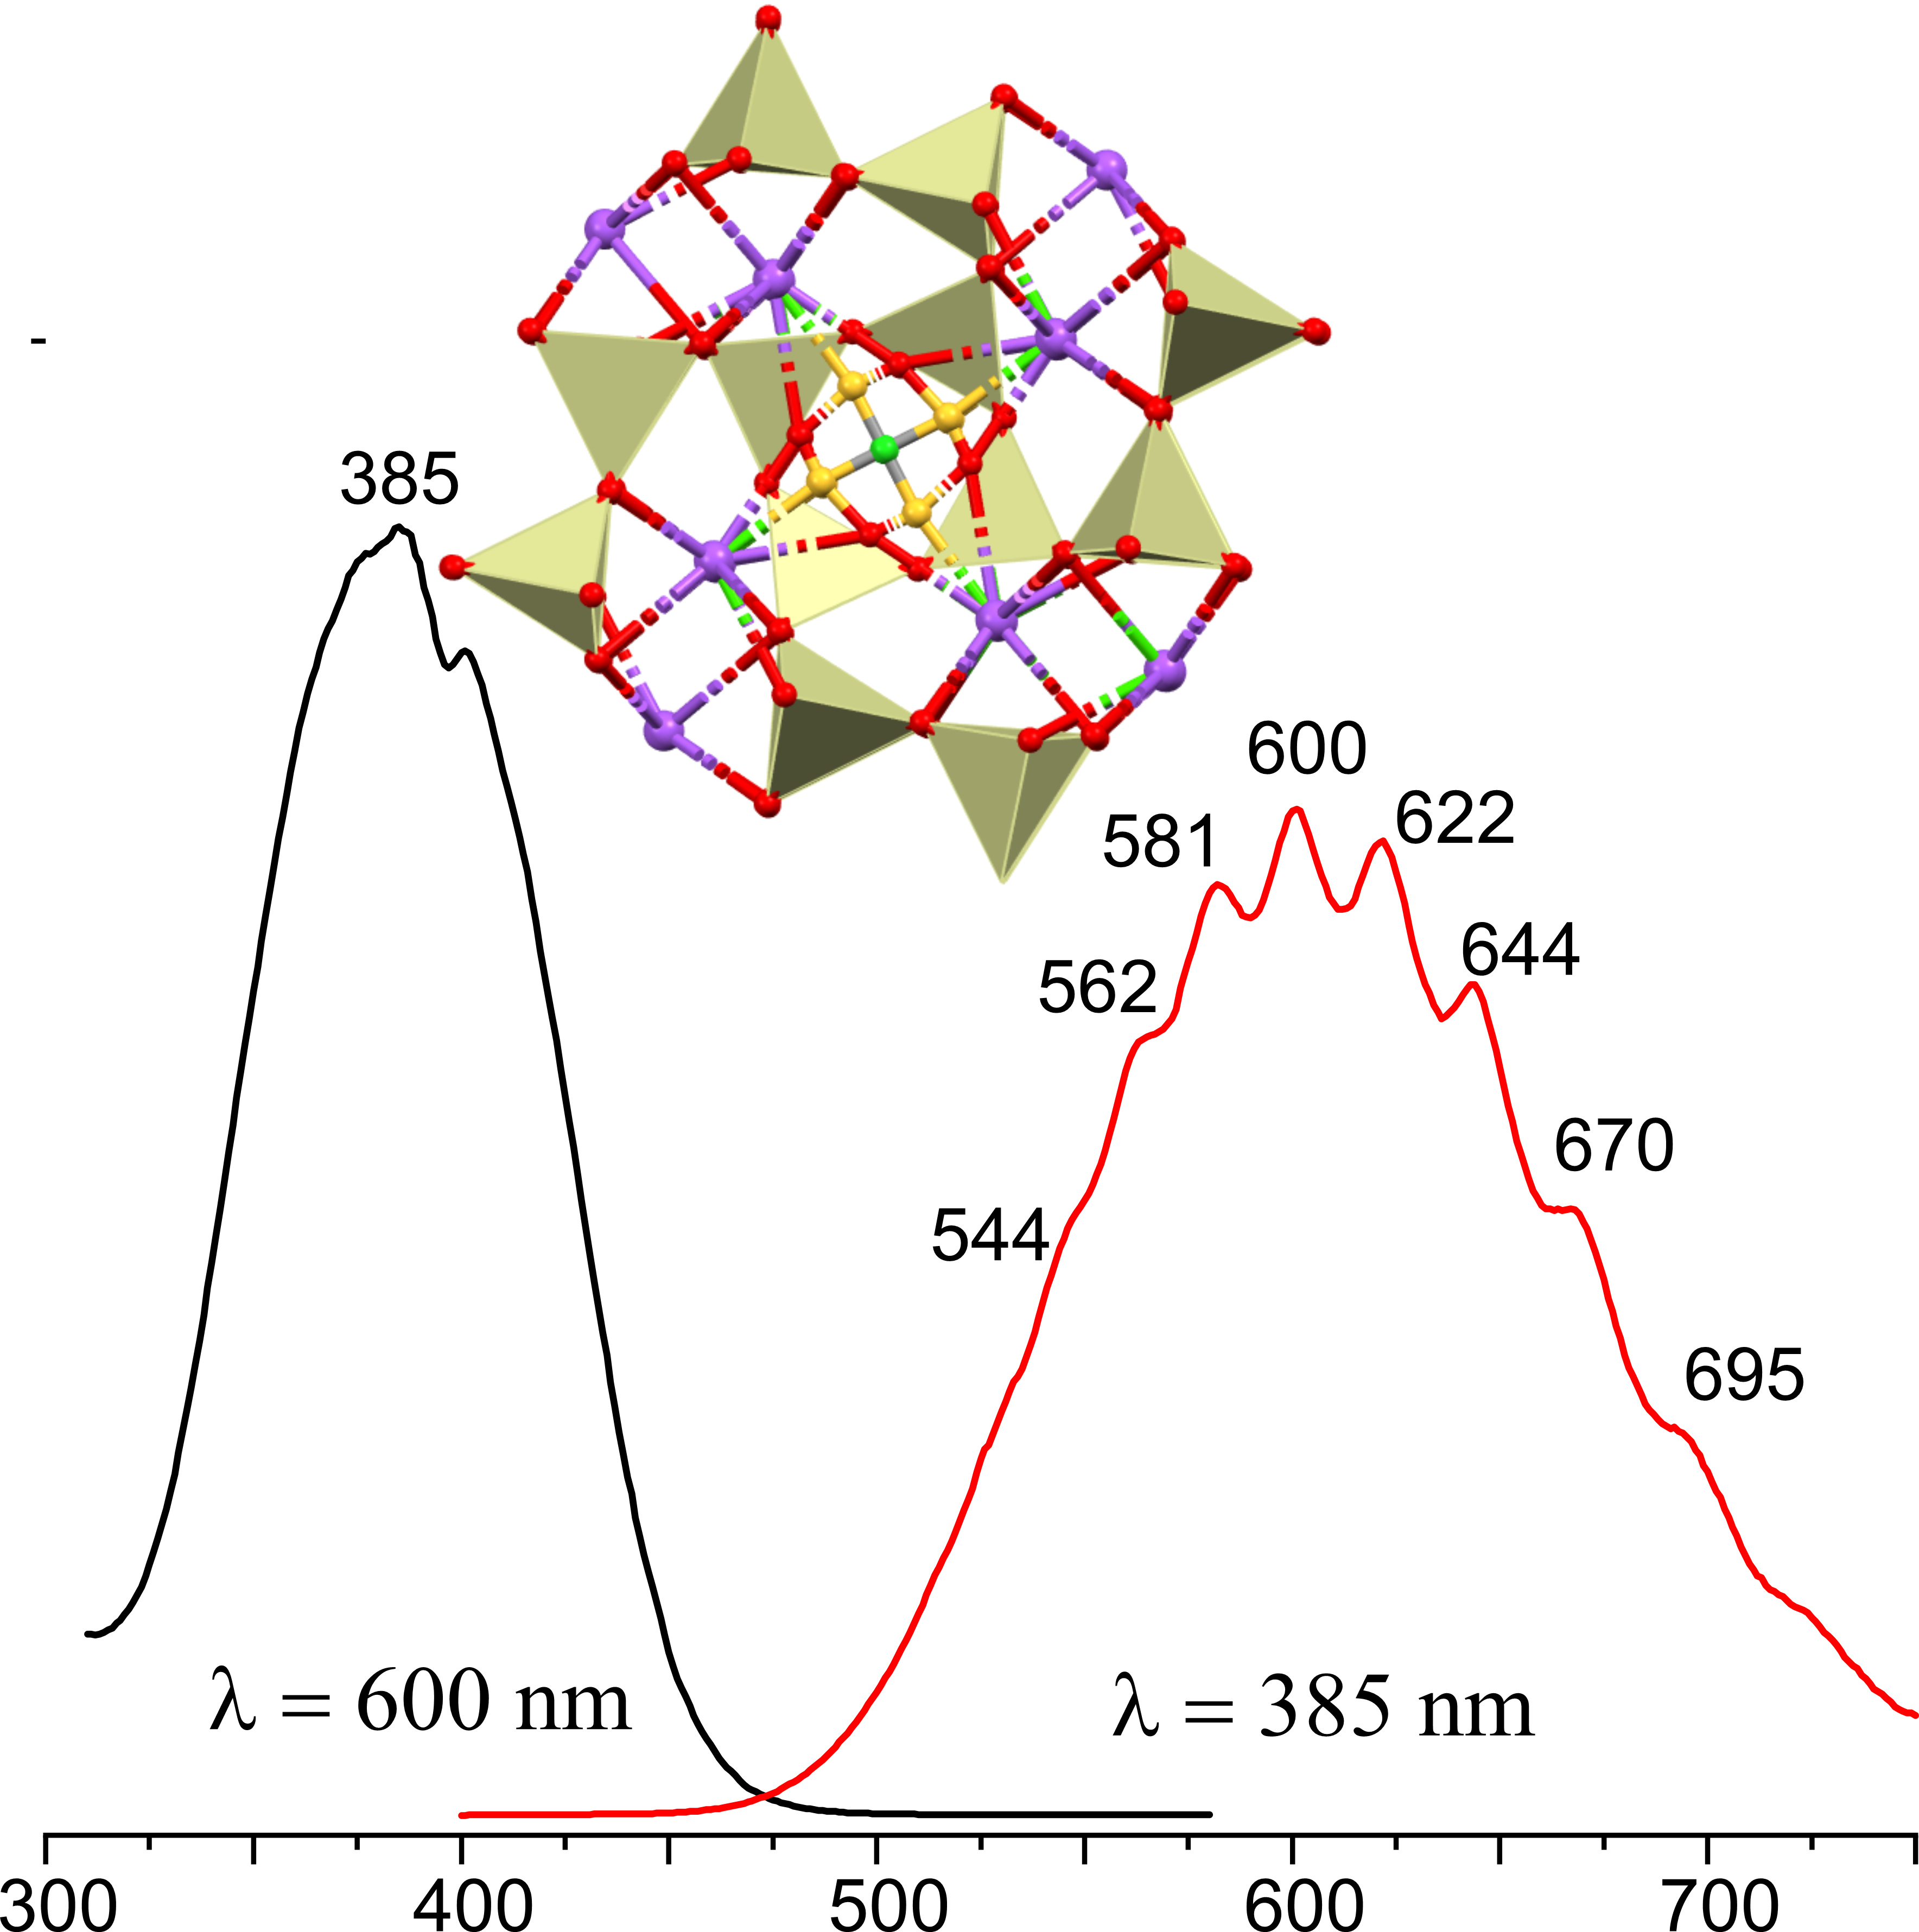
The excitation spectra at 600 nm emission wavelength and the fluorescent emission at 385 nm excitation at room temperature of the three scapolite samples: natural scapolite from Mishevsko, and thermally treated at 1000 °C scapolites from Mishevsko and Urdini lakes are presented in Figure 4. The excitation spectra of natural (Msh) and heat-treated (UL1000) scapolite samples are very similar with peaks at 374 nm, 385 nm, and 400 nm while in the excitation spectrum of the Msh1000 sample besides these new peaks at 413 nm and 421 nm can be noticed.
The non-emissive natural UL scapolite after temperature treatment exhibits a fluorescent emission almost identical with that of natural scapolite from Mishevsko. Both are presented by a continuous broad emission spectrum centered at 600 nm in the range between 500–740 nm. However, some of the peaks there are more clearly defined for the sample from Mishevsko. Figure 4 illustrates that upon heating the non-emissive natural UL sample begins to fluoresce and for the naturally emitting Msh sample the intensity of emitted light has increased significantly. Distinct peak at 530 nm, 545, 562, 580, 600, 621, 644, 669, 694, 723 are characteristic for Msh1000, while those peaks for UL1000 and natural Msh are not so well expressed. may be divided by subheadings. It should provide a concise and precise description of the experimental results, their interpretation, and the experimental conclusions that can be drawn.
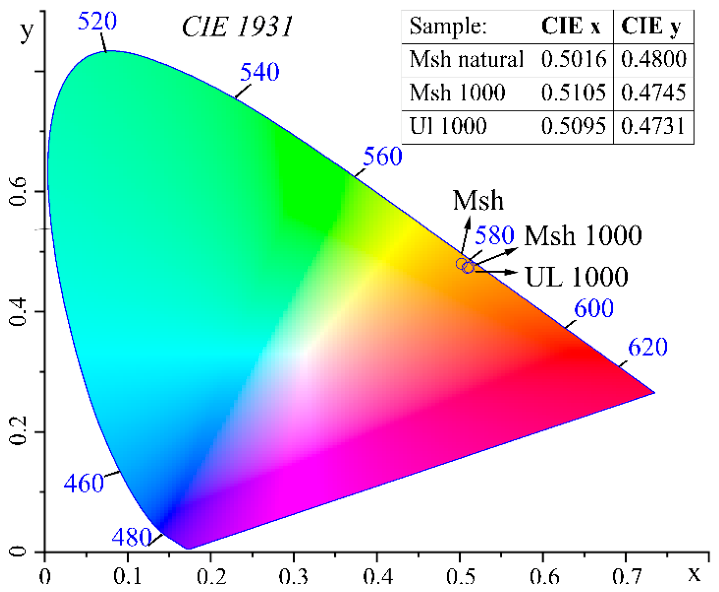
The obtained chromaticity coordinates of the samples are overlapping located in the orange part of the color space (Fig. 5).
Considering appearance of photoluminescence at UL1000 as well as the increased emission intensity observed for Msh1000 it can be assumed that the scapolite fluorescent form is more energetically advantageous and stable than the non-fluorescent one. Probably heating alters the concentration and/or electronic configuration of the luminescence centers and enhances excitonic recombination and emission.
The obtained emission spectra closely resemble those reported previously, consisting of a broad band between approximately 475 and 725 nm with a well-resolved vibronic structure [10,12,18,36]. This spectral signature is consistent with electronic transitions associated with S2•- related luminescence centers and yellow-orange emission. Based on Steudel’s formula [10,13], the S–S distances for S2•- in the studied samples were calculated (Table S1 and Table S2 in the Supplementary materials). For the Mishevsko sample, these distances range from 2.02 to 2.08 Å, while for the Urdini lakes sample, they range from 1.97 to 2.18 Å. The mean value for both samples is 2.04 Å similar to the one calculated by [10].
Figure 5.
CIE 1931 chromaticity diagram showing the color coordinates of the studied scapolite samples.
Figure 5.
CIE 1931 chromaticity diagram showing the color coordinates of the studied scapolite samples.
4.3. Electron Paramagnetic Resonance (EPR)
The EPR analyses performed aim to identify the radical species responsible for the intense yellow luminescence observed under ultraviolet irradiation. Figure 6 and Figure 7 show spectra of thermally untreated samples, while Figure 8 compares analytical data for unheated and heated samples from both localities. As seen in Figure 6, the Msh spectrum consists of six main lines accompanied by less intense satellites. These are attributed to isolated Mn2+ ions which, as evidenced by chemical analysis [15], are ubiquitously distributed throughout the mineral. The EPR spectrum is unaffected by UV radiation, implying that no photo-induced changes, specifically the generation of radical species, occur in the studied material. (Fig. 6a).
As observed in Figure 6b, the UL spectrum also contains the characteristic 6-line pattern related to isolated Mn2+ ions [34]. The comparison reveals that the lines in UL are 3-4 times broader. This broadening occurs due to less intense forbidden transition lines overlap with the main hyperfine structure (HFS) lines, indicating that Mn2+ ions in the Urdini Lakes occupy a highly distorted environment. To avoid interference from the Mn²⁺ HFS, several Msh crystalline samples were analyzed to select manganese-free materials. Figure 7 shows the Mn-free EPR spectra of about 0.1 cm-sized fragment. Four measurements were taken while rotating the quartz cuvette in the plane of the magnetic field. Consequently, two types of EPR signals emerge: at arbitrarily designated 0° and 180° orientations (which are equivalent with respect to the magnetic field vector), a signal with a g-factor of approximately 1.99–2.00 is observed. At the two adjacent orientations (90° and 270°), two distinct signals are registered, with g-factors ranging from 2.11–2.12 and 2.08–2.10 (gav~2.074) (Fig. 7).
Due to the polycrystalline nature of the sample and an approximately defined rotation angle with respect to the magnetic field, the g-factor falls within a range of values and cannot be fixed at an absolute single value.
It should be pointed out that the obtained spectra at each orientation resemble a single-crystal spectrum rather than a polycrystalline one. Such behavior arises from the not random orientation of microcrystals within the bulk segment. The superposition of all signals registered in a single fragment would form the anisotropic spectrum of a paramagnetic center. The experimentally found g-factor values are in good agreement with earlier presented values for rhombic symmetry of S•- in scapolite, namely g1=2.165, g2=1.996 (gav=2.108) [37], and alkali halide samples (gav=2.136) [38] (Table S3 in Supplementary materials). The EPR study of unheated scapolite from Mishevsko reveals the existence of monosulfide radical anion S•-, which so far has not been reported to cause luminescence.
The EPR spectrum of unheated Urdini lakes (Figure 8) possesses a signal due to CO2•-anion with axial symmetry, where gII=1.9970 and g⊥=2.0024 (gav=2.0006). These values correspond closely to those reported earlier for rhyolite after gamma irradiation – gII =1.9975, g⊥=2.0028, gav=2.0010 [39]. For comparison, the value of gav, determined for CO2•- in SrC2O4 [40] is 2.0019. It should be mentioned that a characteristic feature of the carbon dioxide anion radical is an average g-factor value lower than the free electron value, ge=2.0023.
Heating at 1000 °C in air induces changes in the scapolite from Mishevsko leading to a suppression in the intensity of Mn2+ lines and the disappearance of the anisotropic signal related to the monosulfur radical anion – S•- (gav ~ 2.074). Furthermore, a new EPR signal appears. It features an anisotropic profile with the following g-factors: g1=2.002, g2=2.004, g3=2.008. The reported signal seems to be related with the heating process because it appears in only in the thermally treated at 1000 °C samples. Although it is tempting to identify the heat-induced EPR signal as the source of luminescence, the unheated Mishevsko scapolite exhibits intense luminescence even though its spectrum is free of the suspected signal. Therefore, this signal bears no relation to the observed luminescence properties. Taking these considerations into account, we find it more reasonable to relate this signal to sulphur-centered radical anions, specifically SO2•- [41,42].
Thus, we conclude that the luminescence and the discussed here heat-induced signal are non-related phenomena. It should be noted that EPR studies on S2•- radicals were reported for various aluminosilicates, including members of the zeolite, sodalite, and cancrinite groups [10,18,30,43,44,45]. However, the g-factor values reported for the S2•- radical in scapolite are based solely on theoretical calculations [12] (Table S3 in Supplementary materials). In 2022 a signal with EPR parameters (g1=2.008 and g2=2.001) was related to a disulphide anion radical in sapozhnikovite – a mineral from the sodalite group [46]. EPR studies on yellow chromophore S2•- in ultramarine pigment, reveal a remarkably high experimentally found g-factor anisotropy, with g1 = 2.69(6), g2 = 2.03(4), g3 = 1.86(4), (giso = 2.19) [47] while computational models predict slightly higher values of g1=2.858, g2=2.034, g3=2.002, (giso=2.298) [43]. In zeolite and sodalite frameworks S2•- is associated with two-component spectra consisting of a broad and narrow lines respectively with g-factors 2.4 and 2.00 [44]. Notably, detection of this disulphide radical anion is typically restricted to temperatures ≤ 30 K due to its large anisotropy and degenerate π-orbitals. In this context, it was assumed that the room-temperature detection of S2•- in cancrinite was due to the smaller volume of ε-cages, that retarded their mobility [48]. The authors assigned an EPR signal with isotropic g-factor close to 2.009 at room temperature and 2.0005 at 77 K to the disulphide anion radical.
Based on literature data, the luminescent samples show no S2•- radical anion signal, most likely because measurement at temperatures below 30 K is required.
4.4. Vibrational Spectroscopy (Infrared and Raman)
4.4.1. Infrared Spectroscopy
Figure 9 and Figure 10 present IR and Raman spectra of untreated samples from Mishevsko and Urdini Lakes localities. The infrared spectra reveal broad bands at ~1640 and ~3430 cm-1, indicating the presence of water molecules, whereas the sharp peak at 3626 cm-1 is characteristic for O-H stretching vibrations in structurally bound hydroxyl groups (Fig. 9.). Bands in the 1420-1530 cm-1 range correspond to the anti-symmetric stretching vibrations of carbonate group, while the band at 877 cm-1 to the out-of-plane bending mode of CO32-. Absorption bands between 900 and1200 cm-1, 530 and 740 cm-1 and near 460 cm-1 are attributed predominantly to aluminosilicate framework vibrations, including T-O stretching, O-T-O bending, and T-O-T bending modes (T = Si, Al) [49,50]. Strong overlap between the aluminosilicate framework vibrations and the anti-symmetric stretching ν3 of SO42- vibrations results in intense absorption bands in the 1030-1160 cm-1 range.
4.4.2. Raman Spectroscopy
The Raman spectra of the studied scapolites are similar to those previously reported [9,12,51,52,53]. They are dominated by vibrations of the aluminosilicate framework, with additional contribution from extra-framework anionic groups (Fig. 10). The two peaks in the 1090-1100 cm-1 region are attributed to overlapping contributions from the symmetric stretching of carbonate groups and Si-O stretching vibrations of aluminosilicate framework, with possible contributions from the ν3(SO4). The peak at 983-987 cm-1 is assigned to the ν1 symmetric stretching of SO42- tetrahedra. The peak at approximately 765 cm⁻1 corresponds to tetrahedral breathing vibrations of the aluminosilicate framework. Bands in the 500-620 cm-1 region arise predominantly from T-O-T bending vibrations (Si-O-Si and Si-O-Al) within the tectosilicate structure with possible contributions from SO₄ bending modes. Bands at 452 and 420 cm-1 are assigned to framework O-T-O deformation modes, while the low-frequency region (256-150 cm-1) are attributed to lattice vibrations involving Ca, Na and framework translations.
The Raman and infrared data indicate evidence for the presence of CO32-, SO42-, H2O, and OH— among the extra-framework and volatile components of the studied scapollites. No distinct bands that can be unambiguously attributed to sulphur dimer species were identify. Their absence may be related to the low abundance and to overlap of their vibrational modes with intense bands arising from the aluminosilicate framework and sulfate groups. This interpretation is consistent with the SCXRD data presented in Table 3 and Table 4, which indicate a low concentration of S2 species and S–S bond lengths ranging from 1.97 to 2.3 Å. Applying the empirical relationship proposed by [13], the expected stretching frequencies of sulphur dimers in the studied samples are estimated to fall within a broad range of approximately 290 to 630 cm⁻¹, which also further complicates their identification.
4.5. Thermal Behavior
Previous studies on the thermal behavior of scapolites reveal a wide range of volatile component release, without clearly defined trends. The thermal behavior of scapolites across the marialite–meionite series was investigated using TG, DTA, and mass spectrometry (25–1400 °C, high vacuum) [54]. The studied materials showed continuous volatile release with five main stages corresponding to H2O, SO2, CO2, NaCl, and KCl. In another study, Me79.6 and Me33.3 samples exhibited different thermal behaviours: Me79.6 released CO₂, minor NaCl, and SO3 in two steps before melting at 1407 °C, whereas Me33.3 lost NaCl, CO2, and minor SO3 in a single step and melted at 1319 °C. Neither H2O nor OH groups were confirmed in the latter study [55].
The thermal behavior of both localities’ samples studied here is expressed by endothermal events on the DSC curves, mass loss recorded on the TG curves, and the corresponding release of volatile components detected by MS (Fig. 11). The discussion is based on the stoichiometric compositions obtained after solving the crystal structures of the samples taken at room temperature (Table 1).
Figure 11.
DSC-TG(DTG)-MS data of the studied samples; m/z = 17 (H2O), m/z = 44 (CO2), m/z = 35 (Cl—) and m/z = 64 (SO2).
Figure 11.
DSC-TG(DTG)-MS data of the studied samples; m/z = 17 (H2O), m/z = 44 (CO2), m/z = 35 (Cl—) and m/z = 64 (SO2).
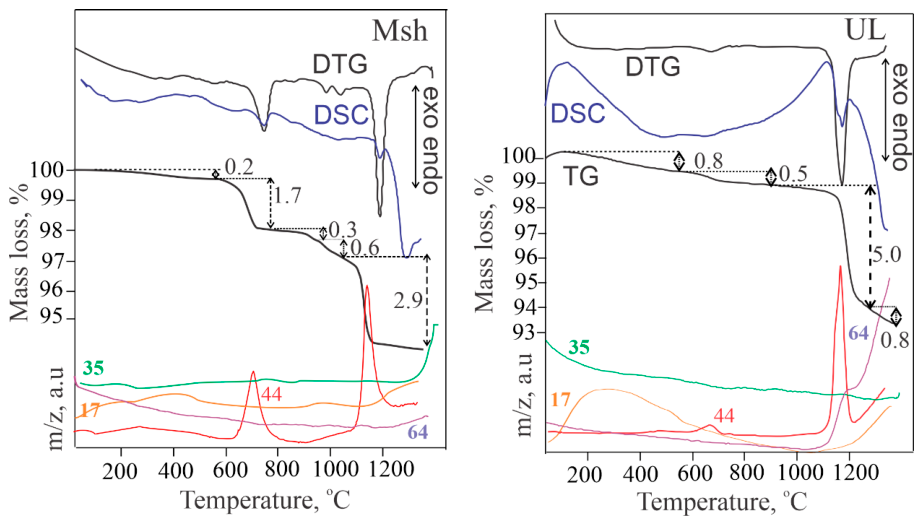
UL - Na1.38Ca2.62(Si7.25Al4.75)O24(CO3)0.7(SO4)0.16Cl0.04(S2)0.12
Diffuse endothermic effect is observed in the temperature range 25-500 °C accompanied with a mass loss of 0.8 %. Within this temperature range, the MS curve detects the release of OH ion. The next endothermic event occurs in the temperature range 600-800 °C, with a negligible amount of 0.5 mass % CO2 liberation. Within the last endothermic effect - 1100-1300 °C, the release of CO2 from the carbonate group is detected as well as the beginning of the process of release of SO2 from the sulphate group. Although the mass loss corresponding to this effect is due to both volatile components evolving, we can assume that the release of CO2 (5.0 mass %) has a dominant role and this value well correlates with the stoichiometric presence of CO3 per formula unit. The release of the SO2 component continues up to 1350 °C, at which temperature, the melting process of the residue occurs. This process is accompanied by the beginning of hydroxyl ion release, probably as a concomitant post-volatile component during the melting.
Msh - Na1.40Ca2.60(Si7.53Al4.47)O24(CO3)0.65Cl0.15(S2)0.22
The scapolite sample from Mishevsko shows some differences in terms of thermal behavior compared to the sample from Urdini Lakes. The mass loss associated with the dehydroxylation process in the temperature range 25-500 °C is significantly smaller, while the mass loss associated with the decarbonatization process in the temperature range 600-800 °C is higher. However, in this sample, the presence of a negligible amount of calcium carbonate is assumed [15] which also undergoes decarbonization within the framework of this effect. In the temperature range 900-1350 °C, a three-step separation of CO2 from the carbonate group is registered, and it is most significant within 1100-1300 °C. The total mass loss associated with the release of CO2 from CO3 (3.8 mass %) correlates with the stoichiometric presence of CO3 per formula unit. This sample is not characterized by the release of SO2, but at the end of the experiment, after 1330 °C, chlorine release is initiated from the framework of the residue melting. In this case, OH ion release is also observed during the melting of the sample.
For both samples the dehydroxylation in the temperature range 25-500 °C (more pronounced in the UL sample) is due to the presence of OH groups. The release of CO2 at lower temperatures, 600-800 °C is associated with the presence of carbonate groups belonging to calcite. The released amount is higher for the Msh sample. The main process of volatiles release occurs in the temperature range 1000-1350 °C. CO2, SO2 or Cl— are released, which confirms the presence of carbon, sulphur and chlorine into the atomic configuration of the specific species populating the SACs.
4.6. Considerations Regarding the Occurrence of Thermally Induced Luminescence
The applied combination of complementary analytical methods provides a more comprehensive view of the diversity of extra-framework species in the scapolite anion cages and their possible transformations during thermal treatment. This is particularly evident for scapolites from the two Bulgarian localities: Urdini Lakes and Mishevsko. Some of the methods (SCXRD and EPR) were also used to study non-fluorescent scapolites from other Bulgarian sites, such as Samurski Dol and Vacha Reservoir in the Rhodope Mountains, as well as from other locations: Slyudyanka (Urals, Russia); Madagascar; and Obernzell (Bavaria, Germany). All of the samples were heated to 1000 °C in air (laboratory furnace) and/or Ar (thermal analyser equipment). Regardless of the treatment atmosphere, the heat-treated scapolites exhibited the characteristic orange-yellow photoluminescence under LW-UV excitation (Table S4 + video files in Supplementary materials). Notably, this phenomenon affects varying volumes of the total material used in the experiment. The single-crystal samples from Slyudyanka and Madagascar exhibit the smallest fluorescent volumes. Scapolites that exhibit characteristics typical of rock-forming minerals, such as polycrystallinity, fractures, and intergrowths with other minerals (e.g., plagioclases and pyroxenes, as seen in the Mishevsko and Urdini Lakes samples), are affected to a greater degree. SCXRD analyses conducted using the described methodology consistently reveal, albeit with varying intensity, electron density in the ab-plane at a distance of approximately 1.1 Å from the A-position in all samples except those from unheated Madagascar sample.
The results of the temperature experiments carried out do not confirm the conclusions drawn by Sidike regarding transformations attributed to the alteration of SO32- and SO42- to S2•- [18]. There are, however, indications of certain changes in the sulphur species following heat treatment: shortening of the S–S distance (SCXRD); conversion of the S2•- radical into other species (EPR and TG-MS); and the formation of new radicals such as SO2•- (EPR). Nevertheless, based on the obtained experimental data, some general considerations regarding the formation of S2•- radicals in photoluminescent scapolites can be drawn. The presence of S–S dimer precursors in the cages is a necessary condition; however, thermal treatment alone is not sufficient for their transformation into S–S radicals, even though temperature proves to be a key factor. Since only certain parts of the samples fluoresce after heating, an additional condition must be required for the phenomenon to occur. We believe this condition is the predominant presence of sodium near the S-S dimer. This assumption is suggested, albeit indirectly, by the fact that the majority of published data on the luminescence and tenebrescence mechanisms of natural and synthetic scapolites and related aluminosilicates pertain to either pure sodium species or species in which sodium predominates over calcium [4,5,7,10,18]. Sodium atoms in the vicinity of S-S dimer species in SACs are more effective than other cations e.g., calcium at capturing and retaining electrons because, despite having similar atomic radii, they possess a lower charge and are consequently more mobile within the space defined by the aluminosilicate framework [5]. The formation conditions of the rocks from the above-mentioned Bulgarian localities also suggest that the presence and concentration of sodium are important for the formation and stabilization of S-S radicals that act as photoluminescent centers. The Mishevsko samples originate from rocks that underwent intense fracturing due to tectonic impact after scapolite formation and subsequent albitization [15]. These processes facilitate, redistribution of sodium influx, initially taken up by the peripheral zones of the heavily cracked scapolite grains. In contrast, the UL samples are relatively more massive and mechanically intact; the thermally induced photoluminescence is localized mainly in heterogeneities such as fractures, boundaries with other minerals, or other linear or planar defects. Similar phenomenon was observed in the other non-fluorescent scapolites examined. However, targeted studies are needed to establish systematic relationship between the genetic characteristics of the host rocks and the occurrence of photoluminescence obtained emission spectra
5. Conclusions
A new interpretation of the electron density distribution within the scapolite anionic cage is proposed. This interpretation allows for the localization of sulphur monomers or dimers as precursors to the formation of S2•- radicals, which emit light under favourable conditions. Parameters such as structural orientation, concentration, and possible bond lengths are determined.
A methodology is proposed to determine the quantities of SO42- and CO32- in SACs based on the occupancy of their oxygen sites. These sites are selected from the electron density distribution map relative to the appropriate geometric parameters (bonds and angles).
The applied combination of complementary structural, spectroscopic and thermal methods provides a more comprehensive understanding of species diversity within the scapolite anion cage, as well as potential species transformations resulting from environmental changes.
Conditions that may favor the formation of S2•- radicals in fluorescent scapolites are discussed. The results suggest that the presence of appropriate sulphur species together with a suitable local cationic environment and conditions favorable for thermally activated charge redistribution, may be required for the development of persistent luminescence.
Supplementary Materials
The following supporting information can be downloaded at https://www.mdpi.com/article/doi/s1, Table S1: Calculation of the S-S bond length using the vibronic structure of the emission for the Msh sample applying Steudel’s relation for diatomic sulfur species, Table S2: Calculation of the S-S bond length using the vibronic structure of the emission for the UL sample applying Steudel’s relation for diatomic sulfur species, Table S3: EPR parameters of sulfur localized radicals in various minerals, alkali halides, and some chemical compounds, Table S4: Heated scapolite samples from various localities under UV light; Figure S1. Rietveld refinement of UL sample heated at 1,000 °C (GSAS program), Video clips: Heated_Msh_vs_Unheated_Msh_1.mp4, Heated_Msh_vs_Unheated_Msh_2.mp4, Heated_UL_vs_Unheated_IL.mp4 are short videos comparing heated and unheated scapolite samples from both localities – Msh and UL.
Author Contributions
Vladislav Kostov-Kytin: Writing – review & editing, Visualization, Data curation, PXRD analyses, Conceptualization. Rositsa Kukeva: Writing –original draft, Methodology, EPR analysis. Petia Petrova: Writing – original draft, Methodology, PL analysis. Rositsa Titorenkova: Writing – review &editing, Validation, IR, Raman analysis. Nadia Petrova: Writing – original draft, Validation, TG-MSC analysis. Rositsa Nikolova: Writing – review & editing, Visualization, SCXRD analyses, Conceptualization.
Acknowledgments
The authors acknowledge the technical support from the project BG16RFPR002-1.014-0007, “Center for Competence PERIMED-2” and BG16RFPR002-1.014-0006 “National Centre of Excellence Mechatronics and Clean Technologies” (2024–2029).
Conflicts of Interest
The authors declare no conflict of interest.
References
- Teertstra, D.K.; Sherriff, B.L. Scapolite cell-parameter trends along the solid-solution series. Am. Mineral. 1996, 81, 169–180. [Google Scholar] [CrossRef]
- Antao, S.M. Unit-cell parameters for scapolite solid solutions and a discontinuity at Me75, ideally NaCa3 [Al5Si7O24](CO3). Powder Diffr. 2013, 28, 269–275. [Google Scholar] [CrossRef]
- Teertstra, D.; Schindler, M.; Sherriff, B.L.; Hawthorne, F.C. Silvialite, a new sulfate-dominant member of the scapolite group with an Al-Si composition near the 14/m–P42/n phase transition. Mineral. Mag. 1999, 63, 321–329. [Google Scholar] [CrossRef]
- Armstrong, J.A.; Weller, M.T. Structural observation of photochromism. Chem. Commun. 2006, 1094–1096. [Google Scholar] [CrossRef] [PubMed]
- Colinet, P.; Byron, H.; Vuori, S.; Lehtiö, J.-P.; Laukkanen, P.; Van Goethem, L.; Lastusaari, M.; Le Bahers, T. The structural origin of the efficient photochromism in natural minerals. Proc. Natl. Acad. Sci. 2022, 119, e2202487119. [Google Scholar] [CrossRef] [PubMed]
- Fleet, M.E.; Liu, X.; Harmer, S.L.; Nesbitt, H.W. Chemical state of sulfur in natural and synthetic lazurite by SK-edge XANES and X-ray photoelectron spectroscopy. Can. Mineral. 2005, 43, 1589–1603. [Google Scholar] [CrossRef]
- Norrbo, I.; Gluchowski, P.; Hyppanen, I.; Laihinen, T.; Laukkanen, P.; Makela, J.; Mamedov, F.; Santos, H.S.; Sinkkonen, J.; Tuomisto, M. Mechanisms of tenebrescence and persistent luminescence in synthetic hackmanite Na8Al6Si6O24(Cl,S)2. ACS Appl. Mater. Interfaces 2016, 8, 11592–11602. [Google Scholar] [CrossRef] [PubMed]
- Rao, Y.; Guo, Q.; Zhang, S.; Liao, L. Comparative Study on Gemmological Characteristics and Luminescence of Colorless and Yellow Scapolites. Crystals 2023, 13, 462. [Google Scholar] [CrossRef]
- Shendrik, R.; Kaneva, E.; Pankratova, V.; Pankrushina, E.; Radomskaya, T.; Gavrilenko, V.; Loginova, P.; Pankratov, V. Intrinsic luminescence and radiation defects in scapolite. Chem. Phys. Lett. 2024, 838, 141081. [Google Scholar] [CrossRef]
- Blumentritt, F.; Latouche, C.; Morizet, Y.; Caldes, M.-T.; Jobic, S.; Fritsch, E. Unravelling the origin of the yellow-orange luminescence in natural and synthetic scapolites. J. Phys. Chem. Lett. 2020, 11, 4591–4596. [Google Scholar] [CrossRef] [PubMed]
- Curutchet, A.; Le Bahers, T. Modeling the photochromism of S-doped sodalites using DFT, TD-DFT, and SAC-CI methods. Inorg. Chem. 2017, 56, 414–423. [Google Scholar] [CrossRef] [PubMed]
- Shendrik, R.; Chukanov, N.V.; Bogdanov, A.; Myasnikova, A.; Pankrushina, E.; Zolotarev, A.A.; Babkina, A.; Popova, E.; Vigasina, M.F.; Aksenov, S.M. Nature of Scapolite Color: Ab Initio Calculations, Spectroscopy, and Structural Study. Minerals 2024, 14, 937. [Google Scholar] [CrossRef]
- Steudel, R. Properties of sulfur-sulfur bonds. Angew. Chem. Int. Ed. Engl. 1975, 14, 655–664. [Google Scholar] [CrossRef]
- Kostov-Kytin, V.; Kadiyski, M.; Nikolova, R. Further on the Choice of Space Group for Scapolite Group Members and Genetic Considerations about the Si-Al Ordering in Their Framework Construction. Minerals 2024, 14, 556. [Google Scholar] [CrossRef]
- Kostov-Kytin, V.; Piroeva, I.; Atanasova, S.; Petrov, P. Meionite (Me> 60) from Mishevsko, Central Rhodopes–First Find of Yellow LW UV Fluorescent Scapolite for Bulgaria. In Proceedings of the Proceedings of the Bulgarian Academy of Sciences, 2025; p. 373–382-373–382. [Google Scholar]
- Sokolova, E.; Hawthorne, F.C. The crystal chemistry of the scapolite-group minerals. I. Crystal structure and long-range order. Can. Mineral. 2008, 46, 1527–1554. [Google Scholar] [CrossRef]
- Swayze, G.A.; Clark, R.N. Infrared spectra and crystal chemistry of scapolites: Implications for Martian mineralogy. J. Geophys. Res. Solid Earth 1990, 95, 14481–14495. [Google Scholar] [CrossRef]
- Sidike, A.; Kusachi, I.; Kobayashi, S.; Atobe, K.; Yamashita, N. Photoluminescence spectra of S2− center in natural and heat-treated scapolites. Phys. Chem. Miner. 2008, 35, 137–145. [Google Scholar] [CrossRef]
- Shaw, D.M. The geochemistry of scapolite part I. Previous work and general mineralogy. J. Petrol. 1960, 1, 218–260. [Google Scholar] [CrossRef]
- Lin, S.; Burley, B. Crystal structure of a sodium and chlorine-rich scapolite. Struct. Sci. 1973, 29, 1272–1278. [Google Scholar] [CrossRef]
- Papike, J.; Stephenson, N.C. The crystal structure of mizzonite, a calcium-and carbonate-rich scapolite. Am. Mineral. J. Earth Planet. Mater. 1966, 51, 1014–1027. [Google Scholar]
- Pauling, L. The structure of some sodium and calcium aluminosilicates. Proc. Natl. Acad. Sci. 1930, 16, 453–459. [Google Scholar] [CrossRef] [PubMed]
- Antao, S.M.; Hassan, I. Increase in Al–Si and Na–Ca disorder with temperature in scapolite Me32. 9. Can. Mineral. 2008, 46, 1577–1591. [Google Scholar] [CrossRef]
- Antao, S.M.; Hassan, I. Complete Al–Si order in scapolite Me37.5, idealy Ca3Na5[Al8Si16O48]Cl(CO3), and implications for antiphase domain baundaries (APBs). Can. Mineral. 2011, 49, 581–586. [Google Scholar] [CrossRef]
- Papike, J.; Zoltai, T. The crystal structure of a marialite scapolite. Am. Mineral. J. Earth Planet. Mater. 1965, 50, 641–655. [Google Scholar]
- Levien, L.; Papike, J. Scapolite crystal chemistry; aluminum-silicon distributions, carbonate group disorder, and thermal expansion. Am. Mineral. 1976, 61, 864–877. [Google Scholar]
- Lin, S.; Burley, B. The crystal structure of meionite. Struct. Sci. 1973, 29, 2024–2026. [Google Scholar] [CrossRef]
- Lin, S.; Burley, B. The crystal structure of an intermediate scapolite–wernerite. Struct. Sci. 1975, 31, 1806–1814. [Google Scholar] [CrossRef]
- Peterson, R.; Donnay, G.; LePage, Y. Sulfate disorder in scapolite. Can. Mineral. 1979, 17, 53–61. [Google Scholar]
- Burgner, R.; Scheetz, B.E.; White, W.B. Vibrational structure of the S2− luminescence in scapolite. Phys. Chem. Miner. 1978, 2, 317–324. [Google Scholar] [CrossRef]
- Curie, D.; Canny, B.; Jaszczyn-Kopec, P.; Liu, H.; Berry, D.; Williams, F. The effects of hydrostatic and uniaxial pressures on vibronic spectra. J. Lumin. 1981, 24, 145–154. [Google Scholar] [CrossRef]
- Knop, O.; Boyd, R.J.; Choi, S. Sulfur-sulfur bond lengths, or can a bond length be estimated from a single parameter? J. Am. Chem. Soc. 1988, 110, 7299–7301. [Google Scholar] [CrossRef]
- Bolotina, N.; Rastsvetaeva, R.; Sapozhnikov, A. Average structure of incommensurately modulated monoclinic lazurite. Crystallogr. Rep. 2006, 51, 589–595. [Google Scholar] [CrossRef]
- Kostov-Kytin, V.; Nikolova, R.; Kadiyski, M.; Dimitrov, I. Crystal Structure of Scapolite from Urdini Lakes, Northwestern Rila, Bulgaria. In Proceedings of the Proceedings of the Bulgarian Academy of Sciences, 2023; p. 1045–1053-1045–1053. [Google Scholar]
- Sheldrick, G.M. SHELXT–Integrated space-group and crystal-structure determination. Found. Crystallogr. 2015, 71, 3–8. [Google Scholar] [CrossRef] [PubMed]
- Marfunin, A.d.S. Spectroscopy, luminescence and radiation centers in minerals; Springer Science & Business Media, 2012. [Google Scholar]
- Vassilikou-Dova, A. An EPR study of scapolite. Cryst. Res. Technol. 1991, 26, 135–138. [Google Scholar] [CrossRef]
- Vannotti, L.; Morton, J. Paramagnetic-Resonance Spectra of S− Trapped in Alkali Halide Crystals. Phys. Rev. 1968, 174, 448. [Google Scholar] [CrossRef]
- Köksal, F.; Köseoǧlu, R.; Başaran, E. Electron paramagnetic resonance of rhyolite and γ-irradiated trona minerals. Z. Fur Naturforschung-Sect. A J. Phys. Sci. 2003, 58. [Google Scholar] [CrossRef]
- Angelov, S.; Stoyanova, R.; Dafinova, R.; Kabasanov, K. Luminescence and EPR studies on strontium carbonate obtained by thermal decomposition of strontium oxalate. J. Phys. Chem. Solids 1986, 47, 409–412. [Google Scholar] [CrossRef]
- Amassah, G.; Mitchell, D.G.; Hovey, T.A.; Eaton, S.S.; Eaton, G.R. Electron Spin Relaxation of SO2− and SO3− Radicals in Solid Na2S2O4, Na2S2O5, and K2S2O5. Appl. Magn. Reson. 2023, 54, 849–867. [Google Scholar] [CrossRef] [PubMed]
- McLaughlan, S.D.; Marshall, D.J. Paramagnetic resonance of sulfur radicals in synthetic sodalites. J. Phys. Chem. 1970, 74, 1359–1363. [Google Scholar] [CrossRef]
- Arieli, D.; Vaughan, D.E.; Goldfarb, D. New synthesis and insight into the structure of blue ultramarine pigments. J. Am. Chem. Soc. 2004, 126, 5776–5788. [Google Scholar] [CrossRef] [PubMed]
- Chukanov, N.V.; Zubkova, N.V.; Shendrik, R.Y.; Sapozhnikov, A.N.; Pekov, I.V.; Vigasina, M.F.; Chervonnaya, N.A.; Varlamov, D.A.; Bolotina, N.B.; Ksenofontov, D.A. Crystal Structure Features, Spectroscopic Characteristics and Thermal Conversions of Sulfur-Bearing Groups: New Natural Commensurately Modulated Haüyne Analogue, Na6Ca2−x (Si6Al6O24)(SO42−, HS−, S2●−, S4, S3●−, S52−)2−y. Minerals 2025, 15, 709. [Google Scholar] [CrossRef]
- Kowalak, S.; Jankowska, A.; Mikołajska, E. Using of zeolite LOS for preparation of sulfur pigments. Microporous Mesoporous Mater. 2010, 127, 126–132. [Google Scholar] [CrossRef]
- Chukanov, N.V.; Zubkova, N.V.; Pekov, I.V.; Shendrik, R.Y.; Varlamov, D.A.; Vigasina, M.F.; Belakovskiy, D.I.; Britvin, S.N.; Yapaskurt, V.O.; Pushcharovsky, D.Y. Sapozhnikovite, Na8 (Al6Si6O24)(HS)2, a new sodalite-group mineral from the Lovozero alkaline massif, Kola Peninsula. Mineral. Mag. 2022, 86, 49–59. [Google Scholar] [CrossRef]
- Raulin, K.; Gobeltz, N.; Vezin, H.; Touati, N.; Ledé, B.; Moissette, A. Identification of the EPR signal of S2− in green ultramarine pigments. Phys. Chem. Chem. Phys. 2011, 13, 9253–9259. [Google Scholar] [CrossRef] [PubMed]
- Kowalak, S.; Jankowska, A.; Zeidler, S.; Wie, A.B. Sulfur radicals embedded in various cages of ultramarine analogs prepared from zeolites. J. Solid State Chem. 2007, 180, 1119–1124. [Google Scholar] [CrossRef]
- Schwarcz, H.; Speelman, E. Determination of sulfur and carbon coordination in scapolite by infra-red absorption spectrophotometry. Am. Mineral. J. Earth Planet. Mater. 1965, 50, 656–666. [Google Scholar]
- Wehrenberg, J.P. The infrared absorption spectra of scapolite. Am. Mineral. J. Earth Planet. Mater. 1971, 56, 1639–1648. [Google Scholar]
- Chukanov, N.V.; Shchipalkina, N.V.; Shendrik, R.Y.; Vigasina, M.F.; Tauson, V.L.; Lipko, S.V.; Varlamov, D.A.; Shcherbakov, V.D.; Sapozhnikov, A.N.; Kasatkin, A.V. Isomorphism and mutual transformations of S-bearing components in feldspathoids with microporous structures. Minerals 2022, 12, 1456. [Google Scholar] [CrossRef]
- Dumańska-Słowik, M.; Powolny, T.; Khac, G.N.; Heflik, W.; Sikorska-Jaworowska, M. Petrogenesis of scapolite-rich gabbro from the alkaline Cho Don complex in north-eastern Vietnam-mineralogical and geochemical implications. Lithos 2020, 374, 105703. [Google Scholar] [CrossRef]
- Gajdošová, M.; Huraiová, M.; Hurai, V.; Slobodník, M.; Siegfried, P.R. Two types of scapolite in Evate carbonatite deposit (Mozambique): Implications for magmatic versus metamorphic origins. Acta Geol. Slovaca AGEOS 2019, 11, 63–74. [Google Scholar]
- Graziani, G.; Lucchesi, S. The thermal behavior of scapolites. Am. Mineral. 1982, 67, 1229–1241. [Google Scholar]
- Antao, S.M.; Hassan, I. Thermal behavior of scapolite Me79. 6 and Me33. 3. Can. Mineral. 2002, 40, 1395–1401. [Google Scholar] [CrossRef]
Figure 4.
Excitation and photoluminescence emission spectra at room temperature of the studied samples.
Figure 4.
Excitation and photoluminescence emission spectra at room temperature of the studied samples.
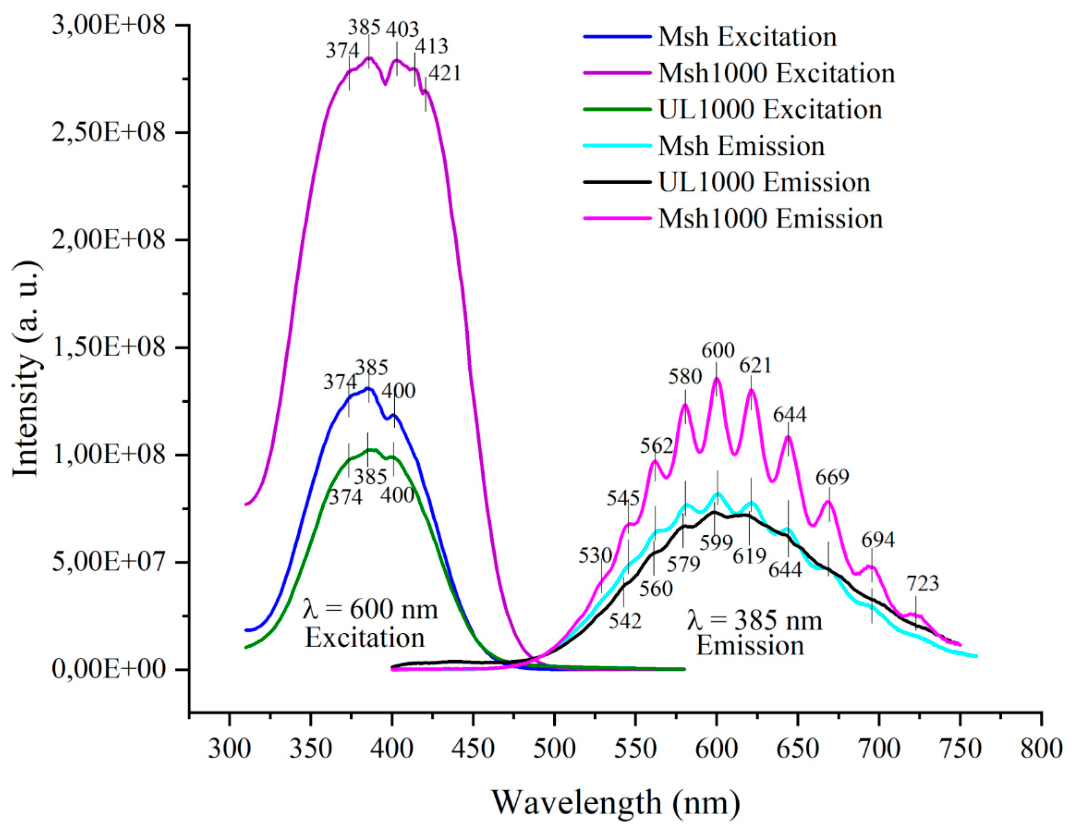
Figure 6.
a) EPR spectra of scapolite powder from Mishevsko before and after UV irradiation; b) Comparison of EPR spectra of scapolite samples from the Urdini lakes and Mishevsko. Open circles indicate the lines due to Mn2+ hyperfine structure. All spectra are acquired at 295 К.
Figure 6.
a) EPR spectra of scapolite powder from Mishevsko before and after UV irradiation; b) Comparison of EPR spectra of scapolite samples from the Urdini lakes and Mishevsko. Open circles indicate the lines due to Mn2+ hyperfine structure. All spectra are acquired at 295 К.
Figure 7.
EPR spectra of Msh scapolite fragment. Four EPR spectra are shown that correspond to the orientation of quartz tube along the magnetic field.
Figure 7.
EPR spectra of Msh scapolite fragment. Four EPR spectra are shown that correspond to the orientation of quartz tube along the magnetic field.
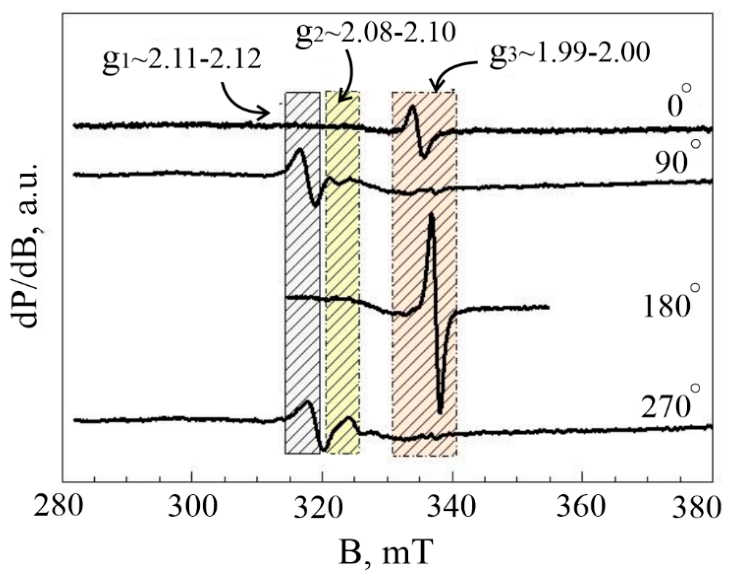
Figure 8.
EPR spectra of the studied samples. The Mn2+ hyperfine structure 3rd and 4th lines are marked by open circles; pictures of UV irradiated powdered samples corresponding to the EPR spectra are shown on the left.
Figure 8.
EPR spectra of the studied samples. The Mn2+ hyperfine structure 3rd and 4th lines are marked by open circles; pictures of UV irradiated powdered samples corresponding to the EPR spectra are shown on the left.
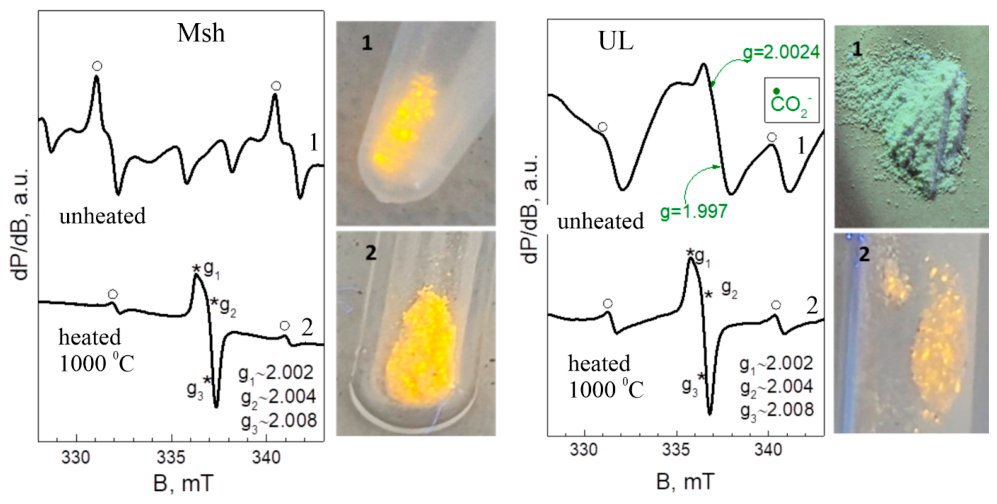
Figure 9.
FT-infrared spectra of the studied samples.
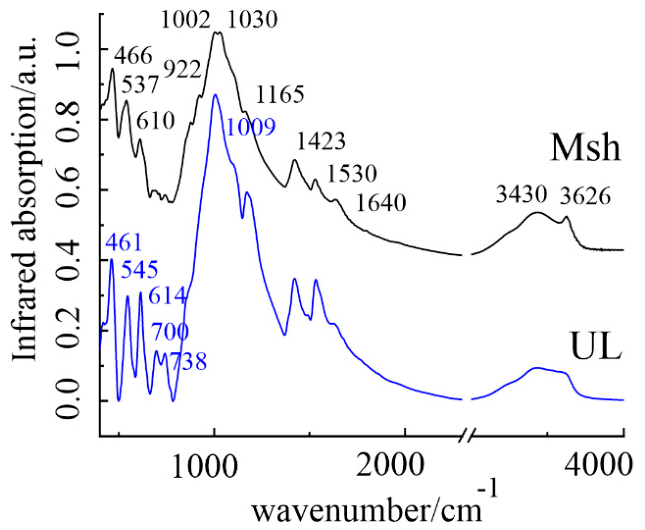
Figure 10.
Raman spectra of the studied samples.
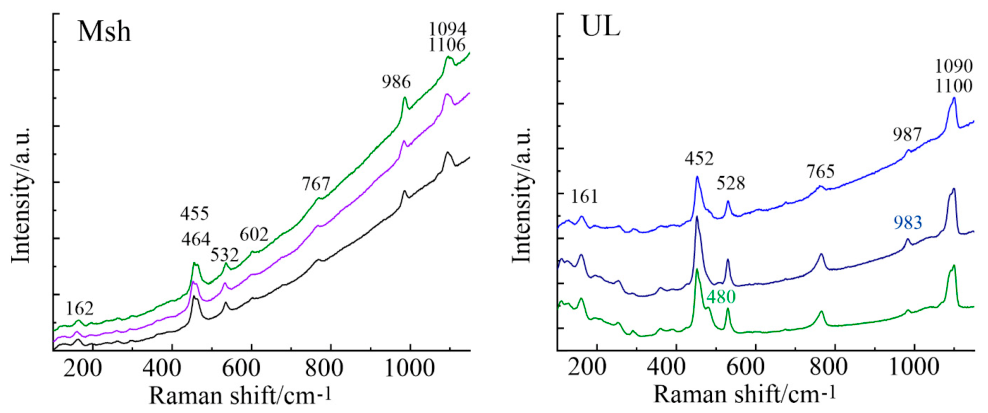

Table 1.
Most important data collection and refinement parameters for the unheated samples.
| Sample | Msh-LT | Msh-RT | UL-LT | UL-RT |
|---|---|---|---|---|
| Chemical formula | Na1.35Ca2.65 (Si7.44Al4.56)O24 (CO3)0.65Cl0.24 (S2)0.15 | Na1.40Ca2.60 (Si7.53Al4.47)O24 (CO3)0.65Cl0.15 (S2)0.22 | Na1.38Ca2.62 (Si7.52Al4.48)O24 (CO3)0.73(SO4)0.13Cl0.04 (S2)0.13 | Na1.38Ca2.62 (Si7.25Al4.75)O24 (CO3)0.7(SO4)0.16 Cl0.04 (S2)0.12 |
| Charge imbalance* | +0.25 | –0.16 | +0.12 | –1.13 |
| Formula weight | 910.20 | 911.45 | 919.53 | 919.59 |
| Space group | P42/n | P42/n | P42/n | P42/n |
| a = b (Å) | 12.1270(16) | 12.1474(9) | 12.1234(8) | 12.1350(7) |
| c (Å) | 7.5688(12) | 7.5622(10) | 7.5577(6) | 7.5560(5) |
| Volume (Å3) / Z | 1113.1(3) / 2 | 1115.9(2) / 2 | 1110.81(17) | 1112.68(15) |
| ρcalc (g/cm3) | 2.716 | 2.713 | 2.749 | 2.743 |
| μ (mm-1) | 1.456 | 1.1447 | 1.442 | 1.436 |
| Θ range for data collection (°) | 4.75 to 52.928 | 4.74 to 52.838 | 4.752 to 52.75 | 5.496 to 50.484 |
| Data/restraints/parameters | 1143/0/111 | 1144/0/110 | 1132/0/114 | 1372/0/114 |
| Goodness-of-fit on F2 | 1.080 | 1.154 | 1.186 | 1.038 |
| Final R indexes [I > =2σ (I)] | R1 = 0.0405, wR2 = 0.1159 | R1 = 0.0267, wR2 = 0.0866 | R1 = 0.0239, wR2 = 0.0792 | R1 = 0.0438, wR2 = 0.0751 |
| Final R indexes [all data] | R1 = 0.0561, wR2 = 0.1298 | R1 = 0.0349, wR2 = 0.0935 | R1 = 0.0259, wR2 = 0.0813 | R1 = 0.0978, wR2 = 0.0925 |
| Largest diff. peak/hole (e- Å-3) | 0.44/-0.53 | 0.39/-0.30 | 0.41/-0.46 | 0.46/-0.53 |
* The valence of the sulphur dimer is assumed to be -2.
Table 2.
Most important data collection and refinement parameters for the heated samples.
| Sample | Msh-H1-RT | Msh-H2-RT | UL-H1-RT | UL-H2-RT |
|---|---|---|---|---|
| Chemical formula | Na1.18Ca2.82 (Si7.46Al4.54)O24 (CO3)0.66Cl0.08 (SO4)0.12 (S2)0.18 | Na1.41Ca2.59 (Si7.12Al4.88)O24 (CO3)0.66Cl0.14 (S2)0.18 | Na1.71Ca2.29(Si7.54Al4.46)O24 (CO3)0.6Cl0.04(SO4)0.19 (S2)0.1 | Na1.38Ca2.62(Si7.33Al4.67)O24 (CO3)0.7(SO4)0.13 Cl0.04 (S2)0.13 |
| Charge imbalance* | +0.29 | –0.11 | +0.01 | –0.01 |
| Formula weight | 921.12 | 909.03 | 907.82 | 918.64 |
| Space group | P42/n | P42/n | P42/n | P42/n |
| a = b (Å) | 12.1419(4) | 12.1505(3) | 12.1153(15) | 12.1369(2) |
| c (Å) | 7.5662(4) | 7.5632(2) | 7.5591(14) | 7.5534(2) |
| Volume (Å3) / Z | 1115.45(9)/2 | 1116.59(6)/2 | 1109.5(3) | 1112.65(5)/2 |
| ρcalc (g/cm3) | 2.742 | 2.654 | 2.717 | 2.739 |
| μ (mm-1) | 1.476 | 1.355 | 1.375 | 1.439 |
| Θ range for data collection (°) | 6.344 to 57.444 | 4.742 to 52.856 | 4.754 to 52.762 | 4.746 to 52.718 |
| Data/restraints/parameters | 1231/0/117 | 1149/0/110 | 1133/0/114 | 1130/0/122 |
| Goodness-of-fit on F2 | 1.080 | 1.095 | 1.094 | 1.143 |
| Final R indexes [I > =2σ (I)] | R1 = 0.0283, wR2 = 0.0912 | R1 = 0.0279, wR2 = 0.0680 | R1 = 0.0368, wR2 = 0.0914 | R1 = 0.0245, wR2 = 0.0771 |
| Final R indexes [all data] | R1 = 0.0425, wR2 = 0.1054 | R1 = 0.0409, wR2 = 0.0794 | R1 = 0.0496, wR2 = 0.1026 | R1 = 0.0342, wR2 = 0.0846 |
| Largest diff. peak/hole (e Å-3) | 0.34/-0.36 | 0.44/-0.47 | 0.38/-0.41 | 0.29/-0.35 |
* The valence of the sulphur dimer is assumed to be -2.
Table 3.
Selected geometrical parameters for the unheated samples.
| Sample | Msh-LT | Msh-RT | UL-LT | UL-RT |
|---|---|---|---|---|
| Chemical formula distance (Å) and angles (°) |
Na1.35Ca2.65 (Si7.44Al4.56)O24 (CO3)0.65Cl0.24 (S2)0.15 | Na1.40Ca2.60 (Si7.53Al4.47)O24 (CO3)0.65Cl0.15 (S2)0.22 | Na1.38Ca2.62 (Si7.52Al4.48)O24 (CO3)0.73(SO4)0.13Cl0.04 (S2)0.13 | Na1.38Ca2.62 (Si7.25Al4.75)O24 (CO3)0.7(SO4)0.16 Cl0.04 (S2)0.12 |
| C – O7 | 1.339 | 1.335 | 1.338 | 1.356 |
| S1 – S1 | 2.20 | 2.20 | 2.228 | 2.282 |
| S – O8 | 1.482 | 1.437 | ||
| S – O9 | ||||
| O8 – S – O8 | 108.93 | 112.97 | ||
| O9 – S – O9 | ||||
| (Na/Ca) – O7 | 2.347, 2.447 | 2.333, 2.470 | 2.331, 2.443 | 2.234, 2.538 |
| (Na/Ca) – S1 | 2.058 | 2.053 | 2.050 | 2.098 |
| (Na/Ca) – O8 | 2.577, 2.594 | 2.516, 2.621 | ||
| (Na/Ca) – O9 |
Table 4.
Selected geometrical parameters for the heated samples.
| Sample | Msh-H1-RT | Msh-H2-RT | UL-H1-RT | UL-H2-RT |
|---|---|---|---|---|
| Chemical formula distance (Å) and angles (°) |
Na1.18Ca2.82 (Si7.46Al4.54)O24 (CO3)0.66Cl0.08 (SO4)0.12 (S2)0.18 | Na1.41Ca2.59 (Si7.12Al4.88)O24 (CO3)0.66Cl0.14 (S2)0.18 | Na1.71Ca2.29(Si7.54Al4.46)O24 (CO3)0.6Cl0.04(SO4)0.19Cl0.04 (S2)0.1 | Na1.38Ca2.62(Si7.33Al4.67)O24 (CO3)0.7(SO4)0.13 Cl0.04 (S2)0.13 |
| C – O7 | 1.344 | 1.345 | 1.344 | 1.347 |
| S1 – S1 | 2.133 | 2.098 | 2.116 | 2.153 |
| S – O8 | 1.462 | 1.264 | 1.455 | |
| S – O9 | 1.473 | 1.445 | ||
| O8 – S – O8 | 106.24 | 129.01 | 105.17 | |
| O9 – S – O9 | 105.39 | 104.59 | ||
| (Na/Ca) – O7 | 2.333, 2.453 | 2.342, 2.455 | 2.310, 2.455 | 2.233, 2.449 |
| (Na/Ca) – S1 | 2.082 | 2.110 | 2.079 | 2.066 |
| (Na/Ca) – O8 | 2.582, 2.646 | 2.553, 2.493 | 2.594, 2.639 | |
| (Na/Ca) – O9 | 2.584, 2.652 | 2.465, 2.784 |
Disclaimer/Publisher’s Note: The statements, opinions and data contained in all publications are solely those of the individual author(s) and contributor(s) and not of MDPI and/or the editor(s). MDPI and/or the editor(s) disclaim responsibility for any injury to people or property resulting from any ideas, methods, instructions or products referred to in the content. |
© 2026 by the authors. Licensee MDPI, Basel, Switzerland. This article is an open access article distributed under the terms and conditions of the Creative Commons Attribution (CC BY) license (http://creativecommons.org/licenses/by/4.0/).
Copyright: This open access article is published under a Creative Commons CC BY 4.0 license, which permit the free download, distribution, and reuse, provided that the author and preprint are cited in any reuse.