

Submitted:
13 October 2026
Posted:
14 October 2026
You are already at the latest version
Abstract
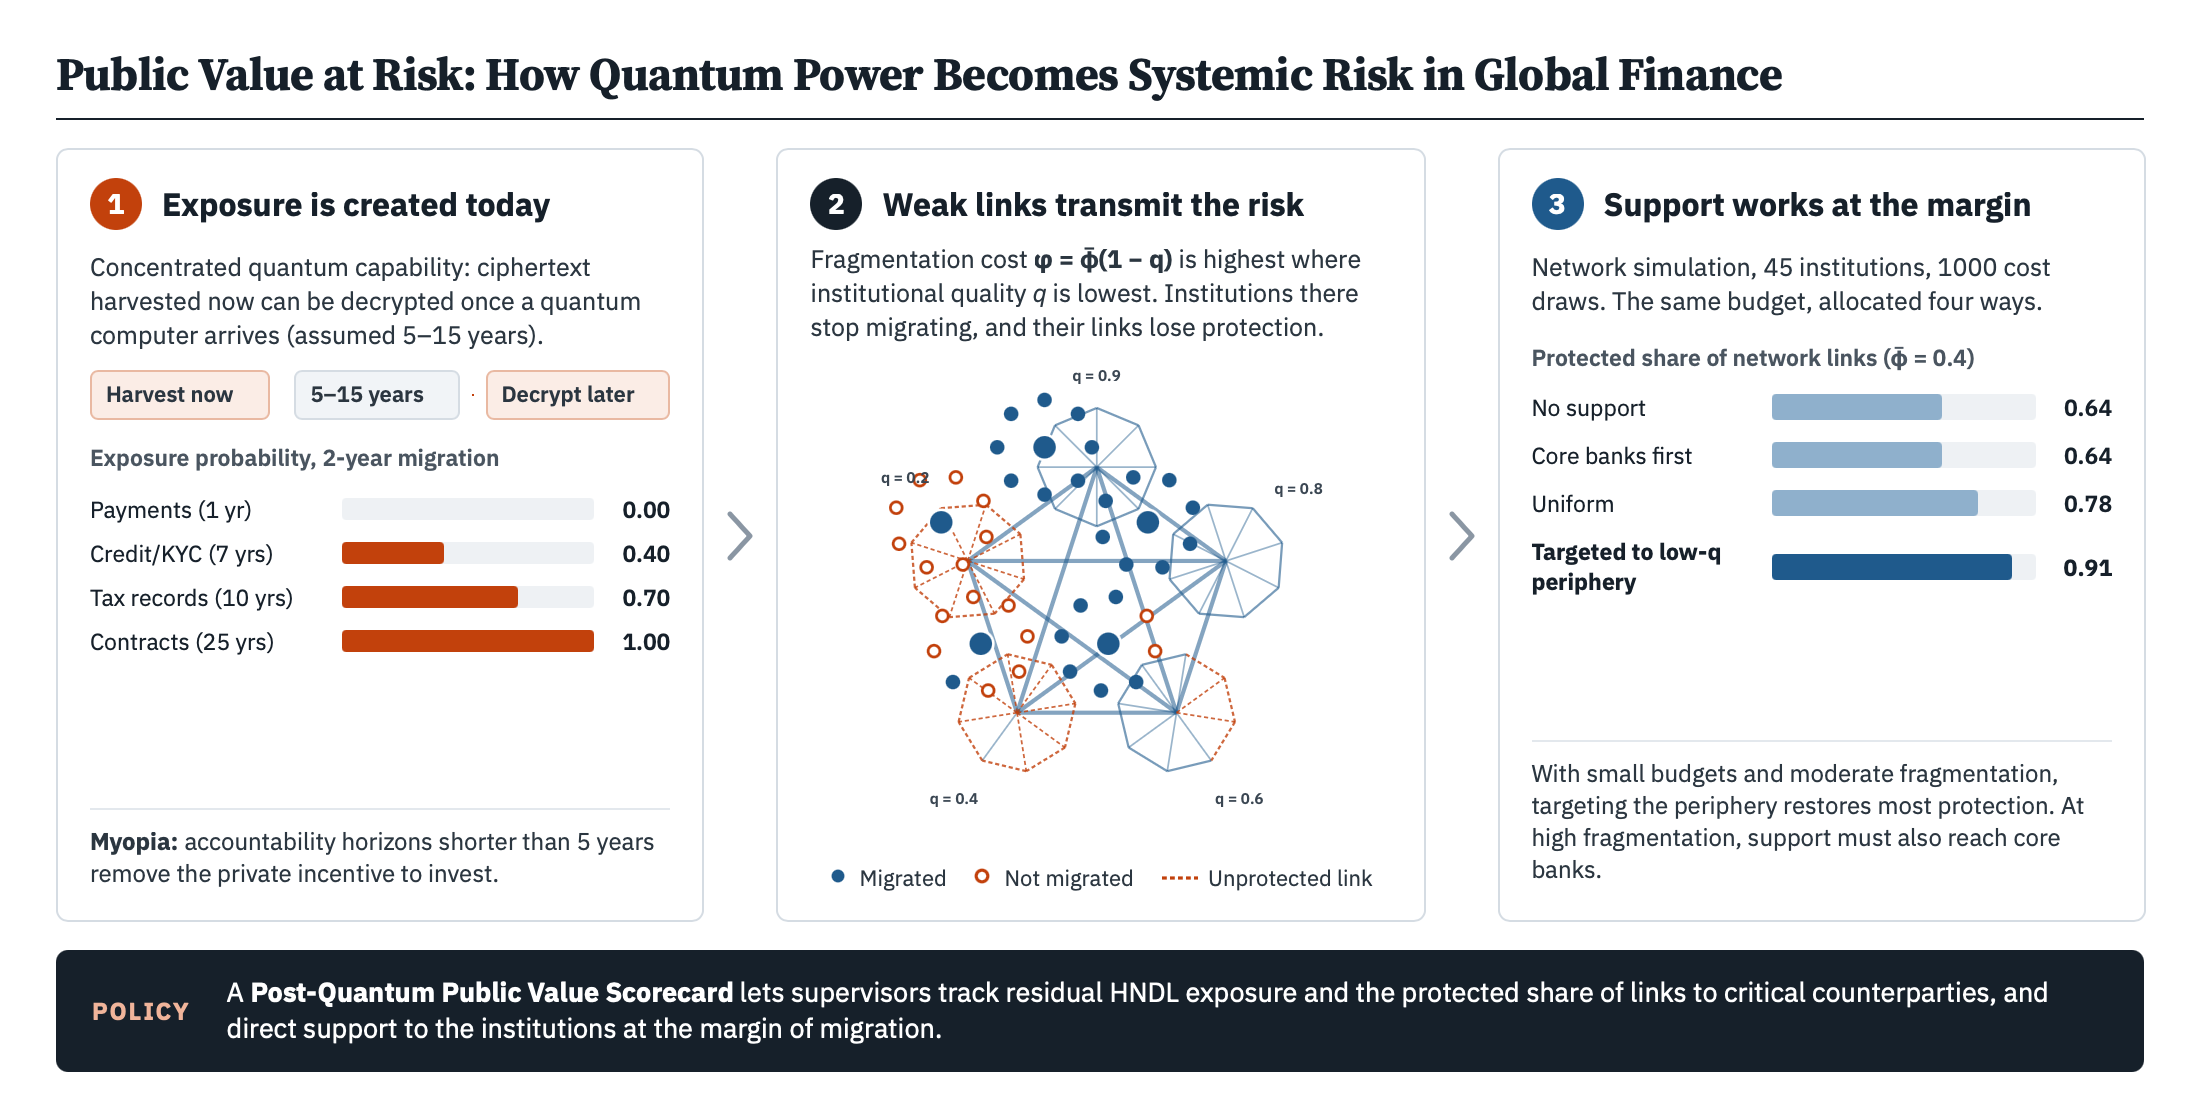
The capacity to break today’s public-key cryptography is concentrating in a few states and firms, while the financial systems that depend on it are interdependent. Because encrypted data can be HNDL once a cryptographically relevant quantum computer exists, part of the risk is already embedded in payments, credit records and public-finance records. This article examines how shifts in technological power become systemic financial risk. It develops three stylized models (harvest-now, decrypt-later exposure; myopic investment; weakest-link migration in a core-periphery network in which fragmentation costs fall with institutional quality, calibrates them illustratively and solves the network game numerically. Under a 5–15-year arrival window, records requiring confidentiality for ten years or more face exposure probabilities of 0.70 to 1.00. Accountability horizons shorter than the earliest plausible arrival remove the private incentive to invest. In the simulated network, support targeted at low-quality jurisdictions restores most protection when budgets are small and fragmentation is moderate. At high fragmentation, the margin shifts to core banks, and uniform or core-first allocations can perform as well or better. The article proposes a Post-Quantum Public Value Scorecard for supervisors, banks and treasuries, applies it to Portugal and treats quantum readiness as a supervisable dimension of systemic resilience.
Keywords:
systemic risk
; financial interdependence
; institutional quality
; geoeconomics
; post-quantum cryptography
; operational resilience
; regulatory governance
; public values
; cryptographic justice
; harvest-now-decrypt-later
1. Introduction
Payment authorization, interbank messaging, securities settlement, digital identity, tax filing and the evidentiary value of electronic records all rest on public-key schemes such as RSA (Rivest-Shamir-Adleman) and elliptic-curve cryptography. Shor’s algorithm implies that a sufficiently large, fault-tolerant quantum computer would break these schemes (Mosca, 2018). The capability to build such a machine is concentrated in a handful of states and technology firms, and the race to acquire it is now an explicit object of industrial policy, export controls and alliance strategy (Costeira & Morgado 2026; Mohr & Trebesch, 2025). Expert estimates place a cryptographically relevant quantum computer (CRQC) roughly 5 to 15 years away (Costeira & Morgado, 2026).
This combination of concentrated offensive capability on one side and interdependent financial infrastructures makes post-quantum cryptographic (PQC) risk a question of global power and systemic risk, and not only of information security. A financial system is only as well protected as its least-protected connection. Correspondent banking, card schemes, cross-border payment messaging, cloud services and shared vendors link institutions across jurisdictions with different capacities to migrate. A shift in who can decrypt whose data therefore propagates through the same networks that transmit liquidity and credit shocks.
The distinctive feature of this risk is its timing. An adversary can collect encrypted traffic and stored ciphertext today and decrypt it once a CRQC becomes available. This “harvest-now, decrypt-later” (HNDL) strategy means that the loss event lies in the future, but the exposure is created in the present, every time long-lived confidential information is encrypted with a vulnerable algorithm (CISA et al., 2023). In risk management terms, HNDL is a latent operational risk with a long and uncertain tail. In public finance terms, it is an under-investment problem, since mitigation costs are immediate and visible, whereas benefits are diffuse, delayed and partly external to the decision-maker (Morgado 2014, 2026). HNDL threatens confidentiality. A CRQC would also threaten integrity, because digital signatures could be forged once the capability exists. This second threat does not alter settled transactions retroactively, but it affects the authentication of new messages and the evidentiary value of signed archives.
Whether such a latent risk matters for financial stability depends on how cyber losses behave once they occur inside financial systems. Finance research treats cyber risk as a source of financial loss, disruption or reputational damage arising from the failure of information systems, and identifies three features relevant to the quantum case: how losses are distributed, how they spread across institutions, and how far they can be transferred.
Using 3705 US cyber events, Aldasoro et al. (2022) find that the financial sector suffers more attacks but lower average costs than other sectors, that malicious incidents dominate the upper tail of the loss distribution, and that higher IT spending is followed by lower cyber costs. They also find lower average costs among firms that use cloud services, while warning that cloud providers may become systemically important. Both findings bear on post-quantum migration, which will be delivered largely through a few cloud, hardware-security-module and certificate-authority vendors.
Contagion is the second theme. Allen and Gale (2000) showed that the structure of interbank claims determines whether a local shock becomes systemic. Crosignani et al. (2023) provide the cyber analogue. The 2017 NotPetya attack propagated from directly hit firms to their customers, with larger losses where customers had fewer alternative suppliers, and with liquidity buffers and bank credit lines acting as shock absorbers. For quantum risk, the implication is that the protection level of the least-protected node in a payment, procurement or supply chain matters for every stakeholder connected to it.
Third, cyber risk is hard to transfer. Camillo (2017) documents how cyber insurance evolved from a niche product into a cross-cutting exposure that touches every line of business, while capital requirements may understate correlated operational cyber losses. HNDL is an extreme case, underlined by a single cryptanalytic capability that could compromise many institutions simultaneously, which is the kind of correlated, non-diversifiable loss that private insurance struggles to cover. Akoto and Herr (2026) add that the costs of cyber economic espionage are largely indirect (reputational, strategic and operational) and remain “buried” or unknown long after the intrusion, a feature that HNDL shares by construction.
The bibliometric review by Al-Shattarat et al. (2025) shows that business, management and accounting research on cybersecurity has grown but remains fragmented across disciplines. Within this journal, Kuzior et al. (2022) forecast rising cybercrime pressure on financial institutions, Pawala et al. (2026) propose a temporal machine learning framework for predicting SME dissolution in an emerging market, and Sukumar and Balasubramanian (2026) analyze operational-risk capital under Basel III. Eldomiaty et al. (2026) show that the severity of information asymmetry shapes firm financing and growth. Quantum risk has not yet been integrated into this operational and systemic-risk toolkit.
Integrating it requires attention to a feature that separates quantum risk from conventional cyber risk. The ability to exploit vulnerable cryptography at scale will not be spread across many attackers but held by a small number of states and firms. Who holds that capability, and who depends on the networks it can reach, are questions of power, and therefore of geoeconomics.
Quantum capability is concentrated, dual-use and strategically contested. Mohr and Trebesch (2025) define geoeconomics as the study of how power rivalry shapes economic policy tools, trade, finance and the transmission of geopolitical risk to investment and credit. Farrell and Newman (2019) show how states that control the hubs of global networks (payment messaging, clearing, cloud infrastructure) can weaponize interdependence, either by observing the flows that pass through those hubs or by denying access to them. A state or firm that can decrypt traffic retrospectively acquires a deferred and largely invisible form of panoptic power1 over the networks that carry financial information.
The same rivalry fragments the supply side. Crosignani et al. (2026) find that US export controls on advanced technologies imposed losses in market-value, profitability, and on the domestic suppliers subject to them, with effects transmitted to their lending banks. Text-based measures of geopolitical and policy uncertainty (Baker et al., 2016; Caldara & Iacoviello, 2022) show that such tensions depress investment and raise financing costs. For post-quantum migration, fragmentation means competing standards, restricted hardware and politically exposed vendors. Institutions that operate across blocs must then maintain several cryptographic stacks, which raises fixed costs and slows migration.
These costs fall unevenly. Evidence that institutional quality conditions how financial instability affects growth (Manasseh et al., 2026) suggests that jurisdictions with weaker regulatory governance and smaller supervisory capacity are more likely to become the weak links of a post-quantum financial system. The article refers to this group as the cryptographic periphery, because it is composed of small institutions, SMEs, municipalities and lower-capacity jurisdictions whose systems remain on vulnerable cryptography while being connected to core institutions through payments, procurement and correspondent relationships.
Whether the periphery can close this gap depends on two conditions: the time that remains before vulnerable cryptography can be broken, and the rules that govern the transition to quantum-resistant schemes. Both are addressed in the literature on the quantum transition itself.
Mosca (2018) proposed a simple inequality to decide when to act. If the time that data must remain confidential (x) plus the time needed to migrate systems (y) exceeds the time until a CRQC exists (z), the data are already at risk. NIST (2024a, 2024b, 2024c) finalized its first post-quantum standards (ML-KEM, ML-DSA and SLH-DSA) in 2024, and the fourth round selected HQC for further standardization (Alagic et al., 2025). The EU Recommendation and the coordinated roadmap adopted in June 2025 ask Member States to begin national transitions by the end of 2026 and to migrate high-risk use cases by the end of 2030 (European Commission, 2024; NIS Cooperation Group, 2025), while the Digital Operational Resilience Act (DORA) places ICT resilience duties on financial entities and, through them, on their ICT suppliers (European Parliament, & Council of the European Union, 2022a). Such roadmaps fix milestones but do not model why institutions miss them or how unequal migration affects connected institutions; that is the contribution of the models developed here.
Costeira and Morgado (2026) argue that the quantum transition is both a technical and a moral problem. They classify retrospective decryption as high-probability and high-impact, estimate that a fragmented transition is the most likely global scenario, and propose a Quantum Ethics Impact Assessment (QEIA) and a temporal-consent framework. Morgado (2026) translates this agenda to Portugal and introduces the idea of “cryptographic productivity”, under which demonstrable quantum-safe compliance lowers transaction costs, risk premia and market-access barriers for exporters, especially SMEs.
These standards and roadmaps set timelines and obligations, but they do not indicate how a public authority should rank the records, institutions and citizens and counterparties to be protected first, or how to judge whether a migration programme has been worth its cost. Public management theory offers an evaluation standard for decisions of this kind.
Moore (1995) reasons that public managers create value when a strategy is publicly valuable, legitimate and politically sustainable, and operationally feasible - the strategic triangle. Benington and Moore (2011) extend the concept to networked governance, and Bryson et al. (2014) position public value governance as a successor to traditional public administration and New Public Management. Two refinements matter here. Moore (2007) analyses public-private partnerships as negotiations in which the public side often lacks a clear definition of the value it should protect. Post-quantum migration will be delivered through such partnerships with vendors and cloud providers, many of them headquartered in other jurisdictions. Moore (2012, 2013) then proposes a Public Value Account and a Public Value Scorecard, which record financial costs and the use of state authority on one side, and mission outcomes, client satisfaction, and fairness and justice on the other.
This framework fits our problem because post-quantum migration produces mostly non-market value, namely, avoided future harm, preserved trust and protection of citizens who never chose the cryptography that protects their data. It also echoes earlier work on the economics of public administration, which argued that “the right budget for the right public services” requires measurable links between allocation, performance and accountability (Morgado, 2013).
Public value also has a distributive dimension. Deciding whose data are protected first is a decision about who bears the residual risk, and research on data-intensive technologies shows that such decisions tend to follow existing asymmetries of power.
Big data and Artificial Intelligence (AI) have already shifted power towards actors who control data infrastructures (Morgado, 2023; Morgado & Costeira, 2026). Work on data-driven policing shows that volume does not guarantee accuracy, and that technology amplifies errors when oversight is weak (Morgado et al., 2024; Morgado & Felgueiras, 2021). Earlier work introduced cryptographic justice as the principle that strong cryptographic protection should not be confined to powerful states and firms, because weakest-link dependencies turn unequal protection into systemic exposure (Costeira & Morgado, 2026; Morgado, 2026). In financial terms, the principle corresponds to the correction of a weak-link externality. Because security in a network is a weakest-link public good (Varian 2004), a node that does not migrate lowers the protection of every counterparty connected to it, so the social value of its migration exceed its private value. Leaving SMEs, municipalities, households and lower-capacity jurisdictions on vulnerable cryptography is therefore inequitable and inefficient for the system.
Taken together, these five strands of literature (cyber risk, geoeconomics, the quantum transition, public value and cryptographic justice) describe the components of the problem, but they have developed largely in isolation. Reading them side by side shows where they disagree, where they leave gaps, and what this article sets out to do.
The literature leaves three points unresolved. First, the arrival date of a CRQC is uncertain: expert estimates span roughly 5 to 15 years and depend on engineering advances that have not yet been demonstrated (Costeira & Morgado, 2026). For this reason, the analysis treats arrival as a probability distribution rather than a point forecast. Second, the evidence diverges on whether cyber risk is systemic. Aldasoro et al. (2022) find lower average cyber costs in the financial sector and among firms that use cloud services, whereas the same study and Crosignani et al. (2023) point to tail losses, provider concentration and amplification through supply chains. Third, technology controls are defended on security grounds but impose costs through fragmentation, which Crosignani et al. (2026) frame as a trade-off between security gains and fragmentation losses. The network model developed here addresses the second and third points.
Two gaps follow from this literature. First, none of the studies models the intertemporal and cross-border structure of quantum risk: studies of cyber risk measure losses after incidents occur, whereas HNDL creates exposure before any loss can be observed, and the distribution of migration costs across jurisdictions has not been linked to system-level protection. Second, post-quantum migration is usually framed as a compliance or engineering programme. The decision to protect some records, institutions, citizens and countries before others is a decision about the distribution of risk and about what counts as public value, and the public value instruments reviewed above have not been applied to it.
This article brings these strands together and asks three questions. RQ1: Through which channels does the concentration of quantum capability translate into systemic risk in interdependent financial systems? RQ2: How large is the HNDL exposure already embedded in financial and public-finance records, and why do banks, supervisors and public agencies under-invest in reducing it? RQ3: How can post-quantum migration be evaluated and coordinated as public value, so that supervisors and treasuries can prioritise, finance and audit it across borders?
The central contribution is to show, in a weakest-link interdependence game, how geoeconomic fragmentation that raises migration costs in jurisdictions with lower institutional quality turns uneven post-quantum migration into a systemic transmission mechanism, and how the allocation of a fixed support budget changes the outcome.
Two auxiliary models establish the conditions under which this mechanism operates: a time-to-exposure model of HNDL risk and a myopia model of under-investment. A numerical simulation quantifies the network mechanism, and Moore’s Public Value Account is translated into a Post-Quantum Public Value Scorecard for supervisory use. The framework is applied to Portugal, a small, open, SME-dominated economy that serves as an Atlantic gateway for subsea data links and participates in the European quantum communication infrastructure. The analysis yields three principal conclusions. First, under a 5-15-year arrival window, the last cohort of records encrypted before migration faces exposure probabilities of 0.70 to 1.00 when its confidentiality life is ten years or more, and ciphertext already harvested cannot be protected by migration so the containment of legacy data matters as much as migration. Second, accountability horizons shorter than the earliest plausible arrival remove the private incentive to invest, which supports binding supervisory milestones. Third, in the simulated network, fragmentation costs concentrated in low-quality jurisdictions reduce the protected share of link weight from 1.00 to between 0.86 and 0.32, depending on fragmentation intensity. When budgets are small and fragmentation is moderate, support targeted at those jurisdictions restores more protection than core-first or uniform allocation of the same budget. When fragmentation is high, the margin shifts to core banks, and allocations that reach them perform better. Support for the cryptographic periphery is therefore an efficiency condition as well as an equity claim. Section 2 sets out the research design, propositions and models, Section 3 presents the results, Section 4 discusses implications and limitations, and Section 5 concludes.
2. Materials and Methods
2.1. Research Design and Propositions
The study is conceptual-analytical. Because no CRQC exists, there is no loss history from which to estimate quantum risk econometrically. The study therefore follows a hypothetico-deductive method in the tradition of Whewell (2014 [1840]) and Popper (2004 [1934]). It builds three parsimonious models from established theory, calibrates them with transparent and simple assumptions, solves the network model numerically, and derives propositions that can be tested as data accumulate. The models are complemented by a structured translation of Moore’s public value instruments into indicators for post-quantum migration and by a case application to Portugal. All parameters are illustrative, since they are chosen to show mechanisms, not to forecast losses.
Following this design, the literature reviewed in Section 1 motivates four propositions, which Section 2.2, Section 2.3, Section 2.4, Section 2.5 and Section 2.6 formalize and Section 3 illustrates. P1 and P2 establish the conditions under which the central mechanism operates, P3 is the central proposition, and P4 concerns evaluation.
P1, refers to latent exposure. For any data class whose confidentiality life plus migration time exceeds the lower bound of the CRQC arrival date, HNDL exposure is positive and non-decreasing in migration delay. It is certain once that sum exceeds the latest plausible arrival date. The myopic under-investment is P2. Decision-makers whose accountability horizon is shorter than the earliest plausible CRQC arrival date, or who internalise only part of the loss, invest less than the social optimum, because without a mandate, the first group does not invest. The P3 addresses the weakest-link systemic transmission. In interdependent payment, supply and correspondent networks, system-level protection is bounded by the least-protected node. When geoeconomic fragmentation raises migration costs more in jurisdiction with lower institutional quality, uneven migration concentrates unprotected links in those jurisdictions and reduces the protection of connected core institutions. A fixed support budget raises system protection more when it is directed to the peripheral nodes at the margin of migration than when it is spread uniformly or allocated to the core, unless core institutions are themselves at the margin. The public value epitomizes the P4. Migration programmes evaluated with a multi-dimensional public value scorecard that includes residual exposure and the distribution of protection across institutions allocate protection more efficiently and more equitably than programmes evaluated on technical compliance alone.
2.2. Model 1: Time-to-Exposure under Harvest-Now, Decrypt-Later
Let time 0 be the present (2026). Let z denote the uncertain arrival time of a CRQC, with cumulative distribution function F. Consider data class i with confidentiality life xi, the number of years during which disclosure would still cause harm. Let y be the number of years until the institution completes migration to post-quantum cryptography. A record encrypted with vulnerable cryptography just before migration completes remains sensitive until xi + y. Following Mosca (2018), it is exposed if the CRQC arrives before that date. For this last vulnerable cohort, the exposure probability of data class i is therefore:
pi(y) = Pr(z < xi + y) = F(xi + y)
Records encrypted earlier in the migration period are less exposed, so Equation (1) is an upper bound for the flow of records created before migration is completed. Records already stored and harvested are a different case. A record created a years ago has a remaining confidentiality life ri, and, if its ciphertext has already been harvested, its exposure probability is:
With value at stake Vᵢ and loss-given-decryption λi, the expected HNDL loss is:
E[Li(y)] = λiViF(xi + y)
Because F is non-decreasing, exposure rises with both data longevity and migration time. The marginal value of accelerating migration by one year is λiVif(xi + y), where f is the density of z; it is positive when xi + y falls inside the window and zero once exposure is already certain.
For the calibration, the study considers the 5-15-year expert range reported by Costeira and Morgado (2026) is taken as the support of z, and z is assumed to be uniformly distributed on that interval, a simplifying scenario, so . Four stylized data classes typical of banks and public finance are considered: interbank and card payment messages (x = 1 year), credit and customer-due-diligence (CDD/KYC) files (x = 7), tax and administrative records (x = 10), and mortgage, pension and long-dated contract records (x = 25). Migration times of 2, 5, 8 and 10 years span the range from an accelerated programme to a delayed one.
2.3. Model 2: Myopic Investment and the Accountability Gap
A decision-maker (bank board, supervisor or public agency head) can pay a migration cost C today to avoid an expected loss L that materializes when the CRQC arrives. Society values the avoided loss over a long horizon . The decision-maker internalizes only a share ω ∈ [0, 1] of losses, and only those that occur within an accountability horizon h (a mandate, an electoral cycle or a bonus period). Losses are not discounted, for transparency, because discounting would widen the gap derived below. The decision-maker invests if and only if:
C < ω LF(h)
whereas the social planner invests if . The accountability gap is:
Whenever h is shorter than the earliest plausible arrival date, F(h) = 0 and the decision-maker never invests voluntarily, however large L is. HNDL sharpens this result: the exposure is created at the time of encryption, but losses are recognised when decryption becomes possible, often under a different board, supervisor or government.
2.4. Model 3: Weakest-Link Protection in Financial Networks
Consider n nodes in a payment, procurement or supply network, such as banks, payment institutions, ICT providers, public agencies and SMEs. Each node j chooses whether to migrate (sⱼ = 1) at cost cⱼ. Because an attacker can exploit the least-protected connection to reach shared data or forge authenticated messages, effective system protection follows Varian’s (2004) weakest-link technology:
S = min sj with j ∈ {1,…., n}
Node j obtains benefit bⱼ only if S = 1. Because no single node can raise S alone, no migration is always a Nash equilibrium. Universal migration is a Nash equilibrium if and only if bⱼ ≥ cⱼ for every j, so a single node with cⱼ > bⱼ removes the efficient equilibrium for the whole network. SMEs are the natural candidates, since fixed migration costs (cryptographic inventory, vendor upgrades, skills) are large relative to their size, while the benefits of system protection accrue mostly to others. This is the formal sense in which cryptographic justice is an efficiency condition, not only an equity claim.
The cross-border extension is configured by the nodes. Let nodes belong to different jurisdictions that differ in institutional quality qj ∈ [0,1], which summarizes supervisory capacity, regulatory governance and access to certified vendors. Geoeconomic fragmentation, in the form of divergent standards, export controls or vendor restrictions, adds a cost to nodes that must maintain interoperability with more than one standard, vendor ecosystem or regulatory regime. Lower institutional quality makes this cost harder to absorb, which is captured by:
where measures the intensity of fragmentation. The effective migration cost becomes cj + φj, and universal migration requires bj ≥ cj + φj for every j. A policy shock in one jurisdiction can thus lower protection for the whole system by pushing a peripheral node in a low-quality jurisdiction below its migration threshold. This is the mechanism behind P3.
2.5. Network Simulation
The pure weakest-link technology is a limiting case, in which the failure of one node removes all protection. The analytical results of Section 2.4 apply to it, whereas the quantitative results in Table 3 apply only to the weighted network described here.
To measure how far protection falls, and how a support budget should be allocated, Model 3 is extended to a weighted network in which the protection of each link depends on its two endpoints. Let wij ≥ 0 be the weight of the link between nodes i and j (for instance, the value of payments or data exchanged) and . A link is protected only if both endpoints migrate. Node i receives a benefit equal to the protected share of its link weight and bears its effective cost net of a subsidy σi:
With the benefit of full protection normalized to one, node i migrates when uᵢ ≥ 0. That is, it migrates when the protected share of its link weight is at least its net effective migration cost, ; an indifferent node migrates. Three conditions make the game supermodular: (i) link weights are non-negative; (ii) subsidies are fixed before migration decisions and do not depend on them; (iii) the gain from migrating, , is non-decreasing in each neighbour’s migration decision, so payoffs have (weakly) increasing differences.
Under these conditions, the set of pure-strategy Nash equilibria is non-empty and has a greatest element (Milgrom & Roberts, 1990). The greatest equilibrium is computed by simultaneous best-response iteration, initialized at universal migration. In each round, every node that currently migrates continues to do so only if the condition above holds, given the others’ current choices. The sequence is monotone and ends after at most n + 1 rounds.
The greatest equilibrium is the most favorable outcome that coordination can achieve. Other equilibria, down to no migration, remain possible. The protection levels reported below are therefore upper bounds, and the corresponding losses lower bounds. System protection is measured by the protected share of link weight:
The calibration considers that the network has five jurisdictions, each with one core bank and eight peripheral institutions (45 nodes). The five core banks are fully connected with link weight 4; each core bank is linked to its eight peripheral institutions with weight 1; and the peripheral institutions of each jurisdiction form a ring of supplier and correspondent links with weight 1. Each of the three layers carries one-third of the total link weight of 120. Institutional quality is q = (0.9,0.8,0.6,0.4,0.2) across the five jurisdictions. Core banks have c = 0.3, peripheral institutions draw c from a uniform distribution on [0.5, 0.9], and fragmentation intensity ranges from 0 to 0.5. The fragmentation cost φᵢ = ) applies to all nodes, core banks included, so that core banks in low-quality jurisdictions face effective costs of up to 0.3 + 0.8. Each configuration is solved for 1000 cost draws with a fixed seed. A support budget B = 4, about one-seventh of the expected migration cost of the peripheral institutions, is allocated in five ways: no support; core-first (0.8 to each core bank); uniform (4/45 to every node); periphery-uniform (0.1 to each peripheral institution); and targeted (0.25 to each of the 16 peripheral institutions in the two lowest-quality jurisdictions). Subsidies reduce the net effective cost, with a floor of zero. Budgets of 2 and 6 are used as robustness checks.
The computation and reproducibility is accomplished by following the path described. For each value of and each allocation, the greatest equilibrium is computed for the same 1000 cost draws, so that differences across allocations reflect the allocation and not sampling noise. Peripheral costs are drawn once, as 40 independent uniform values per draw, with NumPy’s default generator (PCG64) and seed 2026. The core-bank costs are fixed at 0.3. Subsidies are set before migration decisions and enter only through the net effective cost, max(cᵢ + φᵢ − σᵢ, 0). Table 3 reports the mean of Sw across draws and its 5th percentile, computed by linear interpolation between order statistics (the numpy.percentile default). Indifference arises only for some core banks at = 0.5. Resolving ties against migration changes one entry of Table 3: targeted support at = 0.5 moves from 0.71 [0.60] to 0.66 [0.50].2
2.6. Post-Quantum Public Value Scorecard
The models explain why exposure exists, why decision-makers leave it unaddressed and how it spreads through networks. They do not indicate how a supervisor should judge a migration programme, or whom it should protect first. The scorecard provides that evaluative step and links back to the models through a residual HNDL exposure indicator and the protected share of link weight (section 2.5).
Moore’s (2012, 2013) Public Value Account and Scorecard are mapped onto post-quantum migration and designed as a supervisory risk-governance instrument. The account records (i) financial costs, (ii) use of state authority (mandates, supervisory requirements, procurement rules), (iii) mission outcomes (reduced HNDL exposure, continuity of payments and public services), (iv) client and citizen experience, and (v) fairness and justice (distribution of protection across institution size, region and population group). Following the strategic triangle, a legitimacy-and-support perspective and an operational-capacity perspective are added, together with a systemic-interdependence perspective that records exposure to unmigrated counterparties. For each dimension, indicators are drawn from reporting that already exists under DORA and the NIS2 directive (European Parliament & Council of European Union, 2022a, 2022b), such as ICT risk registers, incident reports and EU roadmap milestones, and from the QEIA criteria of Costeira and Morgado (2026).
2.7. Case Context and Data
The models and the scorecard are stated in general terms. Their interaction is easier to observe in a single setting, where structural weak links, cross-border exposure and supervisory instruments coexist.
Portugal is chosen as an application because it combines a digitized state, a financial sector subject to DORA, participation in EuroQCI through the Portuguese Quantum Communication Infrastructure (PTQCI) and an enterprise structure in which SMEs account for 99.9% of firms, about 78% of employment and about 60% of value added (Instituto Nacional de Estatística 2025, as reported in Morgado 2026). It is also a landing point for transatlantic and Europe-Africa subsea data cables, a position that Morgado (2026) identifies as an investment lever for PTQCI. Portugal is therefore a case of a small, open economy located at a hub of global data flows yet dependent on foreign technology for its cryptographic infrastructure. Scenario probabilities and cost-benefit ranges for the global transition are taken from Costeira and Morgado (2026) and used only as context for the public value analysis. The application derives policy options suggested by the framework, because it does not estimate Portuguese exposure.
3. Results
The results are reported in the order of the propositions. Section 3.1 applies Model 1 to four classes of financial records (P1), and Section 3.2 applies Model 2 to the investment decision (P2). Section 3.3 presents the central result: the transmission channels and the network simulation of Model 3 (P3). Section 3.4 presents the Post-Quantum Public Value Scorecard (P4). Section 3.5 applies the framework to Portugal.
3.1. HNDL Exposure Can Already be Material for Long-Lived Financial Records
Evaluating HNDL risk across heterogeneous data classes demonstrates that, under the paper’s illustrative assumptions, the window for mitigation may already have closed for long-lived records. Table 1 reports the exposure probability pᵢ(y) of the last vulnerable cohort for the four data classes under the uniform 5-15-year arrival assumption. Records with a confidentiality life of ten years or more face exposure probabilities of 0.70 to 1.00 even under an accelerated two-year migration. Credit and CCD/KYC files move from 0.40 exposure under a two-year migration to 1.00 under an eight-year migration. Short-lived payment messages are the only class for which speed is decisive: exposure is zero with a two-year programme, 0.10 with five years and 0.60 with ten years.
Changing the arrival window does not shift every entry of Table 1 by 0.20, because exposure probabilities are bounded by 0 and 1. Shifting the window two years later (7 to 17 years) lowers by 0.20 the entries with xi + y between 7 and 15 years, lowers by less those between 5 and 7 years, and leaves entries at or below 5 years at 0.00 and entries at or above 17 years at 1.00. Of the 16 entries, seven fall by 0.20 and one by 0.10 (payment messages with y = 5 , from 0.10 to 0.00); the other eight are unchanged. Tax records with a two-year migration, for example, fall from 0.70 to 0.50, whereas tax records with an eight-year migration remain at 1.00. Shifting the window two years earlier (3 to 13 years) raises by 0.20 the six entries withxi + y between 5 and 13 years and leaves the other ten unchanged. Long-dated contracts remain at 1.00 in both cases, and the ranking of data classes is the same in every window, so the qualitative conclusions are robust to the ±2-to-3-year timing uncertainty discussed by Costeira and Morgado (2026).
Two implications follow (P1). First, for long-lived records, the response must distinguish three objectives. Prevention, through migration, protects records created after migration is completed. Reduction of accessible legacy exposure, through re-encryption of stored archives under post-quantum schemes and the minimization and deletion of data that no longer need to be retained, limits what can still be harvested. Mitigation addresses ciphertext already harvested, to which Equation (2) applies and which re-encryption cannot recover; it includes the rotation of long-lived credentials and keys, contractual and legal preparation for disclosure, and monitoring. For a tax record created in 2021 (x = 10, a = 5), ri = 5 and F(5) = 0, so a harvested copy is not exposed under the assumed window; for a mortgage contract signed in 2016 (x = 25, a = 10), ri = 15 and F(15) = 1, so any copy already harvested should be treated as exposed. Second, the marginal benefit of faster migration is concentrated on data whose confidentiality life is short to medium, which corresponds to the transactional traffic that dominates payment and settlement volumes. Prioritisation should therefore be driven by the value at stake, λi Vi, and by where xi + y and ri fall relative to the arrival window, not by system age or vendor schedules.
3.2. Myopia Produces a Large Accountability Gap
The framework suggests that the primary structural barrier to post-quantum readiness is an agency problem wherein executive incentive horizons are decoupled from multi-decade cryptographic risk. Model 2 shows why voluntary migration lags. A decision-maker with a four-year accountability horizon perceives F(h) = 0 and does not invest without a mandate, whatever the size of the avoidable loss. With an eight-year horizon and half of losses internalised (ω = 0.5), the perceived benefit is 0.15L, compared with a social benefit of L (because F(T̄) = F(15) = 1 under the assumed window, so that all of the loss falls within the planner’s horizon) over a fifteen-year horizon (), an accountability gap of 85% of the avoidable loss. P2 is likely to bind where accountability, compensation, and expected sanctions are concentrated within a horizon shorter than the lower bound of the CRQC arrival distribution. The pattern resembles the intertemporal failure that Morgado (2014) identified in Portuguese fiscal adjustment between 1995 and 2012, when the costs of delayed structural reform were shifted onto future budgets.
3.3. Systemic Transmission: From Concentrated Capability to Cross-Border Contagion
While post-quantum vulnerability is experienced at the firm level, the structural concentration of cryptographic dependencies creates channels through which localized compromises may propagate as macroprudential shocks. Combining Models 1 and 3 with the empirical cyber-risk literature yields five transmission channels through which quantum capability, once concentrated, becomes systemic financial risk (Table 2). Each channel has a documented conventional-cyber analogue, which provides a basis for future measurement, and each is amplified by the interdependence of financial networks.
A sixth, cross-cutting channel is geoeconomic, and it operates through the cross-border extension of Model 3. Consider first a minimal network of core banks, each with benefit b = 1 and migration cost c = 0.6, connected through payment and correspondent links to one peripheral institution with c = 0.8. Without fragmentation, every node has c < b and universal migration is an equilibrium. If divergent standards or an export restriction add a fragmentation cost φ = 0.3 for the peripheral node only, its effective cost rises to 1.1 and it no longer migrates. Under the pure weakest-link technology, system-level protection falls to zero for every connected institution, although the core banks’ own costs are unchanged.
The network simulation of Section 2.5 measures how far this mechanism extends when protection is link-based rather than all-or-nothing (Table 3). With , all 45 institutions migrate in the greatest equilibrium in every draw. From , peripheral institutions in the low-quality jurisdictions begin to exit, and each exit lowers the protected share of their neighbours’ links, which induces further exits along the peripheral ring. The protected share of link weight falls to 0.86 at , 0.72 at 0.3 and 0.64 at 0.4. At , all peripheral institutions migrate in the two highest-quality jurisdictions, whereas the share falls to 0.71, 0.15 and 0.04 in the jurisdictions with q = 0.6, 0.4 and 0.2. At , the exit of the periphery lowers the benefit of the core banks in the lower-quality jurisdictions below their effective cost; the core banks exit in cascade, in every draw for q = 0.4 and 0.2 and in 88% of draws for q = 0.6, and protected link weight falls to 0.32.
Table 3 also compares the five allocations of the same budget. Their rank depends on both fragmentation intensity and budget size. With a budget of 4 (B = 4), some deductions are possible. Core-first support has no effect for , because the core banks already migrate and the subsidy is inframarginal. Uniform, periphery-uniform and targeted support all restore full protection at but spread the budget over nodes that would migrate anyway. At and 0.4, targeted support yields the highest protection (0.96 and 0.91, against 0.72 and 0.64 without support and 0.91 and 0.78 with uniform support). At it also raises the share of migrating institutions from 0.52 to 0.87. The remaining gap is then located in the jurisdiction with q = 0.6, which becomes the new margin. At , the ranking changes because core banks are at the margin. Uniform (0.72), and targeted support (0.71) perform similarly, ahead of core-first (0.62), and periphery-uniform support (0.52).
With B = 2, targeted support remains the most effective for between 0.2 and 0.4. At it gives 0.93, against 0.82 for uniform support. At it falls to 0.37, below uniform (0.65) and core-first support (0.62), because a small budget spread over 16 peripheral institutions no longer prevents core banks from exiting.
For B = 6, periphery-uniform and uniform support reach 1.00 and 0.99 at , against 0.96 for targeted support, because the larger budget also covers the jurisdiction with q = 0.6. Targeted support remains marginally ahead at against 0.90) and ahead at (0.88 against 0.76).
Targeting the periphery of low-quality jurisdictions is therefore the most effective allocation when budgets are small and fragmentation is moderate. When fragmentation is high and budgets are small, support must reach core banks. When budgets are larger, broader support to the periphery performs as well.
The results support P3. A policy decision taken in one jurisdiction can lower the protection of a network by pushing its least-resourced members below the migration threshold, consistent with the finding of Crosignani et al. (2026) that technology controls generate losses beyond their intended targets. Weak links concentrate in jurisdictions with lower institutional quality (Manasseh et al., 2026). The protection lost there reduces the protected share of the links of their core banks and, at high fragmentation, the exit of those banks removes protection from their links with core banks in high-quality jurisdictions. In networks where control of hubs confers power over flows (Farrell & Newman, 2019), fragmentation thus transmits shifts in global technological power into systemic financial risk (Mohr & Trebesch, 2025).
3.4. A Post-Quantum Public Value Scorecard
Translating post-quantum preparedness from an abstract technological imperative into enforceable supervisory policy requires a structured framework that reconciles private operational capabilities with the macroprudential interest in systemic resilience. Table 4 operationalizes P4 by translating Moore’s Public Value Account and Scorecard into indicators that supervisors, banks and public agencies can collect largely from existing reporting. The scorecard is designed as a supervisory risk-governance instrument. Its two core metrics are the residual HNDL exposure index, which aggregates Equations (1)-(3) across data classes, and the protected share of link weight, which applies Equation (9) to an institution’s critical counterparties.
3.5. Application to Portugal
Portugal illustrates how the models interact. The SME share of firms, employment and value-added means that the weakest-link problem of Model 3 is structural rather than marginal. As an open economy located at a hub of subsea data links, Portugal is exposed to both sides of P3. Its SMEs, municipalities and smaller financial institutions are potential weak links for European payment and procurement networks, while its cross-border position heightens its sensitive to the fragmentation cost φⱼ. Long-lived public records (e.g. tax, justice, health and social-security data accumulated over two decades of digitization) fall in the fully exposed rows of Table 1, and copies already harvested fall under Equation (2), so containment matters as much as migration. At the same time, PTQCI participation and DORA obligations give the state and supervisors instruments to close the accountability gap of Model 2 (Morgado, 2026).
Applying the scorecard yields three policy options. First, Banco de Portugal (BdP) and the National Cybersecurity Center (CNS) could require financial entities to report a residual HNDL exposure index alongside existing DORA ICT-risk information, turning a latent risk into a supervised one. Second, shared testing, certification and procurement frameworks for SMEs and municipalities would lower cⱼ for the weakest nodes, consistent with the cryptographic productivity agenda and with value-for-money principles that align budget allocation with service outcomes (Morgado, 2013, 2026). Third, an independent office for quantum readiness, reporting annually to Parliament, would supply the legitimacy-and-support perspective of the scorecard and provide the persistent accountability that Moore (2012) identifies as the weakest element of public performance systems.
4. Discussion
The results bear on three groups of decision-makers and on one normative question. Supervisors decide how quantum risk enters prudential oversight; international authorities decide how far that oversight extends across borders; banks and public agencies decide how migration is sequenced and financed. The normative question is whether protecting the weakest nodes is a matter of equity alone. The discussion follows this order.
The central policy message is that quantum risk should be supervised as a present operational risk with a future loss date. Three instruments follow. First, residual HNDL exposure can be added to ICT-risk reporting under DORA and to supervisory stress-testing scenarios, in the same way that climate-related risks were brought into supervisory frameworks before losses materialized. A cryptographic stress test would combine Table 1 with Equation (2) for legacy archives and with the network exposure measured by Equation (9). Second, because Model 2 shows that voluntary investment is unlikely when accountability horizons are short, binding milestones aligned with the EU roadmap are justified on efficiency grounds inasmuch as they convert a diffuse future benefit into a present compliance obligation. Third, supervisors should monitor vendor concentration in post-quantum delivery, since the common-mode channel in Table 2 can turn a single implementation flaw into a system-wide event.
These recommendations are consistent with the finance-and-institutions literature. Levine (1996) emphasized that financial systems promote growth by reducing information and transaction costs, a function that post-quantum integrity preserves. Allen and Gale (2000) showed that network structure governs contagion, which is observed in Model 3. The model identifies cryptographic heterogeneity as a further dimension of that structure. Evidence that institutional quality conditions how financial instability affects growth (Manasseh et al. 2026) and that information asymmetry shapes firm financing decisions (Eldomiaty et al. 2026) suggests that cryptographic credibility may become part of the institutional premium that markets price.
Supervision of this kind is organized by jurisdiction, whereas the networks it must protect are not. If cryptographic credibility is priced at the level of institutions and countries, a supervisor that secures its own institutions remains exposed through every foreign counterparty that has not migrated.
Because protection is bounded by the weakest node and fragmentation raises costs most where institutional quality is low, national migration programmes are necessary but not sufficient. Four forms of coordination follow from the analysis. First, the quantum readiness of cross-border hubs (payment-messaging networks, central counterparties, major cloud and certificate-authority providers) should be overseen jointly by the authorities whose systems depend on them, since a failure at a hub is a failure for every connected jurisdiction. Second, mutual recognition of post-quantum certification and testing would reduce the fragmentation cost for institutions operating across regulatory regimes; in the terms of Equation (7), it lowers . Third, technical assistance, shared testing environments and pooled procurement for lower-capacity jurisdictions raise qj and lower cj at the margin; the simulation shows that, in a weakest-link network, such support raises the protection of the core as well as that of the periphery. Fourth, multilateral norms against the mass harvesting of civilian financial data, of the kind proposed in the Quantum Geneva Convention (Costeira & Morgado, 2026), would address the source of HNDL exposure as well as its consequences.
For the European Union, these measures sit within a tension between strategic autonomy and openness. Sovereign quantum communication infrastructure such as EuroQCI strengthens control over critical links, but an EU-only cryptographic ecosystem would raise φⱼ for European institutions with global counterparties. The public value perspective suggests resolving this tension case by case, by asking which value (confidentiality, integrity, continuity or access) each choice protects, and for whom.
The same question applies within each jurisdiction, where migration is carried out by individual banks and public agencies. For them, the issue is how to sequence and finance migration within existing budget cycles.
For banks, the immediate task is a cryptographic inventory organized by data class, confidentiality life and age of stored records, not by system. Table 1 and Equation (2) imply that archives of long-dated contracts and customer files require reduction and mitigation measures now, while transactional channels require speed. Hybrid classical and post-quantum schemes allow capital expenditure to be spread over budget cycles without leaving new traffic exposed. Liquidity buffers and credit lines, which Crosignani et al. (2023) found to cushion cyber contagion, are relevant contingency tools for counterparties of compromised institutions.
For treasuries and public agencies, the scorecard shifts the question from ‘how much does migration cost?’ to ‘which value is protected, for whom, and at what use of public authority?’. This reframing matters because, as Moore (2007) warns, public–private partnerships often fail to protect public value when the public side cannot articulate it. Procurement rules that require crypto-agility, open standards and independent audit are the practical form of that articulation, and they limit lock-in that would otherwise transfer value to dominant vendors.
Measures of this kind are within reach of large banks and central administrations but are harder to implement for small institutions and municipalities. This raises the question of whether public support for these nodes is a transfer to the periphery or an investment in the protection of the system.
Model 3 and the simulation provide a formal answer. If system protection is bounded by the weakest nodes, subsidizing migration for SMEs, municipalities and small payment institutions at the margin a cost-effective way to raise system-level protection under the conditions identified. Shared testing environments, certification pathways and pooled procurement reduce the fixed cost that makes cj + φj > bj for small nodes, while also supporting the export competitiveness that Morgado (2026) describes as cryptographic productivity. The same logic extends internationally: excluding lower-income economies from quantum-safe infrastructure would leave weak links in global payment and trade-finance networks (Costeira and Morgado 2026). In regulatory terms, two instruments follow. A prudential treatment that recognises verified migration of critical counterparties, for instance within Pillar 2 assessments of operational risk under the Basel framework, would reward institutions for raising protection beyond their own perimeter. A charge on institutions that remain unmigrated in systemically connected positions would act as a Pigouvian correction of the weak-link externality.
These implications rest on stylized models and illustrative parameters. Their strength depends on assumptions that can be stated explicitly and tested as data accumulate.
The study has six main limitations. First, the calibration is illustrative: the uniform arrival distribution, the four data classes, the parameters of Model 2 and the network topology are chosen for transparency, not estimated. Second, the models abstract from adversary behavior; in practice, harvesting is selective and targeted at high-value data, which would raise λi for some institutions. Third, Model 3 treats fragmentation intensity and institutional quality as exogenous, whereas fragmentation results from strategic interaction between states, and real networks combine weakest-link and best-shot elements, such as segmentation and key-rotation controls. Fourth, the simulation reports the greatest equilibrium, which assumes that institutions coordinate on the best outcome available to then, Coordination failure could select worse equilibria, so the reported protection levels are upper bounds and the losses lower bounds. Fifth, the Portuguese application is qualitative. Sixth, the models measure cryptographic protection, not financial outcomes. They identify a channel of systemic operational risk, and the links from unprotected nodes to liquidity disruption, losses and market spillovers are taken from the empirical literature.
Future research can test the propositions with emerging data. P1 can be examined with cryptographic inventories disclosed to supervisors; P2 with variation in board tenure, supervisory mandates and electoral timing; and P4 by comparing migration outcomes between agencies that adopt scorecard-based evaluation and those that rely on compliance checklists. P3 lends itself to three empirical designs: (i) supplier and correspondent networks of the kind used by Crosignani et al. (2023), which would replace the stylized topology of Section 2.5; (ii) equity-market co-movements around quantum milestones and technology-control announcements, where, if quantum risk is systemic, abnormal returns should co-move more strongly among institutions linked to weakly protected counterparties and across jurisdictions affected by the same controls; and (iii) panel regressions of migration status on institutional-quality indicators, testing whether migration costs decrease with qj. Text-based measures of quantum-risk disclosure in annual reports, in the spirit of Baker et al. (2016) and Caldara and Iacoviello (2022), would allow the market pricing of quantum readiness to be studied directly, and temporal machine-learning designs such as that of Pawala et al. (2026) could help supervisors rank institutions by residual exposure once panel data become available.
5. Conclusions
Quantum computing turns a familiar operational risk into an intertemporal and geopolitical one. The capability to break current public-key cryptography is concentrating in a few states and firms, while the financial systems that depend on that cryptography are interdependent. Because encrypted data can be harvested now and decrypted later, the financial system is already accumulating exposure whose loss date is uncertain, but whose creation date is the present. The time-to-exposure model shows that, under a 5- to 15-year arrival window, long-lived financial and public records whose remaining confidentiality horizon overlaps the CRQC arrival distribution are already exposed. Records already harvested cannot be protected retrospectively by migration. The myopia model explains why boards, supervisors and agencies with short accountability horizons will not close this gap voluntarily. The weakest-link model, extended across borders and simulated on a core–periphery network, yields the central result: when fragmentation costs are higher where institutional quality is lower, uneven migration turns the least-protected institutions and jurisdictions into channels of systemic exposure. Protection falls as fragmentation rises even under full coordination. When budgets are small and fragmentation is moderate, support directed to the margin of migration restores more protection than support allocated to the core or spread uniformly. At high fragmentation, the margin moves to core banks, and support must reach them.
The public value perspective converts these findings into a supervisory instrument. The Post-Quantum Public Value Scorecard records costs and the use of public authority alongside mission outcomes, client and citizen experience, fairness and network exposure, and anchors them in two forward-looking metrics: the residual HNDL exposure index and the protected share of link weight. Applied to Portugal, the framework suggests supervised exposure reporting, shared infrastructure for SMEs and municipalities, and independent parliamentary accountability as policy options.
Cryptographic justice and financial stability are therefore complementary objectives. In interdependent finance, supporting the weakest nodes is an efficient way to protect the system, and doing so before a CRQC arrives is the only way to limit the stock of data that can still be harvested. Shifts in global technological power will be transmitted into financial systems through their weakest cryptographic links unless supervisors coordinate across borders, reduce the costs of fragmentation and support the periphery. Treating quantum readiness as part of systemic resilience, and evaluating it as public value, gives institutions and governments a measurable path from awareness to action.
Author Contributions
Conceptualization, S.M.A.M.; methodology, S.M.A.M.; formal analysis, S.M.A.M.; investigation, S.M.A.M.; writing—original draft preparation, S.M.A.M.; writing—review and editing, S.M.A.M.; supervision, S.M.A.M. The author has read and agreed to the published version of the manuscript.
Funding
This research was funded by the FCT – Fundação para a Ciência e a Tecnologia, I.P., Refª UID/04915/2025, through its support of the ICPOL - ISCPSI Research Centre https://doi.org/10.54499/UID/04915/2025
Data Availability Statement
The original contributions presented in this study are included in the article material. All values reported in Table 1 can be reproduced from Equation (1) and the calibration in Section 2.2. All values in Table 3, and the robustness checks reported in Section 3.3, can be reproduced by the Algorithm 1. Greatest-equilibrium computation. Further inquiries can be directed to the corresponding author(s).
Conflicts of Interest
The authors declare no conflicts of interest.
Abbreviations
The following abbreviations are used in this manuscript:
| AI | Artificial Intelligence |
| BdP | Banco de Portugal |
| CAPEX | Capital Expenditure |
| CDD | Customer-Due-Diligence |
| CNS | National Cybersecurity Centre |
| CRQC | Cryptographically Relevant Quantum Computer |
| DORA | Digital Operational Resilience Act |
| HHI | Herfindahl-Hirschman Index |
| HNDL | Harvest-Now, Decrypt-Later |
| HR | Human Resource |
| HSM | Hardware Security Module |
| ICT | Information and Communication Technology |
| KYC | Know Your Customer |
| OPEX | Operating Expenditure |
| PKI | Public-Key Infrastructure |
| PQC | Post-Quantum Cryptography |
| PQ-PVS | Post-Quantum Public Value Scorecard |
| PTQCI | Portuguese Quantum Communication Infrastructure |
| QEIA | Quantum Ethics Impact Assessment |
| SME | Small and Medium-sized Enterprise |
| 1 | For the architectural paradigm of the panoptic schema, see Bentham (1971), in which the author proposes a circular institutional apparatus wherein the continuous visibility of the subject and the unverifiable presence of the inspector establish a state of conscious and permanent observation. This architectural mechanism was subsequently theorized as a generalizable paradigm of disciplinary power by Foucault (1975), who argued that the modern social order substitutes direct physical coercion with internalized, anticipatory self-regulation. Contemporary surveillance scholarship frequently extends this framework to digital architectures, often termed the ‘electronic panopticon’, ‘superpanopticon’ or ‘panopticon sort’ to analyze how algorithmic opacity, pervasive telemetry, and asymmetric data extraction induce behavioral conformity. However, critical divergence from the classical Foucauldian model is commonly noted, that whereas Benthamite and classical panopticism rely on physical enclosure and punitive containment, digital surveillance operates primarily through distributed, participatory data submission, automated classification, and predictive behavioral sorting. |
| 2 |
Algorithm 1. Greatest-equilibrium computation:
Input: weights wᵢⱼ ≥ 0; quality qᵢ; fragmentation φ̄; subsidies σᵢ; cost draws c⁽ʳ⁾, r = 1,…,1000 (PCG64, seed 2026).
For each draw r: 1. .; 2. sᵢ ← 1 for all i.; 3. Repeat: 1[] for all i simultaneously; s ← s′; until s is unchanged.; 4. ←
Output: mean and 5th percentile of across the 1000 draws.
|
References
- Akoto, W., & Herr, T. (2026). Buried in the ground: Finding the cost of cyber economic espionage. Journal of Cyber Policy, 11(1), 37–55. [CrossRef]
- Al-Shattarat, W., Benameur, K. B., Mostafa, M. M., Hassanein, A., & Hamed, R. S. (2025). A decade of cybersecurity research in business, management, and accounting: Bibliometric analyses and future research directions. Cogent Business & Management, 12(1), 2544230. [CrossRef]
- Alagic, G., Bros, M., Ciadouz, P., Cooper, D., Dang, Q., Dang, T., Lichtinger, J., Liu, Y-K, Miller, C., Moody, D., Peralta, R., Perlner, R., Robinson, A., Silberg, H., Smith-Tone, D., & Waller, D. (2025). Status Report on the Fourth Round of the NIST Post-Quantum Cryptography Standardization Process. NIST IR 8545. Gaithersburg: National Institute of Standards and Technology. [CrossRef]
- Aldasoro, I., Gambacorta, L., Giudici, P., & Leach, T. (2022). The drivers of cyber risk. Journal of Financial Stability, 60, 100989. [CrossRef]
- Allen, F., & Gale, D. (2000). Financial contagion. Journal of Political Economy, 108(1), 1–33. [CrossRef]
- Baker, S. R., Bloom, N., & Davis, S. J. (2016). Measuring economic policy uncertainty. Quarterly Journal of Economics, 131(4), 1593–636. [CrossRef]
- Benington, J., & Moore, M. H. (2011). Public value in complex and changing times. In J. Benington, & M. H. Moore (Eds.), Public Value: Theory and Practice. (pp. 1-30). Palgrave Macmillan. https://archive.org/details/publicvaluetheor0000unse/page/n5/mode/2up.
- Bentham, J. (1971). Panopticon or, The Inspection-House. T. Payne.
- Bryson, J. M., Crosby, B. C., & Bloomberg, L. (2014). Public value governance: Moving beyond traditional public administration and the New Public Management. Public Administration Review, 74(4), 465–477. [CrossRef]
- Caldara, D., & Iacoviello, M. (2022). Measuring geopolitical risk. American Economic Review, 112(4), 1194–225. [CrossRef]
- Camillo, M. (2017). Cyber risk and the changing role of insurance. Journal of Cyber Policy, 2(1), 53–63. [CrossRef]
- CISA, NSA, & NIST. (2023). Quantum-Readiness: Migration to Post-Quantum Cryptography. Cybersecurity and Infrastructure Security Agency.
- Costeira, M., & Morgado, S. M. A. (2026). Strategic ethics in an age of existential technology: Post-quantum security, geopolitics, and the red lines we cannot cross. In A. Rocha, E. T. Pereira, I. Bianchi, M. Au-Yong-Oliveira, & T. Herawan (Eds.), New Perspectives in Economics and Management. WorldCEM 2025. Springer Proceedings in Business and Economics, (Vol. 1, pp. 19–31). Springer. [CrossRef]
- Crosignani, M., Han, L., Macchiavelli, M., & Silva, A. F. (2026). Securing technological leadership? The cost of export controls on firms. Journal of Financial Economics, 175, 104192. [CrossRef]
- Crosignani, M., Macchiavelli, M., & Silva, A. F. (2023). Pirates without borders: The propagation of cyberattacks through firms’ supply chains. Journal of Financial Economics, 147(2), 432–448. [CrossRef]
- Eldomiaty, T., Fouad, J., Azzam, I. A. A., & Mohamed, R. (2026). Modeling the expected effects of severe versus tolerable information asymmetry on firm growth. Journal of Risk and Financial Management, 19(9), 650. [CrossRef]
- European Commission. (2024). Commission Recommendation (EU) 2024/1101 on a coordinated implementation roadmap for the transition to post-quantum cryptography. Official Journal of the European Union. http://data.europa.eu/eli/reco/2024/1101/oj.
- European Parliament, & Council of the European Union. (2022a). Regulation (EU) 2022/2554 of 14 December 2022 on digital operational resilience for the financial sector (DORA). Official Journal of the European Union, L 333, 1–79. http://data.europa.eu/eli/reg/2022/2554/oj.
- European Parliament, & Council of the European Union. (2022b). Directive (EU) 2022/2555 of 14 December 2022 on measures for a high common level of cybersecurity across the Union (NIS 2 Directive). Official Journal of the European Union, L 333, 80–152. http://data.europa.eu/eli/dir/2022/2555/oj.
- Farrell, H., & Newman, A. L. (2019). Weaponized interdependence: How global economic networks shape state coercion. International Security, 44(1), 42–79. [CrossRef]
- Foucault, M. (1975). Surveilleer et punir: Naissance de la prison. Editions Gallimard.
- Instituto Nacional de Estatística. (2025). Destaque: Dia internacional das micro, pequenas e médias empresas. INE.
- Kuzior, A., Brożek, P., Kuzmenko, O., Yarovenko, H., & Vasilyeva, T. (2022). Countering cybercrime risks in financial institutions: Forecasting information trends. Journal of Risk and Financial Management, 15(12), 613. [CrossRef]
- Levine, R. (1996). Financial development and economic growth: Views and agenda. Policy Research Working Paper, World Bank.
- Manasseh, C. O., Logan, C. Sp, Eleje, E., Ejime, O. M., Akamobi, O. G., & Nkwonta, N. C. (2026). Impact of financial market stability, national security, and FDI on economic growth in Sub-Saharan Africa: Does institutional quality matter? Journal of Risk and Financial Management, 19(9), 649. [CrossRef]
- Milgrom, P., & Roberts, J. (1990). Rationalizability, learning, and equilibrium in games with strategic complementarities. Econometrica, 58(6), 1255–1277. [CrossRef]
- Mohr, C., & Trebesch, C. (2025). Geoeconomics. Annual Review of Economics, 17, 563–87. [CrossRef]
- Moore, M. H. (1995). Creating public value: Strategic management in government. Harvard University Press. https://raggeduniversity.co.uk/wp-content/uploads/2025/03/CreatingPublicValueStrategicManagementinGovernmentbyMarkH.Moore-a-_compressed.pdf.
- Moore, M. H. (2007). Criando valor público por meio de parcerias público-privadas. Revista do Serviço Público, 58(2), 151–179. [CrossRef]
- Moore, M. H. (2012). Recognizing public value: Developing a Public Value Account and a Public value scorecard. Working Paper. http://publiccommons.ca/public/uploads/literature/Moore-9.4.12.pdf.
- Moore, M. H. (2013). Recognizing public value. Harvard University Press.
- Morgado, S. (2013). Economics of public administration: The right budget to the right public services—The new management mythology? In Z. V. Sovreski, M. Mokryš, Š. Badura, & A. Lieskovský (Eds.) Proceedings in Global Virtual Conference Workshop (GV-CONF 2013) (pp. 79-83). EDIS—Publishing Institution of the University of Zilina.
- Morgado, S. M. A. (2014). (Des)Ajustamento das finanças públicas em Portugal (1995–2012). Revista da Unidade de Investigação do Instituto Politécnico de Santarém, 2(2), 163–74.
- Morgado, S. M. A. (2023). Inteligência artificial e metamorfose dos paradigmas: Economia na era da transformação. Paper presented at Congresso Nacional da Ordem dos Economistas. https://www.ordemeconomistas.pt/xportalv3/file/XEOCM_Documento/74260936/file/Sónia%20Aniceto%20Morgado.pdf.
- Morgado, S. M. A. (2026). Quantum governance for good: Post-quantum cryptography, cryptographic justice and economic resilience in Portugal. Ordem dos Economistas. https://ordemeconomistas.pt/xportalv3/file/XEOCM_Documento/87257240/file/Trabalho%20para%20o%20Congresso%20-%20Sess_o%201%20-%20S_nia%20Morgado.pdf or https://sl1nk.com/x7zmg0y.
- Morgado, S. M. A., & Costeira, M. (2026). Big data and economic science: Redefining evidence, models, and policy design. In A. Rocha, E. T. Pereira, I. Bianchi, M. Au-Yong-Oliveira, & T. Herawan (Eds.), New Perspectives in Economics and Management. WorldCEM 2025. Springer Proceedings in Business and Economics, (Vol. 1, pp. 285–97). Springer. [CrossRef]
- Morgado, S. M. A., & Felgueiras, S. (2021). Big data in policing: Profiling, patterns, and out of the box thinking. In Á. Rocha, H. Adeli, G Dzemyda, F. Moreira, A. M. R. Correia (Eds.), Trends and Applications in Information Systems and Technologies. WorldCIST 2021. Advances in Intelligent Systems and Computing (vol 1365, pp. 217-226). Springer. [CrossRef]
- Morgado, S. M. A., Nabais, T., & Felgueiras, S. (2024). Unveiling the project fAcilitating Public & Private secuRity operAtors to mitigate terrorIsm Scenarios against soft targEts—APPRAISE. In R. N. A. Fernandes, & P. Machado (Eds.), 40 Anos das Ciências Policiais em Portugal (pp. 401-412). ICPOL.
- Mosca, M. (2018). Cybersecurity in an era with quantum computers: Will we be ready? IEEE Security & Privacy, 16(5), 38–41. [CrossRef]
- National Institute of Standards and Technology. (2024a). Module-lattice-based key-encapsulation mechanism standard (FIPS 203). U.S. Department of Commerce. [CrossRef]
- National Institute of Standards and Technology. (2024b). Module-lattice-based digital signature standard (FIPS 204). U.S. Department of Commerce. [CrossRef]
- National Institute of Standards and Technology. (2024c). Stateless hash-based digital signature standard (FIPS 205). U.S. Department of Commerce. [CrossRef]
- NIS Cooperation Group. (2025). A coordinated implementation roadmap for the transition to post-quantum cryptography. European Commission. https://securitydelta.nl/media/com_hsd/report/750/document/Roadmap-on-postquantum-cryptography-PzBJxNUYyeuEdVUacWL696DofZQ-117507.pdf.
- Pawala, T., Narkbunnum, W., & Wisaeng, K. (2026). From static labels to event-based prediction: A temporal machine-learning framework for SME business dissolution in an emerging market. Journal of Risk and Financial Management, 19(9), 652. [CrossRef]
- Popper, K. (2004). The Logic of Scientific Discovery (Original work published 1934). Routledge.
- Sukumar, S., & Balasubramanian, S. (2026). Risk management in Indian public sector banking: An empirical analysis of credit, market, and operational risks under Basel III. Journal of Risk and Financial Management, 19(9), 651. [CrossRef]
- Varian, H. R. (2004). System reliability and free riding. In L. J. Camp, & S. Lewis (Eds.) Economics of Information Security (pp.1-15). Kluwer Academic Publishers. [CrossRef]
- Whewell, W. (2014). The philosophy of the inductive sciences: Founded upon their history (Original work published 1840). Cambridge University Press. [CrossRef]

Table 1.
Conditional exposure probability (CRQC arrival uniform on 5 to 15 years from 2026)
| Data class (confidentiality life x) | y = 2 years | y = 5 years | y = 8 years | y = 10 years |
| Payment and interbank messages (1 year) | 0.00 | 0.10 | 0.40 | 0.60 |
| Credit and CDD/KYC files (7 years) | 0.40 | 0.70 | 1.00 | 1.00 |
| Tax and administrative records (10 years) | 0.70 | 1.00 | 1.00 | 1.00 |
| Mortgage, pension and long-dated contracts (25 years) | 1.00 | 1.00 | 1.00 | 1.00 |
Source: Author’s elaboration. Probability that a CRQC arrives while the last cohort of records encrypted before migration is still sensitive, assuming the records have been harvested, by data class and migration time
Table 2.
Transmission channels of post-quantum cryptographic risk to financial institutions and markets.
Table 2.
Transmission channels of post-quantum cryptographic risk to financial institutions and markets.
| Channel | Mechanism | Conventional-cyber evidence | Post-quantum amplifier |
| Retrospective confidentiality loss | Harvested ciphertext decrypted after CRQC arrival | Indirect, delayed costs of espionage (Akoto & Herr, 2026) | Exposure fixed at encryption time; no detection at harvest |
| Integrity and authentication failure | Forged signatures on payments, certificates and records | Malicious incidents dominate tail losses (Aldasoro et al., 2022) | Affects new transactions and the evidentiary value of signed archives; settled transactions are not altered retroactively |
| Supply-chain contagion | Compromise of a weak node propagates to connected firms | Losses propagate to customers of hit firms, more where substitutes are scarce (Crosignani et al., 2023) | Weakest-link protection (Mo-del 3); SMEs as entry points |
| Concentration and common-mode risk | Few cloud, HSM and PKI vendors deliver migration | Cloud use may lower average incident costs while increasing dependence on common providers; provider concentration may amplify correlated tail exposure (Aldasoro et al., 2022) | Single algorithm or vendor flaw affects many institutions at once |
| Risk-transfer failure | Correlated losses exceed insurance and capital buffers | Limits of cyber insurance capacity (Camillo, 2017) | Non-diversifiable, simultaneous loss across institutions |
Source: Author’s elaboration
Table 3.
Protected share of link weight Sw in the greatest equilibrium, by fragmentation intensity and allocation of a support budget B = 4 (mean over 1000 cost draws; 5th percentile in brackets)
Table 3.
Protected share of link weight Sw in the greatest equilibrium, by fragmentation intensity and allocation of a support budget B = 4 (mean over 1000 cost draws; 5th percentile in brackets)
| No support | Core-first | Uniform | Periphery-uniform |
Targeted (low q) |
|
| 0.0 | 1.00 [1.00] | 1.00 [1.00] | 1.00 [1.00] | 1.00 [1.00] | 1.00 [1.00] |
| 0.1 | 1.00 [1.00] | 1.00 [1.00] | 1.00 [1.00] | 1.00 [1.00] | 1.00 [1.00] |
| 0.2 | 0.86 [0.73] | 0.86 [0.73] | 1.00 [1.00] | 1.00 [1.00] | 1.00 [1.00] |
| 0.3 | 0.72 [0.60] | 0.72 [0.60] | 0.91 [0.87] | 0.93 [0.87] | 0.96 [0.87] |
| 0.4 | 0.64 [0.60] | 0.64 [0.60] | 0.78 [0.73] | 0.80 [0.73] | 0.91 [0.87] |
| 0.5 | 0.32 [0.30] | 0.62 [0.60] | 0.72 [0.60] | 0.52 [0.50] | 0.71 [0.60] |
Source: Author’s simulation based on Equations (7)–(9) and the calibration in Section 2.5. Core-first: 0.8 to each core bank; uniform: 4/45 to every node; periphery-uniform: 0.1 to each peripheral institution; targeted: 0.25 to each peripheral institution in the jurisdictions with q = 0.4 and q = 0.2.
Table 4.
Post-Quantum Public Value Scorecard (PQ-PVS).
| Perspective | Dimension | Example indicators | Existing data source |
| Public value account | Financial cost | Migration CAPEX and OPEX; cost per protected system; avoided rework | Budget and ICT investment records |
| Public value account | Use of state authority | Number and scope of mandates; supervisory findings; procurement clauses requiring crypto agility | DORA, NIS2, public procurement rules |
| Public value account | Mission outcomes | Share of high-value, long-life data classes on PQC or hybrid schemes; residual HNDL exposure index | Cryptographic inventories; ICT-risk registers |
| Public value account | Client and citizen experience | Service continuity during migration; incident-related outages | Incident reporting; service-level data |
| Public value account | Fairness and justice | Migration coverage by institution size, region and jurisdiction; SME access to shared testing and certification | Supervisory surveys; QEIA distributive criterion |
| Systemic interdependence | Counterparty and network exposure | Protected share of link weight Sw with critical counterparties; share of critical counterparties without a migration plan | Payment and correspondent exposure data; DORA register of ICT third-party arrangements |
| Legitimacy and support | Accountability and transparency | Published aggregated inventories; independent audits; parliamentary reporting | Annual readiness report |
| Operational capacity | Skills, vendors and agility | Certified staff; vendor concentration (HHI); time to rotate an algorithm | HR data; vendor registers; crypto-agility tests |
Source: Author’s elaboration. Note: The residual HNDL exposure index links the scorecard directly to Model 1 and gives supervisors a two forward-looking metric ((the residual HNDL exposure index and the protected share of link weight) comparable across institutions. The fairness row makes cryptographic justice auditable rather than aspirational.
Disclaimer/Publisher’s Note: The statements, opinions and data contained in all publications are solely those of the individual author(s) and contributor(s) and not of MDPI and/or the editor(s). MDPI and/or the editor(s) disclaim responsibility for any injury to people or property resulting from any ideas, methods, instructions or products referred to in the content. |
© 2026 by the authors. Licensee MDPI, Basel, Switzerland. This article is an open access article distributed under the terms and conditions of the Creative Commons Attribution (CC BY) license (http://creativecommons.org/licenses/by/4.0/).
Copyright: This open access article is published under a Creative Commons CC BY 4.0 license, which permit the free download, distribution, and reuse, provided that the author and preprint are cited in any reuse.