

Submitted:
12 October 2026
Posted:
13 October 2026
You are already at the latest version
Abstract
This study uses data from the Climate Hazards Group InfraRed Precipitation with Station (CHIRPS) over 1981-2024 to examine the temporal and spatial coherence of precipitation regimes in West Africa. Using unsupervised clustering approaches, we distinguished four different precipitation regimes; Wettest, Transitional, Dry, and Very Dry. We compared these regimes to the Köppen climate classification zones to determine how well they corresponded. The study found a moderate correlation (Cramér’s V = 0.224) and a substantial correlation (Chi-square = 86.07, p < 0.0001) between the Köppen classifications and precipitation regimes derived from CHIRPS. Precipitation varies across the Köppen climate classification zones, such as the Tropical Rainforest (Af) and Hot Semi-Arid (BSh), in which drying and recovery were identified using standardised residuals and difference analyses. Conversely, certain zones, such as the Mediterranean, showed surprising classifications that called for further research. Analysis of temporal trends revealed regional variations in precipitation. Significantly, the Tropical Savanna (Aw) and Hot Semi-Arid (BSh) zones showed modest negative trends, indicating possible localised drying. In contrast, the Tropical Monsoon (Am) and Humid Subtropical (Cfa) zones showed positive trends, suggesting a progressive increase in precipitation. These results highlight the value of CHIRPS data in identifying subtle precipitation trends and their correspondence with accepted climatic categories, providing vital information for regional climate assessments and resource management plans.
Keywords:
CHIRPS
; precipitation
; Köppen climate classification
; West Africa
1. Introduction
Variability in precipitation and its absence characterise much of West Africa. The West African region is home to a wide variety of climates, from wet rainforests in the south to arid deserts in the North. Recent rapid evolution is linked to a fast-changing climate (Fitzpatrick et al., 2020; Sylla et al., 2016). Significant effects of this climatic variability are evident in the region’s hydrology (Nicholson, 2018). Some researchers consider the variability of the region’s precipitation patterns to be the most sensitive in the World (Nicholson, 2018).
In general, global spatial climate variability is driven by a complex interplay, including latitude (Runtunuwu & Kondoh, 2008), orography (Lutsko et al., 2019), ocean influence (Garcia-Soto et al., 2021), and prevailing wind patterns (Sandu et al., 2019). Temperature and precipitation are key variables that drive climate seasonality and affect biodiversity, ecological network structures, and evolutionary adaptability, forming a fundamental, coherent pattern across many environmental processes. These factors also significantly influence human activities and socioeconomic functions (Abbass et al., 2022; Raihan, 2023), particularly in regions where agriculture and natural resource exploitation are the main drivers of the economy. For instance, consistent seasonal temperature and rainfall patterns are essential for agricultural output (Sultan & Gaetani, 2016), and variations in these patterns result in food insecurity. Furthermore, societies are also susceptible to climate change because of the significant influence of climate conditions on water availability, human health (such as heat stress and vector-borne diseases), energy consumption for heating and cooling, transportation, and tourism.
In addition, significant effects of climate change on water-related environmental processes include altered availability of water resources, increased frequency and severity of tropical storms, floods, and droughts, as well as intensification of warming through the water-vapour feedback. Developing climate change adaptation plans that integrate agricultural planning and efficient water resource management depends on understanding precipitation’s temporal and spatio-temporal patterns (Benetó & Khodayar, 2023). Furthermore, seasonal variations in temperature and precipitation regularly and predictably affect animal migration, breeding patterns, and vegetation phenology. This causes ecosystems to react to cycles of seasonal disruption, weakening their resilience and forcing species to shift their life cycles or face extinction under strong selective pressure for evolutionary change.
Meanwhile, asynchronous climate change, in which seasonal components or other climatic variables (such as temperature and precipitation) fluctuate out of sync, has been shown to have widespread deleterious impacts across numerous ecological studies worldwide (Lu et al., 2026; Senner et al., 2018; Shi et al., 2025). Different climate zones naturally determine the temperature and precipitation regimes. For example, rainforests thrive in tropical regions near the equator because of their high temperatures and year-round heavy rainfall. On the other hand, polar zones are characterised by very low temperatures and little precipitation, usually in the form of snow, and desert zones are characterised by little rainfall and large temperature swings, which affect the types of ecosystems and human settlements that can thrive. Delineating climatic zones based on temperature and precipitation patterns has long been done using conventional climate classification systems, such as the Köppen-Geiger classification (Köppen, 1884; Köppen , 1936; Landolt & Börnstein, 1950). Despite these classifications offering a broad perspective, they may not capture recent changes in precipitation regimes and finer-scale differences, particularly given climatic variability and change.
Interestingly, recent remote sensing technologies have greatly advanced the study of spatial events at multitemporal, multispectral, and multispatial resolutions. From the estimation of soil moisture (Mohanty et al., 2017; D. Zhang & Zhou, 2016) and evapotranspiration (Vinukollu et al., 2011), providing a more comprehensive view of the water cycle. Remote sensing has continued to be used to study climate events worldwide (Cui et al., 2019; Yang et al., 2013). These advancements in remote sensing technologies have led to the development of satellite precipitation products (SPPs) (Nwachukwu et al., 2020), which measure precipitation on a regular grid (Jiaglobal ng & Bauer-Gottwein, 2019; Kidd et al., 2018).
Satellites with a variety of sensors track marine parameters (such as sea surface temperature and sea level), land surface features (such as vegetation health, soil moisture, snow and ice extent), and atmospheric variables (such as temperature, humidity, and cloud cover) (Darmanin et al., 2025; Dubovik et al., 2021; Le Traon, 2011; Liu et al., 2025). Understanding climate processes, confirming climate models, monitoring long-term climate trends, and evaluating the effects of climate change on many ecosystems and human systems largely depend on the abundance of satellite remote sensing data. Satellite-based precipitation datasets, such as the Climate Hazards Group InfraRed Precipitation with Station data (CHIRPS), provide long-term, high-resolution images of rainfall trends (Funk et al., 2015). CHIRPS, which uniquely blends satellite observations with in situ station data to create a gridded rainfall time series, provides a comprehensive understanding of precipitation dynamics over time, enabling analysis of precipitation regimes and their evolution. CHIRPS is particularly valuable for drought monitoring, trend analysis, and hydrological modelling, especially in data-sparse regions like many parts of Africa. For example, CHIRPS has been validated in Nigeria, providing reliable precipitation estimates using in situ data (Nwachukwu et al., 2020).
In this work, we identify and analyse precipitation regimes over West Africa using CHIRPS data from 1981 to 2024 to understand continuous hydroclimatic changes within single climate patches, then evaluate how well they match recognised Köppen climatic zones. This strategy seeks to improve our understanding of the hydroclimatic variability in West Africa and to assist in the development of climate-resilient planning and policy.
2. Materials and Methods
2.1. Study Area
The study focuses on the West African region (Figure 1a), comprising Benin, Burkina Faso, Cape Verde, Côte d’Ivoire, The Gambia, Ghana, Guinea, Guinea-Bissau, Liberia, Mali, Mauritania, Niger, Nigeria, Senegal, Sierra Leone, and Togo. It lies between latitudes 4°N and 25°N and longitudes 17°W and 15°E, encompassing a wide range of terrestrial and marine ecosystems, mainly dominated by Sahelian dry land in the north and the Atlantic Ocean in the south ( Figure 1). The average annual temperature varies across ecological zones, reaching 43 °C in the northern drylands and 38 °C in the southern lush rainforest during the observational period. In terms of annual precipitation averaged over the observation period, orography and latitude are the main drivers, with precipitation primarily determined by the West African Monsoon (Akinsanola et al., 2015; Makinde et al., 2024). Average annual rainfall in the far North is under 500 mm, and in a semi-arid zone it is about 500-1,000 mm. Such is the sub-humid zone with 1,000 to 1,250 mm and the forest zone along the southern Atlantic edges with rainfall over 1,250 mm (Amanor, 2003).
2.2. West African Climate Classification
West Africa is a vast and diverse geographical expanse that presents a complex and dynamic climatic regime and categorisation. While broad classifications such as Trewartha, Holdridge, and Bergeron extensively cover meteorological and climatological divisions, Köppen-Geiger is widely known to cover global descriptive climatological classification. Köppen-Geiger (also mentioned here as Köppen classification or Köppen) provide a foundational framework; a deep, advanced understanding that necessitates a nuanced approach that integrates multiscale atmospheric-oceanic interactions, land-surface feedbacks, and the profound impact of anthropogenic forcing.
2.3. The Köppen-Geiger Climate Classification
The Köppen-Geiger dataset contains global climate classification maps based on the Köppen climate classification for the climatological period 1991-2020. It assigns each grid cell a climate class determined from long-term temperature and precipitation patterns. The dataset is available at multiple spatial resolutions, ranging from approximately 1 km to 1° (110 km), provided as GeoTIFF raster files. For this study, we focused on the 1 km spatial resolution. This data is widely used for studies of climate zones, ecological patterns, and climate-vegetation relationships. The detailed Köppen-Geiger description and maps can be downloaded at https://www.gloh2o.org/koppen/?, or from (Beck et al., 2023).
Figure 2.
The Köppen-Geiger classes map showing the legend linking the numeric values of different classifications on the map.
Figure 2.
The Köppen-Geiger classes map showing the legend linking the numeric values of different classifications on the map.
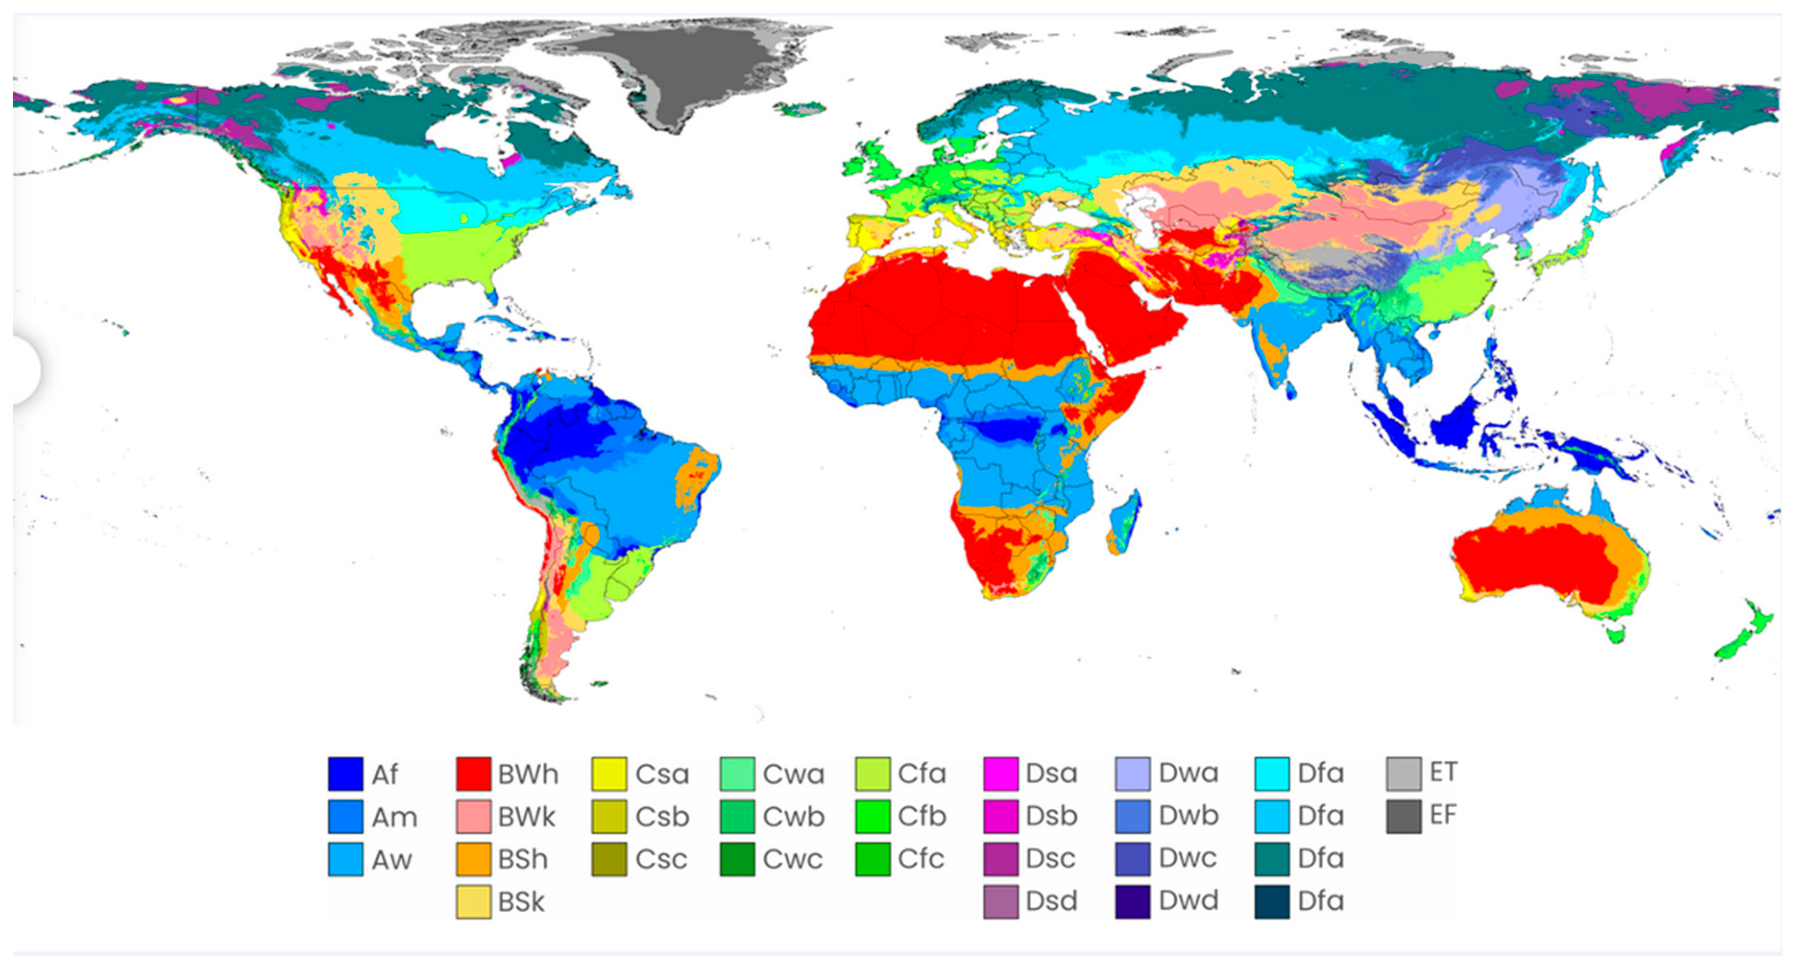
Köppen-Geiger classification remains one of the most frequently applied climatic categorisation schemes. Wladimir Köppen, a Russian-German climatologist, created it in the late 19th century, and the meteorologist Rudolf Geiger subsequently improved it. Based on threshold values and the seasonality of monthly precipitation and air temperature, this classification divides the world’s terrestrial climates into five major classes and thirty subclasses (Le Traon, 2011) [26]. Köppen created his categorisation to correspond with the main ecosystem types found throughout the world, with areas belonging to the same class having largely comparable vegetation traits. From ecological and sociological standpoints, the Köppen-Geiger classification provides a means of combining complex land-climate data into a useful indicator. In this article, we highlighted Köppen classification prominent within the West African region: Tropical Rainforest (Af), Tropical Monsoon (Am), Tropical Savanna (Aw), Hot Desert (BWh), Hot Semi-Arid (BSh), Hot-summer Mediterranean (Csa), Warm-summer Mediterranean (Csb), Dry-winter Humid Subtropical (Cwa), and Humid Subtropical (Cfa).
Af - Tropical Rainforest: In this classification, temperatures are typically high year-round, with a low annual thermal amplitude and monthly averages above 18 °C. Every month has rainfall; there is no real dry season, and there are dense evergreen forests.
Am - Tropical Monsoon: Although temperatures remain above 18 °C year-round, monsoonal circulation makes precipitation highly seasonal. A severe summer rainy season with extremely high annual rainfall follows a brief dry season.
Aw - Tropical Savanna: Despite having a noticeably dry winter season, this climate consistently maintains temperatures above 18 °C. As the Intertropical Convergence Zone moves poleward to sustain savanna vegetation, summertime rainfall is focused.
BWh - Hot Desert: In this classification, evaporation consistently outpaces rainfall throughout the year, and precipitation is incredibly rare and unpredictable, often with wide daily variations throughout the day, and a persistent lack of rainfall results in scant vegetation.
BSh - Hot Semi-Arid: Also, this classification, evapotranspiration still surpasses precipitation each year. However, rainfall is minimal yet sufficient to distinguish it from true desert climates. High temperatures and sporadic, seasonal rainfall support steppe or grassland vegetation.
Csa - Hot-Summer Mediterranean: Winters are moderate and rainy due to mid-latitude cyclones, but summers are scorching and dry due to subtropical high pressure. At least four months have an average temperature above 10 °C, and the warmest month surpasses 22 °C.
Csb - Warm-Summer Mediterranean: Winters are milder and wetter, whereas summers are pleasant but not scorching and stay noticeably dry. At least four months have temperatures above 10 °C, which is frequently indicative of marine moderation, although the warmest month stays below 22 °C.
Cwa - Dry-Winter Humid Subtropical: Summers are hot and humid, with strong convective rainfall, while winters are noticeably drier due to a seasonal reversal in circulation. The warmest month exceeds 22 °C, and precipitation shows a clear monsoonal pattern.
Cfa - Humid Subtropical: Winters are typically pleasant, while summers are hot and muggy with frequent convective storms. With no distinct dry season, precipitation occurs year-round and is frequently affected by frontal and tropical storms.
Therefore, we analysed precipitation regimes over West Africa using CHIRPS data from 1981 to 2024, unravelling the continuous hydroclimatic modifications occurring within the Köppen classification patches across the region.
2.4. Data Processing, Statistical Methods and Climatology Calculation
Climate Hazards Group Infrared Precipitation with Stations (CHIRPS) dataset is a quasi-global (50°S−50°N), high-resolution (0.05°) precipitation dataset, based on satellite and observation-based precipitation estimates developed by the Climate Hazards group of the University of California, Santa Barbara [22]. It is available from 1981 to present on daily, pentadal, and monthly timescales. A detailed description of the dataset can be found on https://www.chc.ucsb.edu/data/chirps [22].
2.4.1. Averaging and Normalisation of Seasonal Precipitation Patterns
The monthly time series from CHIRPS from 1981 to 2024 covering the West African region was extracted using a shapefile of the region to subset the area of interest. Then, the monthly precipitation values from CHIRPS West Africa were averaged across all years to produce a 12-month climatological profile using the following equation.
where P(y,m) is the precipitation for the year y and month m, and N is the total number of years. This arithmetic mean reduction method was used to compute an element-wise average along the temporal axis for each pixel in the CHIRPS product. This method examines every single grid pixel at a specific latitude and longitude. For each pixel, it takes every precipitation value recorded at that spot across all time steps (months/years), sums those values and divides by the total number of time steps. To identify the appropriate number of clusters for the seasonality patterns, the K-Means clustering technique was used iteratively for different K values ranging from 2 to 8. Silhouette Score was calculated for each pixel grouping to assess the cohesion and separation of the resulting clusters. The silhouette score measures how similar each time series is to its own cluster vs other clusters, with higher values suggesting better-defined divisions.
The number of clusters with the highest silhouette scores (in this example, K=4, Figure 3) yielded the best-defined groupings for the final clustering analysis. The normalised 12-month precipitation vectors were used as input for K-Means clustering to identify distinct precipitation regimes. The shape of each valid pixel’s climatological time series determined which of the four precipitation regimes where each pixel group belongs. Then, the Z-score transformation was used to normalise the climatological monthly means in order to guarantee comparability across areas with varying levels of precipitation:
where µ and σ represent the mean and standard deviation of the 12-month climatology.
We normalised the 12-month climatological profile for each pixel using a Z-score transformation to enable meaningful comparison of precipitation across diverse climatic zones. Specifically, the mean monthly precipitation over the study period (1981-2024) was first computed for each pixel, resulting in a 12-month seasonal climatology. For each pixel, we then applied the standard Z-score formula:
where is the mean precipitation in month m for pixel p, and μp and σp are the mean and standard deviation across all 12 months for that pixel. This normalisation centres the seasonal profile to zero mean and unit variance, emphasising relative seasonal variation rather than absolute rainfall amounts. The output revealed locations with relatively higher or lower long-term precipitation intensity, regardless of seasonal structure. The normalised seasonal precipitation vectors with 12 monthly Z-scores were used as input to K-means clustering. This unsupervised learning approach partitions the geographical grid into discrete clusters by minimising intra-cluster variance and maximising inter-cluster separation. The spatial distribution of cluster assignments was then mapped by moulding the clustering’s 1D output back into its original 2D grid structure. To improve interpretability, each cluster was individually labelled according to its characteristics, yielding four separate classes: “Very Dry”, “Moderately Dry”, “Transitional” and “Wettest”. The clusters were contrasted with the Köppen climate classification raster for West Africa in order to put the identified precipitation regimes into context. The climate raster was reprojected and resampled to match the CHIRPS grid, and pixel-wise cross-tabulation was performed.
2.4.2. Analysis of Quantitative Association
The Chi-Square Test (χ2) was applied to test whether precipitation regime is dependent on the Köppen climate classification. While Cramér’s V statistic was used to measure the strength of association between precipitation regime and climate zone. The Chi-Square Test is represented as follows;
Where, Oij is the observed frequency in row i and column j, Eij is the expected frequency in row i and column j, r is the number of rows (i.e., Köppen classification zones), c is the number of columns (i.e., CHIRPS Cluster).
Degrees of freedom is, df = (r − 1)(c − 1). Then we computed the p-value from the χ2 value and degrees of freedom using the Chi-square distribution. In addition, Cramér’s V value is computed as;
Where, χ2 is the Chi-square statistic, n is the total number of observations (sum of all Oij), and K, min(r,c) is the smaller of the number of rows or columns. While the Chi-Square test answers the question, Is there a relationship between precipitation regimes and Köppen climate zones? However, it does not provide the answer regarding where it occurs in the table. Therefore, we computed the residual analysis, which tells how much the data deviates from independence, using the following equation; r = O − E
Where; Observed is the actual counts in the crosstab; Expected is the counts if the two variables were independent.
Now, raw residuals are hard to compare because some cells have large sample sizes and others have very small sample sizes (Agresti, 2013). So, we standardise using the following equation (specifically the Pearson Residual);
2.4.3. Trend Analysis and Anomaly Detection
Monthly precipitation anomalies were calculated as deviations from monthly climatological means.
A(t) = P(t) − Pclim (mt)
Where P(t) is the precipitation observed at time (t), and mt is the relevant calendar month.
The wettest and driest years throughout the research period were determined using annual mean precipitation anomalies. We created spatial maps for both extremes. We performed a linear regression analysis of the regional mean anomaly time series to assess long-term trends.
A(t) = β0 + β1t + ϵ
Where, β1 is the trend slope, and ϵ is the error term. Furthermore, anomaly trends for every CHIRPS cluster were calculated independently.
3. Results
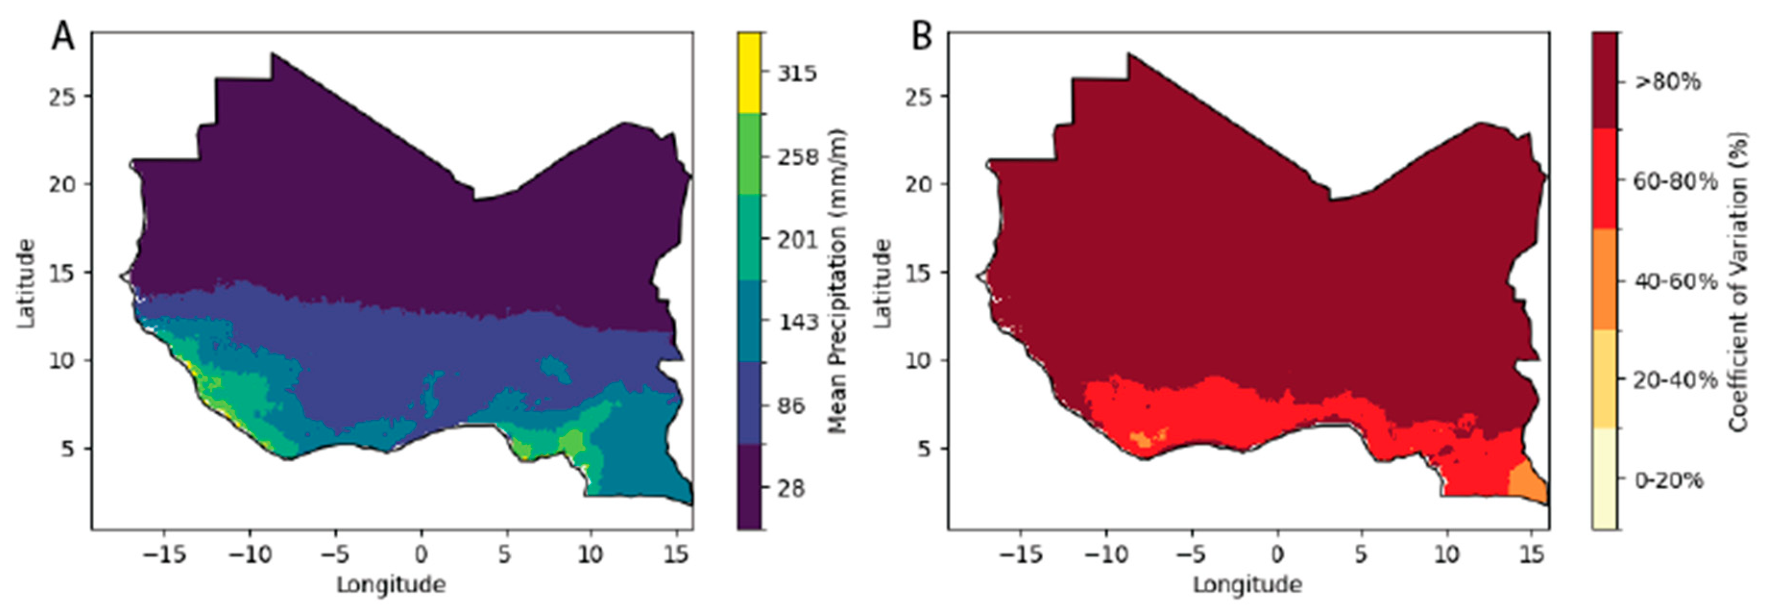
The spatial distribution of precipitation across West Africa for the period 1981-2024 exhibits a strong latitudinal gradient, typical of the West African Monsoon system. The long-term mean monthly precipitation ranges from a minimum of 28 mm/month in the northern arid zones to a maximum of 315 mm/month along the southern Guinean coast. This mean pattern is inversely mirrored by the rainfall reliability, as expressed by the Coefficient of Variation (CV). Higher variability is concentrated in the northern latitudes, with CV values exceeding 80% in the Sahelian-Saharan transition zone, indicating high interannual instability and risk of climatic extremes. Conversely, the southern regions demonstrate greater rainfall reliability with CV values remaining below 40%, suggesting a more stable hydrological regime.
Figure 4.
(A): Spatial distribution of the long-term mean monthly precipitation (mm/month) across the study area. Data derived from the CHIRPS v2.0 dataset for the period 1981–2024. (B): Interannual variability, expressed as the coefficient of variation (CV), indicates that the Sahel region experiences the highest rainfall instability (>80%), suggesting higher vulnerability to climatic extremes.
3.1. Normalised Precipitation Patterns
“Transitional” is grounded in the shape and magnitude of the normalised monthly precipitation profiles assigned to each cluster after applying K-Means. The characterisation of each cluster is shown on the mean seasonal curve plot in Figure 5.
i. Wettest: This cluster exhibits the highest normalised precipitation values across most months of the year. It is characterised by high annual rainfall (e.g., coastal or rainforest areas), strong unimodal or bimodal peak(s), and a longer wet season.
ii. Moderately Dry: This group has intermediate precipitation, showing some seasonal rainfall but lower intensity and duration than the wettest zone. Shorter wet season, possibly a unimodal peak; dry months are more prominent. This cluster is common in transitional ecotones between humid and semi-arid zones.
iii. Very Dry: This cluster is marked by consistently low precipitation values, often well below the mean, across all months. Almost flat or very weak seasonal peak; minimal rain throughout the year. These regions fall within arid or desert climates (e.g., the Sahel or Sahara fringe).
iv. Transitional: This cluster is characterised by a moderate but more balanced seasonal profile, possibly with distinct wet and dry seasons, but not as extreme as other clusters. The curve may show a moderate peak and longer transition periods between wet and dry months. These areas might act as buffers or transition zones between wet and dry regimes.
The generated cluster map displays spatially coherent zones with distinct precipitation seasonality regimes, such as consistently dry, seasonally mild, and peak rainy regions, thereby facilitating ecological zoning and regional water resource assessment. These cluster-specific curves show the monthly evolution of precipitation within a quantitative framework for each cluster and corroborate the provided descriptive labels, Figure 5. This method provides a quantitative framework for discriminating between different precipitation regimes.
3.2. Spatial Regionalisation of Precipitation via K-Means Clustering
The K-Means clustering algorithm applied to the normalised precipitation vectors of CHIRPS precipitation data from 1981 to 2024 delineated four (4) spatially coherent precipitation regimes (K = 4). The four distinct clustering regimes are classified as Very Dry, Dry, Transitional, and Wettest. The spatial distribution of these regimes is presented in Figure 5 for comparison. As seen in Figure 5, the CHIRPS precipitation clusters revealed an obvious latitudinal gradient in precipitation regimes. The Very Dry and Dry clusters dominate the northern parts of West Africa, corresponding to the Sahara and Sahel zones, with average precipitation between 0-50mm/m. The Transitional regime appears prominently in the central Sahel belt, marking the shift from arid to more humid climates. Meanwhile, the Wettest cluster is concentrated mainly along the coastal belt, stretching from southern Cameroun to Nigeria through coastal West Africa. An area that consistently experiences high annual rainfall ≥ 4000 mm/year and bimodal seasonality.
3.3. Spatiotemporal Status of Precipitation Regimes Across Köppen Climate Zones
Analysis of the spatial coherence between established Köppen climate classifications and CHIRPS precipitation clusters, from a pixel-wise spatial overlay between CHIRPS-based precipitation regimes and the Köppen-Geiger climate classifications. This overlay enabled a quantitative comparison of each precipitation regime with the Köppen zone to which it belongs. The relationship between precipitation regimes and Köppen climate zones exhibits varied patterns and nuances. Tropical Rainforest areas (DN=1, Af) are dominated by the Wettest regime (100%), reflecting consistently high yearly rainfall Figure 1 and Figure 6. Similarly, Tropical Monsoon zones (DN=2, Am) and Tropical Savanna zones (DN=3, Aw) display a split between Wettest and Transitional regimes, indicating seasonal rainfall variability while maintaining a predominantly humid character. In contrast, the Hot Desert zone (DN=4, BWh) is associated mainly with the Transitional regime (73%), with notable contributions from Dry (10%) and Very Dry (16%) regimes, suggesting greater spatial heterogeneity in precipitation within desert regions. Hot Semi-Arid climates (DN=6, BSh) are overwhelmingly Transitional (99.9%), consistent with their semi-arid classification. Notably, small zones such as the Mediterranean climates (DN=8, Csa), (DN=9, Csb) and Dry-winter Humid Subtropical (DN=11, Cwa) exhibit substantial proportions of Wettest and Transitional regimes Figure 6.
The statistical characteristics and cross-tabulation of pixel counts showing the number of grid cells of each Köppen zone, which were classified into each precipitation regime, are presented in Table 2

Table 1.
Contingency matrix showing the pixel-count distribution between Köppen-Geiger climate zones and K-means precipitation regimes. The rows represent the established climate zones, while columns correspond to the data-driven rainfall clusters identified in this study.
Table 1.
Contingency matrix showing the pixel-count distribution between Köppen-Geiger climate zones and K-means precipitation regimes. The rows represent the established climate zones, while columns correspond to the data-driven rainfall clusters identified in this study.
| Crosstab (Percentages by Köppen) | |||||
|---|---|---|---|---|---|
| Köppen DN | Köppen Zone (Code) |
Dry | Tr | V.D | Wettest |
| 1 | Af | 0.00 | 0.00 | 0.00 | 100.00 |
| 2 | Am | 0.00 | 21.80 | 0.00 | 78.20 |
| 3 | Aw | 0.00 | 48.65 | 0.00 | 51.34 |
| 4 | BWh | 10.18 | 73.14 | 15.94 | 0.74 |
| 6 | BSh | 0.00 | 99.99 | 0.00 | 0.01 |
| 8 | Csa | 0.00 | 0.00 | 0.00 | 100.00 |
| 9 | Csb | 0.00 | 4.73 | 0.00 | 95.27 |
| 11 | Cwa | 0.00 | 60.00 | 0.00 | 40.00 |
| 15 | Cfa | 0.00 | 100.00 | 0.00 | 0.00 |
Table 2.
Crosstab Results of Percentage of Precipitation Occurrence within the Köppen Climate Classes.
Table 2.
Crosstab Results of Percentage of Precipitation Occurrence within the Köppen Climate Classes.
| Köppen Zone (Code) | Climate Type | Observation |
|---|---|---|
| 1 (Af) | Tropical Rainforest | 100% Wettest |
| 2 (Am) | Tropical Monsoon | 78% Wettest, 22% Transitional |
| 3 (Aw) | Tropical Savanna | 51% Wettest, 49% Transitional |
| 4 (BWh) | Hot Desert | 10% Dry, 73% Transitional, 16% Very Dry |
| 6 (BSh) | Hot Semi-Arid | 100% Transitional |
| 8 (Csa) | Hot-summer Mediterranean | 100% Wettest |
| 9 (Csb) | Warm-summer Mediterranean | 95% Wettest |
| 11 (Cwa) | Dry-winter Humid Subtropical | 60% Transitional, 40% Wettest |
| 15 (Cfa) | Humid Subtropical | 100% Transitional |
From Table 2, the strong climatological consistency within some Köppen classes was further revealed. For example, the Af (Tropical Rainforest) zone is entirely dominated by the Wettest regime (100%), which is expected given its persistently high rainfall throughout the year. The Am (Monsoon) and Aw (Tropical Savanna) zones show a split between the Wettest and Transitional regimes, reflecting their seasonal rainfall variability. Conversely, the BWh (Hot Desert) and BSh (Hot Semi-Arid) zones are dominated mainly by the Transitional and Dry regimes, confirming their arid to semi-arid conditions. Interestingly, Mediterranean zones such as Csa and Csb, while limited in spatial extent, showed strong associations with the Wettest and Transitional regimes, potentially reflecting local influences such as elevation or coastal proximity. The cross tabulation demonstrates that the CHIRPS-derived precipitation regimes align well with Köppen classifications, particularly in distinguishing tropical humid zones from arid and semi-arid regions.
3.4. Statistical Reliability of Association Between the Köppen Climate Classification and the Precipitation Clusters
The Chi-square test of independence, used to assess the strength and significance of the relationship between the CHIRPS-derived precipitation regimes and Köppen climate classification, yielded a Chi-square statistic of 86.07 with 8 degrees of freedom and a p − value < 0.0001, indicating a highly significant relationship between the two variables. This distribution of CHIRPS precipitation clusters across Köppen climate zones indicates a nontrivial covariance, suggesting a systematic effect rather than an artefact of aleatory uncertainty.
Table 3.
Chi-square X2 test results, showing the test statistic, degrees of freedom, and associated p-value. Statistical significance was assessed at α=0.05.
Table 3.
Chi-square X2 test results, showing the test statistic, degrees of freedom, and associated p-value. Statistical significance was assessed at α=0.05.
| Metric | Derived Values |
|---|---|
| Chi-Square Statistics | 86.07 |
| Degrees of freedom | 8 |
| p − value | < 0.0001 |
| Cramer’s V | 0.224 |
Cramér’s V further quantifies the strength of the association between CHIRPS and the Köppen classes. We obtained a Cramér’s V value of 0.224, indicating a moderate association between the Köppen climate classification and precipitation regimes. This value suggests that while Köppen zones and CHIRPS-based clusters do not overlap perfectly, they share meaningful structural relationships, especially in distinguishing tropical humid zones from drier climates. Overall, this statistical strength of the association supports using CHIRPS-derived clusters as a data-driven approach to representing West Africa’s hydroclimatic regimes, with statistically validated consistency with the classical Köppen classification.
3.5. Analysis of Climatic Zone Distributions: Patterns in Deviations and Residuals
Regarding the Chi-square test, which confirmed the significant association between precipitation regimes and Köppen climate zones, the standardised residuals and observed-expected differences for each cell in the contingency table, presented as a heatmap of standardised residuals (Figure 7), reveal that the Af zone (Tropical Rainforest) strongly overrepresents the Wettest cluster. At the same time, BWh and BSh zones (Desert and Semi-Arid) tend to underrepresent it. Conversely, Am and Aw (Monsoon and Savanna) zones show moderate overrepresentation in Transitional and underrepresentation in Dry or Very Dry clusters. These results highlight the alignment and variances of precipitation regimes and traditional Köppen boundaries.
The analysis of observed versus expected occurrences across various Köppen climate classifications reveals significant deviations, suggesting that certain environmental regimes are heavily concentrated in specific zones while being nearly absent in others. This is evident in;
a). Dominance of the “Wettest” Regime in Tropical Zones: In the tropical classifications (Af, Am, and Aw), there is a profound shift toward the “Wettest” regime. The Aw zone (Tropical Savanna): Recorded the highest positive variance in the dataset with 37,655 observed instances against an expected 16,278.8, revealing an excess of +21,376. Similarly, the Am zone (Tropical Monsoon) followed a similar trend with 5,386 more observations than expected in the “Wettest” category.
b). Arid Zones and the Shift Toward Dryness: The BWh (Hot Desert) zone presents a starkly different profile, characterised by a significant increase in drier regimes and a deficit in wet conditions. The “Dry” and “Very Dry” regimes in BWh zones exceeded expectations by +5,354 and +8,383, respectively.
c). Variations in Semi-Arid and Mediterranean Climates: The BSh zone (Hot Semi-Arid) shows a strong preference for “Transitional” regimes (+8,599 over expected) but, like its desert counterpart, remains significantly under-represented in “Dry” and “Very Dry” categories relative to the model, likely due to the specific localised geography of these samples. The Csa/Csb zone (Mediterranean) has smaller sample sizes, which consistently favour “Wettest” and “Transitional” regimes over the “Dry” CHIRPS cluster.
3.6. CHIRPS Precipitation Trends Across Köppen Climate Classification
As shown in Figure 8, the precipitation trend slope map presented long-term spatial changes. Positive values indicate increasing rainfall over time, whereas negative values indicate declining rainfall. The map reveals considerable heterogeneity across West Africa. The slope of each linear regression, measured in millimetres per year, represents the long-term precipitation trend for that location. In this analysis, the trend further revealed that areas in the Sahel and semi-arid regions (BSh and Aw zones) show moderate positive trends (0.14), suggesting recovery from past drought conditions. Also, some monsoonal and southern zones (Am, Cfa) exhibit flat or weakly negative trends (-0.42), potentially indicating localised drying. The central transitional belt also shows spatially mixed signals, consistent with its ecotonal nature.
Further results on how long-term precipitation trends vary across Köppen climate classes in the West African region are summarised in Table 4 and Figure 9. The results reveal clear differences across climate classes. BSh (Hot Semi-Arid) and Aw (Tropical Savanna) zones show positive mean slopes of +0.32 mm/year and +0.15 mm/year, respectively, consistent with a gradual wetting trend in the Sahel and transitional regions. Af (Tropical Rainforest) exhibits a slightly positive trend (+0.15 mm/year), suggesting continued rainfall stability or marginal increases. In contrast, the Am (Monsoon) and Cfa (Humid Subtropical) zones show negative trends (-0.16 mm/year and -0.17 mm/year, respectively), indicating potential localised drying. Small zones such as Csa (Mediterranean) and Cwa (Dry Winter Humid Subtropical) show minor or mixed trends, though limited pixel counts reduce their statistical weight as indicated in Figure 9. The zones are sorted by mean slope, highlighting the regional divergence between wetter tropics and drying monsoonal fringes.
4. Discussion
4.1. Precipitation Regime Classification Across Köppen Climate Zones
The K-means cluster analysis reveals distinct precipitation regimes aligned with Köppen climate classifications across West Africa, with strong statistical support for this association. The significant relationship (X2 = 86.07, p < 0.0001, Cramér’s V = 0.224) indicates that the Köppen classification effectively captures regional precipitation characteristics. Tropical humid zones (Af, Am, Aw, Csb, Cfa) are predominantly “Wettest” regimes, with Af showing 100% Wettest and Csb 95%. This finding is consistent with previous results reported in (Beck et al., 2018). In contrast, arid and semi-arid zones (BWh, BSh) are overwhelmingly classified as “Transitional,” with BWh and BSh comprising 73% and 99.99% transitional regimes, respectively. These patterns confirm that precipitation occurrence patterns closely follow Köppen’s original classification logic based on seasonality and humidity, demonstrating the validity of climate classification systems for predicting regional precipitation behaviour. This is in line with the previous finding over part of Nigeria (Igbawua et al., 2023). In addition, Similar varying results, including a shift in the Köppen climate zones, have been detected in China (Wu et al., 2021) and Central Asia (Dilinuer et al., 2021).
The chi-square analysis provides strong evidence that observed precipitation regime distributions deviate significantly from expected random distributions across Köppen zones. This deviation is particularly pronounced in zones with large pixel counts, where Aw and BWh show substantial differences between observed and expected frequencies. The Af zone shows perfect alignment with the “Wettest” regime (+346 pixels above expected), while the Am zone exhibits +5,386 more “Wettest” pixels than statistically expected. These findings reinforce the idea that Köppen zones have inherent precipitation characteristics that determine their regime classification with high precision (Beck et al., 2018), supporting the use of climate classification as a framework for understanding spatial precipitation patterns in tropical and subtropical regions.
4.2. Temporal Precipitation Trends and Zone-Specific Dynamics
Precipitation slope analysis reveals zone-specific temporal trends ranging from -0.17 to +0.32 mm per year. The strongest positive trend occurs in BSh (Hot Semi-Arid) zones at +0.32 mm/year, while the steepest negative trend occurs in Cfa (Humid Subtropical) at-0.17 mm/year. Tropical zones show mixed patterns: Af exhibits slight wetting (+0.15 mm/year), while Am shows drying (-0.16 mm/year). The Am negative trend is particularly significant given that monsoon-influenced zones are expected to remain relatively wet, suggesting potential shifts in monsoon precipitation intensity in West Africa (Igbawua et al., 2023). These divergent trends across climate zones reflect broader patterns of regional precipitation variability documented globally, where different climate zones respond distinctly to large-scale atmospheric circulation changes (Sebastian et al., 2019; Sylla et al., 2016). The spatial resolution of slope analysis (based on pixel counts) allows zone-specific interpretation of these trends. Aw zone, with the largest pixel count (73,341), shows a consistent +0.15 mm/year trend with a low standard deviation (±0.22), suggesting a robust wetting signal across tropical savanna regions. The BSh positive trend contrasts sharply with the Am negative trend, indicating that semi-arid zones may be receiving increasing moisture (Sanogo et al., 2015), while monsoon zones experience declining precipitation, potentially reshaping precipitation patterns and water availability across the region. This divergent pattern suggests complex regional climate dynamics that warrant further investigation through atmospheric circulation analysis. Research on multi-decadal precipitation variability demonstrates that such zone-specific trends often reflect shifts in monsoon systems and tropical circulation patterns (Ramalingam et al., 2024), supporting the need for targeted analysis of individual climate zones rather than treating tropical regions uniformly.
Meanwhile, the K-means algorithm correctly categorised the Csa, Csb, and Cfa zones. However, these classifications represent small, localised microclimates in West Africa. Consequently, their trend values should be interpreted with caution due to the limited sample size (n<100).
4.3. Implications for Water Resources and Agricultural Planning
These findings have substantial implications for West African water resource management and agricultural planning. The stable “Wettest” regimes in tropical zones provide relatively consistent water availability for rainfed agriculture. However, the negative Am trend suggests future reductions in available moisture that could impact monsoon-dependent farming systems. The high variability and low mean precipitation in arid zones necessitate investment in water storage and irrigation infrastructure, particularly given the increasing frequency of floods alongside persistent droughts. The transitional regimes dominating the Aw and Cwa zones represent significant planning challenges due to their high intra-annual and interannual precipitation variability, creating uncertainty for crop selection and irrigation design (Sultan & Gaetani, 2016). Accurate characterisation of rainfall occurrence and duration, rather than total amount alone, is critical for agricultural planning (H. Zhang et al., 2026). This suggests that future analyses should extend beyond regime classification to characterise precipitation frequency and intensity distributions within each climate zone. The distribution of precipitation events—whether occurring as continuous rainfall or isolated heavy storms—fundamentally affects vegetation growth and agricultural productivity, particularly in semi-arid regions where precipitation variability poses significant challenges (H. Zhang et al., 2026). Climate variability plays a crucial role in regional systems, with temperature, rainfall, and humidity patterns varying across diverse climatic zones, significantly influencing ecological responses (Sultan & Gaetani, 2016). These zone-specific precipitation responses indicate that changes in precipitation regimes have cascading effects beyond agricultural systems, affecting water resources, ecosystem stability, and resilience to climate shocks. The comprehensiveness of this analysis—spanning the entire West African region over multiple decades—provides a solid empirical foundation for understanding how precipitation varies across Köppen classifications. This supports the development of climate-informed management strategies for sustainable water resource and agricultural planning in West Africa, with particular emphasis on region-specific interventions that account for the distinct precipitation characteristics and trends identified in this study. Moving forward, integration of precipitation regime analysis with water resource management and drought early warning systems (Liu et al., 2026) will be essential for enhancing the resilience of agricultural communities and water-dependent sectors across diverse climate zones.
5. Conclusion
This analysis demonstrates that CHIRPS precipitation data exhibit statistically significant spatial and temporal variability across Köppen climate zones in West Africa, with distinct clustering patterns (Cramér’s V = 0.224, p < 0.0001). The classification of precipitation regimes shows clear spatial coherence: tropical rainforests (Af) and Mediterranean climate zones (Csa) are characterised exclusively by wet conditions. In contrast, hot desert (BWh) and hot semi-arid (BSh) zones exhibit predominantly transitional precipitation patterns. These results reflect the fundamental hydroclimatic differences inherent to humid versus arid climate systems. Precipitation trend analysis across Köppen zones reveals divergent long-term patterns of particular note. The tropical savanna (Aw) zone exhibits the strongest positive trend in wettest conditions (+21,376 pixels). In contrast, the tropical monsoon (Am) zone shows a slight negative trend in precipitation (mean slope = −0.164 mm/year). The reliability and utility of CHIRPS data for characterising regional hydroclimatic variability are confirmed by chi-square analysis, which demonstrates a strong statistical association between precipitation regimes and the Köppen climate classification. These findings suggest that satellite-based precipitation products provide dependable tools for climate monitoring across West Africa’s diverse climatic zones. However, like all remote sensing products, CHIRPS data performance varies spatially and temporally, and trend interpretations must account for seasonal variability and regional heterogeneity. The results support the continued use of satellite-based precipitation monitoring to understand climate dynamics and inform climate adaptation strategies, particularly in data-scarce regions where alternative observational networks remain limited. In summary, this multi-layered analysis demonstrates that clustering long-term precipitation using CHIRPS data produces results that are not only statistically and physically meaningful but also capable of capturing dynamic signals of climatic change across space and time. Meanwhile, the spatial heterogeneity of precipitation trends observed in this study underscores the critical need for regional climate adaptation strategies tailored to local climatic realities rather than assuming uniform trends across West Africa.
Author Contributions
Conceived the experiments and provided data: P.N.N. Proposed the method: P.N.N. Processed/analysed the data: P.N.N. Contributed to the discussion/revision: L.M.O.A., S.E.Y., D.N.J., S.P. and J.U.O. Wrote the original draft: P.N.N. Performed English editing and global presentation of the paper: S.E.Y., F.S., M.-P.B., D.N.J., S.P. and J.U.O. All authors have read and agreed to the published version of the manuscript
Funding
The study did not receive any funding. However, the article processing charges (ACP) were supported by UMR Espace-Dev, IRD, through the UMR Espace-Dev University of Perpignan.
Acknowledgments
We acknowledge the Petroleum Technology Development Fund (PTDF), Nigeria, IMAGES UMR Espace-Dev, IRD France, for the support the first author has received.
Conflicts of Interest
The authors declare no conflict of interest.
References
- Abbass, K.; Qasim, M. Z.; Song, H.; Murshed, M.; Mahmood, H.; Younis, I. A review of the global climate change impacts, adaptation, and sustainable mitigation measures. Environmental Science and Pollution Research 2022, 29(28), 42539–42559. [Google Scholar] [CrossRef] [PubMed]
- Agresti, A. Categorical data analysis; John Wiley & Sons, 2013; Available online: https://books.google.com/books?hl=fr&lr=&id=6PHHE1Cr44AC&oi=fnd&pg=PR13&dq=Alan+Agresti.+Categorical+data+analysis.+John+Wiley+%26+Sons,+2013.&ots=KMltDglTbC&sig=OVVmi2wEiJTED0JsaFTol4BE7HM.
- Akinsanola, A. A.; Ogunjobi, K. O.; Gbode, I. E.; Ajayi, V. O. Assessing the Capabilities of Three Regional Climate Models over CORDEX Africa in Simulating West African Summer Monsoon Precipitation. Advances in Meteorology 2015, 2015, 1–13. [Google Scholar] [CrossRef]
- Amanor, K. S. Natural and cultural assets and participatory forest management in West Africa. 2003. Available online: https://scholarworks.umass.edu/entities/publication/d04795a7-8050-4856-96f6-a57baa0fdc1a.
- Beck, H. E.; McVicar, T. R.; Vergopolan, N.; Berg, A.; Lutsko, N. J.; Dufour, A.; Zeng, Z.; Jiang, X.; Van Dijk, A. I.; Miralles, D. G. High-resolution (1 km) Köppen-Geiger maps for 1901–2099 based on constrained CMIP6 projections. Scientific Data 2023, 10(1), 724. [Google Scholar] [CrossRef] [PubMed]
- Beck, H. E.; Zimmermann, N. E.; McVicar, T. R.; Vergopolan, N.; Berg, A.; Wood, E. F. Present and future Köppen-Geiger climate classification maps at 1-km resolution. Scientific Data 2018, 5(1), 180214. [Google Scholar] [CrossRef] [PubMed]
- Benetó, P.; Khodayar, S. On the need for improved knowledge on the regional-to-local precipitation variability in eastern Spain under climate change. Atmospheric Research 2023, 290, 106795. [Google Scholar] [CrossRef]
- Cui, X.; Guo, X.; Wang, Y.; Wang, X.; Zhu, W.; Shi, J.; Lin, C.; Gao, X. Application of remote sensing to water environmental processes under a changing climate. Journal of Hydrology 2019, 574, 892–902. [Google Scholar] [CrossRef]
- Darmanin, G. C.; Gauci, A.; Giona Bucci, M.; Deidun, A. Monitoring sea surface temperature and sea surface salinity around the Maltese Islands using sentinel-2 imagery and the random forest algorithm. Applied Sciences 2025, 15(2), 929. [Google Scholar] [CrossRef]
- Dilinuer, T.; Yao, J.-Q.; Chen, J.; Mao, W.-Y.; Yang, L.-M.; Yeernaer, H.; Chen, Y.-H. Regional drying and wetting trends over Central Asia based on Köppen climate classification in 1961–2015. Advances in Climate Change Research 2021, 12(3), 363–372. [Google Scholar] [CrossRef]
- Dubovik, O.; Schuster, G. L.; Xu, F.; Hu, Y.; Bösch, H.; Landgraf, J.; Li, Z. Grand Challenges in Satellite Remote Sensing: Oleg Dubovik, Gregory L. Schuster, Feng Xu, Yongxiang Hu, Hartmut Bösch, Jochen Landgraf, Zhengqiang Li:[Ressource électronique]. Frontiers in Remote Sensing 2021, 2, 619818. Available online: https://patrinum.ch/record/363901/.
- Fitzpatrick, R. G. J.; Parker, D. J.; Marsham, J. H.; Rowell, D. P.; Jackson, L. S.; Finney, D.; Deva, C.; Tucker, S.; Stratton, R. How a typical West African day in the future-climate compares with current-climate conditions in a convection-permitting and parameterised convection climate model. Climatic Change 2020, 163(1), 267–296. [Google Scholar] [CrossRef]
- Funk, C.; Peterson, P.; Landsfeld, M.; Pedreros, D.; Verdin, J.; Shukla, S.; Husak, G.; Rowland, J.; Harrison, L.; Hoell, A. The climate hazards infrared precipitation with stations—A new environmental record for monitoring extremes. Scientific Data 2015, 2(1), 150066. [Google Scholar] [CrossRef] [PubMed]
- Garcia-Soto, C.; Cheng, L.; Caesar, L.; Schmidtko, S.; Jewett, E. B.; Cheripka, A.; Rigor, I.; Caballero, A.; Chiba, S.; Báez, J. C. An overview of ocean climate change indicators: Sea surface temperature, ocean heat content, ocean pH, dissolved oxygen concentration, arctic sea ice extent, thickness and volume, sea level and strength of the AMOC (Atlantic Meridional Overturning Circulation). Frontiers in Marine Science 2021, 8, 642372. [Google Scholar] [CrossRef]
- Igbawua, T.; Ujoh, F.; Adagba, G.; Gaando, S.; Tsor, J. O. Determination of Onset and End of Growing Season in Nigeria using the Modified Dynamic (Optimal) Threshold Method and Satellite data. Nigerian Journal of Theoretical and Environmental Physics 2023, 1(1), 60–71. [Google Scholar] [CrossRef]
- Jiang, L.; Bauer-Gottwein, P. How do GPM IMERG precipitation estimates perform as hydrological model forcing? Evaluation for 300 catchments across Mainland China. Journal of Hydrology 2019, 572, 486–500. [Google Scholar] [CrossRef]
- Kidd, C.; Tan, J.; Kirstetter, P.; Petersen, W. A. Validation of the Version 05 Level 2 precipitation products from the GPM Core Observatory and constellation satellite sensors. Quarterly Journal of the Royal Meteorological Society 2018, 144(S1), 313–328. [Google Scholar] [CrossRef]
- Köppen, W. Die Wärmezonen der Erde, nach der Dauer der heissen, gemässigten und kalten Zeit und nach der Wirkung der Wärme auf die organische Welt betrachtet. Meteorologische Zeitschrift 1884, 1(21), 5–226. [Google Scholar]
- Köppen, W. Das geographische system de klimate. Handbuch Der Klimatologie. 1936. Available online: https://cir.nii.ac.jp/crid/1571980075115373056.
- Landolt, H.; Börnstein, R. E. Zahlenwerte und Funktionen aus Physik; Springer-Verlag, 1950. [Google Scholar]
- Le Traon, P.-Y. Satellites and Operational Oceanography. In Operational Oceanography in the 21st Century; Schiller, A., Brassington, G. B., Eds.; Springer Netherlands, 2011; pp. 29–54. [Google Scholar] [CrossRef]
- Liu, R.; Chang, C.; Zhong, R.; Lu, S. Soil Moisture Monitoring Method and Data Products: Current Research Status and Future Development Trends. Remote Sensing 2025, 17(24), 3945. [Google Scholar] [CrossRef]
- Liu, R.; Dong, Q.; Zhou, L.; Yang, F.; Sun, Y.; Yang, Y.; Zhang, S. Multiscale Analysis of Drought Characteristics in China Based on Precipitable Water Vapor and Climatic Response Mechanisms. Atmosphere 2026, 17(2), 119. [Google Scholar] [CrossRef]
- Lu, Z.; Shao, M.; Li, J.; Lin, J.; Tao, P.; Li, M.; Zhang, S.; Yao, P.; Fu, Y. Global Patterns and Drivers of Recent Decoupling Between Extratropical Spring Phenology and Temperature. Global Change Biology 2026, 32(4), e70829. [Google Scholar] [CrossRef] [PubMed]
- Lutsko, N. J.; Baldwin, J. W.; Cronin, T. W. The impact of large-scale orography on Northern Hemisphere winter synoptic temperature variability. Journal of Climate 2019, 32(18), 5799–5814. [Google Scholar] [CrossRef]
- Makinde, E. O.; Marchant, R.; Salami, J. T. Assessing two decades of change across the Eco-Regions of West Africa using remote sensing technology. Scientific African 2024, 23, e02056. [Google Scholar] [CrossRef]
- Mohanty, B. P.; Cosh, M. H.; Lakshmi, V.; Montzka, C. Soil Moisture Remote Sensing: State-of-the-Science. Vadose Zone Journal 2017, 16(1), 1–9. [Google Scholar] [CrossRef]
- Nicholson, S. E. Climate of the sahel and West Africa. In Oxford research encyclopedia of climate science; 2018. [Google Scholar]
- Nwachukwu, P. N.; Satge, F.; Yacoubi, S. E.; Pinel, S.; Bonnet, M.-P. From TRMM to GPM: How reliable are satellite-based precipitation data across Nigeria? Remote Sensing 2020, 12(23), 3964. [Google Scholar] [CrossRef]
- Raihan, A. A review of the global climate change impacts, adaptation strategies, and mitigation options in the socio-economic and environmental sectors. Journal of Environmental Science and Economics 2023, 2(3), 36–58. [Google Scholar] [CrossRef]
- Ramalingam, S.; Tanaka, K.; Tarakaramu, N.; Murugan, M.; Kaliyaperumal, A.; Khan, M. I. Assessing multi-decadal climatic variability and its impact on cardamom cultivation in the Indian Cardamom Hills. Scientific Reports 2024, 14(1), 29283. [Google Scholar] [CrossRef] [PubMed]
- Runtunuwu, E.; Kondoh, A. Assessing global climate variability under coldest and warmest periods at different latitudinal regions. Indonesian Journal of Agricultural Science 2008, 9(1), 7–18. [Google Scholar]
- Sandu, I.; van Niekerk, A.; Shepherd, T. G.; Vosper, S. B.; Zadra, A.; Bacmeister, J.; Beljaars, A.; Brown, A. R.; Dörnbrack, A.; McFarlane, N. Impacts of orography on large-scale atmospheric circulation. Npj Climate and Atmospheric Science 2019, 2(1), 10. [Google Scholar] [CrossRef]
- Sanogo, S.; Fink, A. H.; Omotosho, J. A.; Ba, A.; Redl, R.; Ermert, V. Spatio-temporal characteristics of the recent rainfall recovery in West Africa. International Journal of Climatology 2015, 35(15), 4589–4605. [Google Scholar] [CrossRef]
- Sebastian, D. E.; Ganguly, S.; Krishnaswamy, J.; Duffy, K.; Nemani, R.; Ghosh, S. Multi-Scale Association between Vegetation Growth and Climate in India: A Wavelet Analysis Approach. Remote Sensing 2019, 11(22), 2703. [Google Scholar] [CrossRef]
- Senner, N. R.; Stager, M.; Cheviron, Z. A. Spatial and temporal heterogeneity in climate change limits species’ dispersal capabilities and adaptive potential. Ecography 2018, 41(9), 1428–1440. [Google Scholar] [CrossRef]
- Shi, Y.; Zhang, Y.; Hong, X.; Liu, X. Asynchronous Responses of Plants, Soils, and Microbes to Snow Cover Change Across Terrestrial Ecosystems: A Global Meta-Analysis. Plants 2025, 14(20), 3172. [Google Scholar] [CrossRef] [PubMed]
- Sultan, B.; Gaetani, M. Agriculture in West Africa in the twenty-first century: Climate change and impacts scenarios, and potential for adaptation. Frontiers in Plant Science 2016, 7, 1262. [Google Scholar] [CrossRef] [PubMed]
- Sylla, M. B.; Nikiema, P. M.; Gibba, P.; Kebe, I.; Klutse, N. A. B. Climate Change over West Africa: Recent Trends and Future Projections. In Adaptation to Climate Change and Variability in Rural West Africa; Yaro, J. A., Hesselberg, J., Eds.; Springer International Publishing, 2016; pp. 25–40. [Google Scholar] [CrossRef]
- Vinukollu, R. K.; Wood, E. F.; Ferguson, C. R.; Fisher, J. B. Global estimates of evapotranspiration for climate studies using multi-sensor remote sensing data: Evaluation of three process-based approaches. Remote Sensing of Environment 2011, 115(3), 801–823. [Google Scholar] [CrossRef]
- Yang, J.; Gong, P.; Fu, R.; Zhang, M.; Chen, J.; Liang, S.; Xu, B.; Shi, J.; Dickinson, R. The role of satellite remote sensing in climate change studies. Nature Climate Change 2013, 3(10), 875–883. [Google Scholar] [CrossRef]
- Zhang, D.; Zhou, G. Estimation of soil moisture from optical and thermal remote sensing: A review. Sensors 2016, 16(8), 1308. [Google Scholar] [CrossRef] [PubMed]
- Zhang, H.; Sun, S.; Liao, Z.; Wang, T.; Xu, J.; Ju, P.; Gu, J.; Liu, J. Spatiotemporal Distribution of Continuous Precipitation and Its Effect on Vegetation Cover in China over the Past 30 Years. Plants 2026, 15(8), 1198. [Google Scholar] [CrossRef] [PubMed]
Figure 1.
A map of West Africa showing the regional boundaries and average annual precipitation from Climate Hazards Group Infrared Precipitation (CHIRP) product covering the West African region.
Figure 1.
A map of West Africa showing the regional boundaries and average annual precipitation from Climate Hazards Group Infrared Precipitation (CHIRP) product covering the West African region.
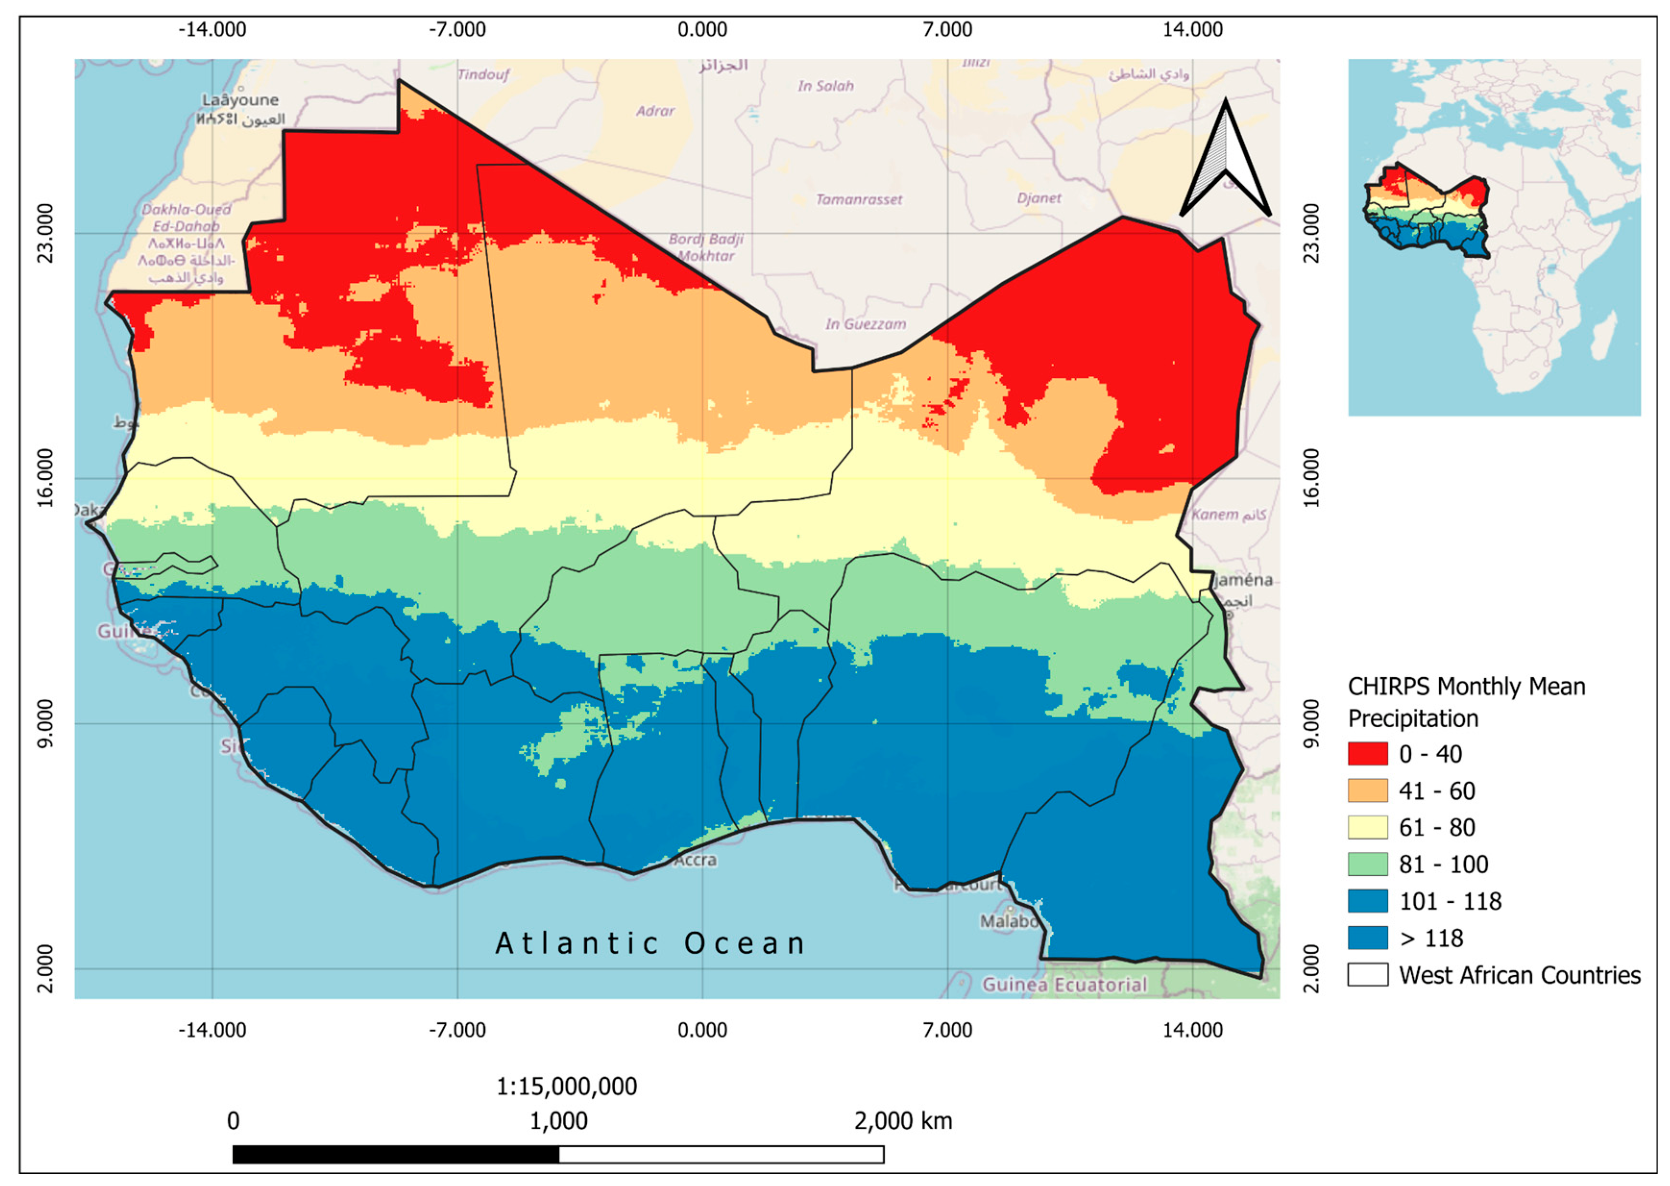
Figure 3.
Evaluation of rainfall regionalisation using Silhouette Scores. The score indicates the consistency of the identified climate zones, where higher values represent well-defined spatial clusters of precipitation across West Africa (1981–2024).
Figure 3.
Evaluation of rainfall regionalisation using Silhouette Scores. The score indicates the consistency of the identified climate zones, where higher values represent well-defined spatial clusters of precipitation across West Africa (1981–2024).
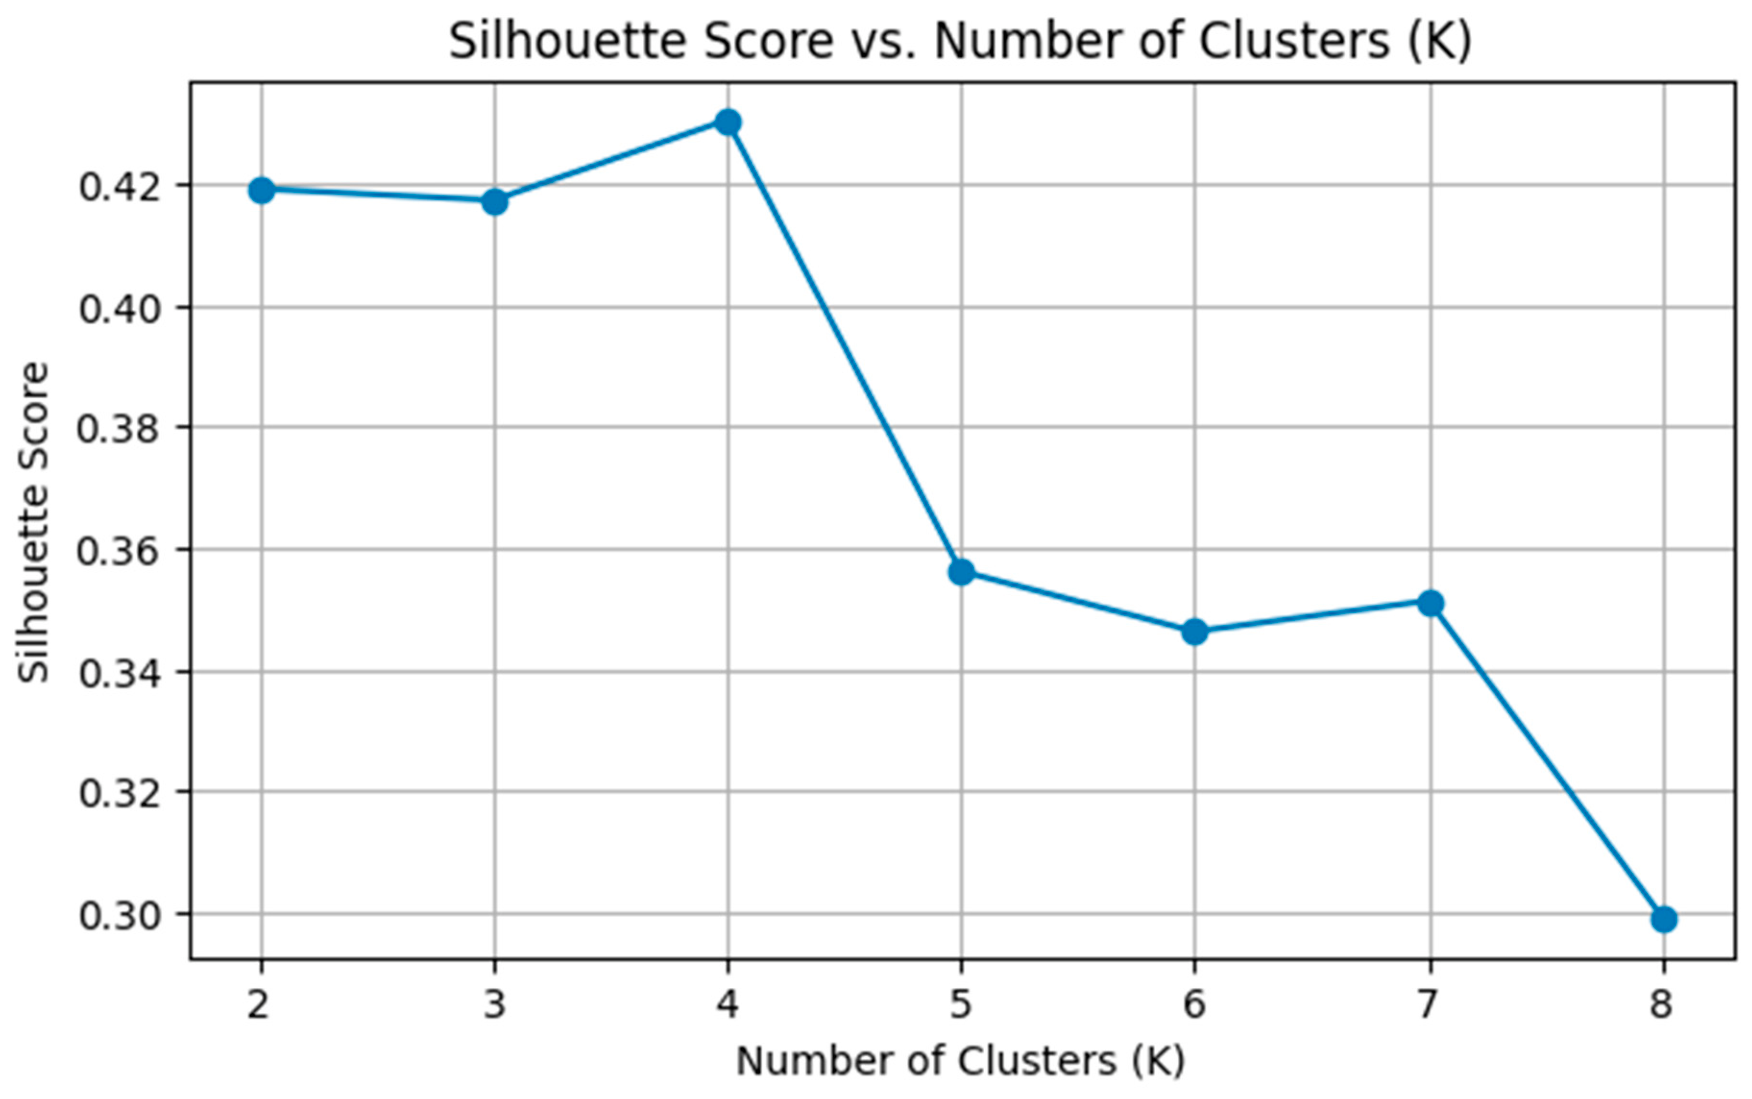
Figure 5.
(A): Evolution of cluster-wise precipitation profiles showing the quantitative framework for each cluster. (B): Regionalisation of precipitation regimes in West Africa (1981–2024) derived from K-means clustering (K=4) of CHIRPS monthly data. Clusters are ordered by mean monthly rainfall intensity, categorising the study area into Very Dry, Dry, Transitional, and Wettest climatic zones.
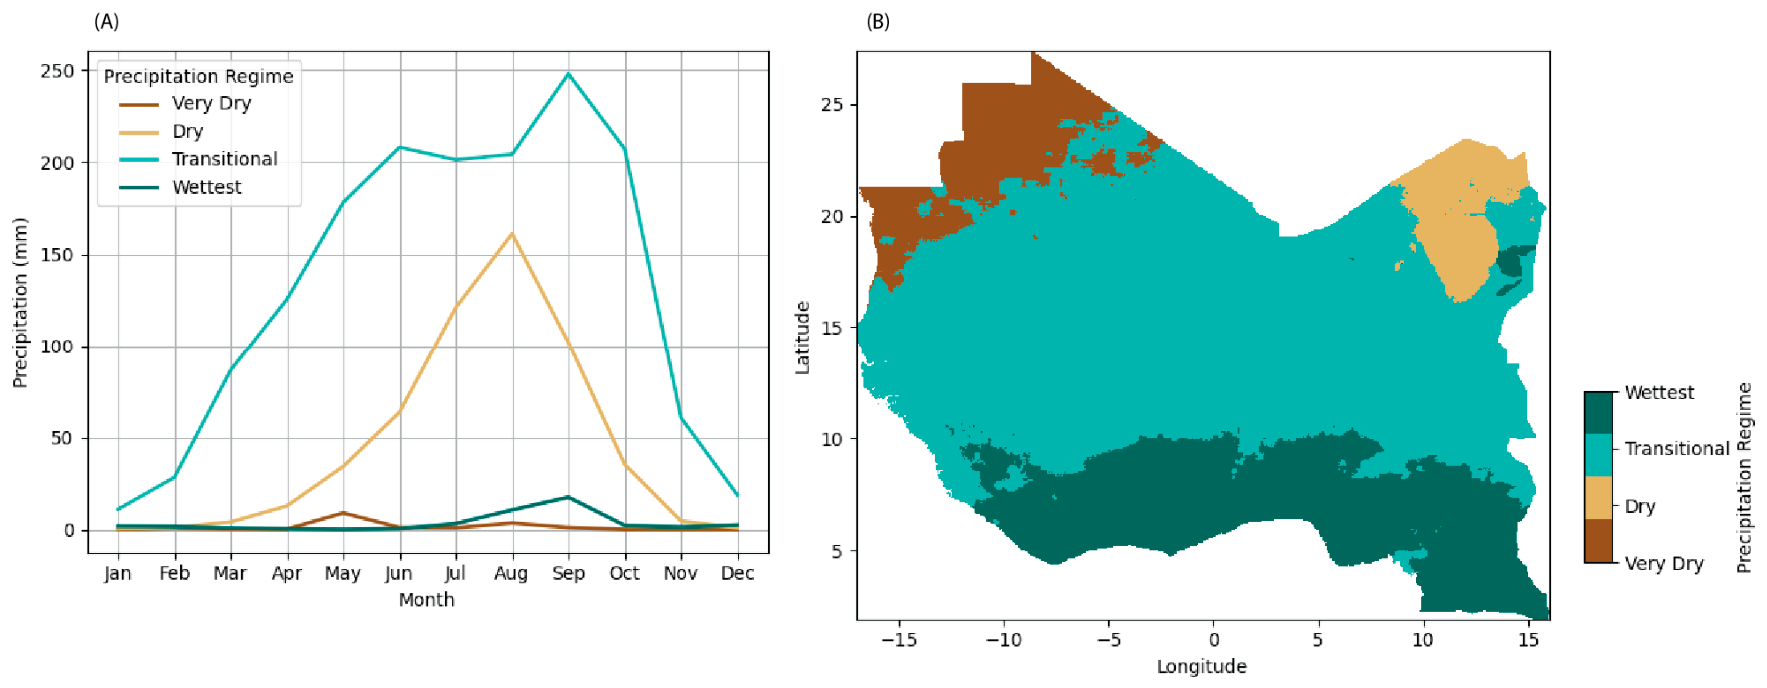
Figure 6.
Comparative analysis of identified precipitation regimes and the Köppen-Geiger climate classification zones across West Africa. The grouped bar chart displays the percentage of pixels within each Köppen zone that are categorised into the four K-means precipitation clusters (Very Dry, Dry, Transitional, and Wettest).
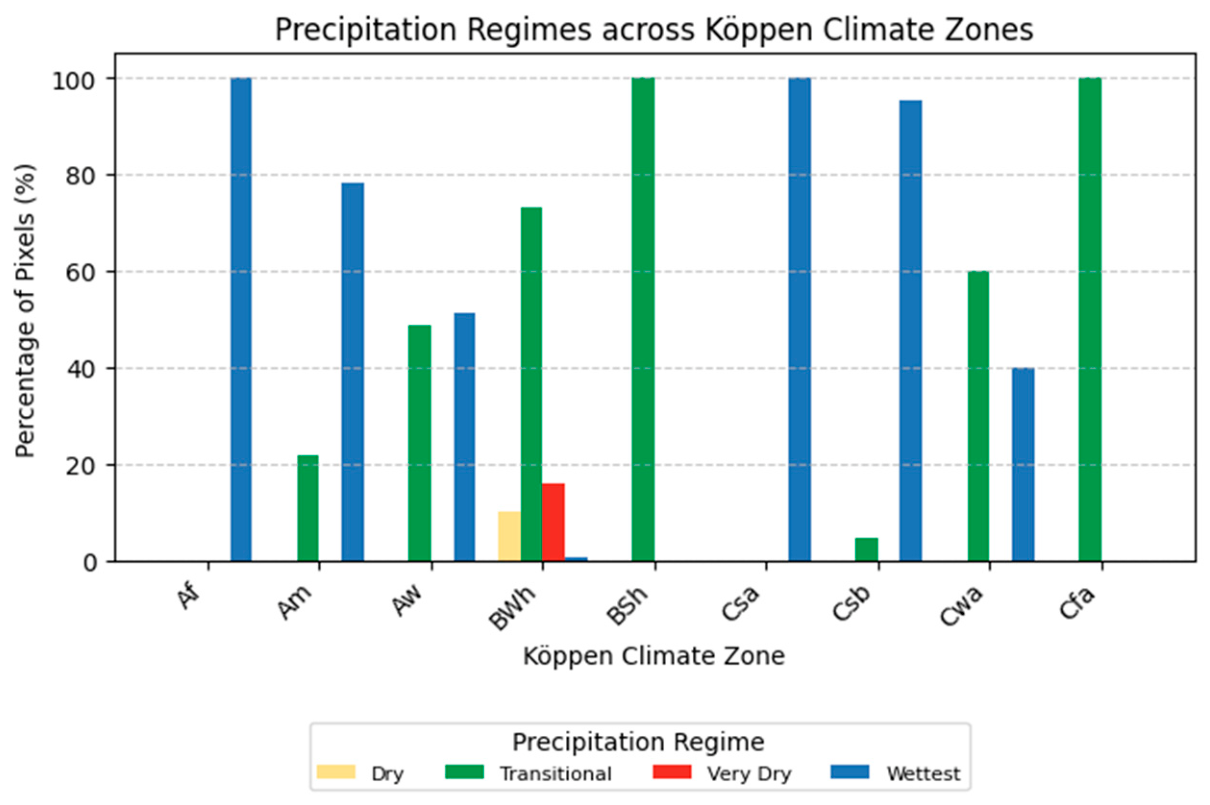
Figure 7.
Statistical differences between the standardised residuals and the differences between the Köppen climate zone and precipitation regimes in the study area. (A) Heatmap of observed vs expected differences in cell counts, (B) Heatmap of standardised residuals (Observed vs Expected), showing over- and under-representation of precipitation regimes per Köppen climate zone.
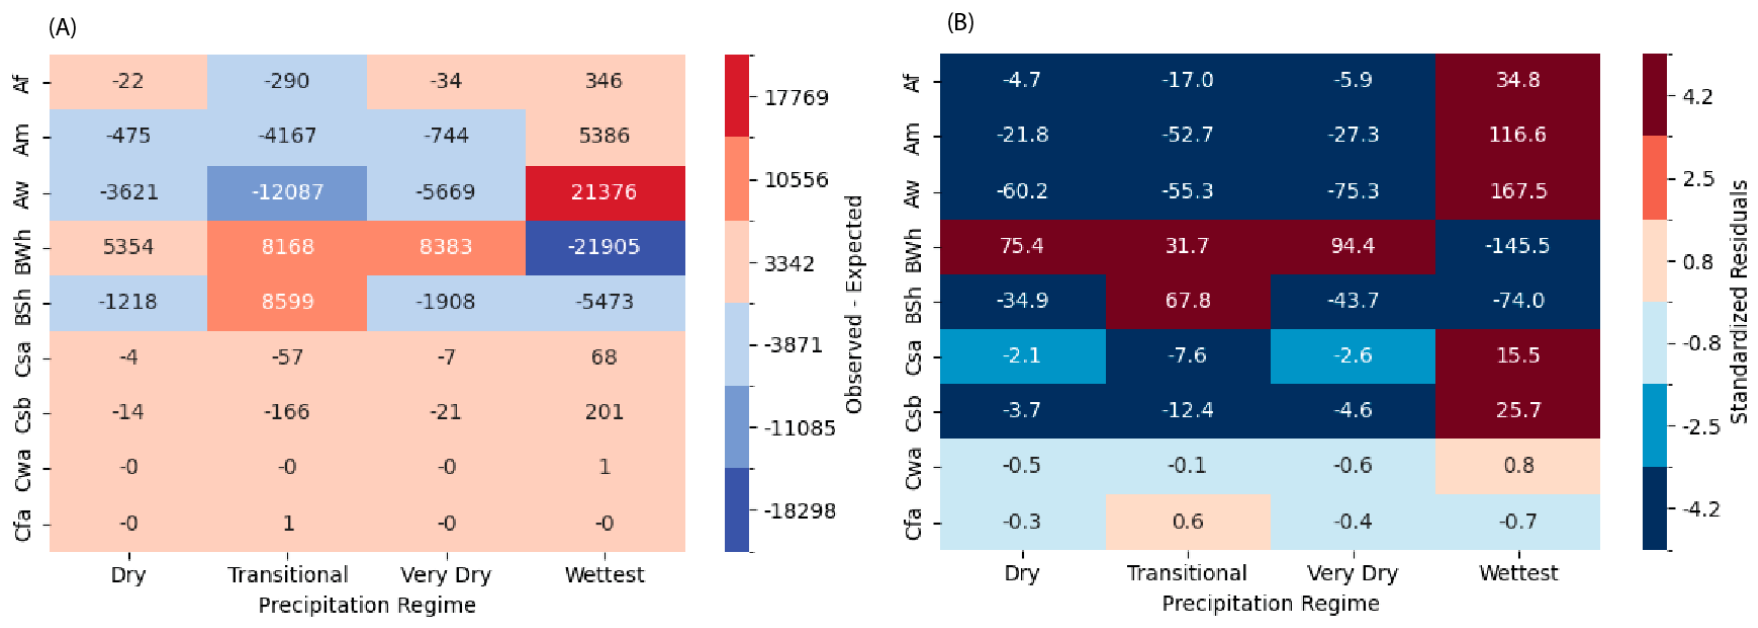
Figure 8.
Spatial distribution of precipitation trends across West Africa (1981–2024). The map displays the linear slope coefficient derived from pixel-wise regression analysis, representing the annual rate of change in mean precipitation (mm/year). Areas in green indicate increasing trends (wetting), while brown/red areas indicate decreasing trends (drying).
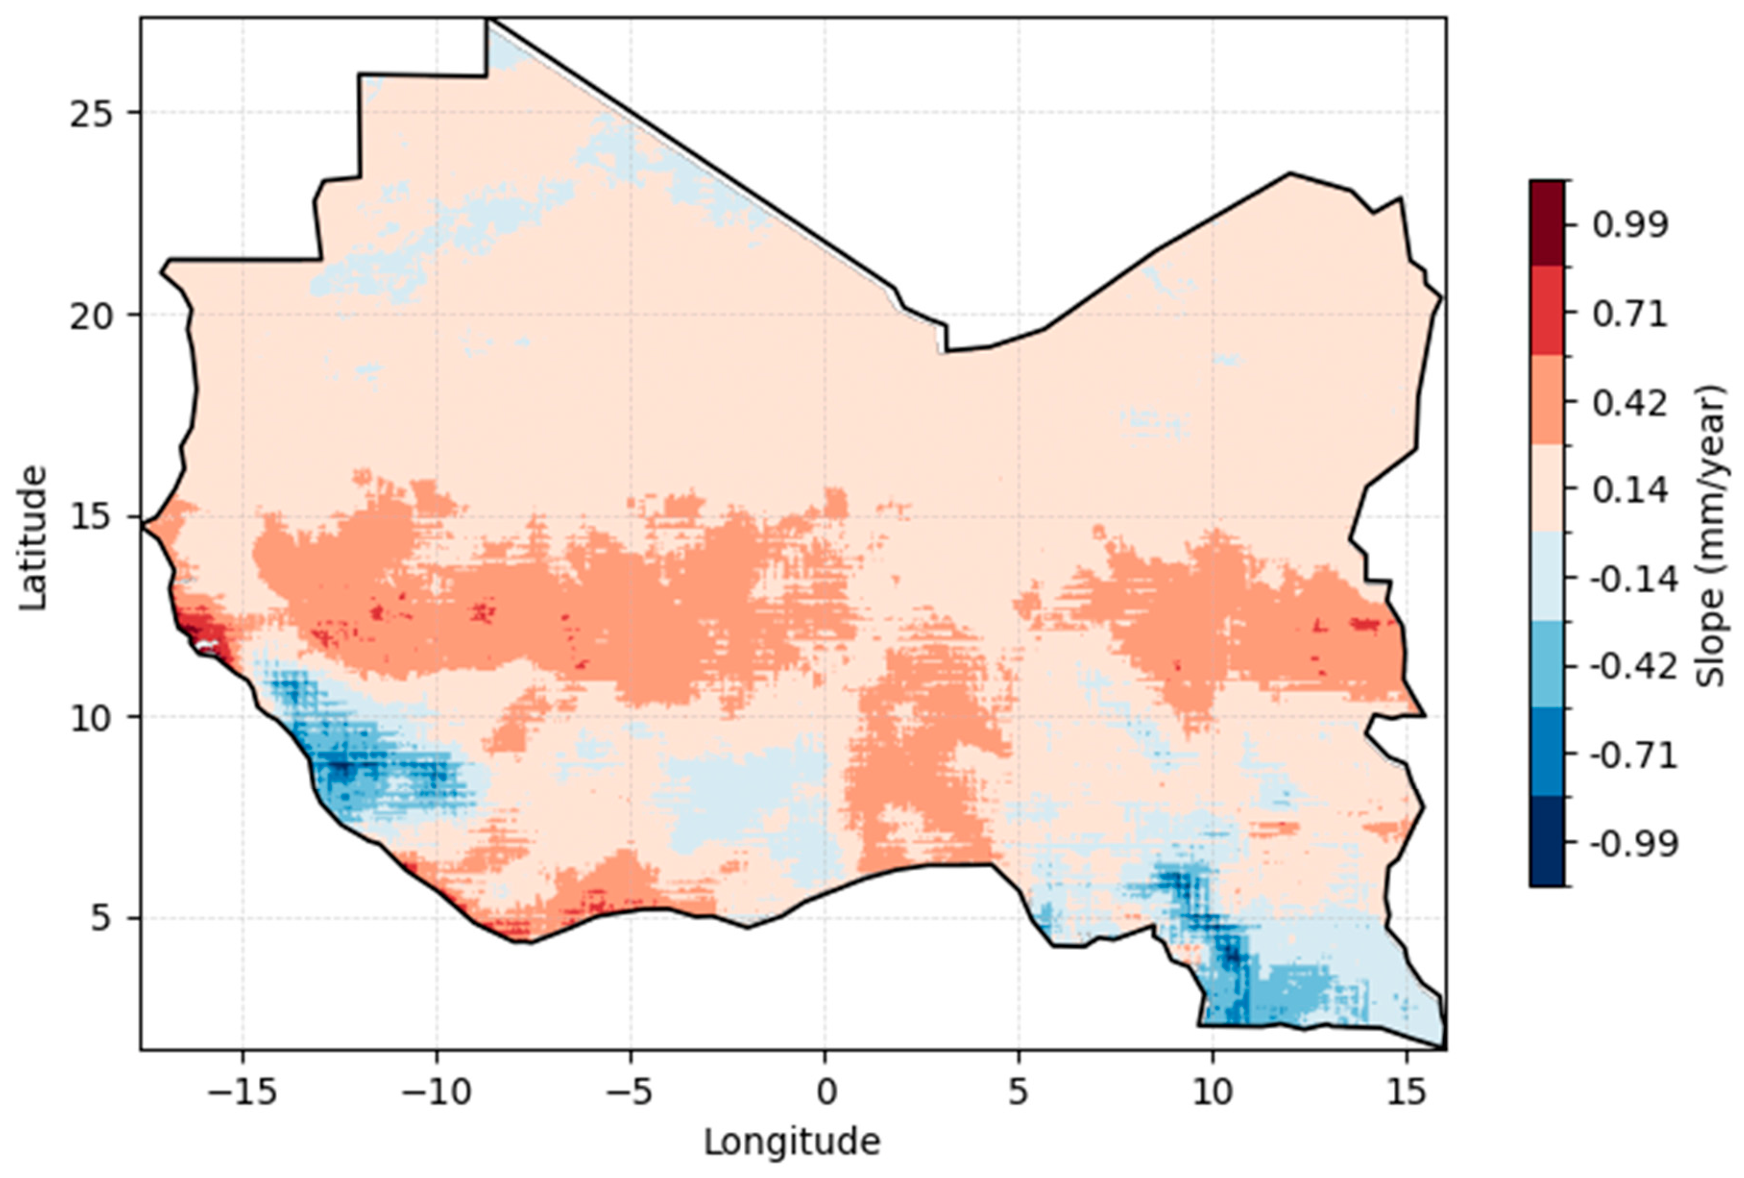
Figure 9.
Average precipitation trends aggregated by Köppen climate classification zones (1981–2024). Bars represent the mean linear slope coefficient (mm/yr−1) for all pixels within each respective zone. Blue bars indicate a long-term increase in annual mean precipitation (wetting), while red bars indicate a decrease (drying)..
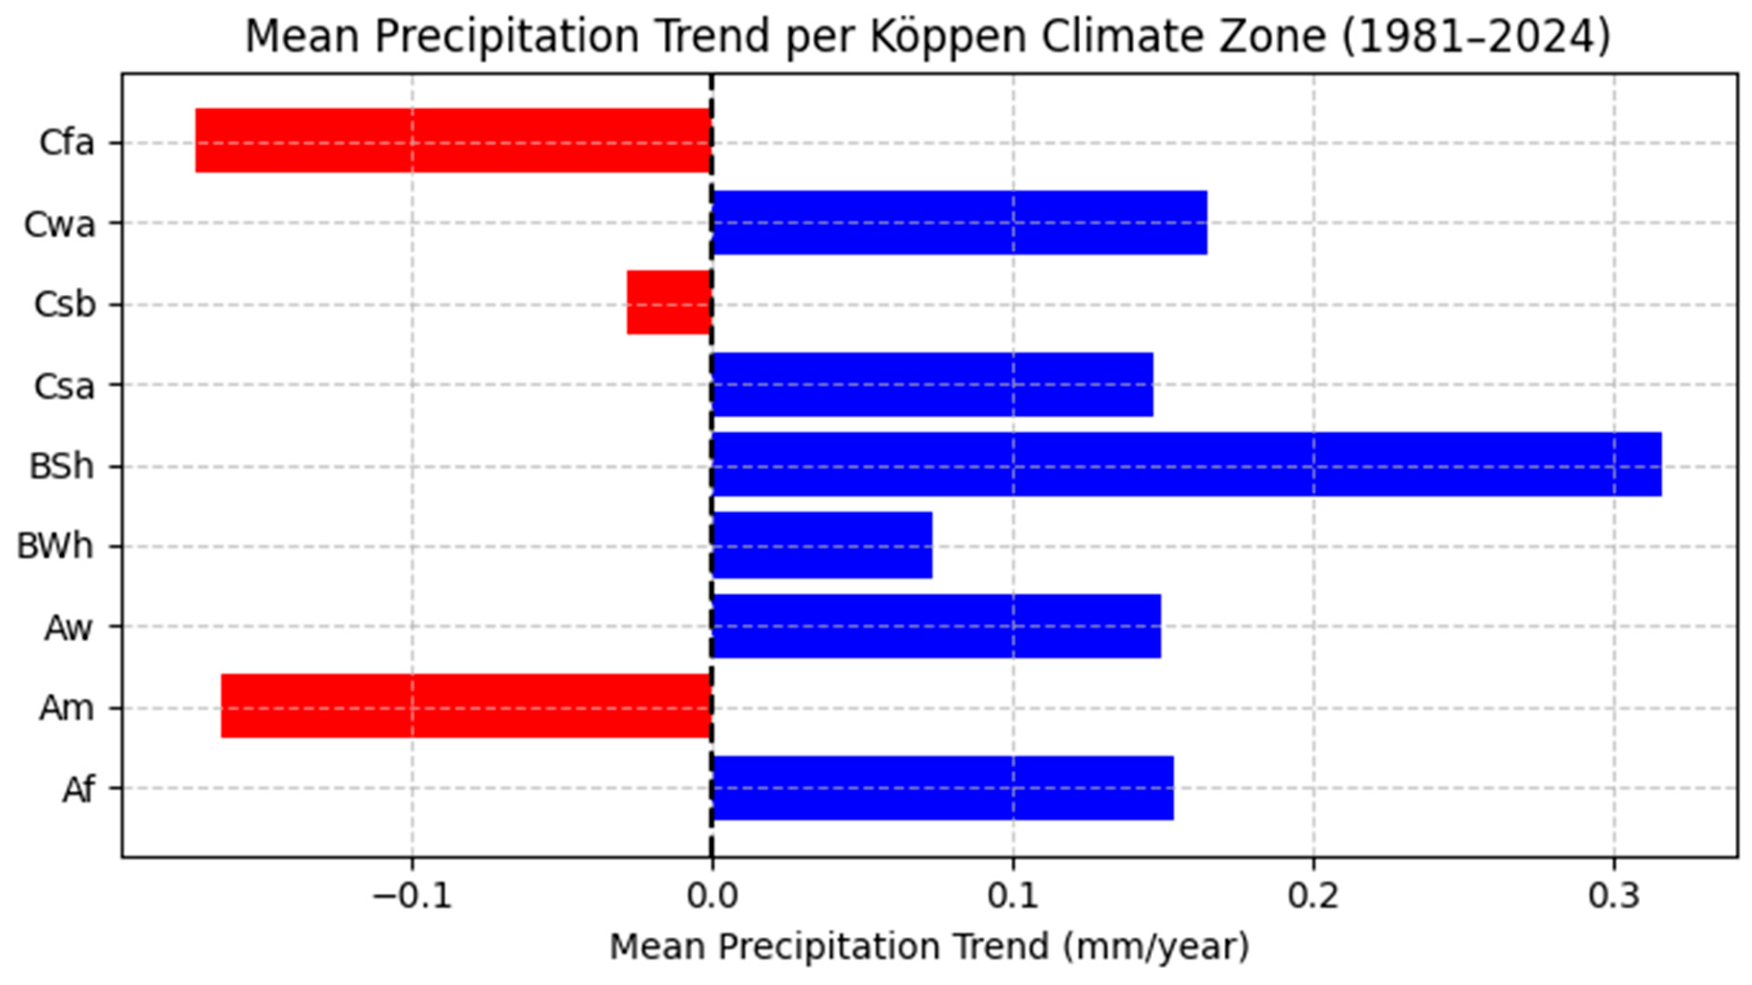
Table 4.
Mean slope (mm/year), standard deviation, and pixel count per Köppen climate zone.
| Köppen Zone | Mean Slope (mm/yr) | StdDevSlope | Pixel Count |
|---|---|---|---|
| Af | +0.154 | 0.502 | 445 |
| Am | -0.164 | 0.331 | 9616 |
| Aw | +0.149 | 0.220 | 73341 |
| BWh | +0.074 | 0.087 | 102077 |
| BSh | +0.317 | 0.091 | 24671 |
| Csa | +0.147 | 0.182 | 88 |
| Csb | -0.028 | 0.244 | 275 |
| Cwa | +0.165 | 0.053 | 5 |
| Cfa | -0.172 | 0.061 | 2 |
Disclaimer/Publisher’s Note: The statements, opinions and data contained in all publications are solely those of the individual author(s) and contributor(s) and not of MDPI and/or the editor(s). MDPI and/or the editor(s) disclaim responsibility for any injury to people or property resulting from any ideas, methods, instructions or products referred to in the content. |
© 2026 by the authors. Licensee MDPI, Basel, Switzerland. This article is an open access article distributed under the terms and conditions of the Creative Commons Attribution (CC BY) license (http://creativecommons.org/licenses/by/4.0/).
Copyright: This open access article is published under a Creative Commons CC BY 4.0 license, which permit the free download, distribution, and reuse, provided that the author and preprint are cited in any reuse.