
Submitted:
12 October 2026
Posted:
13 October 2026
You are already at the latest version
Abstract
Records of classic texts are gradually changing from analog to digital formats, and thus various analytical visualizations are appearing that use text data. These digital visualizations allow users to grasp the storylines of books more quickly. A process for defining the relational data between characters and expressing it in data networks has been developed recently. Consequently, we can now easily analyze the core information obtained within relevant historical periods. It is possible to analyze an event in detail using different types of data and visualizations. Therefore, in this study, we developed a visualization system called Echoes of Joseon, which can analyze an event by focusing on the attribute data for each character. To test the feasibility of this system, we used data from the Annals of the Joseon Dynasty. This system establishes and utilizes metadata related to character information in the Annals, thereby allowing us to easily find, compare, and analyze various patterns related to character attributes in each period. Furthermore, by quantifying multi-dimensional metrics through a Quantitative Archetype Matrix, our approach enables a deeper and more structured ex-amination of evolving character trajectories and their systemic impacts.
Keywords:
annals of the joseon dynasty
; character attribute
; radial visualization
; historical archetype
; visual analytics
1. Introduction
World-famous history books, mythological stories, and novels can be conveyed to many people through various media such as theatrical dramas, movies, and television. These media are interpreted by successive generations over time. In addition, the availability of classical texts on the web, which is facilitated by translation apps and digitizing printed texts, is progressing daily. Given this conversion of proprietary analog formats into universal digital data, we can now find and analyze meaningful information in these classical texts, as well as visualize it, in order to obtain new insights into our past with novel analytical tools.
Although handling the sheer volume and complex structure of digitized classical texts is challenging, continuous visual analytics allows us to extract vital insights effortlessly. Visualization studies have increasingly utilized classical texts; notable examples include visualizations of the Bible [1] (the best-known text throughout the world) and Cappelli et al.’s [2] exploration of temporal relational changes between characters in Dante’s Inferno. In addition, Geng et al. [3] analyzed visual data regarding interpretations of Shakespeare’s Othello, while Zhu et al. [4] proposed a historical visualization method using character data from the History of Three States. Moreover, Akaishi et al. [5] employed a visual analysis system to analyze Japanese historical data, and Park et al. [6] created a data pattern visualization system for characters who appeared during tragic periods of royal family relationships. Recent advancements in digital heritage have further expanded this trajectory, emphasizing interactive visual analytics that move beyond static relationship mappings to explore complex, multi-dimensional cultural data [7,8].
Conventionally, relationships between textual characters are defined using node-link network visualizations, allowing researchers to compare key events and sequences across different time periods. This approach effectively conveys textual narratives and efficiently summarizes information into a single visual frame.
However, network visualizations have inherent limitations when analyzing the independent, multi-dimensional attributes of characters over time. To address this, we developed an interactive visual analytics system called Echoes of Joseon. This visualization tool displays historical patterns through a multi-faceted interface—featuring radial fanned spokes, stacked ranked dot cascades, and barcode lollipop timelines—using independent attribute data for each character. The system can analyze each character in further detail via topological selections and multi-dimensional radar visualizations.
Figure 1.
Overview of the Echoes of Joseon visual analytics system, featuring the top command switchboard, radial fanned spokes, stacked ranked dot cascades, and the chronological barcode lollipop timeline.
Figure 1.
Overview of the Echoes of Joseon visual analytics system, featuring the top command switchboard, radial fanned spokes, stacked ranked dot cascades, and the chronological barcode lollipop timeline.
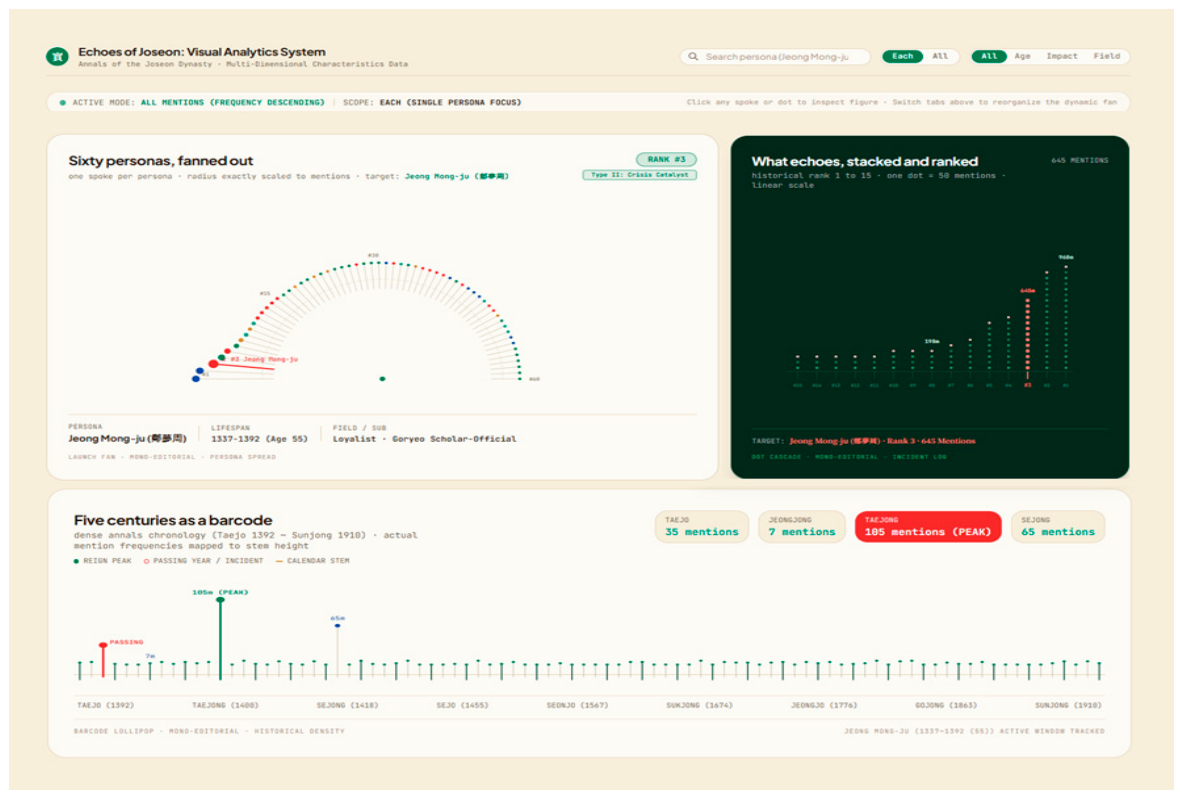
To demonstrate the analytical capabilities of this system, we utilized textual data from the Annals of the Joseon Dynasty. The Annals represent one of the most extensive and continuous historical records of a single dynasty in human history, meticulously documenting over five centuries (1392–1910) across the reigns of 27 kings. Recognizing its unprecedented volume and historical value, its core records were inscribed on the UNESCO Memory of the World Register in 1997. What makes the Annals particularly exceptional for data analytics is its rigorous objectivity; the records were strictly maintained by independent historiographers whose drafts were shielded from the monarchs’ eyes, ensuring a highly credible, chronological big data source. Our proposed system extracts and visualizes multi-dimensional character attributes from this monumental documentary heritage. By analyzing the results, we verified that this attribute-focused approach is highly effective at uncovering hidden political dynamics and individual trajectories within vast historical archives, offering a robust alternative to conventional network visualizations.
2. Related Work
Various methods have been proposed previously for visualizing character data in classical texts. Network visualization by focusing on character relationships is the most popular visualization method for analyzing character information.
By using network visualization to analyze the Annals of the Joseon Dynasty, the visualization in Figure 2(a) shows the neat output of network visualization. This visualization did not use the original data from the Annals, but instead it employed the text from the book, where the relations among the characters are arranged well. The relationships between characters are simplified by filtering characters with low connectivity by using a K-core algorithm and MCODE. Thus, the most important relationships and events can be analyzed easily by bisecting the network, thereby combining characters and events [9].
Clearly, the network visualization method is not universally applicable and it has some limitations. For example, the complexity increases with the data volume, thereby obscuring and abstracting the results. It is also difficult to compare and analyze data when the text is divided into several subjects and periods, which are visualized discretely. Therefore, various systems have been proposed to overcome these issues. Examples include Motif Simplification [10], which readily generates a network visualization that is difficult to analyze due to the complexity of the nodes; MultiStory [11], a visualization system improvement for elucidating complex, multi-relational node-link relationships with novel methods called AlterCluster and InterArc; NetVisia [12], a method that is more effective for analyzing network changes over time using a two-dimensional heat map; and a method that can explore networks from various perspectives using a three-dimensional Matrix Cube [13].
To move beyond the limitations of network visualizations, several studies have explored attribute-based approaches using independent character information. For instance, Noh [17] laid the preliminary groundwork by extracting character-focused data directly from the Annals of the Joseon Dynasty for visual analysis. Building upon this, Park et al. [6, 16] developed a central coordinate visualization system (Figure 2(b)) using attributes such as name, age, job, and appearance frequency. Their system calculates the distance between a character and the central coordinate based on frequency values; as the value moves toward the center, it indicates higher centrality. They also visualized directional movement and marked death and job information, allowing users to grasp a character’s situational context during specific events.
However, the system proposed by Park et al. has significant limitations: it is not effective for tracking dynamic scope changes over specific time periods, and multi-dimensional attributes beyond simple frequency are not accurately normalized or represented.
To overcome these foundational limitations, we developed a significantly advanced analytic system, Echoes of Joseon. By introducing the mathematical normalization framework discussed in Section 4, our system fundamentally restructures how character attributes are quantified. We integrated radial distribution layouts [14] and chronological density timelines to allow viewers to easily grasp structural changes in historical data. Furthermore, our system utilizes multi-dimensional characteristics [15] and multi-axis radar visualizations to seamlessly evaluate rapid character transformations. The main advantage of Echoes of Joseon is its ability to generate dynamic attribute patterns—allowing researchers to deeply analyze the minute details of a character’s life trajectory and systemic influence across 500 years of history.
3. Metadata for the Annals of the Joseon Dynasty
The Annals of the Joseon Dynasty contain a vast amount of historical data, which have been digitized and translated into modern Korean since 2005 by the National Institute of Korean History (NIKH). These extensive records document the reigns of 27 kings over a period of approximately five centuries. Including the revised and supplemented editions (written from alternative political perspectives), the entire collection comprises 33 distinct compilations. Notably, when historical records were revised during the dynasty, both the original drafts and the modified versions were preserved, providing a rich, multi-faceted repository for historical analysis. In this study, we processed this archive to construct a comprehensive Joseon character encyclopedia, computing character mention frequencies by cross-referencing biographical metadata with the original textual data of the Annals.
To accurately extract data, we analyzed both the original Classical Chinese text (Hanja, ideograms) and the translated modern Korean text (Hangul, phonograms). Because Hangul is a phonetic script, searching for character names in Hangul yielded a high rate of false positives due to homonyms and overlapping general vocabulary. Consequently, relying solely on Hangul translations made it difficult to extract precise mention frequencies. To resolve this ambiguity, we primarily utilized the original Hanja text for frequency counting, as its ideographic nature ensures exact entity matching and a significantly lower false-positive rate.
Hangul data were used only as a supplementary source for specific historical figures lacking precise Hanja records. Furthermore, since royal family members (e.g., kings, queen mothers, princes, and princesses) are frequently recorded by their official titles rather than their given names, we constructed a separate titular dictionary. By mapping these titles to the respective historical figures, we accurately captured their mention frequencies within the system. Ultimately, this rigorous extraction process established a foundational metadata directory containing the names, lifespans (birth and death years), functional fields, overall mention frequencies, and reign-specific frequencies for 16,657 individuals who appear across the Annals. This extensive database serves as the robust backbone for the system’s multi-dimensional visual analytics detailed in the following sections. The multi-dimensional attributes utilized to construct the Quantitative Archetype Matrix are explicitly derived from this rigorous biographical metadata established by NIKH. This approach ensures that our computational categorization of character trajectories maintains strict historiographical validity
4. System Design and Character Attributes
To effectively operationalize the expansive metadata directory established in Section 3, the system filters the 16,657 recorded individuals down to a highly focused experimental dataset. To prevent visual clutter and ensure analytical significance, we extracted the 60 core historical figures who exhibited the highest historical mention frequencies and systemic influence. To ensure a well-balanced analysis without sampling bias, these 60 personas were systematically categorized into five primary political and social factions. As illustrated in Figure 3, the dataset comprises Merit/Bureaucrat (44%), Incident/Loyalist (20%), Royal Family (18%), Scholar (10%), and Military/Others (8%).
To overcome the limitations of flat feature listings, we designed the system’s interface around a 3-Phase Hierarchical Visual Analytics Workflow. This pipeline seamlessly guides researchers from broad temporal overviews down to granular individualized metrics, integrating distinct analytical controls at each depth:
- Phase 1: Macro-Level Chronological Exploration: The workflow initiates with a macro-analytical lens, allowing users to extract historical densities and aggregate dynastic data across the 500-year timeline. By engaging the chronological switchboard, researchers can fluidly navigate from the Taejo to Sunjong eras, instantly revealing overarching political turbulence and comparative mention peaks across the entire historical dataset.
- Phase 2: Meso-Level Structural Clustering: Transitioning from temporal trends to structural attributes, the system provides a suite of dynamic reconfiguration controls (All, Age, Impact, and Field). This phase dynamically restructures the radial fanned spokes and stacked dot cascades. By recalculating visual scales and applying categorical color mapping on the fly, the system effectively uncovers hidden factional cohorts and structural alignments within a specific reign.
- Phase 3: Micro-Level Persona Probing: The final analytical depth shifts the focus to an individualized (micro) scope. Upon selecting a specific focal node, the system isolates the target’s historical footprint. This action triggers synchronized, deep-dive updates across the multi-dimensional radar metrics, barcode timelines, and matrix graphs, enabling a highly granular inspection of a single character’s life trajectory and systemic impact.
4.1. Mathematical Formulation and Metric Normalization
To eliminate analytical distortion arising from substantial disparities in kings’ reign lengths, we implemented a rigorous metric normalization framework across all time periods.
Let Tk denote the total duration (in years) of the reign of King k ∈ K, and Ap represent the active span of character c ∈ Ck recorded within that reign (1 ≤ Ap ≤ Tk). The reign-relative active span ratio, α, is defined as:
The raw impact factor, Dp, evaluates the local density of mentions per active year:
To facilitate valid cross-reign comparative visual analytics, the partial impact score, , is normalized into a bounded range [0,1] via min-max scaling across all active figures Ck within the respective annal:
Similarly, the overall impact across the entire 500-year dynastic period, , is normalized based on the overall density Da (where Da = Fa/Aa):
Based on these foundational calculations, the final attributes mapped to the visual analytics system are defined as follows:
- Frequency (F): Quantified as partial frequency (Fp) within a single annal and overall frequency (Fa) across all 33 texts. To map these values onto the normalized radar chart, they are transformed into and via min-max scaling within their respective ranges.
- Age and Active Lifespan (A): The overall age (Aa) reflects the chronological lifespan and is normalized into , whereas the partial active span (Ap) represents the precise duration of active reign participation.
- Impact (I): Visually encoded through the radial stem length and the cumulative vertical height of the stacked dot cascades.
- Field Information: Categorized into 27 functional domains based on historical biographical records, which are then mapped to distinct categorical color hues for intuitive factional clustering.
4.2. Taxonomy of Historical Character Archetypes
Adapting the conceptual classification framework initially proposed by Park [16], we advanced the taxonomy into a Quantitative Archetype Matrix. Rather than relying on qualitative historical assessment, this matrix establishes an objective, reproducible classification derived from the six-dimensional normalized radar vector . By governing the vector space with strict mathematical threshold criteria (θhigh = 0.70,θmed = 0.40,θlow = 0.20), we formalize four distinct historical trajectories:
- Quadrant I (Epochal Regime Architects): Defined by high local impact alongside sustained reign participation (), such as Jeong Do-jeon.
- Quadrant II (Crisis Catalysts and Tragic Opposition): Characterized by an acute impact spike within a highly compressed active span (), such as Jeong Mong-ju.
- Quadrant III (Sustained Dynastic Hegemons): Identified by expansive macro-level influence across the entire dynastic timeline (), such as Sin Suk-ju.
- Quadrant IV (Institutional Functionaries and Peripherals): Populating the lower-bound matrix space with tightly contracted metrics (), such as Min Mu-gu.
The specific threshold values (θhigh = 0.70, θmed = 0.40, θlow = 0.20) were not chosen arbitrarily; rather, they were empirically derived from the percentile distribution of the normalized mention frequencies across the dataset. Given the long-tail nature of historical text data, these thresholds were further refined through an iterative heuristic process. By visually evaluating the resulting archetypes, we confirmed that these values optimally demarcate the boundaries between statistically dominant figures and minor characters, aligning seamlessly with qualitative domain knowledge.
5. User Interface and System Overview
As demonstrated in Figure 4, the Echoes of Joseon interface integrates multiple coordinated views to seamlessly support the multi-dimensional exploration defined in Section 4. The system’s architecture is fundamentally anchored by the 3-Phase Hierarchical Visual Analytics Workflow. Users can manipulate the top command switchboard to filter macro-level chronology (Phase 1), toggle the dynamic structural clustering modes to reorganize the radial fanned spokes (Phase 2), and select individual nodes to probe micro-level persona trajectories via the six-dimensional radar chart (Phase 3).
Through this tightly coordinated interface, researchers can instantly observe how a character’s localized mathematical metrics correlate with overarching factional shifts, providing a highly intuitive visual summary before moving into detailed quantitative validations.
6. Results and Discussion
6.1. Analysis of Periodical Characteristics
By applying the system’s Phase 1 and Phase 3 workflows, researchers can seamlessly switch between dynastic aggregates (macro) and individual historical trajectories (micro). Figure 5 illustrates this capability through the chronological barcode lollipop timeline, revealing insights that flat textual readings might obscure.
From a macro-analytical perspective (Phase 1), Figure 5(b) aggregates the dynastic data across the entire 500-year timeline. The visualization instantly identifies periods of intense political turbulence. Most notably, the timeline peaks drastically during the reign of King Taejong (2,900 total mentions), followed by secondary spikes in other transitional eras. This data-driven pattern accurately mirrors the historical reality of bloody succession struggles, purges, and the rapid institutional restructuring that characterized Taejong’s era.
Conversely, shifting to the micro-level persona probing (Phase 3), Figure 5(a) isolates the historical footprint of Jeong Mong-ju. Although he was assassinated in 1392 (the founding year of Joseon), his mention frequency paradoxically spikes during King Taejong’s reign (105 mentions). By visualizing this posthumous data, the system effectively demonstrates that Jeong Mong-ju was continuously invoked as a political symbol of loyalty to justify the new regime’s authority. This proves that our visual analytics tool can successfully uncover hidden temporal dynamics and systemic impacts beyond a character’s biological lifespan.
6.2. Character Analysis
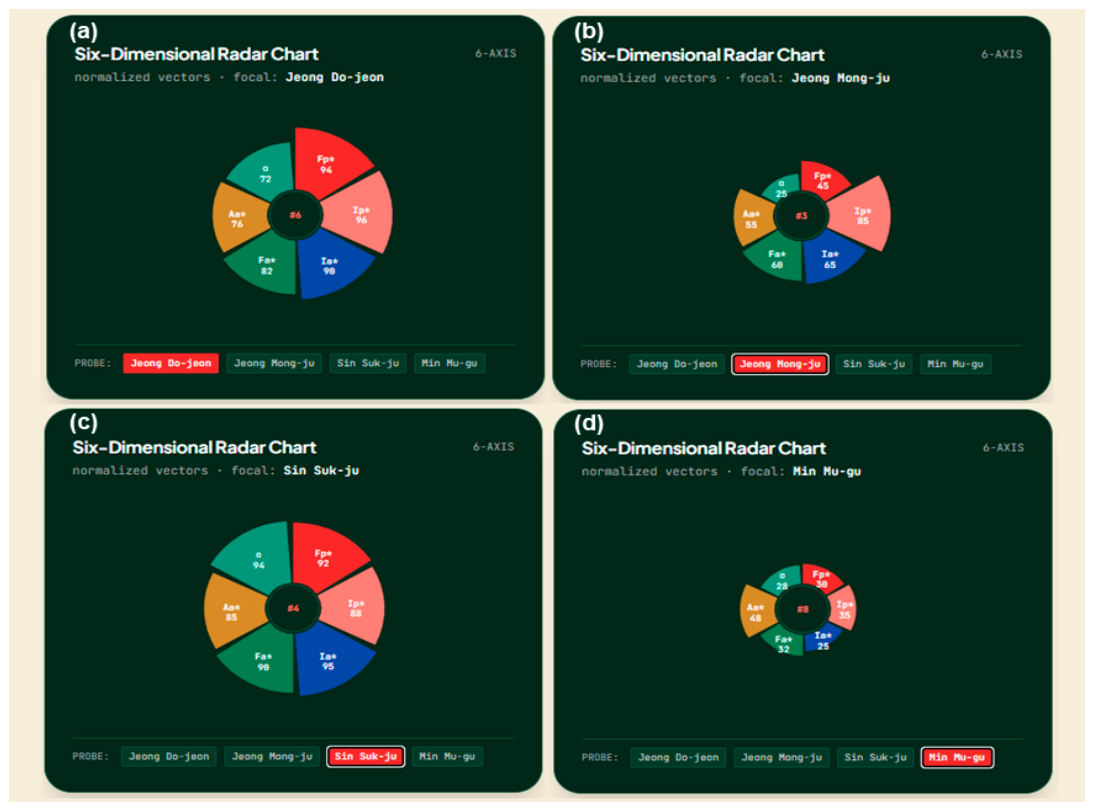
By projecting character vectors onto the six-dimensional radar chart, we quantitatively validate the four archetypes of historical figures formalized in Section 4.2. As shown in Figure 6, the unique geometric polygons (Metric Roses) generated by each character’s data provide an intuitive visual summary of their historical trajectory.
- Quadrant I (Epochal Regime Architects): Figure 6(a) illustrates the vector for Jeong Do-jeon. The polygon exhibits a broad expansion toward the reign-relative active span (α) and partial impact () axes. This wide, balanced shape visually confirms his sustained participation and immense foundational influence during the establishment of the new dynasty.
- Quadrant II (Crisis Catalysts and Tragic Opposition): Figure 6(b) visualizes Jeong Mong-ju’s metrics. The resulting polygon is highly skewed, showing a sharp, needle-like spike along the vertical partial impact () axis, contrasted with a severely compressed active span (α). This geometric imbalance perfectly captures his short but intensely explosive role during the regime change.
- Quadrant III (Sustained Dynastic Hegemons): As seen in Figure 6(c), Sin Suk-ju’s polygon is expansive across both local and global dimensions, stretching heavily towards the overall frequency () and overall impact () axes. This massive, nearly full-circle footprint reflects a lifetime of accumulated bureaucratic power spanning multiple successions.
- Quadrant IV (Institutional Functionaries and Peripherals): Figure 6(d) depicts Min Mu-gu. The polygon is tightly contracted near the center origin across all major axes, especially and . This shrunken geometric shape is characteristic of peripheral figures or functionaries who had limited individual impact and were quickly purged.
7. Conclusion and Future Work
In this study, we introduced the Echoes of Joseon system, a novel visual analytics environment designed to transcend the limitations of conventional flat network visualizations. By implementing a 3-Phase Hierarchical Visual Analytics Workflow, this research successfully bridges macro-level chronological explorations with micro-level individual persona probing. Furthermore, the introduction of the six-dimensional Metric Rose and the Quantitative Archetype Matrix provides a mathematically rigorous, reproducible framework for classifying historical figures into four distinct political trajectories.
The system’s utility was validated through empirical case studies, revealing hidden temporal dynamics such as the intense political turbulence during King Taejong’s reign and the posthumous systemic impact of figures like Jeong Mong-ju. These findings demonstrate that our quantitatively grounded approach offers a robust alternative for exploring and interpreting vast historical archives.
Future research will focus on expanding the metadata directory by integrating multiple historical sources, thereby achieving a more comprehensive, cross-referenced historical visualization. Additionally, incorporating natural language processing (NLP) techniques to analyze the qualitative sentiment of the historical records could further enrich the multi-dimensional character attributes within the radar metric space. Furthermore, to address architectural scalability when scaling beyond the representative 60 personas toward the complete corpus of 16,657 individuals, future iterations will integrate hierarchical Level of Detail (LOD) clustering and hardware-accelerated rendering pipelines. This optimization will effectively prevent visual clutter and maintain responsive interaction rates during large-cohort exploratory analytics.
Author Contributions
Y.K.L. was solely responsible for the conceptualization, methodology, software, validation, formal analysis, data curation, writing—original draft preparation, visualization, and project administration. The author has read and agreed to the published version of the manuscript.
Funding
This research received no external funding.
Data Availability Statement
Publicly available datasets were analyzed in this study. The original textual data from the Annals of the Joseon Dynasty can be freely accessed through the online database provided by the National Institute of Korean History (http://sillok.history.go.kr).
Conflicts of Interest
The author declares no conflicts of interest.
References
- Kim, H.; Park, J.W. Topics on bible visualization: Content, structure, citation. In Proceedings of the SA ‘13 SIGGRAPH Asia 2013 Art Gallery, Hong Kong, 19–22 November 2013; p. 22.
- Cappelli, A.; Coscia, M.; Giannotti, F.; Pedreschi, D.; Rinzivillo, S. The Social Network of Dante’s Inferno. Leonardo 2011, 44, 246–247.
- Geng, Z.; Laramee, R.S.; Cheesman, T.; Ehrmann, A.; Berry, D.M. Visualizing translation variation: Shakespeare’s Othello. In Proceedings of the International Conference on Advances in Visual Computing, Las Vegas, NV, USA, 26–28 September 2011; pp. 653–663.
- Zhu, Y.; Cao, X.; Bian, Y. CKGHV: A comprehensive knowledge graph for history visualization. In Proceedings of the IEEE/ACM Joint Conference on Digital Libraries, London, UK, 8–12 September 2014; pp. 437–438.
- Akaishi, M.; Sato, M.; Hori, K.; Ishikawa, T. A visual analysis tool for finding embedded relations in chronicles. In Proceedings of the International Conference on Information Visualisation, Montpellier, France, 11–13 July 2012; pp. 302–307.
- Park, S.K.; Lee, E.J.; Park, J.W. Visual History with Choson Dynasty Annals. In Proceedings of the ACM SIGGRAPH 2016 Art Gallery, Anaheim, CA, USA, 24–28 July 2016; pp. 334–341.
- Kim, M.; et al. Development of Data Labelling and Visualization Technologies for Digitized Cultural Heritage. Heritage 2023, 6, 2735-2751.
- Eberle, J.; et al. Advancing Historical Research Through AI and Data-Centric Epistemologies. Data 2026, 6, 38.
- Kim, H.Y.; Kim, H.B. Analysis of Network Dynamics from Annals of the Choson Dynasty. The Korea Contents Association 2014, 14, 529–537.
- Dunne, C.; Shneiderman, B. Motif simplification: Improving network visualization readability with fan, connector, and clique glyphs. In Proceedings of the SIGCHI Conference on Human Factors in Computing Systems, Paris, France, 27 April–2 May 2013; pp. 3247–3256.
- Meidiana, A.; Hong, S. MultiStory: Visual analytics of dynamic multi-relational networks. In Proceedings of the IEEE Pacific Visualization Symposium, Hangzhou, China, 14–17 April 2015; pp. 75–79.
- Gove, R.; Gramsky, N.; Kirby, R.; Sefer, E.; Sopan, A.; Dunne, C.; Shneiderman, B.; Taieb-Maimon, M. NetVisia: Heat Map & Matrix Visualization of Dynamic Social Network Statistics & Content. In Proceedings of the IEEE International Conference on Privacy, Security, Risk and Trust, Boston, MA, USA, 9–11 October 2011; pp. 19–26.
- Bach, B.; Pietriga, E.; Fekete, J.D. Visualizing dynamic networks with matrix cubes. In Proceedings of the SIGCHI Conference on Human Factors in Computing Systems, Toronto, ON, Canada, 26 April–1 May 2014; pp. 877–886.
- Atterer, R.; Lorenzi, P. A heatmap-based visualization for navigation within large web pages. In Proceedings of the Nordic Conference on Human-Computer Interaction, Lund, Sweden, 20–24 October 2008; pp. 407–410.
- Toker, D.; Conati, C.; Carenini, G.; Haraty, M. Towards Adaptive Information Visualization: On the Influence of User Characteristics. Lecture Notes in Computer Science 2012, 274–285.
- Park, S. Implementation of visualization analysis system and art content using text data: Focusing on character data of Choson dynasty annals. Master’s Thesis, Chung-Ang University, Seoul, Republic of Korea, 2017.
- Noh, S. Data Visualization Focused on the Characters for Analyzing the Annals of Joseon Dynasty. Master’s Thesis, Chung-Ang University, Seoul, Republic of Korea, 2014.
Figure 2.
Comparison of conventional network visualization and attribute-based central coordinate visualization.
Figure 2.
Comparison of conventional network visualization and attribute-based central coordinate visualization.
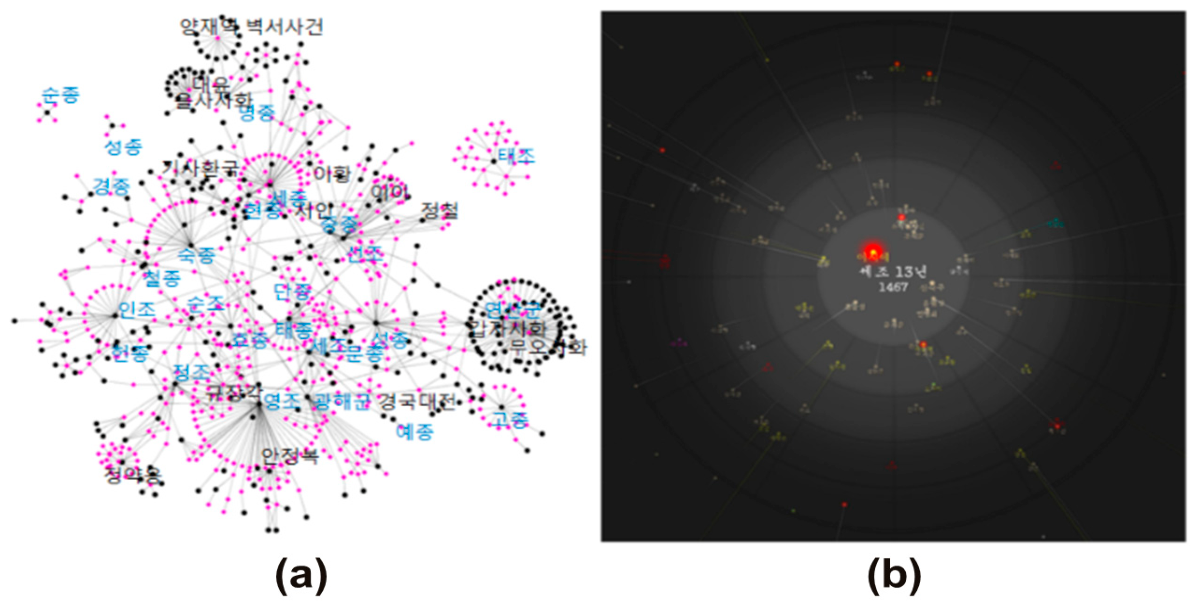
Figure 3.
The demographic distribution and factional composition of the 60 selected personas visualized through a 10x10 dot matrix (each dot represents 1%).
Figure 3.
The demographic distribution and factional composition of the 60 selected personas visualized through a 10x10 dot matrix (each dot represents 1%).
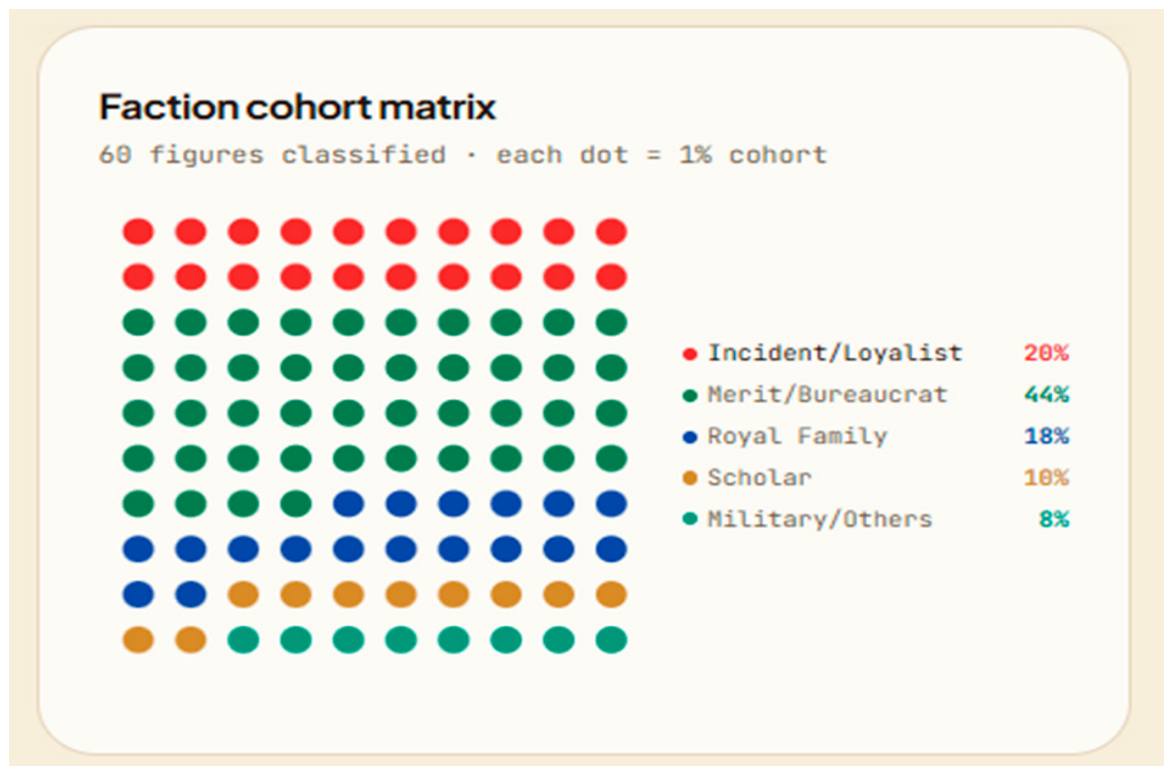
Figure 4.
Dynamic restructuring of the radial fanned spokes based on the Phase 2 structural clustering modes. (a) All: Sorted by total mention frequency. (b) Age: Stem lengths dynamically scaled to represent actual lifespans. (c) Impact: Sorted by the normalized partial impact score (). (d) Field: Nodes are categorically color-coded and clustered by political factions.
Figure 4.
Dynamic restructuring of the radial fanned spokes based on the Phase 2 structural clustering modes. (a) All: Sorted by total mention frequency. (b) Age: Stem lengths dynamically scaled to represent actual lifespans. (c) Impact: Sorted by the normalized partial impact score (). (d) Field: Nodes are categorically color-coded and clustered by political factions.
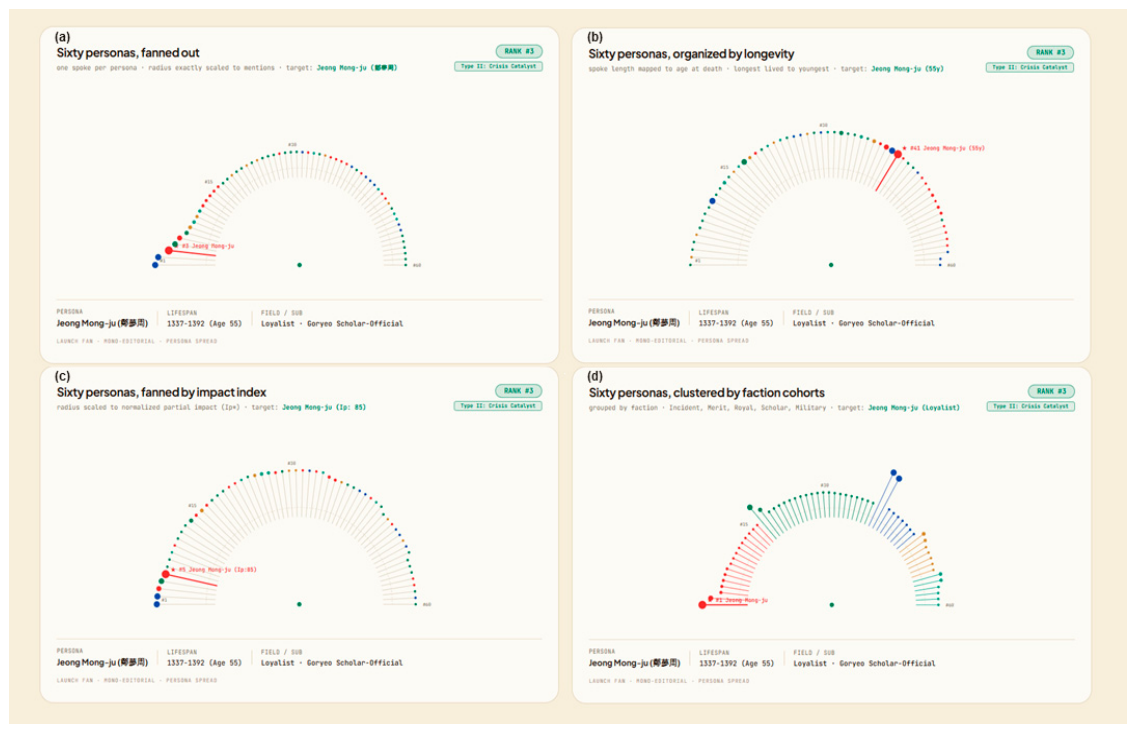
Figure 5.
The chronological barcode lollipop timeline demonstrating the hierarchical analytical workflows. (a) Micro-view (Phase 3): Tracks the active window, posthumous peak mentions, and passing year of Jeong Mong-ju. (b) Macro-view (Phase 1): Aggregates dynastic data to reveal historical density and political turbulence across the 500-year timeline.
Figure 5.
The chronological barcode lollipop timeline demonstrating the hierarchical analytical workflows. (a) Micro-view (Phase 3): Tracks the active window, posthumous peak mentions, and passing year of Jeong Mong-ju. (b) Macro-view (Phase 1): Aggregates dynastic data to reveal historical density and political turbulence across the 500-year timeline.
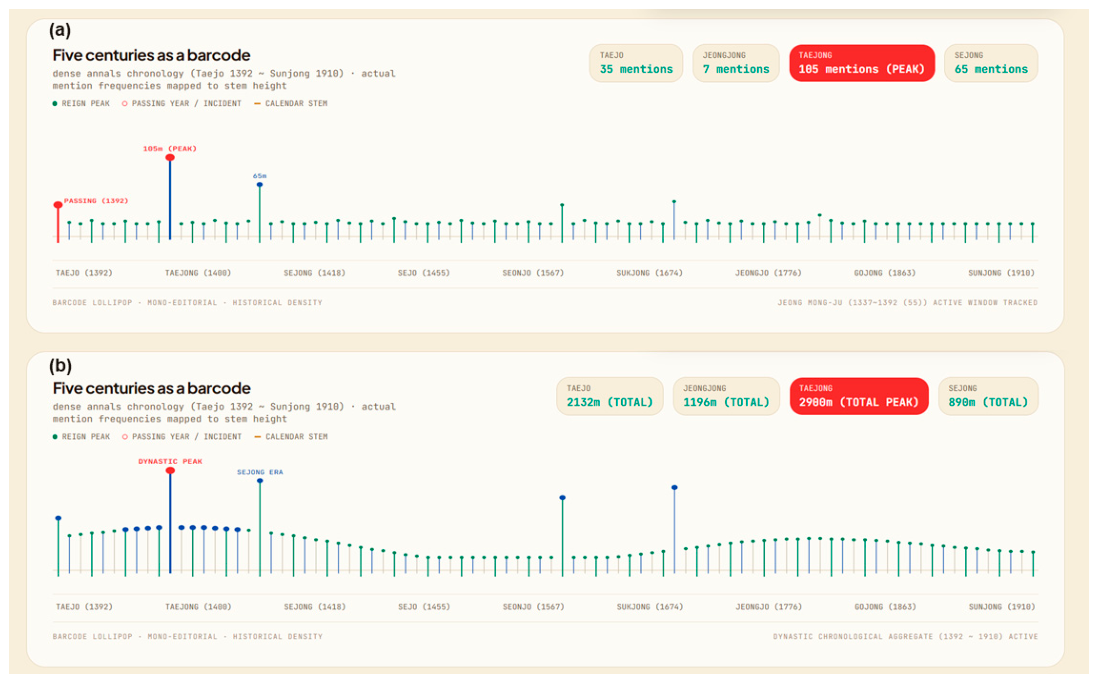
Figure 6.
Quantitative validation of historical character archetypes using the six-dimensional Metric Rose (Vc). (a) Quadrant I: Jeong Do-jeon. (b) Quadrant II: Jeong Mong-ju. (c) Quadrant III: Sin Suk-ju. (d) Quadrant IV: Min Mu-gu.
Figure 6.
Quantitative validation of historical character archetypes using the six-dimensional Metric Rose (Vc). (a) Quadrant I: Jeong Do-jeon. (b) Quadrant II: Jeong Mong-ju. (c) Quadrant III: Sin Suk-ju. (d) Quadrant IV: Min Mu-gu.
Disclaimer/Publisher’s Note: The statements, opinions and data contained in all publications are solely those of the individual author(s) and contributor(s) and not of MDPI and/or the editor(s). MDPI and/or the editor(s) disclaim responsibility for any injury to people or property resulting from any ideas, methods, instructions or products referred to in the content. |
© 2026 by the authors. Licensee MDPI, Basel, Switzerland. This article is an open access article distributed under the terms and conditions of the Creative Commons Attribution (CC BY) license (http://creativecommons.org/licenses/by/4.0/).
Copyright: This open access article is published under a Creative Commons CC BY 4.0 license, which permit the free download, distribution, and reuse, provided that the author and preprint are cited in any reuse.