

Submitted:
11 October 2026
Posted:
13 October 2026
You are already at the latest version
Abstract
Lower family socioeconomic status (SES) is widely linked to poorer child development, but the magnitude of the association varies across outcomes and samples. To synthesise correlational evidence on SES and externalizing/antisocial behaviour, internalizing/depressive symptoms, and language/literacy in children and adolescents. Multiple databases including Scopus, Web of Science and PubMed/MEDLINE were searched. Reports were screened against a pre-specified protocol (age ≤ 10 years; income/SES exposure; positive developmental outcomes), and effects were extracted as SES–outcome correlations (Fisher z). A post-hoc synthesis of the reported outcomes was undertaken with random-effects models, subgroup analysis by outcome domain, meta-regression, sensitivity analysis and funnel-plot/Egger tests using Stata version 17. 12 studies were included. Eight studies examined relations with externalizing outcomes (r = 0.04, 95% CI: 0.11, 0.03), and 6 studies examined relations with internalizing outcomes (r = 0.04, 95% CI: 0.12, 0.05). Language/literacy outcomes showed positive relations to SES (r = 0.24-0.46; exploratory pooled r = 0.38, 95% CI: 0.26, 0.49), with outcome domain accounting for significant between-subgroup heterogeneity. Mainly adolescents, family SES was weakly and inconsistently related to externalising and internalising problems, and prediction intervals were large. Language/literacy had a more robust positive SES gradient but only two small independent samples.
Keywords:
socioeconomic status
; family income
; child development
; externalizing behaviour
; internalizing behaviour
; language
; meta-analysis
1. Introduction
Family socioeconomic resources shape children's developmental contexts through material investment, parental stress, parenting practices, and neighbourhood conditions [1,2,3]. A prior meta-analysis of composite SES measures reported very small to small associations with aggression, internalizing behaviour and language/literacy, and concluded that family- and community-level processes may explain more variance than SES itself [4]. Primary studies since then have emphasised mediators and moderators, including parenting, temperament, community poverty and acculturation [5,6,7,8].
The way in which SES impacts development can be roughly described in one of two ways. The first (investment) account rests on the fact that families with higher income and education can invest in child learning: child-relevant experiences, learning materials, nutrition, health care, and more stable homes. The second (stress) and (parenting) account rests on the fact that economic hardship creates more parental stress and conflict, and that this stress and conflict can cascade to affect warm, consistent, sensitive parenting and child adjustment (e.g., [2,3]). Whether the dominant pathway is one or the other may vary across outcomes: investment resources are most directly relevant to learning and cognition, parenting processes to emotional and behavioural adjustment. Either way, SES refers to a distal index that is not determinative of outcomes, and this may partly explain why the relation is moderate.
The measurement of SES introduces yet another layer of variability. Income, education, and occupation are related but in different ways (families with similar income can differ in education and occupation, and vice versa). SES composites integrate various resources in different combinations [2]; for example, income may have a more direct influence through material resources than parent education does through information and behavior. Combining composites and other measures of risk then may produce estimates with a nuanced mix of correlations.
The developmental period is also likely to be important. Early childhood is a period of rapid development in language, social skills and regulation, with family life being the dominant influence on children (and to a lesser extent adolescents), while over adolescence other influences such as peers, school and neighbourhoods may be more influential. Therefore, associations between SES and child and adolescent developmental outcomes may well be different at early childhood and adolescent stages. Moreover, review studies often conflate large age ranges and have at best focused on negative aspects of psychosocial and socio-emotional development (such as problems or deficits), despite such competence and well-being valid and important domains in their own right.
Evidence on positive developmental trajectories, such as socio-emotional competence and psychological well-being in early childhood, is comparatively scarce, and most SES research has focused on problem behaviours [9]. The present study therefore had two aims: first, to evaluate whether the twelve primary studies identified through a systematic database search could inform a review of family income and positive early-childhood development; and second, because the corpus could not, to quantify what it does show about SES and the outcomes actually measured.
In this regard, the purpose of this review was to determine the magnitude and direction of the association between SES and children's development and whether this association varied according to outcome domain and age.
The models' intended scope was delineated by four protocol criteria: Population: children 0-10 years; Exposure: family income or an SES composite (parent education, occupation, income, or the alternative combinations); Outcomes: positive developmental outcomes, measured as socio-emotional competence or psychological well-being; Design: the primary quantitative observational or experimental studies eligible.
Hypotheses were generated in the expected direction of the extant literature [2,3,4]. For the protocol specified question, we hypothesised higher family income or SES would be related to higher socioemotional competence and psychological well-being; as below this could not be tested. For the post-hoc synthesis, we hypothesised (H1) higher SES was related to fewer externalising/antisocial problems (pooled r < 0); (H2) higher SES was related to fewer internalising/depressive symptoms (pooled r < 0); (H3) higher SES was related to better language/literacy outcomes (pooled r > 0); (H4) that the direction and magnitude of the association would differ by outcome domain; and (H5) that between-study heterogeneity would be partially attributable to child age and publication year. Small effects were expected based on the recent meta-analytic review [4]. Since the chosen outcome families are adopted after the protocol outcome was untestable, and this review was not registered, these hypotheses are considered exploratory.
2. Materials and Methods
2.1. Search Strategy
Three databases were searched: Scopus (TITLE-ABS-KEY), Web of Science (Topic) and PubMed/MEDLINE (MeSH and title/abstract terms). Each search combined four concept blocks: 1) socioeconomic status, poverty or family income; 2) child, adolescent or youth; 3) outcome terms (externalizing, internalizing, antisocial behaviour, aggression, depression, anxiety, language, literacy); and 4) early-childhood terms (early childhood, preschool, kindergarten, young children, toddler, infant). The Scopus and Web of Science searches were limited to journal articles in English; the PubMed/MEDLINE search was limited to English-language human studies indexed in MEDLINE with free full text, published 2000–2026. The searches returned 7,662 (Scopus), 7,009 (Web of Science) and 2,946 (PubMed/MEDLINE) records, 17,617 in total. The full syntax is given in Supplementary Table 2. The outcome block covered problem behaviours and language/literacy; it contained no terms for positive developmental outcomes such as socio-emotional competence or well-being.
2.2. Eligibility Criteria
The pre-specified protocol required (a) children aged 0–10 years, (b) family income or composite SES as the exposure, (c) a positive developmental outcome (socio-emotional competence or psychological well-being), and (d) primary quantitative observational or experimental data. Reports were screened independently against these criteria by one reviewer (a second independent reviewer is required before submission). Records were de-duplicated and screened by title and abstract, and the full texts of potentially eligible reports were retrieved and assessed, with reasons for exclusion recorded. Because no report satisfied criterion (c), reports were retained for a post-hoc synthesis of three outcome families: externalizing/antisocial behaviour, internalizing/depressive symptoms, and language/literacy. This deviation from protocol is a principal limitation.
2.3. Data Extraction
For each report we extracted design, country, sample size, age, SES measure, outcome measure and informant, and the SES–outcome statistic with its source table. Minus signs and values were verified against page images. Effects were expressed as Pearson r with the sign defined so that positive values indicate that higher SES accompanies higher scores. Poverty and risk scores [6,11] were sign-reversed. Where only group means were available, Cohen's d was converted to r [12]; for ordinal consumption groups, r was derived from group means, standard deviations and sizes [13]. Where multiple SES indicators or outcomes within a family were reported, the study-level effect was the mean Fisher z. Subgroup correlations (girls/boys [8]) were combined by inverse-variance weighting. Korat and Haglili [14] reproduces demographic data identical to Korat et al. [12] and was treated as an overlapping sample. It is displayed in the forest plots and contributes to the overall, language/literacy, meta-regression and funnel-plot estimates, which should therefore be read as exploratory; it did not contribute to the externalizing or internalizing analyses.
2.4. Risk of Bias
All included reports were observational (cross-sectional or prospective cohort); Cochrane RoB 2 applies to randomised trials and was therefore not applicable. Quality was rated with the Newcastle–Ottawa Scale adapted for cross-sectional studies (maximum 10 points: selection 0–5, comparability 0–2, outcome 0–3). Comparability was scored 0 throughout because bivariate correlations were extracted. Ratings are provisional (single rater) and require independent duplicate rating.
2.5. Statistical Analysis and Software
Correlations were Fisher z-transformed (variance 1/(n − 3)) and pooled with random-effects models using restricted maximum likelihood (REML) for τ². Confidence intervals were additionally computed using the Hartung–Knapp–Sidik–Jonkman adjustment [15]. Heterogeneity was summarised by Q, I² and τ² [16], with 95% prediction intervals. Robustness was examined by leave-one-out analysis and by omitting studies with uncertain effect direction [17] or a mixed SES composite [11]. Pooling was performed overall across all effect estimates and by outcome domain (externalizing, internalizing, language/literacy), with a between-subgroup test of heterogeneity (Qb). Mixed-effects meta-regression (REML) examined publication year and mean/midpoint age as moderators. Small-study effects were examined with a funnel plot of all effect estimates and Egger's regression test [18], interpreted cautiously because the domain-specific analyses include fewer than ten estimates and the domains differ in effect direction. Stata version 17 was used for all analyses and meta-analytic figures.
3. Results
3.1. Study Evaluation and Characteristics
The database searches identified 17,617 records (Scopus 7,662; Web of Science 7,009; PubMed/MEDLINE 2,946). After removal of 11,583 duplicates, 6,034 records were screened by title and abstract and 5,791 were excluded. Of 243 reports sought for retrieval, 189 could not be retrieved and 54 were assessed for eligibility; reasons for exclusion are given in Figure 1. Twelve primary reports were included (Figure 1). Five reports had samples with mean age ≤ 10 years, but none measured positive developmental outcomes; seven concerned mainly adolescent or mixed 6–18-year samples. Nine reports contributed to the externalizing and/or internalizing analyses, and three reports (two independent samples) to the language/literacy outcomes. Table 1 gives study characteristics and extracted effects.
3.2. Risk of Bias
3.3. Overall Association and Differences Between Outcome Domains
Across all 17 effect estimates from the 12 reports (Figure 2), the random-effects pooled correlation was r = 0.01 (95% CI [−0.06, 0.09]; z = 0.32, p = 0.75), with very high heterogeneity (Q(16) = 109.69, p < .001, I² = 91.35%, H² = 11.57, τ² = 0.02). This overall estimate is descriptive only: it combines problem-behaviour outcomes, for which a negative correlation indicates a benefit of higher SES, with language/literacy outcomes, for which a positive correlation indicates a benefit and it includes the overlapping Korat and Haglili [14] sample. Outcome domain accounted for a significant share of the heterogeneity (test of group differences Qb(2) = 35.20, p < 0.001; Figure 3), with the language/literacy subgroup clearly separated from the externalizing and internalizing subgroups.
3.4. SES and Externalizing/Antisocial Outcomes
Across eight studies (N = 6,245), the pooled correlation was r = −0.04 (95% CI [−0.11, 0.03], p = 0.22; HKSJ 95% CI [−0.12, 0.04]) indicating no statistically reliable association (Figure 3, EXT panel). Heterogeneity was substantial (Q = 42.8, df = 7, p < .001, I² = 84%, τ² = 0.0073); the 95% prediction interval [−0.26, 0.18] spans zero. Domain-specific leave-one-out estimates ranged from −0.06 to −0.02 (not plotted). Omitting Appleyard et al. [17], whose SES index direction is uncertain, gave r = −0.06 (95% CI [−0.12, 0.01]). Egger's test was non-significant (p = 0.17).
3.5. SES and Internalizing/Depressive Outcomes
Across six studies (N = 2,284), the pooled correlation was r = −0.04 (95% CI [−0.12, 0.05], p = 0.39; HKSJ 95% CI [−0.15, 0.08]) with moderate-to-substantial heterogeneity (Q = 16.9, df = 5, p = 0.005, I² =73%, τ² = 0.0076; Figure 3). The prediction interval was [−0.30, 0.23]. Omitting Dallaire et al. [11], whose risk composite includes sex and ethnicity, gave r = −0.00 (95% CI [−0.06, 0.06]). Egger's p = 0.16.
3.6. SES and Language/Literacy Outcomes
Two independent samples reported language or literacy outcomes: Korat et al. [12] (r = 0.36, d = 0.78) and Noble et al. [21] (PPVT r = 0.24; Word Attack r = 0.06; N = 38). Figure 4 also displays Korat and Haglili [14] (r = 0.46), which overlaps with Korat et al. [12]. The random-effects pooled correlation across the three displayed estimates was r = 0.38 (95% CI [0.26, 0.49]; z = 5.79, p < .001), with no heterogeneity (Q(2) = 1.56, p = 0.46, I² = 0%, τ² = 0.00). Because this estimate counts one sample twice and only two samples are independent, it is exploratory and likely overstates precision. Direction was consistently positive, in line with an SES gradient in language, but individual estimates were imprecise (for example, Noble et al. [21]: 95% CI [−0.09, 0.52]).
3.7. Small-Study Effects
The funnel plot of all 17 effect estimates (Figure 5) was not symmetric. Externalizing and internalizing estimates clustered around the pooled value (REML estimate ≈ 0.01 in Fisher's z), whereas the three language/literacy estimates (z ≈ 0.25–0.49), all with larger standard errors (> 0.10), lay to the right and outside the pseudo-95% confidence limits. This pattern is more plausibly explained by differences between outcome domains (Figure 3) than by selective publication, because the plot pools outcomes with different expected directions. Domain-specific Egger tests were non-significant; Egger's test result for all 17 estimates: insert from Stata. With few estimates per domain these checks are underpowered, and trim-and-fill was not performed.
3.8. Meta-Regression
Meta-regression of effect size on publication year (mean-centred; Figure 6) produced an almost flat fitted line, and the 95% confidence band was compatible with no trend across the 2001–2008 publications insert coefficient, 95% CI and p from Stata. Meta-regression on mean/midpoint age (mean-centred; Figure 7) showed a downward slope: effect estimates were most positive in the youngest samples (fitted Fisher's z ≈ 0.14 at about 6 years) and became negative in the oldest (fitted z ≈ −0.08 at about 16 years), with a confidence band that excluded zero only at the youngest end insert coefficient, 95% CI, p and R² from Stata. This age gradient is confounded with outcome domain, because the youngest samples are those that measured language/literacy and showed positive correlations, whereas older samples measured problem behaviours; with 17 estimates it cannot be interpreted as an independent age effect.
3.9. Sensitivity Analysis
Leave-one-out analysis of the overall model (Figure 8) gave pooled correlations between −0.02 and 0.03, with every 95% confidence interval including zero (p = 0.51 to 0.90). Omitting either Korat study turned the pooled estimate slightly negative (Korat and Haglili [14]: r = −0.02, 95% CI [−0.08, 0.05]; Korat, Klein and Segal-Drori [12]: r = −0.01, 95% CI [−0.08, 0.06]), whereas omitting Dallaire et al. [11] gave the largest positive estimate (r = 0.03, 95% CI [−0.05, 0.10]). No single study therefore changed the substantive conclusion, although the overall estimate depends on the positive language/literacy correlations offsetting the negative problem-behaviour correlations.
4. Discussion
In this corpus, composite SES showed small and statistically non-significant pooled associations with externalizing and internalizing outcomes, with considerable between-study heterogeneity. The direction of the point estimates (higher SES, fewer problems) is consistent with the broader literature, but the wide prediction intervals mean that a true association of either sign cannot be excluded for a new setting. These results are compatible with the conclusion that SES operates through family-, parenting- and community-level mechanisms rather than as a strong direct correlate [4,5,6,8]. Moderation findings in the primary studies, for example by temperament, gender, community poverty and age, further argue against a single uniform effect.
The pooled estimates here are smaller than the Hedges' g values reported by Letourneau et al. [4], which is expected given a different study set, different effect-size extraction (bivariate correlations versus converted group contrasts), and exclusion of studies that did not report an SES–outcome statistic. They should not be read as contradicting that review.
The language/literacy results are consistent with an SES gradient in early literacy, and the test of group differences shows that SES associations differ markedly by outcome domain. However, this estimate rests on two small independent samples, one of which is counted twice, and the near-zero overall correlation across domains largely reflects opposite-signed domain effects and should not be read as an absence of association. The age meta-regression suggests more positive correlations in younger samples, but this is confounded with outcome domain and cannot be separated from it with the present data; the flat publication-year trend gives no indication that associations changed across 2001–2008. The funnel plot was asymmetric, mainly because of the small language/literacy studies; this may reflect true domain differences or small-study effects, which cannot be distinguished with so few estimates.
The results for language/literacy require caution not only because the number of samples was small. The two independent samples used different approaches: Korat et al. [12] used a comparison of groups of low and high SES to produce an extreme group difference in mean, and the standardised mean difference may not be equivalent to r and likely to be over-estimated; the step from this to r over the SES range, in contrast, is likely to be larger; Noble et al. [21] used several SES indicators; in a very small sample (N = 38). Within Noble et al. [21], the r for vocabulary (PPVT r = 0.24) was over twice that for decoding (Word Attack r = 0.06), consistent with SES being more strongly related to oral language skills than to decoding, although again only suggestive because of the single small sample. Both Korat samples focused on maternal talk to children in book reading and the home environment - plausible proximal pathways of SES influences - but these are not tested as mediators here.
4.1. Implications for Future Research
We should pre-register a review protocol prior to searching (e.g. PROSPERO, Open Science Framework), screen and extract data in duplicate, include outcome terms for the positive development (e.g. Socio-emotional competence, social skills, self-regulation and well-being), implement the 0-10-year age restriction in the search itself [22] and obtain full-text articles through library access or interlibrary loan rather than limiting to free-full text records. When the number of studies permits, meta-analyses could disaggregate family income from education and occupation indicators, extract adjusted and unadjusted estimates, and model effect sizes within meta-analyses, within families, within studies (e.g. Multilevel models, robust variance estimation), rather than average effects across a set of outcomes. Primary studies would be more informative if authors provided statistics for continuous indicators of SES and outcome measures, and adopted longitudinal designs that track children from early ages. Since pooled associations were modest and prediction intervals largely included no association, these findings can hardly be accepted as evidence that family income or parental education has little influence on development, and certainly should not be used for policy. The main contribution of this review is its descriptive and methodological focus: highlighting evidence deficits, noting protocol deviations, and demonstrating how unstable and imprecise pooled estimates are, due to a small, diverse sample of studies.
4.2. Limitations
First, and most importantly, none of the twelve studies measured positive developmental outcomes, and most samples were adolescent; the corpus cannot answer questions about family income and positive developmental trajectories in early childhood. Second, the synthesis is post-hoc and not registered. Although studies were identified through searches of three databases, the search strategy contained no terms for positive developmental outcomes and included adolescent and youth terms despite the 0–10-year age criterion; only 12 of 6,034 screened records were included, 189 of 243 reports sought could not be retrieved, and the PubMed/MEDLINE search was restricted to free full-text MEDLINE records from 2000 onwards, so selection bias is likely. Third, extracted effects are bivariate and unadjusted, and several SES composites mix income, education, occupation and non-SES indicators. Fourth, effect direction for one SES index could not be confirmed, a risk composite included sex and ethnicity, and two effects were derived from grouped data, and one overlapping sample [14] is included in the overall, language/literacy, meta-regression and funnel-plot estimates. Fifth, all studies were cross-sectional or short-term observational, precluding causal inference. Sixth, quality ratings were single-rater and provisional. Seventh, k was small, limiting heterogeneity, meta-regression and publication-bias assessment; the funnel plot was asymmetric, the overall estimate pools outcomes with opposite benefit directions, and age and outcome domain are confounded in the meta-regression.
5. Conclusions
SES was weakly and inconsistently associated with externalizing and internalizing outcomes in this set of studies, and positively associated with language/literacy in two small independent samples. A registered systematic review with dual screening, a search strategy that includes terms for positive outcomes (socio-emotional competence, well-being), and a sample restricted to children aged 0–10 years is needed to evaluate family income and positive developmental trajectories.
Supplementary Materials
The following supporting information can be downloaded at the website of this paper posted on Preprints.org, Table S1: PRISMA 2020 checklist; Table S2: Full database search syntax.
Author Contributions
Conceptualization, K.D., Z.N. and I.A.; methodology, K.D. and I.A.; search strategy and database searching, K.D. and I.A.; screening and study selection, K.D. and I.A.; data extraction, K.D. and I.A.; formal analysis, I.A.; visualization, I.A.; project administration, I.A.; writing—original draft preparation, K.D. and I.A.; writing—review and editing, K.D., Z.N. and I.A.; supervision, I.A. All authors have read and agreed to the published version of the manuscript.
Funding
This research received no external funding.
Institutional Review Board Statement
Not applicable.
Informed Consent Statement
Not applicable.
Data Availability Statement
Conflicts of Interest
The authors declare no conflicts of interest.
Abbreviations
The following abbreviations are used in this manuscript:
| CBCL | Child Behavior Checklist |
| CI | Confidence interval |
| EXT | Externalizing |
| HKSJ | Hartung–Knapp–Sidik–Jonkman |
| INT | Internalizing |
| LANG | Language/literacy |
| NOS | Newcastle–Ottawa Scale |
| PPVT | Peabody Picture Vocabulary Test |
| PRISMA | Preferred Reporting Items for Systematic Reviews and Meta-Analyses |
| REML | Restricted maximum likelihood |
| SES | Socioeconomic status |
References
- Diamanti, K.; Eslahi, A.V.; Adamopoulos, I. Family Environment and Early Childhood Education as Predictors of Learning Outcomes from Birth to Age 5: A Systematic Review and Meta-Analysis. Res. Sq. 2026, preprint (version 1). [Google Scholar] [CrossRef]
- Bradley, R.H.; Corwyn, R.F. Socioeconomic Status and Child Development. Annu. Rev. Psychol. 2002, 53, 371–399. [Google Scholar] [CrossRef]
- McLoyd, V.C. Socioeconomic Disadvantage and Child Development. Am. Psychol. 1998, 53, 185–204. [Google Scholar] [CrossRef]
- Letourneau, N.L.; Duffett-Leger, L.; Levac, L.; Watson, B.; Young-Morris, C. Socioeconomic Status and Child Development: A Meta-Analysis. J. Emot. Behav. Disord. 2013, 21, 211–224. [Google Scholar] [CrossRef]
- Dekovic, M.; Janssens, J.M.A.M.; Van As, N.M.C. Family Predictors of Antisocial Behavior in Adolescence. Fam. Process 2003, 42, 223–235. [Google Scholar] [CrossRef]
- Hay, C.; Fortson, E.N.; Hollist, D.R.; Altheimer, I.; Schaible, L.M. Compounded Risk: The Implications for Delinquency of Coming from a Poor Family That Lives in a Poor Community. J. Youth Adolesc. 2007, 36, 593–605. [Google Scholar] [CrossRef]
- Stevens, G.W.J.M.; Vollebergh, W.A.M.; Pels, T.V.M.; Crijnen, A.A.M. Parenting and Internalizing and Externalizing Problems in Moroccan Immigrant Youth in the Netherlands. J. Youth Adolesc. 2007, 36, 685–695. [Google Scholar] [CrossRef]
- Veenstra, R.; Lindenberg, S.; Oldehinkel, A.J.; De Winter, A.F.; Ormel, J. Temperament, Environment, and Antisocial Behavior in a Population Sample of Preadolescent Boys and Girls. Int. J. Behav. Dev. 2006, 30, 422–432. [Google Scholar] [CrossRef]
- Thapa, P.; Wimalaratana, W.; Adamopoulos, I. The Evolving Role of Technology in Supporting SEL (Social-Emotional Learning). In Teacher Strategies for Addressing Social-Emotional Needs of P-12 Students; IGI Global Scientific Publishing: Hershey, PA, USA, 2026; pp. 281–310. [Google Scholar] [CrossRef]
- Page, M.J.; McKenzie, J.E.; Bossuyt, P.M.; Boutron, I.; Hoffmann, T.C.; Mulrow, C.D.; Shamseer, L.; Tetzlaff, J.M.; Akl, E.A.; Brennan, S.E.; Chou, R.; Glanville, J.; Grimshaw, J.M.; Hróbjartsson, A.; Lalu, M.M.; Li, T.; Loder, E.W.; Mayo-Wilson, E.; McDonald, S.; et al. The PRISMA 2020 Statement: An Updated Guideline for Reporting Systematic Reviews. BMJ 2021, 372, n71. [Google Scholar] [CrossRef]
- Dallaire, D.H.; Cole, D.A.; Smith, T.M.; Ciesla, J.A.; LaGrange, B.; Jacquez, F.M.; Pineda, A.Q.; Truss, A.E.; Folmer, A.S. Predicting Children's Depressive Symptoms from Community and Individual Risk Factors. J. Youth Adolesc. 2008, 37, 830–846. [Google Scholar] [CrossRef]
- Korat, O.; Klein, P.; Segal-Drori, O. Maternal Mediation in Book Reading, Home Literacy Environment, and Children's Emergent Literacy: A Comparison between Two Social Groups. Read. Writ. 2007, 20, 361–398. [Google Scholar] [CrossRef]
- Barbarin, O.A.; Richter, L. Economic Status, Community Danger and Psychological Problems among South African Children. Childhood 2001, 8, 115–133. [Google Scholar] [CrossRef]
- Korat, O.; Haglili, S. Maternal Evaluations of Children's Emergent Literacy Level, Maternal Mediation in Book Reading, and Children's Emergent Literacy Level: A Comparison between SES Groups. J. Lit. Res. 2007, 39, 249–276. [Google Scholar] [CrossRef]
- IntHout, J.; Ioannidis, J.P.A.; Borm, G.F. The Hartung-Knapp-Sidik-Jonkman Method for Random Effects Meta-Analysis Is Straightforward and Considerably Outperforms the Standard DerSimonian-Laird Method. BMC Med. Res. Methodol. 2014, 14, 25. [Google Scholar] [CrossRef]
- Higgins, J.P.T.; Thompson, S.G. Quantifying Heterogeneity in a Meta-Analysis. Stat. Med. 2002, 21, 1539–1558. [Google Scholar] [CrossRef]
- Appleyard, K.; Egeland, B.; van Dulmen, M.H.M.; Sroufe, L.A. When More Is Not Better: The Role of Cumulative Risk in Child Behavior Outcomes. J. Child Psychol. Psychiatry 2005, 46, 235–245. [Google Scholar] [CrossRef]
- Egger, M.; Davey Smith, G.; Schneider, M.; Minder, C. Bias in Meta-Analysis Detected by a Simple, Graphical Test. BMJ 1997, 315, 629–634. [Google Scholar] [CrossRef]
- Guerrero, A.P.S.; Hishinuma, E.S.; Andrade, N.N.; Nishimura, S.T.; Cunanan, V.L. Correlations among Socioeconomic and Family Factors and Academic, Behavioral, and Emotional Difficulties in Filipino Adolescents in Hawaii. Int. J. Soc. Psychiatry 2006, 52, 343–359. [Google Scholar] [CrossRef]
- Wadsworth, M.E.; Compas, B.E. Coping with Family Conflict and Economic Strain: The Adolescent Perspective. J. Res. Adolesc. 2002, 12, 243–274. [Google Scholar] [CrossRef]
- Noble, K.G.; Wolmetz, M.E.; Ochs, L.G.; Farah, M.J.; McCandliss, B.D. Brain–Behavior Relationships in Reading Acquisition Are Modulated by Socioeconomic Factors. Dev. Sci. 2006, 9, 642–654. [Google Scholar] [CrossRef]
- Diamanti, K.; Eslahi, A.V.; Adamopoulos, I. A Sociological Study of Digital Technology Application in Early Childhood (0–5 Years Old): A Systematic Review and Meta-Analysis Study. Preprints 2026, version 1, 2026070488. [Google Scholar] [CrossRef]
Figure 1.
PRISMA flow diagram of the study selection process for the systematic review and meta-analysis.
Figure 1.
PRISMA flow diagram of the study selection process for the systematic review and meta-analysis.
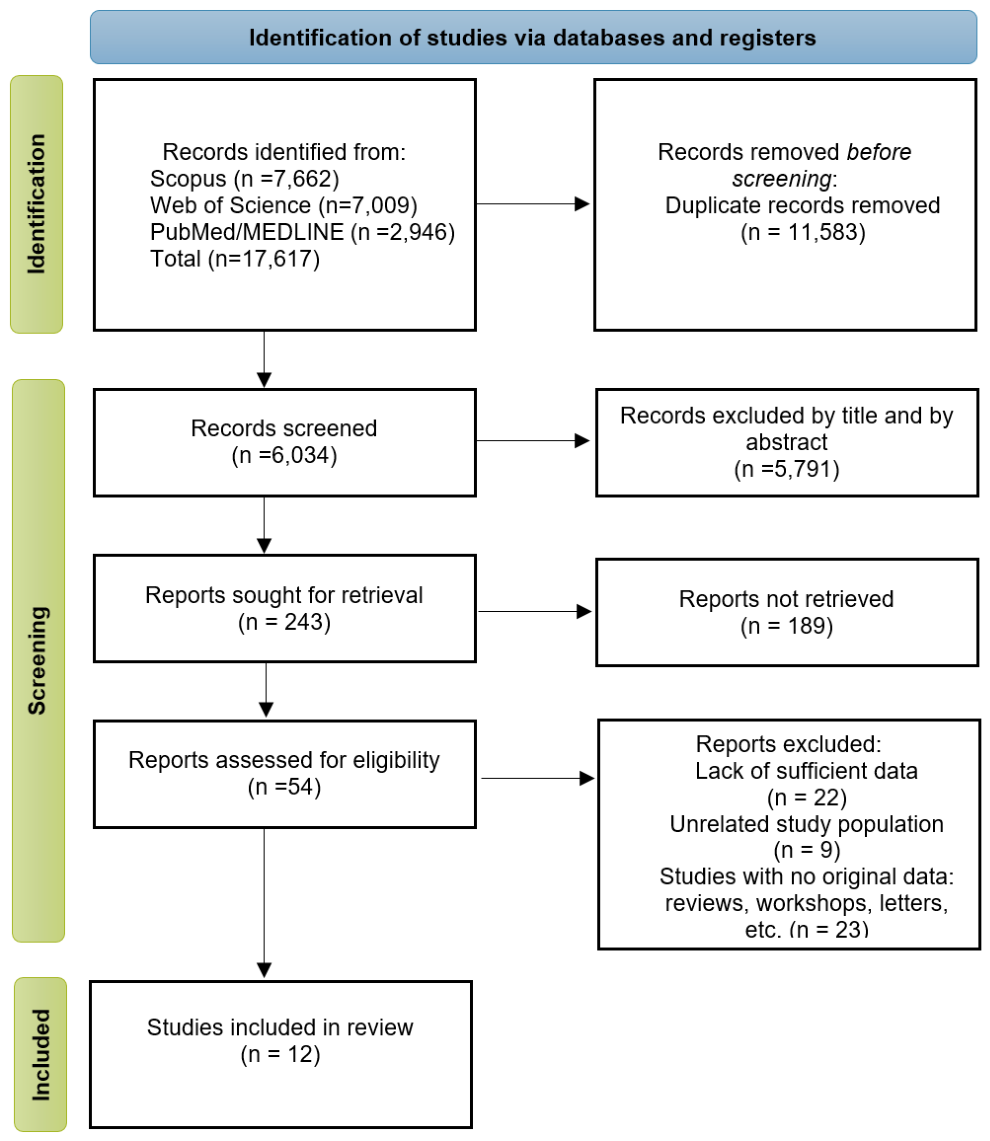
Figure 2.
Overall forest plot of SES–outcome correlations (back-transformed from Fisher z) across all 17 effect estimates from 12 reports. Suffixes a and b denote the externalizing and internalizing estimates of the same study. Negative values for problem behaviours and positive values for language/literacy indicate a benefit of higher SES.
Figure 2.
Overall forest plot of SES–outcome correlations (back-transformed from Fisher z) across all 17 effect estimates from 12 reports. Suffixes a and b denote the externalizing and internalizing estimates of the same study. Negative values for problem behaviours and positive values for language/literacy indicate a benefit of higher SES.
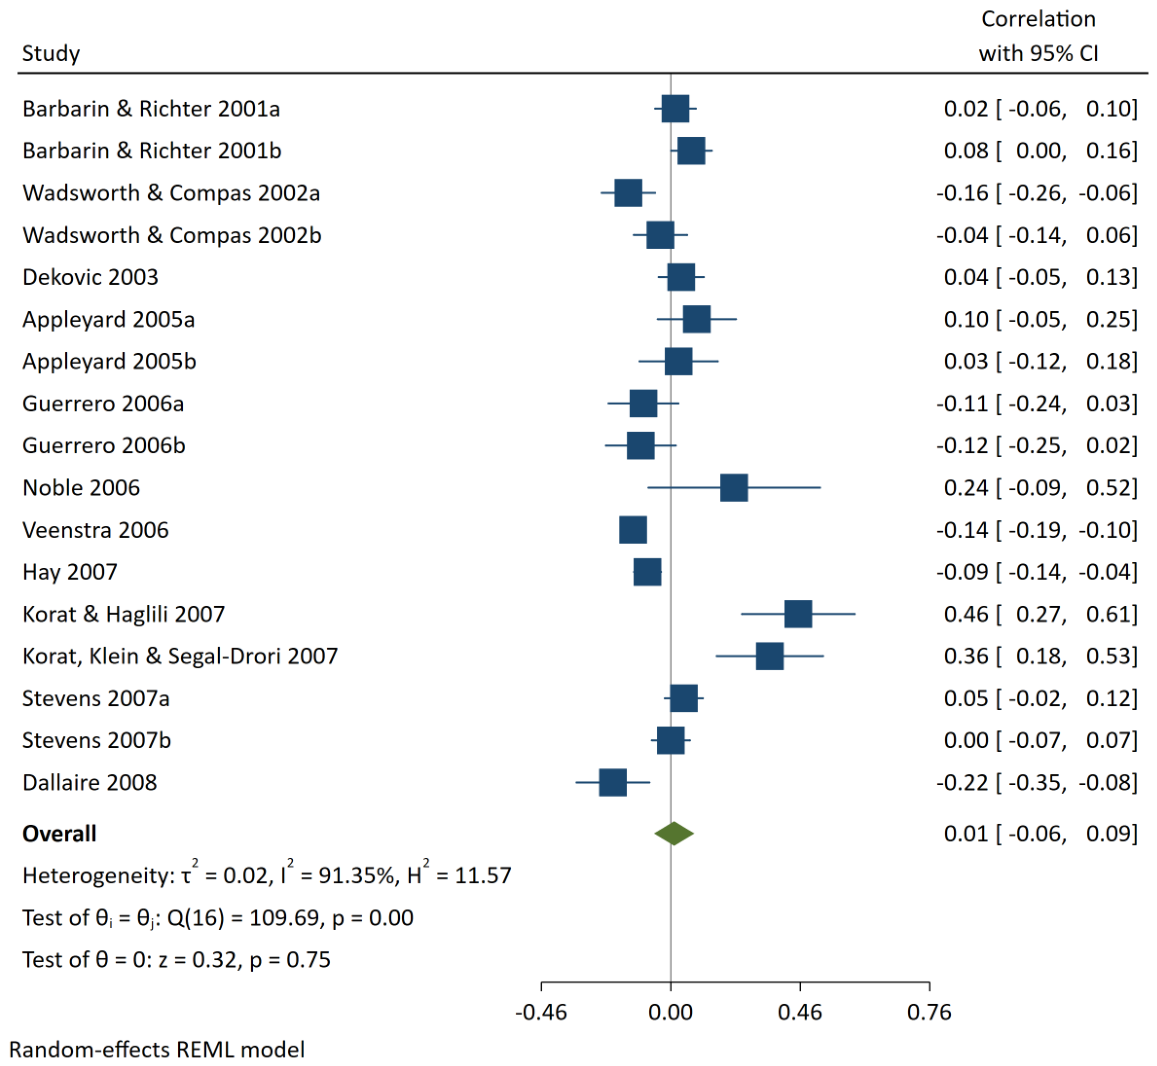
Figure 3.
Forest plot of random-effects subgroup analyses by outcome domain (EXT = externalizing; INT = internalizing; LANG = language/literacy), with the overall estimate and test of group differences. Suffixes a and b denote the externalizing and internalizing estimates of the same study.
Figure 3.
Forest plot of random-effects subgroup analyses by outcome domain (EXT = externalizing; INT = internalizing; LANG = language/literacy), with the overall estimate and test of group differences. Suffixes a and b denote the externalizing and internalizing estimates of the same study.
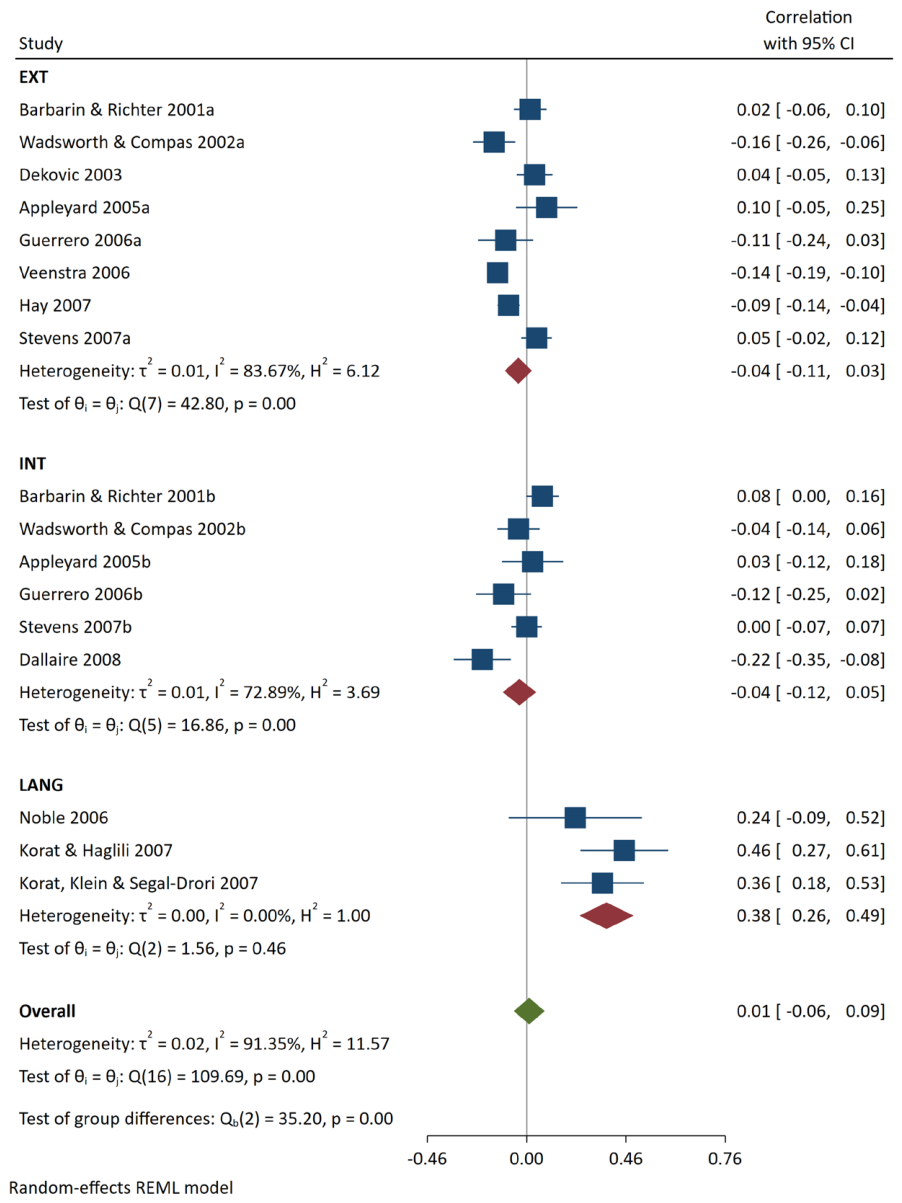
Figure 4.
Forest plot of studies reporting language and literacy-related outcomes.
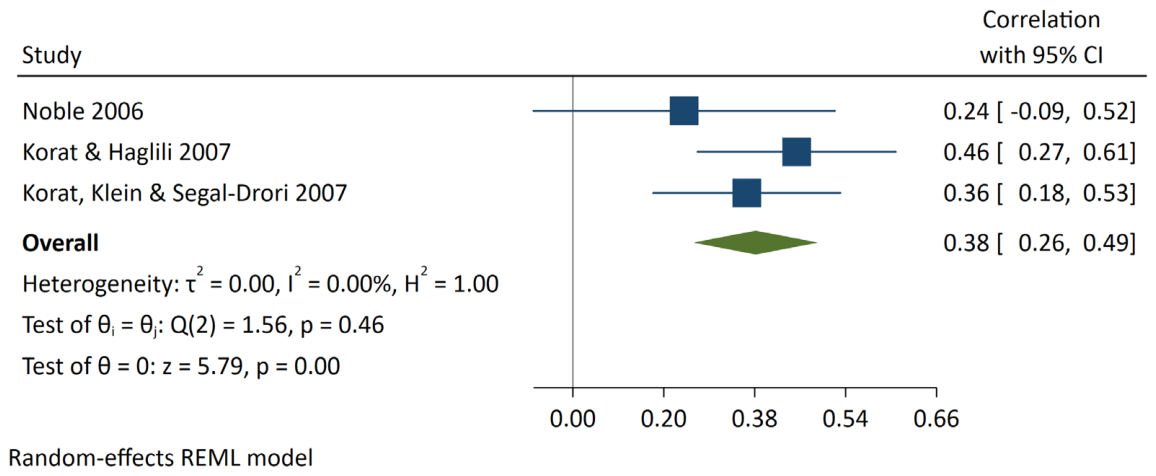
Figure 5.
Funnel plot assessing small-study effects and potential publication bias. Fisher's z is plotted against standard error for all 17 effect estimates; the vertical line is the REML pooled estimate and the diagonal lines are pseudo-95% confidence limits.
Figure 5.
Funnel plot assessing small-study effects and potential publication bias. Fisher's z is plotted against standard error for all 17 effect estimates; the vertical line is the REML pooled estimate and the diagonal lines are pseudo-95% confidence limits.
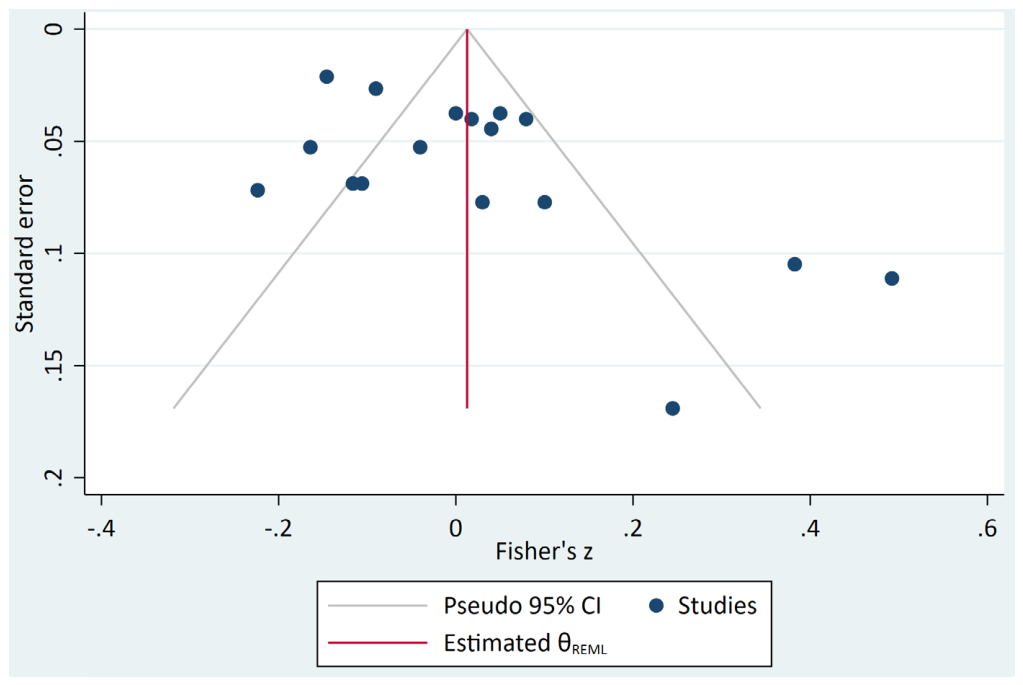
Figure 6.
Meta-regression correlated publication years of the weights, Linear prediction /studies. Meta-regression of effect size (Fisher's z) on publication year (mean-centred), with fitted line and 95% confidence band; marker size reflects random-effects weight.
Figure 6.
Meta-regression correlated publication years of the weights, Linear prediction /studies. Meta-regression of effect size (Fisher's z) on publication year (mean-centred), with fitted line and 95% confidence band; marker size reflects random-effects weight.
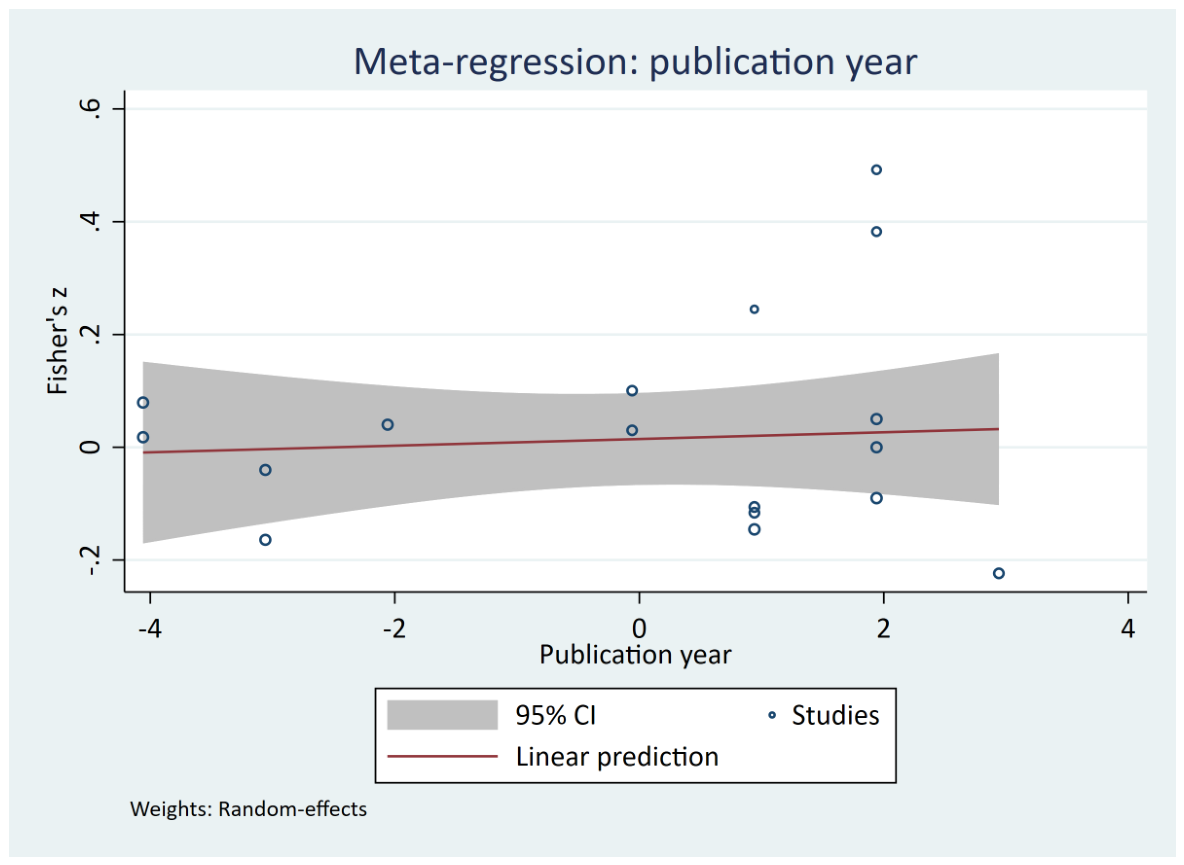
Figure 7.
Meta-regression bubble plot of effect size (Fisher's z) on mean/midpoint age (years, mean-centred), with fitted line and 95% confidence band.
Figure 7.
Meta-regression bubble plot of effect size (Fisher's z) on mean/midpoint age (years, mean-centred), with fitted line and 95% confidence band.
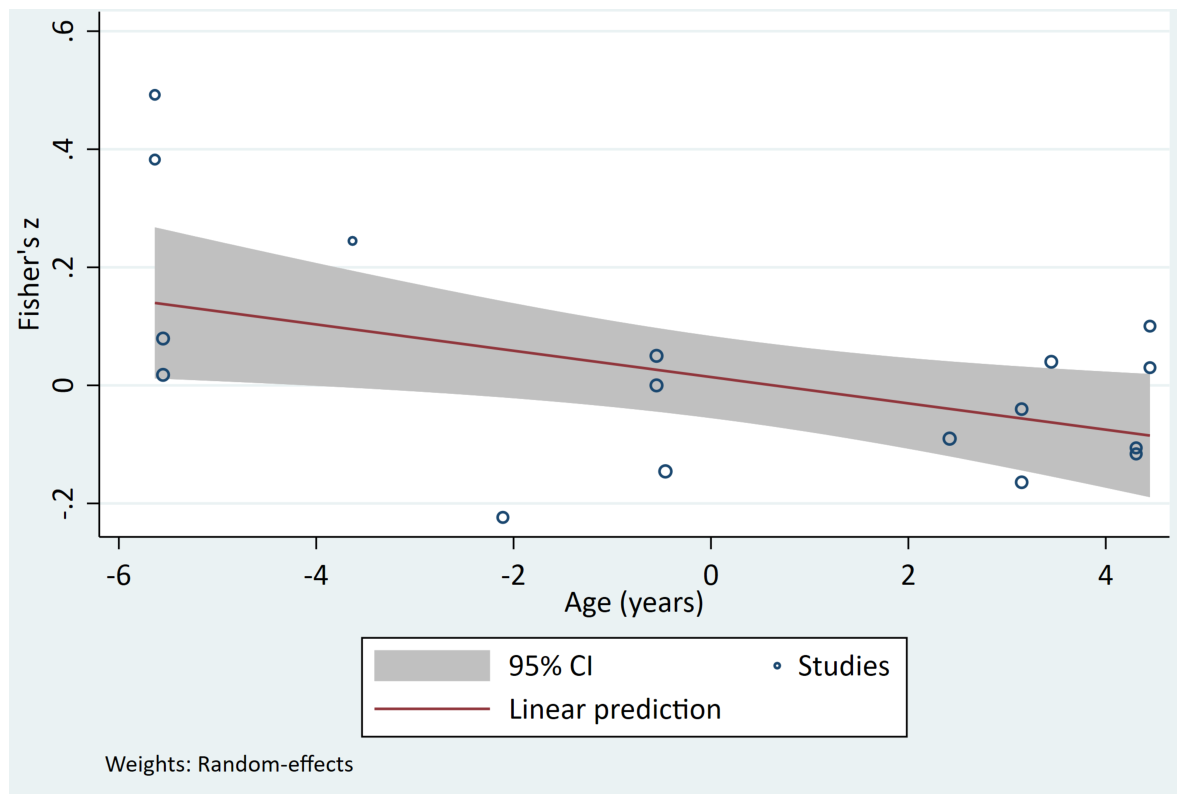
Figure 8.
Forest plot of Leave-one-out sensitivity analysis. Leave-one-out sensitivity analysis of the overall random-effects (REML) model; the vertical line is the full-sample estimate.
Figure 8.
Forest plot of Leave-one-out sensitivity analysis. Leave-one-out sensitivity analysis of the overall random-effects (REML) model; the vertical line is the full-sample estimate.
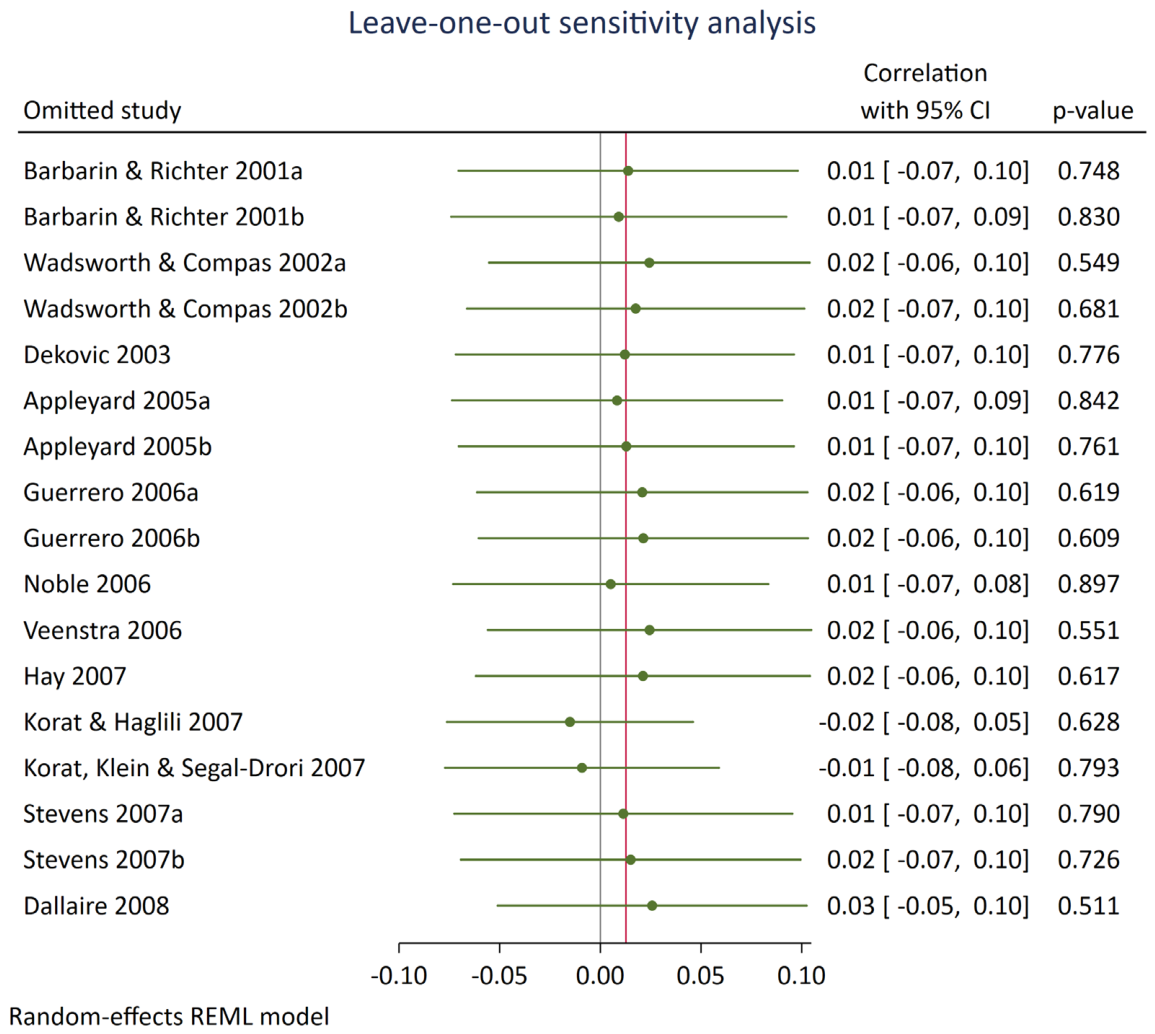

Table 1.
Characteristics of included studies and extracted SES–outcome correlations.
| Study | Country | N | Age (y) | SES measure | Outcome | r (SES-direction) |
|---|---|---|---|---|---|---|
| Dekovic et al. [5] | Netherlands | 508 | 12–18 | Occupation/employment composite | Antisocial behaviour (self-report) | 0.04 |
| Guerrero et al. [19] | USA (Hawai‘i) | 216 | M = 15.9 | Wage-earner education, employment | Aggression; depression; anxiety | −0.11; −0.12 |
| Hay et al. [6] | USA | 1,420 | 12–16 | Income, education, unemployment, welfare composite | Delinquency (self-report) | −0.09 |
| Veenstra et al. [8] | Netherlands | 2,230 | M = 11.1 | Education, occupation, income composite | Antisocial behaviour (parent + child) | −0.14 |
| Wadsworth & Compas [20] | USA | 364 | M = 14.7 | Parental education/occupation; lunch eligibility | Aggression; anxiety/depression | −0.16; −0.04 |
| Appleyard et al. [17] | USA | 171 | Outcome at 16 | Duncan SEI (age 4.5) | Externalizing; internalizing (CBCL, 3 informants) | 0.10; 0.03 |
| Barbarin & Richter [13] | South Africa | 625 | ≈ 6 | SES composite; consumption group | Aggression/opposition; anxiety/depression | 0.02; 0.08 |
| Dallaire et al. [11] | USA | 197 | 7–11 | Demographic risk composite | Depressive symptoms (self-report) | −0.22 |
| Stevens et al. [7] | Netherlands (Moroccan youth) | 713 | 6–18 | Parental education + employment | CBCL externalizing; internalizing | 0.05; 0.00 |
| Korat et al. [12] | Israel | 94 | ≈ 5.9 | Low vs high SES groups | Emergent literacy (composite) | 0.36 (d = 0.78) |
| Noble et al. [21] | USA | 38 | 6.8–9.6 | Education, occupation, income-to-needs | PPVT; Word Attack; brain activation | 0.24; 0.06 |
| Korat & Haglili [14] | Israel | 84 | ≈ 5.9 | Low vs high SES groups | Emergent literacy (overlapping sample) | 0.46 (d = 1.02) |
Note: r = correlation between higher SES and outcome score (negative = higher SES, fewer problems; for literacy, positive = better skills).
Table 2.
Provisional Newcastle–Ottawa Scale scores (0–10).
| Study | NOS total | Study | NOS total |
|---|---|---|---|
| Dekovic et al. [5] | 5 | Barbarin & Richter [13] | 5 |
| Guerrero et al. [19] | 4 | Dallaire et al. [11] | 4 |
| Hay et al. [6] | 6 | Stevens et al. [7] | 5 |
| Veenstra et al. [8] | 7 | Noble et al. [21] | 4 |
| Wadsworth & Compas [20] | 5 | Korat et al. [12] | 3 |
| Appleyard et al. [17] | 5 | Korat & Haglili [14] | 3 |
Disclaimer/Publisher’s Note: The statements, opinions and data contained in all publications are solely those of the individual author(s) and contributor(s) and not of MDPI and/or the editor(s). MDPI and/or the editor(s) disclaim responsibility for any injury to people or property resulting from any ideas, methods, instructions or products referred to in the content. |
© 2026 by the authors. Licensee MDPI, Basel, Switzerland. This article is an open access article distributed under the terms and conditions of the Creative Commons Attribution (CC BY) license.
Copyright: This open access article is published under a Creative Commons CC BY 4.0 license, which permit the free download, distribution, and reuse, provided that the author and preprint are cited in any reuse.