

Submitted:
11 October 2026
Posted:
13 October 2026
You are already at the latest version
Abstract
Governments across the Global South now promote cultural festivals as tourism assets, but few of them measure what those festivals actually do. This article asks whether the official data that already exist in Ghana are adequate for evaluating the tourism role of two festivals in Accra: Homowo, the harvest festival of the Ga people, and the Chale Wote Street Art Festival, which began in 2011. The study draws on 21 official and statistical sources, 84 months of international arrivals, the 2023 national domestic tourism survey, licensed-enterprise registers, and a corpus of 53 media and official texts. Each source is assessed against five criteria: relevance, resolution, consistency, coverage and access. August arrivals run about 10 per cent above an average month, yet they cannot be distinguished statistically from July (p = 0.50). Domestic culture and festival trips cluster in July to September but make up only about 1 per cent of overnight trips. Thirty-two inconsistencies were logged across sources, among them a change in the basis of 2023 receipts that roughly halves the apparent growth between 2023 and 2024. Four gaps, in resolution, coverage, consistency and attribution, rule out any estimate of festival effects. Yet the national tourism authority already surveys December in GH, Kwahu Easter and PANAFEST. The obstacle, then, is not capacity. It is an asymmetry in which the state promotes festivals it does not measure. The article offers a fitness-for-use framework for festival-tourism data in data-scarce destinations and sets out practical steps for closing the gap.
Keywords:
festival tourism
; tourism statistics
; data adequacy
; fitness for use
; secondary data
; Ghana
1. Introduction
Few instruments of urban tourism policy have spread as widely as the festival. Cities stage, fund and advertise festivals to lengthen the season, sharpen their image and bring in visitors, and the academic literature has followed this expansion closely (Getz, 2008; Richards & Palmer, 2010). Whether festivals deliver what is claimed for them is a separate question, and answering it takes data gathered at the scale of the event itself: how many people came, from where, how long they stayed and what they spent. Across much of the Global South, those data are seldom collected. Anyone who wants to evaluate a festival must make do with national statistics that were built for other purposes.
Ghana shows the problem clearly. Since the Year of Return campaign of 2019, tourism has risen up the national development agenda, and international arrivals reached roughly 1.31 million in 2025 (Ghana Tourism Authority [GTA], 2026). Accra, the capital, hosts two well-known festivals every August. Homowo is the harvest festival of the Ga, the city’s original inhabitants. It recalls an ancestral famine and is observed town by town under the authority of traditional councils (Ammah, 1982). The Chale Wote Street Art Festival is a much younger event, launched in 2011 by the independent arts platform ACCRA [dot] ALT in the historic district of Jamestown. National tourism bodies now promote both. In 2025, GTA agreed to partner the Ga Traditional Council with the stated aim of making Homowo a marquee cultural tourism event; the tourism ministry has backed Chale Wote since at least 2018. No official source, however, records the visitors, spending or local effects of either festival.
This article takes up a question that festival research usually leaves in the background: are the official data that exist adequate for evaluating festival tourism, and if they are not, why not? It answers through a comparative secondary-data study of Homowo and Chale Wote between 2011 and 2025. Data limitations are not treated here as a caveat to be mentioned and set aside. They are the object of analysis.
Three contributions follow. The first is empirical: a systematic account of what national tourism statistics in a West African destination can and cannot reveal about recurring urban festivals. The second is methodological: a fitness-for-use framework, built on five criteria, that other researchers can apply before they design festival studies in data-scarce settings. The third concerns policy. The study identifies an institutional asymmetry, in which the state promotes festivals that it does not measure, and shows that this asymmetry reflects priorities rather than a lack of capacity, since the same agency already surveys other events.
2. Literature Review
2.1. Measuring the Tourism Effects of Events
Event researchers have long agreed that festivals cannot be evaluated without event-specific evidence. Ritchie (1984) mapped the economic, social and image effects that hallmark events might produce, and a generation of methodological work then refined how visitor numbers and spending could be estimated (Crompton et al., 2001; Dwyer et al., 2005). These approaches share a dependence on data collected on the ground: intercept surveys of attendees, gate or crowd counts, and estimates of how much spending is genuinely new to the host economy rather than diverted from elsewhere. Felsenstein and Fleischer (2003) showed that even for modest local festivals, the argument for public subsidy rests on visitor expenditure figures that can only be gathered at the event.
When such data are missing, researchers have turned to aggregate series. Studies of mega-events, for example, use national arrivals to estimate how much an Olympic Games or a football World Cup raises inbound tourism (Fourie & Santana-Gallego, 2011). The method works when an event is large relative to normal flows. It is far less suited to recurring local festivals, whose effects are modest relative to national totals and coincide with other seasonal influences. Digital traces have been proposed as a partial remedy. Search-engine data can track public interest in destinations and events (Choi & Varian, 2012; Bangwayo-Skeete & Skeete, 2015), but they measure attention rather than travel, and they say nothing about spending.
Getz and Page (2016) observe that event evaluation remains heavily weighted towards the Global North, where statistical systems are dense and event organisers routinely commission impact studies. In Ghana, research on festival tourism has concentrated on events such as the Kwahu Easter festival and the Ankos masquerade of Sekondi-Takoradi, and has generally relied on questionnaires administered to residents or visitors in a single season (Doe et al., 2022; Fordjour & Cruz, 2023). Such studies can describe perceptions at one moment, but they cannot reveal change over time, and they are rarely repeated. Work on Chale Wote has been mainly qualitative, concerned with creative placemaking, organisation and residents’ experiences (Tuferu, 2020; Yakubu, 2020; Sakyi et al., 2026). To our knowledge, no study has asked what Ghana’s official statistics can say about its festivals at all.
2.2. Tourism Statistics in Data-Scarce Contexts
The international recommendations for tourism statistics distinguish visitors from other travellers, separate same-day from overnight trips, and classify trips by purpose (United Nations, 2010). Many countries fall short of these standards in practice, relying instead on border counts that include returning residents, business travellers and people in transit. Ghana’s published arrival figures are counts of trips recorded by the immigration service, and journalists have questioned the reliability of official tourism figures on several occasions (Simons, 2019). Domestic tourism, which in many African destinations is larger than international tourism, was not covered by a national survey until the Ghana Statistical Service (GSS) fielded its Domestic and Outbound Tourism Survey in 2023 (GSS, 2025a, 2025b).
Secondary analysis of official data has obvious attractions for tourism researchers in such settings. It is inexpensive, covers long periods and avoids the burdens that surveys place on respondents (Hakim, 1982; Johnston, 2014). Its value, however, depends on how well the data fit the question. This study borrows the idea of fitness for use, under which data quality is judged against a particular purpose rather than in the abstract. For festival evaluation, the purpose is demanding. Useful data must relate to festival travel, be resolved finely enough in space and time to isolate an event lasting a few days in specific neighbourhoods, agree across publications, include the festivals in question and be accessible to researchers and planners. Few studies have applied these tests explicitly to the data on which they rely.
2.3. Promotion Without Measurement
A critical strand of the literature argues that festival promotion often runs ahead of the evidence. Waitt (2008) describes a geography of hype in which festivals are expected to deliver regeneration, jobs and visitors that are rarely demonstrated. Harvey (1989) and Gotham (2005) connect the spread of festivals to the entrepreneurial turn in urban governance, in which spectacle becomes a tool of place-branding and competition between cities. Stakeholder perspectives add that festivals are shaped by the competing interests of organisers, authorities, sponsors and communities (Getz et al., 2007). Who measures a festival, and what they choose to measure, is part of that contest. This article builds on these arguments by examining how a gap in measurement can persist alongside active public promotion, and what that gap reveals about the priorities of the agencies involved.
3. Context, Data and Methods
3.1. The Two Festivals
Homowo and Chale Wote share a city and a season, but little else. Homowo, whose name is usually translated as hooting at hunger, is a sacred observance celebrated in sequence across the Ga towns of Greater Accra between roughly July and September. Each town’s celebration is preceded by a ban on drumming and noise-making and culminates in the sprinkling of kpokpoi, a dish of steamed maize meal and palm oil, as an offering to ancestors (Ammah, 1982; Quartey-Papafio, 1920). Traditional councils lead it. There is no ticketing, no published programme in the conventional sense and no attendance count.
Chale Wote is a curated arts festival of about a week, featuring murals, performance, film, music and processions. From 2011 to 2022 it was held in Jamestown, part of the historic Ga Mashie quarter. In 2023 its centre moved to Black Star Square and the commercial district of Osu, though some activity returned to Jamestown in 2024 and 2026. Its organiser publishes programmes and artist numbers, and the press regularly reports attendance estimates. Studying the two together therefore tests data adequacy for two quite different kinds of festival: a dispersed community observance and a bounded contemporary event of the sort that statistical systems might be expected to capture more easily.
3.2. Data Sources
The study assembled 21 official and statistical sources, summarised in Table 1. The core of the dataset consists of GTA’s annual tourism reports, published editions of which cover 2014 to 2025, and the reports and factsheet of the 2023 domestic tourism survey. These were supplemented by World Bank and earlier GSS arrival series for 1995 to 2015, regional population projections, and district populations from the 2010 and 2021 censuses. A corpus of 53 media and official texts was compiled through systematic web searches: 26 concern Chale Wote, 22 concern Homowo, and five concern both festivals or the tourism sector generally. Two further items were screened but excluded because they could not be verified against an original publisher. A log of 14 dated governance actions was compiled from the corpus and from GTA reports.
All sources were publicly available. Formal requests were also sent to GTA for monthly hotel occupancy by region and for geocoded lists of licensed enterprises, and an application was made for the domestic survey microdata, which record the month of each trip. None had been answered by the time the analysis closed. These unanswered requests are part of the evidence on access.
3.3. Analysis
The analysis had two stages. In the first, each available indicator was put to work on a substantive question about the festivals, as a researcher without event data would do. Seasonal indices were computed from 84 months of international arrivals, from January 2019 to December 2025. A month-effects regression with year fixed effects was then estimated on 2019 and 2022 to 2025, leaving out the pandemic years, to test whether August differed from other months once growth between years was controlled for. Domestic trips were examined by quarter and purpose. Location quotients compared Greater Accra’s share of licensed tourism enterprises with its share of the national population (Isserman, 1977). The media corpus was coded for attendance and other scale claims, primary and secondary frames, actors and claims of economic benefit (Krippendorff, 2018).
In the second stage, every source was assessed for its fitness to evaluate festival tourism against five criteria. Relevance asks whether the source measures travel or supply connected to festivals. Resolution asks whether it is fine enough in space and time to isolate an event lasting days in particular neighbourhoods. Consistency asks whether values agree within and between publications. Coverage asks whether the festivals are included at all. Access asks whether the data are published or can be obtained. During extraction, every discrepancy was entered in a data-quality log, together with its likely effect and the way it was handled. The log is reported here as a finding rather than relegated to an appendix.
4. Findings
4.1. What the Available Data Reveal
The national arrival figures place both festivals in a busy period but cannot separate them from it. Across 2019 and 2022 to 2025, August arrivals averaged about 10 per cent above an average month and ranked second or third in every year. When growth between years was controlled for, however, August was about 2 per cent below July, a difference that was not statistically significant (p = 0.50), and about 14 per cent below December (Figure 1). Annual arrivals did not accelerate after Chale Wote began in 2011. The August peak belongs to a broader mid-year season shaped by summer and diaspora travel, PANAFEST and Emancipation Day, and none of it can be attributed to either festival.
The domestic survey tells a somewhat richer story. Culture and festival trips made up about 0.5 per cent of same-day and 1.0 per cent of overnight domestic trips in 2023. Their timing, though, was clearly seasonal. The July to September quarter held about 20 per cent of all domestic trips but 31 per cent of same-day and 33 per cent of overnight trips made for culture or festivals (Figure 2). More than 90 per cent of overnight domestic trips used non-commercial accommodation, usually the homes of relatives, so most of this travel never appears in hotel statistics. What the survey cannot do is say which festivals these trips were for, or how many of them went to Accra in August.
The supply data describe the setting rather than the festivals. In 2025, Greater Accra held about 36 per cent of Ghana’s licensed tourism enterprises but only 18 per cent of its population, giving a location quotient of about 2.0 that has barely moved since 2020. Entertainment and events businesses were the most concentrated of all, with a location quotient of 4.18. These figures show that the festivals operate inside an already centralised tourism economy. They say nothing about whether the festivals add to it.
For the scale of the festivals themselves, there are only claims. The corpus contains nine attendance claims for Chale Wote, rising from roughly 1,000 people in 2011 to more than 10,000 in 2015 and between 20,000 and 50,000 in 2018 and 2019; a 2024 listing repeated the 50,000 figure, and an informant quoted in a 2026 study put attendance at over 100,000 (Sakyi et al., 2026). Two outlets offered 30,000 and 50,000 for the same 2019 edition. No attendance figure of any kind was found for Homowo, which is unsurprising for a series of community observances spread across many towns.
4.2. Fitness of the Sources
Table 2 summarises how each source fares against the five criteria. One pattern dominates: the data most relevant to festivals are the least available, while the most available data are the least relevant.
4.3. Four Gaps
Read together, the assessments point to four gaps that jointly prevent evaluation.
The first is resolution. Arrivals are published nationally by month, hotel occupancy nationally by year and star rating, and domestic trips by region and quarter. Chale Wote lasts about a week, and each Homowo celebration lasts a few days in a particular town. No published series is resolved below the region or the month, so the festivals are always diluted in larger aggregates.
The second is coverage. GTA’s reports for 2022, 2023 and 2025 include special surveys of December in GH, and the 2025 report adds the Kwahu Easter festival and PANAFEST. Neither Accra festival has been surveyed in this way. The domestic survey records culture or festival attendance as a purpose of travel but does not ask which festival.
The third is consistency. The data-quality log recorded 32 issues: 26 during the first round of extraction and six more during a second round of checking. Most are minor, but several affect headline figures. The published receipts for 2023 were calculated on arrivals through Kotoka International Airport, about 1.02 million, rather than total arrivals of about 1.15 million, whereas the 2024 figure used total arrivals. On a consistent basis, growth in receipts between 2023 and 2024 falls from about 26 per cent to about 12 per cent. The 2016 arrivals figure comes from a different series from the World Bank figures that end in 2015, creating a break that prevents simple growth comparisons across the decade. Receipts fell from US$4.82 billion in 2024 to US$4.34 billion in 2025 even as arrivals rose, implying an unexplained fall of about 11 per cent in spending per arrival. Hotel occupancy for 2021 covers January to June only. Even the official visitor portal listed two different calendars for Homowo in 2024.
The fourth is attribution. Even where an indicator rises in August, no source distinguishes festival visitors from anyone else. Arrival figures count trips for every purpose, including returning residents, and business has consistently been the largest stated purpose of visits.
4.4. The Right Instrument Already Exists
GTA’s event surveys show what festival evaluation could look like in Ghana. During December in GH 2023, 5-star hotels in Accra and Tema were 99 per cent occupied, against an annual average of 71 per cent, and daily food and beverage sales at monitored outlets rose by 87 per cent (GTA, 2024). In 2025, hotels serving the Kwahu Easter festival averaged 91 per cent occupancy, while hotels during PANAFEST averaged only about 24 per cent (GTA, 2026). The results range from very large to very small, which is precisely why such measurement is worth doing. The method exists, the agency knows how to run it, and it reports the results publicly. It has simply never been applied to Homowo or Chale Wote.
4.5. Promotion Without Measurement
The governance log, by contrast, records steady promotion. The tourism ministry hosted a Homowo climax event in 2014 and announced GHS 300,000 in support for Chale Wote in 2018. The ministry, GTA and the Korle Klottey Municipal Assembly were listed as supporters when Chale Wote moved to Osu in 2023. In 2025, GTA agreed to partner the Ga Traditional Council on Homowo, and in 2026 the ministry urged the public to take part in Homowo while listing Chale Wote among the week’s attractions. Across the 48 texts concerned with one of the two festivals, 12 claim economic benefits for it. None of these claims is supported by published data.
5. Discussion
5.1. The Wrong Instrument, Not a Null Result
It would be easy to read the absence of a festival signal in the arrival data as evidence that the festivals have little tourism value. That reading would be mistaken. What the analysis shows is that national monthly arrivals are the wrong instrument for detecting the effect of recurring local festivals. Methods that work for mega-events (Fourie & Santana-Gallego, 2011) break down when the event is small relative to national flows and coincides with other seasonal drivers. The domestic evidence hints at where the effect may actually lie: in domestic and diaspora travel, much of it to the homes of relatives, which commercial statistics barely register. For a festival such as Homowo, which is as much a homecoming as a spectacle, the typical visitor may be a Ga family member who lives in Kumasi, London or New Jersey. Standard tourism statistics are poorly equipped to count such a person.
5.2. An Asymmetry of Priorities
The central finding is an asymmetry between promotion and measurement. The agency that now partners with Homowo and that supported Chale Wote’s relocation already runs event surveys for December in GH, Kwahu Easter and PANAFEST. Technical capacity is therefore not the limiting factor. The difference lies in which events the state treats as measurable tourism products. December in GH and PANAFEST are state-branded events aimed largely at the diaspora; Kwahu Easter is a well-established domestic tourism event with strong institutional backing. The Accra festivals, one led by traditional authorities and the other by an independent arts platform, sit outside the state’s own event portfolio, even as the state lends them its name and support.
The asymmetry matters because what is measured shapes what is managed. In the absence of data, the case for promoting festivals rests on claims of economic benefit that cannot be checked, which is exactly the geography of hype that Waitt (2008) describes. The costs of festival tourism also drop out of view. In the case of Chale Wote, residents have described rents that rose during the festival’s Jamestown years and did not fall after it moved (Sakyi et al., 2026). In the case of Homowo, the 2025 season brought fatal clashes between rival factions in Teshie and at Sowutuom and Anyaa, and the municipal security council proposed suspending the remaining celebrations in Teshie. Benefits and costs alike can only be weighed if they are observed.
5.3. Data Quality as an Object of Research
The 32 recorded inconsistencies are a finding in their own right. Some were large enough to halve an apparent trend, as with the change in the basis for 2023 receipts. Studies that draw on official tourism statistics in data-scarce contexts often treat published figures as given and move straight to analysis. This study suggests that a systematic data-quality log should become a routine step in secondary-data tourism research, reported alongside the results, so that readers can see which conclusions rest on contested values and how the researcher handled them.
5.4. A fitness-for-Use Framework
The five criteria used here (relevance, resolution, consistency, coverage and access) amount to a simple framework for judging whether a destination’s data can support festival evaluation. Applied at the start of a project, the framework sorts research questions into those that existing data can answer and those that require new collection. It is deliberately modest, needs no specialised software, and can be applied in other destinations where festivals are promoted but data are thin, a description that fits much of sub-Saharan Africa.
5.5. Implications for Policy
The findings point to a short list of practical, low-cost steps, most of which extend what Ghana’s agencies already do.
- Publish what is already collected. Releasing monthly hotel occupancy and room rates by region and star rating would, on its own, allow a before-and-during comparison for Greater Accra in August.
- Extend the event-survey model. GTA and GSS could apply the December in GH design to Chale Wote and to at least one Homowo town, recording occupancy, prices, spending and visitor origin.
- Release domestic survey tables by month. The 2023 survey records the month of each trip; tabulating trips by month, region and purpose would identify festival-season travel to Accra directly.
- Agree a single festival calendar. One official calendar, agreed with the traditional councils and the organiser, would remove the conflicting dates that currently appear even on the official visitor portal.
- Agree a counting method with organisers. Chale Wote’s organiser and the municipal assemblies could adopt a consistent, documented method for estimating attendance, in place of unverifiable press figures.
6. Conclusion
This article set out to establish whether Ghana’s official data can evaluate the tourism role of two festivals in Accra. They cannot. The data situate Homowo and Chale Wote within a busy mid-year season and a tourism economy concentrated in the capital, but four gaps, in resolution, coverage, consistency and attribution, prevent any estimate of the festivals’ own effects. Their tourism role is real but largely unmeasured. That gap persists not because Ghana lacks the means to measure events, but because these festivals fall outside the set of events the state chooses to measure, even while it promotes them.
The study has limitations that should be stated plainly. It relies entirely on secondary data, and the requests for monthly regional occupancy and survey microdata were not answered in time. The domestic survey covers a single year, and its culture and festival cells are small enough that quarterly differences should be read as indicative. The media corpus is limited to online and mainly English-language sources. Future research could combine the fitness-for-use assessment with event-level data, including intercept surveys during Chale Wote and Homowo, monthly regional occupancy and the domestic survey microdata. Comparative work in other West African cities would show whether the measurement asymmetry identified here is specific to Accra or a more general feature of festival policy in the region.
Funding
This research received no specific grant from any funding agency.
Data availability
The compiled dataset, including the data-quality log, source register and media corpus, is available from the author on reasonable request.
Conflicts of Interest
The author declares no conflict of interest.
Acknowledgments
Acknowledgement goes to my supervisor, Fang Yuhai.
References
- Ammah, C. N. (1982). Ga Homowo and other Ga-Adangme festivals. Sedco.
- Bangwayo-Skeete, P. F., & Skeete, R. W. (2015). Can Google data improve the forecasting performance of tourist arrivals? Mixed-data sampling approach. Tourism Management, 46, 454–464. [CrossRef]
- Choi, H., & Varian, H. (2012). Predicting the present with Google Trends. Economic Record, 88(s1), 2–9. [CrossRef]
- Crompton, J. L., Lee, S., & Shuster, T. J. (2001). A guide for undertaking economic impact studies: The Springfest example. Journal of Travel Research, 40(1), 79–87. [CrossRef]
- Doe, F., Preko, A., Akroful, H., & Okai-Anderson, E. K. (2022). Festival tourism and socioeconomic development: Case of Kwahu traditional areas of Ghana. International Hospitality Review, 36(1). [CrossRef]
- Dwyer, L., Forsyth, P., & Spurr, R. (2005). Estimating the impacts of special events on an economy. Journal of Travel Research, 43(4), 351–359. [CrossRef]
- Felsenstein, D., & Fleischer, A. (2003). Local festivals and tourism promotion: The role of public assistance and visitor expenditure. Journal of Travel Research, 41(4), 385–392. [CrossRef]
- Fordjour, R., & Cruz, A. R. (2023). Traditional cultural festivals and socio-economic boost: Evidence from the Ankos Masquerade Festival in Ghana. African Journal of Hospitality, Tourism and Leisure, 12(3), 1071–1084.
- Fourie, J., & Santana-Gallego, M. (2011). The impact of mega-sport events on tourist arrivals. Tourism Management, 32(6), 1364–1370. [CrossRef]
- Getz, D. (2008). Event tourism: Definition, evolution, and research. Tourism Management, 29(3), 403–428. [CrossRef]
- Getz, D., Andersson, T., & Larson, M. (2007). Festival stakeholder roles: Concepts and case studies. Event Management, 10(2–3), 103–122. [CrossRef]
- Getz, D., & Page, S. J. (2016). Progress and prospects for event tourism research. Tourism Management, 52, 593–631. [CrossRef]
- Ghana Statistical Service. (2025a). 2023 Domestic and Outbound Tourism Survey: Domestic same-day visitors final report. GSS.
- Ghana Statistical Service. (2025b). 2023 Domestic and Outbound Tourism Survey: Domestic overnight visitors final report. GSS.
- Ghana Tourism Authority. (2024). Ghana tourism report 2023: Strong recovery. GTA.
- Ghana Tourism Authority. (2026). 2025 tourism report: Resilience and sustainable growth. GTA.
- Gotham, K. F. (2005). Theorizing urban spectacles: Festivals, tourism and the transformation of urban space. City, 9(2), 225–246.
- Hakim, C. (1982). Secondary analysis in social research: A guide to data sources and methods with examples. George Allen & Unwin.
- Harvey, D. (1989). From managerialism to entrepreneurialism: The transformation in urban governance in late capitalism. Geografiska Annaler: Series B, Human Geography, 71(1), 3–17. [CrossRef]
- Isserman, A. M. (1977). The location quotient approach to estimating regional economic impacts. Journal of the American Institute of Planners, 43(1), 33–41. [CrossRef]
- Johnston, M. P. (2014). Secondary data analysis: A method of which the time has come. Qualitative and Quantitative Methods in Libraries, 3(3), 619–626.
- Krippendorff, K. (2018). Content analysis: An introduction to its methodology (4th ed.). SAGE.
- Quartey-Papafio, A. B. (1920). The Gã Homowo festival. Journal of the African Society, 19(74), 126–134. [CrossRef]
- Richards, G., & Palmer, R. (2010). Eventful cities: Cultural management and urban revitalisation. Butterworth-Heinemann.
- Ritchie, J. R. B. (1984). Assessing the impact of hallmark events: Conceptual and research issues. Journal of Travel Research, 23(1), 2–11. [CrossRef]
- Sakyi, R., et al. (2026). Applying the event lifecycle model and social exchange theory to tourism management: The Chale Wote Street Art Festival in Ghana. Cogent Social Sciences, 12(1), Article 2694220. [CrossRef]
- Simons, B. (2019). Ghana’s Year of Return is on its way to success so the government should stop using bad data. Quartz. https://qz.com/africa/1772851/ghanas-year-of-return-should-avoid-bad-govt-data.
- Tuferu, W. (2020). Festivals and creative placemaking: A case study on Chale Wote Street Art Festival [Master’s thesis, Wageningen University and Research]. https://edepot.wur.nl/519069.
- United Nations. (2010). International recommendations for tourism statistics 2008 (Studies in Methods, Series M No. 83/Rev.1). United Nations.
- Waitt, G. (2008). Urban festivals: Geographies of hype, helplessness and hope. Geography Compass, 2(2), 513–537. [CrossRef]
- Yakubu, I. B. (2020). The impact of Chale Wote Street Art Festival in James Town, Accra [MPhil thesis, University of Education, Winneba]. https://ir.uew.edu.gh/handle/123456789/4491.
Figure 1.
Estimated month effects on international arrivals relative to January, 2019 and 2022–2025. Source: Computed from GTA (2024, 2026). Bars show coefficients from a month-effects model with year fixed effects; whiskers show 95 per cent confidence intervals; August is highlighted.
Figure 1.
Estimated month effects on international arrivals relative to January, 2019 and 2022–2025. Source: Computed from GTA (2024, 2026). Bars show coefficients from a month-effects model with year fixed effects; whiskers show 95 per cent confidence intervals; August is highlighted.
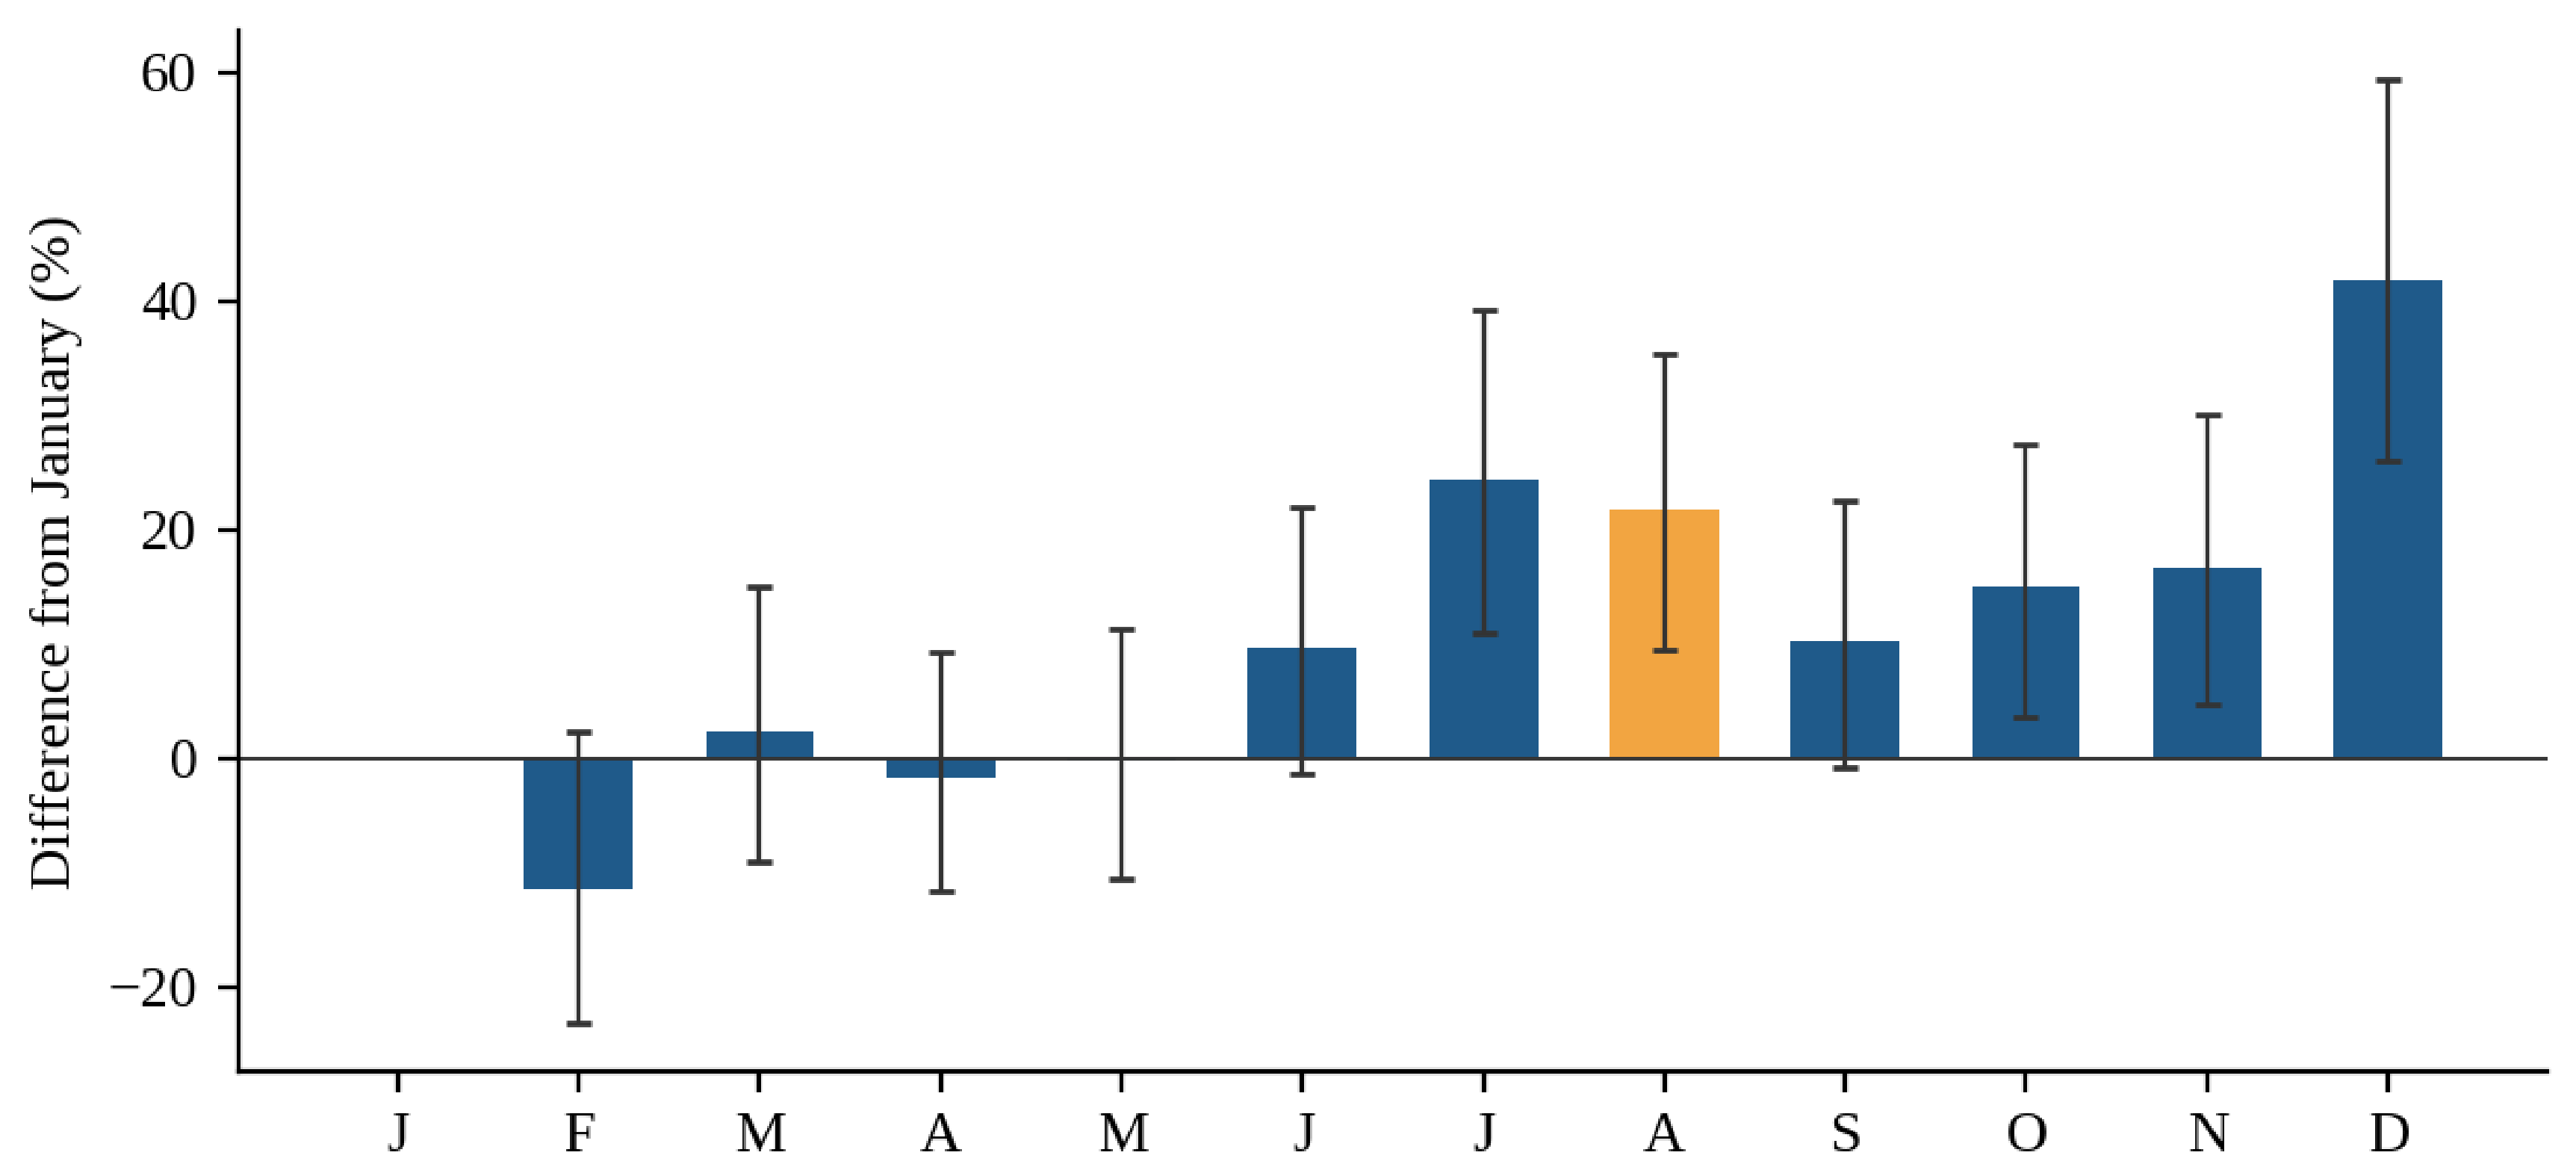
Figure 2.
Culture/festival share of domestic trips by quarter, 2023. Source: Computed from GSS (2025a, 2025b). Values count trips, not persons.
Figure 2.
Culture/festival share of domestic trips by quarter, 2023. Source: Computed from GSS (2025a, 2025b). Values count trips, not persons.
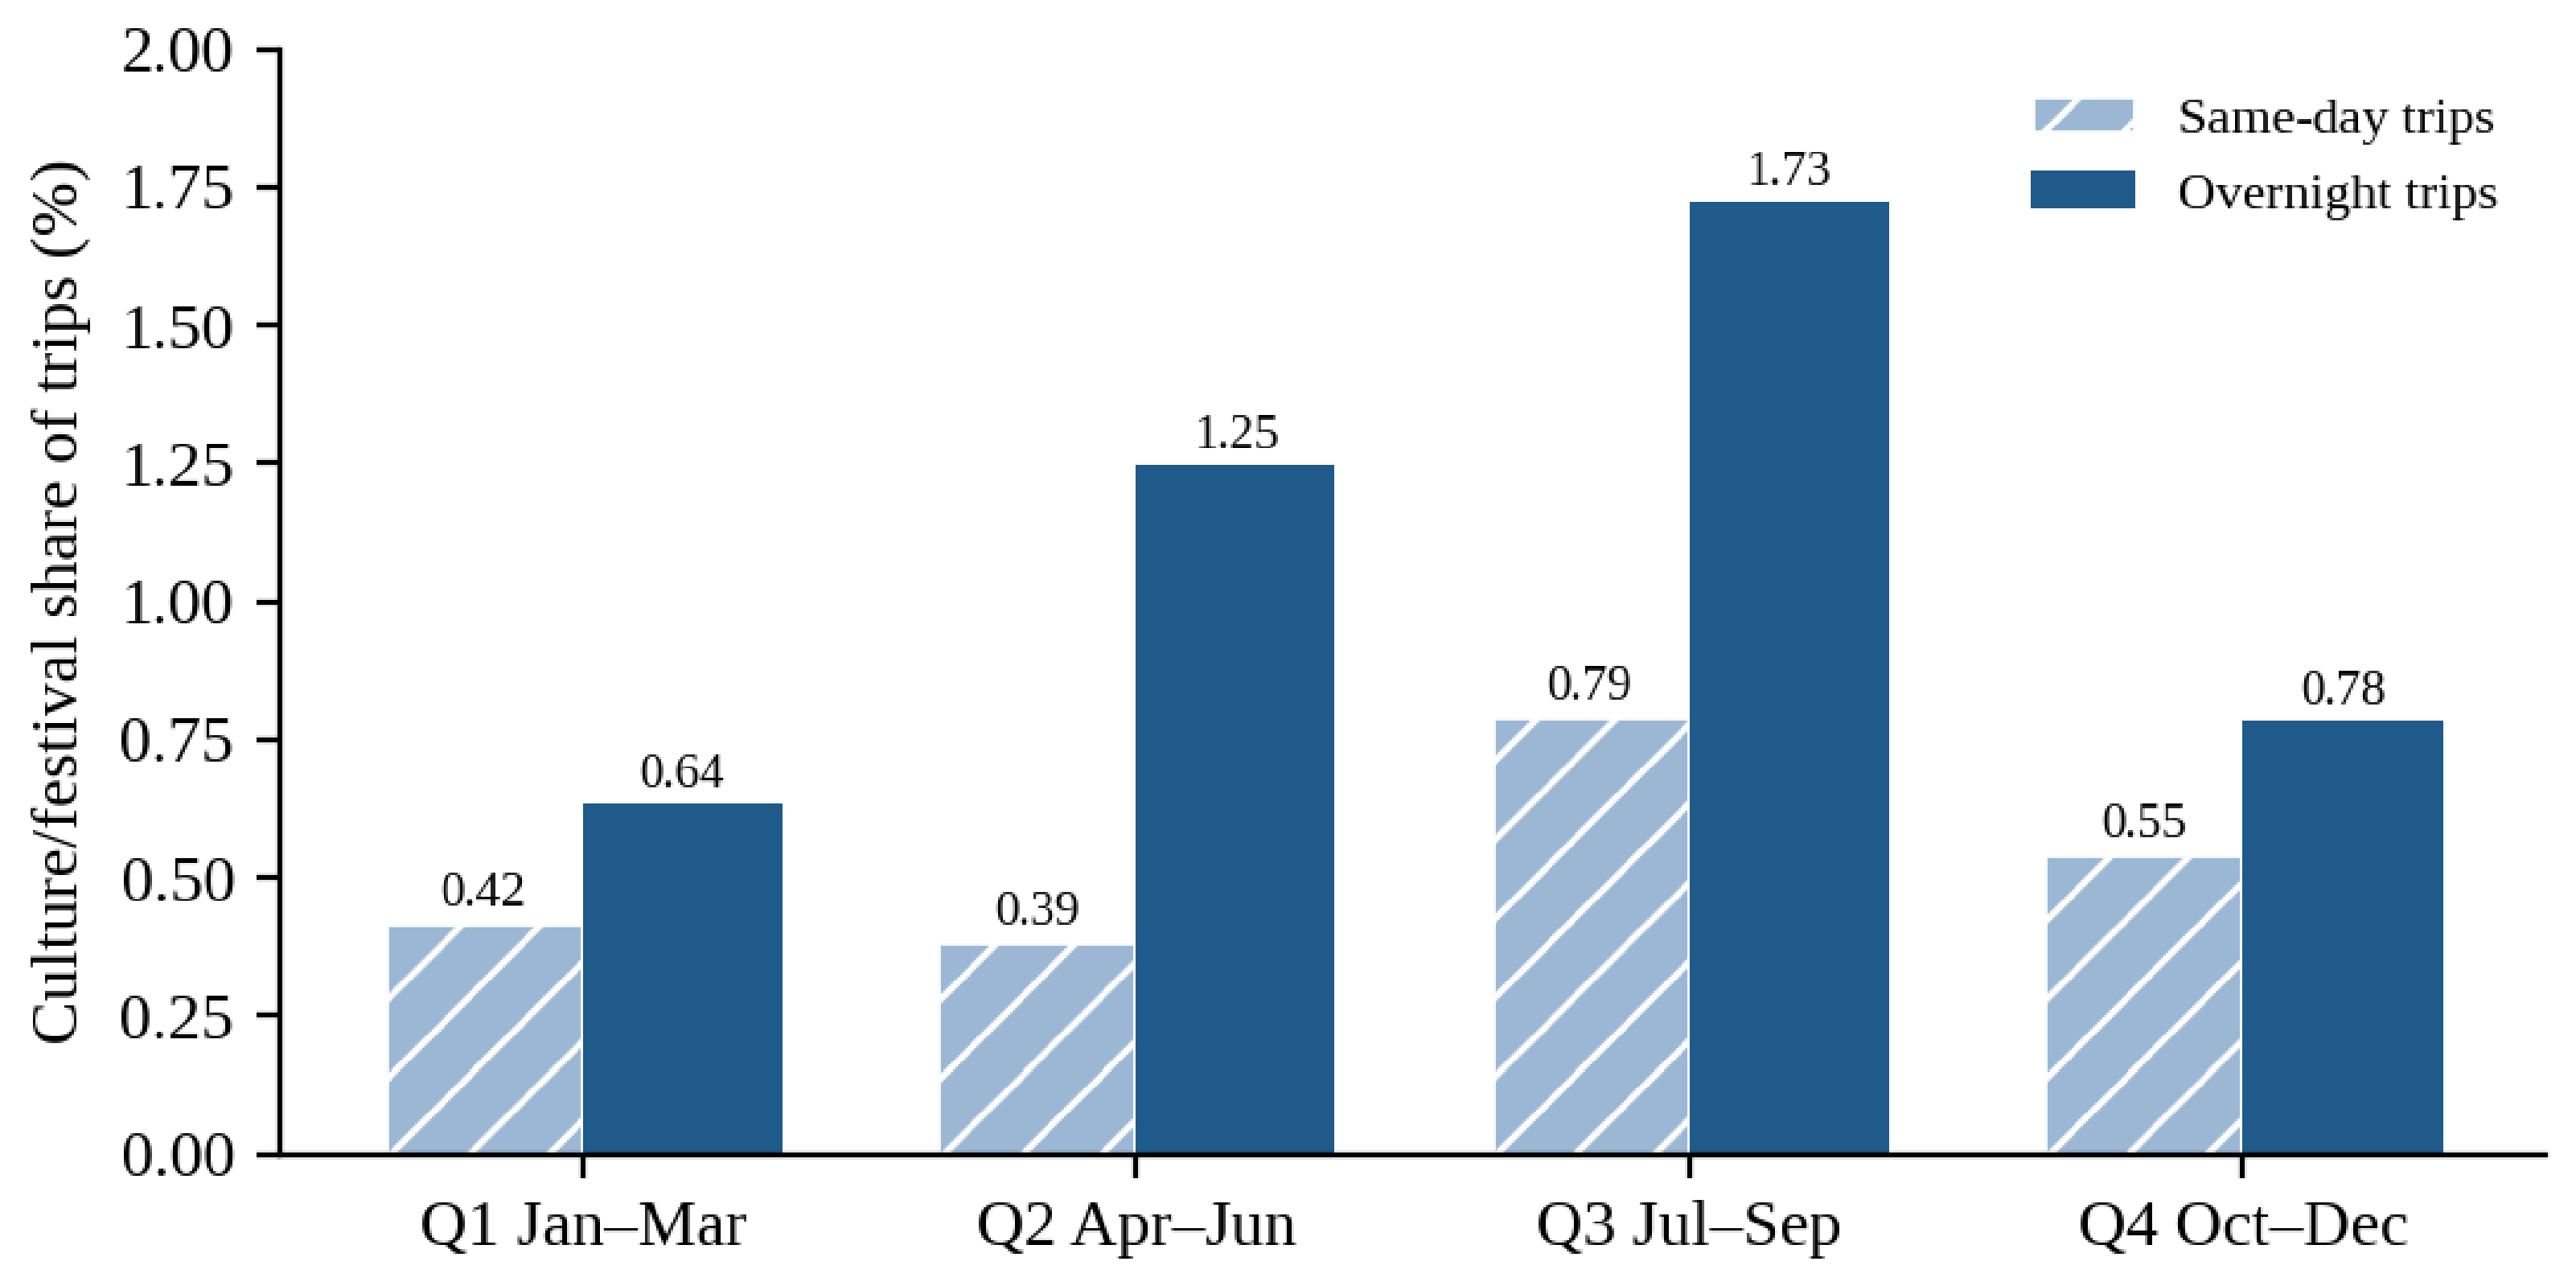

Table 1.
Main data sources.
| Source | Coverage | Main variables |
|---|---|---|
| GTA annual tourism reports (2020–2025 editions) | 2014–2025 | Monthly arrivals 2019–2025; receipts, average spend and stay; hotel occupancy by star rating; licensed enterprises by region; special event surveys |
| GSS 2023 Domestic and Outbound Tourism Survey | 2023, by quarter | Same-day and overnight trips by region visited and main purpose, including culture/festival |
| GSS population projections; 2010 and 2021 censuses | 2010–2027 | Regional and district populations, used as denominators |
| World Bank WDI; GSS (2006) | 1995–2015 | Annual international arrivals and receipts |
| Media and official texts (n = 53) | 2007–2026 | Festival dates, scale claims, frames, actors |
| Governance log (14 actions) | 2014–2026 | Actor types and roles |
Source: Compiled by the author. GTA = Ghana Tourism Authority; GSS = Ghana Statistical Service.
Table 2.
Fitness of data sources for evaluating festival tourism.
| Source | Resolution | Covers the festivals? | Main quality issue | Fitness |
|---|---|---|---|---|
| GTA monthly arrivals | National, monthly | No | All purposes; counts trips, not persons | Context only |
| GTA hotel occupancy | National, annual by star rating | No | Text–table conflicts; partial years | Not fit for August |
| GTA licensed enterprises | Region, annual; no 2024 table | No | Revisions between report editions | Partly fit (regional) |
| GTA special event surveys | Event-level | No (other events only) | Minor | Right model, not applied |
| GSS domestic survey 2023 | Region, quarter; one year | Not separately | Small cells; no confidence intervals | Partly fit |
| Census and projections | District; 2010, 2021 | Not applicable | Good | Fit for context |
| Media corpus | Event-level | Yes, unevenly | Conflicting dates and scale claims | Fit for representation, not counts |
Source: Author’s assessment.
Disclaimer/Publisher’s Note: The statements, opinions and data contained in all publications are solely those of the individual author(s) and contributor(s) and not of MDPI and/or the editor(s). MDPI and/or the editor(s) disclaim responsibility for any injury to people or property resulting from any ideas, methods, instructions or products referred to in the content. |
© 2026 by the authors. Licensee MDPI, Basel, Switzerland. This article is an open access article distributed under the terms and conditions of the Creative Commons Attribution (CC BY) license (http://creativecommons.org/licenses/by/4.0/).
Copyright: This open access article is published under a Creative Commons CC BY 4.0 license, which permit the free download, distribution, and reuse, provided that the author and preprint are cited in any reuse.