

Submitted:
11 October 2026
Posted:
13 October 2026
You are already at the latest version
Abstract
Quartz sand is used throughout oil and gas well engineering, including hydraulic fracturing, wellbore sand control, high-temperature cementing and produced-water treatment, but each use imposes distinct require-ments on particle size, morphology, strength, reactivity and cleanliness. Following the performance chain from mineral source, washing and size classification, storage and transport, slurry injection and fracture placement to long-term service, this review discusses proppant transport and settling, bridging and bed-load migration, breakage and wall embedment under closure stress, fines migration, fracture-fluid residues, mul-tiphase and non-Darcy flow, stress cycling and time-dependent damage. Natural quartz sand, pre-cured and curable resin-coated sands, ceramic proppants and mixed proppants are compared. Material selection should be based on target-well long-term conductivity tests and life-cycle economics. The review also considers gravel packing, where grain-size matching to formation sand, screen compatibility and packing completeness are critical, and high-temperature well cementing, where finely ground silica regulates the calcium-to-silicon ra-tio of hydration products and mitigates strength retrogression. API Std 19C and ISO 13503-2:2024 provide the basic characterization framework, whereas ISO 13503-5:2006 can organize long-term conductivity compari-son but does not provide an absolute in-situ conductivity. A project-level test matrix, minimum reporting set and batch-traceability loop are proposed for resource assessment, product development, procurement and field verification.
Keywords:
quartz sand
; hydraulic fracturing
; proppant transport
; particle embedment
; long-term conductivity
; resin-coated sand
; ceramic proppant
; gravel packing
; oil-well cement
1. Introduction
Hydraulic fracturing creates conductive pathways by injecting high-pressure fluid into a reservoir, thereby enlarging the effective flow area between the wellbore and low-permeability rock. After pumping ceases, fractures progressively close under the minimum principal stress. Proppant transported with the treatment fluid forms a load-bearing granular skeleton that preserves flow-connected voids and maintains a residual fracture aperture. Natural quartz sand is readily washed, classified, transported, and blended into specified sieve fractions. Its supply chain and processing technology are mature, and its unit-volume cost is generally lower than that of ceramic proppants. It therefore remains one of the most widely used proppants in unconventional oil and gas development [1]. The same SiO₂ raw material may also be used in gravel packing, frac-pack operations, produced-water filtration, and, in the form of finely ground silica flour, high-temperature oil-well cementing. These applications share a silica source, but differ fundamentally in operating function, particle-size range, failure mode, and acceptance criteria.
Proppant quality cannot be represented adequately by SiO₂ content or a single crush value. Particle size controls initial pore-throat dimensions, settling behavior, fracture access, and potential bridging. Sphericity and roundness influence contact stress, packing stability, and particle rearrangement under closure. Mineral impurities, fines, and surface coatings affect acid solubility, turbidity, wettability, and compatibility with fracturing fluid, formation water, and hydrocarbons. Once introduced into a fracture, the material continues to evolve under closure stress, wall softening and creep, particle breakage, fines generation and migration, fracture-fluid residues, multiphase flow, non-Darcy effects, and repeated stress cycling. The production-relevant property is therefore effective fracture conductivity as it evolves with time under specified stress, temperature, fluid composition, rock-wall condition, and placement concentration, rather than an isolated factory-release indicator [2,3].
This paper links quartz-sand resource attributes, product specifications, treatment design, and downhole performance within a common engineering framework. It first defines the functions and boundaries of quartz-based materials in petroleum operations, then examines standard characterization, proppant transport and placement, particle embedment, and long-term conductivity. Natural quartz sand is compared with resin-coated, curable-coated, ceramic, and mixed-proppant systems. The discussion is then extended to gravel packing, high-temperature cementing, produced-water filtration, environmental health, supply-chain resilience, and full-process quality assurance. Numerical values reported in tables are intended to illustrate experimental conditions and comparative relationships; they are not supplier performance guarantees. Procurement limits and treatment parameters must be determined for each target well using closure stress, temperature, lithology, fracture geometry, fluid system, transport conditions, and batch-specific test evidence.
2. Material Basis and Oilfield Functions of Quartz Sand
2.1. Mineral Source, Processing and Product Consistency
Natural fracturing sands are commonly produced from quartz-rich sandstone, unconsolidated quartz sand, or other deposits that combine high quartz abundance, relatively rounded grains, and favorable liberation characteristics. Processing generally includes crushing or disaggregation, attrition scrubbing, screening, desliming, magnetic separation or other impurity-removal steps, dewatering, drying, and final blending into defined sieve classes. The objective is not unlimited chemical purity, but stable particle-size grading, low clay and fines content, acceptable sphericity and roundness, controlled turbidity and acid solubility, and repeatable breakage behavior at an economically reasonable cost. Natural quartz sand therefore remains attractive for many moderate-stress fracturing applications because it can provide adequate conductivity at substantially lower cost than ceramic alternatives [1].
Bulk SiO₂ content alone is an incomplete quality indicator. Microcracks, healed fractures, fluid or mineral inclusions, weakly cemented grain aggregates, feldspar remnants, clay coatings, iron oxides, and other surface contaminants may be present even in quartz-rich products. Under closure stress, these structural weaknesses can initiate grain breakage and generate fines. The resulting debris may occupy pore throats, increase pack compaction, promote particle migration, and reduce long-term fracture conductivity. Long-term tests on quartz sands from different sources demonstrate that conductivity generally decreases with increasing closure stress, but the magnitude of decline depends on source characteristics, sieve class, rock-wall condition, and test duration [4]. Consequently, crush resistance should be interpreted together with mineralogy, grain morphology, particle-size distribution, and conductivity evolution rather than used as an independent ranking criterion.
Differences among deposits are transmitted to commercial products through mineral assemblages, grain defects, original roundness, weathering history, and surface coatings. Subsequent processing may either reduce or amplify this inherited variability. Screen wear, solids accumulation in recycled process water, changes in scrubbing efficiency, drying temperature, dust carryover, silo segregation, and blending practices can all generate within-batch and between-batch variation. Geological assessment, process-control records, and final-product testing should therefore be linked through a common batch identifier. A single surface grab from a product pile is rarely representative because coarse and fine fractions can segregate during stockpiling and transport. More defensible practice includes increment sampling from a moving material stream, time-stratified or truck-unit-based sampling, retained arbitration samples, replicate sieve analyses, and documentation of temporal drift in particle-size distributions. This batch-traceability approach is consistent with the objectives of API Std 19C and ISO 13503-2:2024, which prescribe comparable baseline procedures for proppant characterization and sample preparation. Nevertheless, standardized physical-property measurements remain screening evidence: project-specific long-term performance requires validation under representative stress, fluid, temperature, and rock-wall conditions [5,6,7].
2.2. Principal Uses and Functional Boundaries
In hydraulic fracturing, graded quartz sand is transported into newly created or reactivated fractures by the carrier fluid. Following shut-in and flowback, the sand pack bears closure stress and maintains residual fracture aperture and fluid-flow pathways. Its performance depends on particle size, placement concentration, fracture geometry, closure stress, rock-wall deformability, fluid residues, and the time-dependent evolution of breakage, embedment, and fines migration. Thus, the engineering objective is not simply to place the largest possible mass of sand, but to establish a sufficiently continuous and stable proppant pack in the portions of the fracture network that contribute to production [1,2].
In gravel packing, graded sand or gravel is placed around a screen to form a permeable particle-filter layer. The principal requirements are efficient exclusion of formation sand, adequate pack permeability, screen-slot compatibility, resistance to plugging, and filling completeness. Gravel selection should be based on the full grain-size distribution of formation sand rather than a single characteristic diameter. Classical grain-size ratios remain useful for preliminary design, but screen geometry, formation heterogeneity, fines content, flow regime, and completion configuration must also be considered [8,9]. Frac-pack operations combine hydraulic fracturing with gravel packing and therefore require both a conductive near-wellbore fracture and a stable sand-control barrier. They impose more stringent requirements on slurry transport, pumping schedule, screenout avoidance, proppant placement, and pack integrity.
High-temperature oil-well cementing uses finely ground quartz flour or other siliceous fillers for an entirely different purpose. Silica participates in hydrothermal reactions, adjusts the Ca/Si ratio of hydration products, and helps mitigate long-term strength retrogression under high-temperature and high-pressure conditions. Its effectiveness depends on silica dosage, fineness, particle-size distribution, curing history, pressure, permeability, and phase assemblage; it is not a mechanical fracture-support material [10,11,12,13]. Produced-water filtration likewise relies on quartz sand as a granular filtration medium. Here, the key mechanisms are particle interception, deep-bed retention, bed permeability, pressure-drop control, and recovery by backwashing. Effective size, uniformity coefficient, bed depth, influent oil and solids loading, filtration rate, and backwash intensity define suitability, rather than proppant crush resistance or fracture conductivity.
3. Quality Indices and Standard Framework for Fracturing Quartz Sand
3.1. Particle Size, Morphology, Density and Cleanliness
A sieve class denotes the nominal particle-size interval that passes through a coarser sieve and is retained on a finer sieve. It is a practical designation for blending and quality control, not a complete description of the particle-size distribution. For example, 20/40 mesh quartz sand normally provides relatively large intergranular voids and may yield high initial conductivity at low closure stress, but its larger grain size also increases settling velocity and the risk of bridging at narrow fracture entrances or in tortuous secondary fractures. In contrast, 40/70 mesh sand often represents a practical compromise between transport efficiency, access to moderately narrow fractures and retained conductivity. Finer 70/140 mesh material can access narrower branches of a complex fracture network, but its smaller pore throats are more vulnerable to fines migration, flowback and stress-induced conductivity loss. Smaller proppant has been shown to transport more readily in complex fracture networks, although transport remains strongly dependent on fluid rheology, fracture geometry and concentration schedule [15,18].
The nominal sieve class must therefore be accompanied by the complete sieve distribution, including oversize and undersize fractions. An excessive coarse tail may initiate local bridging or premature dune formation, whereas excessive fines can occupy pore throats, raise turbidity and reduce pack permeability. Particle-size design should consequently be matched to predicted fracture width, fluid viscosity, pumping rate, closure stress and the intended placement distance. The relevant engineering outcome is not simply a high percentage within the nominal sieve interval, but a stable, reproducible grain-size distribution that can be transported into the target fracture domain and retain conductive voids after closure.
Particle shape provides an additional control on pack behavior. Sphericity describes the degree to which a grain approaches a sphere, whereas roundness reflects the smoothness of grain edges and corners. High sphericity and roundness generally reduce stress concentration at particle contacts, favour grain rearrangement during placement, and help preserve connected pore space. However, favourable external morphology cannot compensate for internal defects. Quartz grains containing microcracks, fluid inclusions, weak cement remnants or compositional heterogeneity may fragment under closure stress and generate fines even when their initial shape and bulk SiO₂ content appear acceptable. Apparent density and bulk density should likewise be interpreted as operational variables: they influence the fracture volume occupied by a unit mass, slurry concentration conversion and settling tendency, but do not independently predict long-term conductivity.
Turbidity, fines content and acid solubility are useful release-control indicators, but each has a defined boundary. Turbidity mainly reflects washing efficiency, residual dust and storage cleanliness; it can increase through handling, silo abrasion or recycled-water contamination. Acid solubility identifies acid-reactive mineral impurities and surface coatings, but is not equivalent to long-term chemical stability under reservoir conditions. Clay minerals, carbonates, feldspars, iron-oxide coatings and organic residues should be confirmed by optical microscopy, automated mineralogy, X-ray diffraction or SEM–EDS rather than inferred from a single bulk test. Industry testing standards accordingly combine sieve analysis, morphology, density, turbidity, acid solubility and crush-resistance procedures; nevertheless, downhole conductivity must still be evaluated under representative stress, temperature, fluid and rock-contact conditions [3,19].
Table 2 is the common fracturing-sand sieve classes and engineering trade-offs.
3.2. Crush Strength and Batch Variation
Crush testing evaluates the mechanical integrity of a defined proppant sieve fraction by loading a prepared sand pack in a standardized cell and measuring the proportion of newly generated fines after unloading. Because the procedure is rapid, relatively inexpensive and repeatable, it is useful for initial source screening, production-batch release and comparison among nominally similar products. A low fines-generation value generally indicates that the tested grains can sustain the imposed load without extensive fragmentation; however, this result should be interpreted as a standardized index rather than a direct prediction of downhole fracture conductivity. The test cell imposes a relatively uniform load on a constrained pack, whereas an actual propped fracture experiences irregular rock-wall contacts, evolving fracture width, heterogeneous stress, cyclic pressure changes, fluid erosion, embedment and chemical interaction with formation water.
Particle breakage commonly increases with closure stress, but the relative ranking of different quartz sands may change with sieve class, pack thickness, areal concentration and loading path. Large grains may provide initially wider flow channels but can be more strongly stressed when fracture width becomes limited. Conversely, finer grains may distribute more uniformly in narrow fractures but form smaller pore throats that are sensitive to generated fines. Grain failure is also controlled by internal properties that may not be apparent in routine bulk chemistry. Microcracks, healed fractures, fluid inclusions, residual cement, polymineralic grains and angular edges can initiate stress concentration and early fragmentation. Highly spherical grains usually improve packing efficiency, yet their point contacts may still generate elevated local contact stresses under high closure load. Crush resistance should therefore be evaluated together with full particle-size distribution before and after loading, sphericity and roundness, mineralogical composition, microscopic defect density, acid solubility, turbidity and, most importantly, long-term conductivity under representative reservoir conditions.
The distinction between short-duration crushing and sustained conductivity is particularly important for natural quartz sands. Generated fines can migrate into pore throats, while proppant embedment into soft rock walls and progressive grain rearrangement reduce fracture aperture even if the initial crush result is acceptable. Tests conducted with rigid metal plates may underestimate the conductivity loss caused by embedment in shale, coal, mudstone or weakly cemented sandstone. For this reason, product qualification should include staged or cyclic closure-stress experiments and should report pack thickness, proppant concentration, test fluid, temperature, rock-wall material, loading duration and the particle-size distribution of post-test debris.
The comparative study of quartz sands from Chifeng and Tongliao, Inner Mongolia, illustrates this point. Wei et al. [4] reported clear source-dependent differences in physical properties and long-term conductivity among 20/40, 40/70 and 70/140 mesh quartz sands. Conductivity decreased as closure pressure increased; under otherwise comparable conditions, the Chifeng material performed better than the Tongliao material. These observations support the use of source information as an initial procurement and geological-screening variable, but not as a performance guarantee. Each mine, processing line and production batch still requires independent verification because grain defects, washing efficiency, size distribution and storage contamination can alter the delivered material.
3.3. API and ISO Test Systems and Their Extrapolation Boundary
API Std 19C and ISO 13503-2:2024 establish a common technical language for evaluating proppants used in hydraulic fracturing and gravel-packing operations. Their prescribed methods cover sieve analysis and median particle diameter, sphericity and roundness, acid solubility, turbidity, bulk/apparent density, crush resistance and related physical properties. Such standardization is indispensable because it allows a quartz-sand producer, laboratory, service company and operator to compare nominally similar materials using defined sample preparation and measurement procedures. Standard compliance should therefore be regarded as the entry requirement for engineering comparison and procurement quality control [5].
However, neither API Std 19C nor ISO 13503-2:2024 is designed to predict the complete service life of a proppant pack in a specific well. Standard tests necessarily use prescribed sieve fractions, loading configurations and relatively simple fluid environments, whereas field fractures experience non-uniform closure stress, rough and deformable rock walls, fracture-width heterogeneity, proppant sorting, residual polymer or scale, changing flowback velocity, brine-salinity gradients, temperature variation and repeated pressure cycling. A sand satisfying all standardized specifications may still perform poorly in a narrow, highly tortuous or weak-wall fracture; conversely, a material marginally different in one laboratory metric may be adequate under lower closure stress or more favourable placement conditions. Standards provide comparability, not a substitute for reservoir-specific design.
Proppant performance must therefore be treated as a conditional measurement rather than as a well-independent material constant. Every test report should specify sieve range, specimen mass, loading rate, closure stress, temperature, proppant-pack thickness or areal concentration, rock-plate material, fluid composition, test duration, replicate number and statistical dispersion. For products close to an acceptance threshold, small differences in sampling position, sieve efficiency, residual moisture, entrained fines or storage contamination may alter the reported value. The appropriate quality-control unit is consequently the production batch rather than an isolated grab sample. Batch records should link mean values, standard deviations and relevant percentiles to mine source, mining domain, processing line, production date, storage condition, transport history and retained arbitration specimens.
ISO 13503-5:2006 remains particularly useful for structuring comparative long-term conductivity tests because it defines a consistent procedure for proppant-pack evaluation. Nevertheless, the standard explicitly states that its procedures are not intended to determine absolute downhole conductivity. Its results should be interpreted as comparative values under declared laboratory boundary conditions, then combined with rock-mechanical data, fracture-propagation modelling, transport simulations and field production evidence. The most defensible material-selection strategy is thus a progressive evidence chain: standardized batch qualification first, reservoir-representative conductivity and embedment testing second, and field-scale validation last. ISO 13503-2:2024 and ISO 13503-5:2006 explicitly distinguish standardized test procedures from absolute in-situ performance prediction [5,6,20] (Table 3).
4. Proppant Transport and Fracture Placement
4.1. Settling, Suspension and Hindered Settling
Proppant transport in a hydraulic fracture is governed by coupled particle–fluid–wall interactions rather than by gravity alone. The principal forces include gravity, buoyancy, fluid drag, particle inertia, wall confinement, interparticle collision and frictional resistance within a developing sand bed [15,21]. For an isolated spherical grain settling in a Newtonian fluid at low Reynolds number, Stokes’ law provides a useful first-order trend [22]:
Where (vs) is settling velocity, (ρp_) and (ρf) are particle and fluid densities, (g) is gravitational acceleration, (dp) is particle diameter, and (μ) is dynamic viscosity. The equation indicates that settling accelerates with increasing density contrast and particle diameter, and decreases as fluid viscosity increases. It is useful for illustrating why coarse quartz sand settles more rapidly than fine sand in water-based fluids, but it is not a complete placement model for hydraulic fractures.
Actual fracturing treatments depart substantially from the assumptions of Stokes settling. Carrier fluids are often shear-thinning and may contain friction reducers, polymers, surfactants, fibres or other additives. Fracture widths can be only several grain diameters, so wall retardation, bridging and grain rotation become important. At elevated proppant concentrations, grains no longer behave as isolated particles: hindered settling, clustering, bed-load transport, dune formation and local screenout may dominate. Moreover, fractures propagate during placement, may intersect natural fractures, and commonly exhibit strong spatial variations in width, roughness, inclination and fluid velocity. Yao et al. [15] identify wall retardation, fluid rheology, particle-size non-uniformity, wettability, proppant concentration and fracture complexity as six major controls on proppant settling. These factors should be considered jointly when predicting the final distribution of quartz sand.
Low-viscosity slickwater is widely used because its low friction pressure permits high pumping rates and large treatment volumes. High flow velocity can transport quartz sand over substantial distances, especially where particle size is moderate and fracture width is sufficient [15,18]. However, slickwater has limited static suspension capacity for normal-density quartz sand; after local velocity decreases, grains may settle rapidly and form near-wellbore dunes or incomplete proppant coverage. Transport can be improved by increasing injection rate within operational limits, using finer sieve classes, applying staged increases in proppant concentration, optimizing pulse or alternating schedules, or using fibres and other suspension-enhancing formulations. Each strategy involves trade-offs: finer sand may access narrow secondary fractures but can be more vulnerable to fines migration and flowback, whereas higher concentrations may improve fracture filling but increase bridging and screenout risk [16,21]. Consequently, slickwater design should be optimized against fracture width, network geometry, particle-size distribution, fluid rheology, pumping schedule and post-treatment cleanup rather than by maximizing flow rate or minimizing viscosity alone.
Crosslinked polymer fluids and other high-viscosity systems generally provide greater sand-carrying capacity and can support higher proppant concentrations at lower flow velocities. They may be advantageous where wide fractures, high areal proppant loading or delayed settling are required, because increased viscosity enhances drag on particles and suppresses gravitational settling [15,21]. Their limitation is that incomplete breaking and cleanup can leave polymer residues, impair proppant-pack permeability, retain fines or alter fluid compatibility. The magnitude of this damage depends on polymer concentration, breaker efficiency, temperature, shut-in duration, formation-water chemistry and the flowback regime. Carrier-fluid selection must therefore balance placement efficiency with post-treatment cleanup. A fluid that performs well at the fracture inlet may still be unsuitable if it leaves residues, fails to transport sand into distal fracture branches or promotes damaging flowback behaviour [23,24].
Numerical transport models are valuable for comparing treatment scenarios, but their predictive power depends on transparent input data and field calibration. Reports should state fluid rheology over the relevant shear-rate and temperature range, proppant density and complete particle-size distribution, injection schedule, fracture geometry, wall roughness assumptions, leakoff and boundary conditions. The modelling approach should also be specified, because Eulerian–Eulerian models are computationally efficient for field-scale calculations, whereas Eulerian–Lagrangian methods can better resolve local particle interactions but require substantially greater computational effort. Modelled proppant placement should be tested against laboratory slot-flow experiments, tracer data, flowback solids, pressure responses or other independent observations whenever possible. Barboza et al. [21] emphasize that simplified transport models may overpredict effective propped length when fracture geometry and particle-scale processes are insufficiently constrained.
4.2. Bed-Load Motion, Bridging and Complex Fractures
Settled proppant particles are not necessarily immobile. When fluid shear stress acting on the upper surface of a deposited bed exceeds the local resistance to motion, particles can roll, slide, rotate or undergo short saltation trajectories. This process, generally termed bed-load transport, may redistribute quartz sand after initial settling and can move particles farther from the inlet even where full suspension is not maintained [15,17]. Bed-load transport is especially relevant to slickwater treatments because quartz sand commonly forms a moving dune or bed rather than remaining uniformly suspended throughout the fracture. As the deposited bed grows, the open flow channel above it narrows, local slurry velocity and shear rate increase, and the transport regime may shift from progressive deposition to renewed particle entrainment. The resulting proppant distribution is therefore dynamic and sensitive to pumping schedule, rather than being fixed at the moment particles first settle. The magnitude of bed-load transport observed in laboratory slots should, however, be scaled cautiously before extrapolation to field fractures [17].
At perforations, fracture inlets, sharp bends, intersections and local aperture restrictions, particles can form stable or transient arches. Once an arch develops, incoming particles accumulate upstream, causing a rapid pressure increase, local sand-bank growth and, in severe cases, screenout that prematurely terminates proppant addition. Bridging is controlled principally by the relationship between particle diameter and local fracture aperture, but it is also affected by particle-size distribution, particle shape, slurry concentration, flow velocity, fluid rheology, wall roughness and fracture-wall deformation [25,26]. A broad size distribution increases the probability that coarse grains lodge at constrictions while finer grains fill the remaining voids; conversely, a narrowly graded proppant may reduce some segregation effects but cannot eliminate bridging in strongly variable fracture apertures. Therefore, no single particle-diameter-to-aperture ratio should be used as a universal bridging criterion across all fluid systems and fracture geometries. Dynamic bridging criteria that incorporate both aperture-to-particle-size ratio and flow conditions are more defensible than a fixed geometric threshold alone [25].
Complex fracture networks add another level of sorting. At a fracture intersection, the carrier-fluid flow divides between the main fracture and one or more secondary branches. Coarser particles have greater inertia and are more likely to continue along the primary flow path or accumulate at turns, whereas finer particles are generally more able to enter narrower secondary fractures when local flow velocity and aperture permit. Laboratory and modelling studies indicate that proppant transfer into a branch is strongly influenced by the intersection angle, branch width, injection rate, fluid viscosity and particle concentration. In particular, the ability of particles to “turn the corner” decreases where the branch aperture is narrow, the intersection angle is unfavourable, or the local velocity is insufficient to overcome settling and wall resistance. Consequently, a fracture network may become selectively propped: wider primary fractures retain coarser grains and higher areal loading, while secondary fractures receive finer material, limited material or no effective proppant at all.
This sorting behaviour has direct implications for treatment design. A staged schedule may place a fine proppant class early to access narrow fracture branches, followed by a coarser, more conductive class once wider primary channels are established. However, the benefit of such a sequence must be verified for the specific reservoir because early fine material can also increase near-wellbore bed height, restrict subsequent coarse-sand transport or intensify flowback of fines. Field-scale design should therefore integrate fracture-width distributions, branch geometry, fluid rheology, proppant concentration history and laboratory transport observations. Li et al. [16] demonstrated experimentally that proppant placement in complex fracture systems is controlled jointly by fracture-intersection geometry, fluid properties, flow rate, sand ratio and particle size; source or nominal mesh class alone cannot predict distribution within a network.
4.3. Scale Translation and Placement Quality
Settled proppant particles are not necessarily immobile. When fluid shear stress acting on the upper surface of a deposited bed exceeds the local resistance to motion, particles can roll, slide, rotate or undergo short saltation trajectories. This process, generally termed bed-load transport, may redistribute quartz sand after initial settling and can move particles farther from the inlet even where full suspension is not maintained [15,17]. Bed-load transport is especially relevant to slickwater treatments because quartz sand commonly forms a moving dune or bed rather than remaining uniformly suspended throughout the fracture. As the deposited bed grows, the open flow channel above it narrows, local slurry velocity and shear rate increase, and the transport regime may shift from progressive deposition to renewed particle entrainment. The resulting proppant distribution is therefore dynamic and sensitive to pumping schedule, rather than being fixed at the moment particles first settle [27]. However, the relative importance of bed-load transport should not be extrapolated directly from laboratory slots to field-scale fractures, because its scaling depends strongly on fracture height, flow geometry and injected proppant volume [17].
At perforations, fracture inlets, sharp bends, intersections and local aperture restrictions, particles can form stable or transient arches. Once an arch develops, incoming particles accumulate upstream, causing a rapid pressure increase, local sand-bank growth and, in severe cases, screenout that prematurely terminates proppant addition. Bridging is controlled principally by the relationship between particle diameter and local fracture aperture, but it is also affected by particle-size distribution, particle shape, slurry concentration, flow velocity, fluid rheology, wall roughness and fracture-wall deformation. A broad size distribution increases the probability that coarse grains lodge at constrictions while finer grains fill the remaining voids; conversely, a narrowly graded proppant may reduce some segregation effects but cannot eliminate bridging in strongly variable fracture apertures. Therefore, no single particle-diameter-to-aperture ratio should be used as a universal bridging criterion across all fluid systems and fracture geometries.
Complex fracture networks add another level of sorting. At a fracture intersection, the carrier-fluid flow divides between the main fracture and one or more secondary branches. Coarser particles have greater inertia and are more likely to continue along the primary flow path or accumulate at turns, whereas finer particles are generally more able to enter narrower secondary fractures when local flow velocity and aperture permit [16,18]. Laboratory and modelling studies indicate that proppant transfer into a branch is strongly influenced by the intersection angle, branch width, injection rate, fluid viscosity and particle concentration [14]. In particular, the ability of particles to “turn the corner” decreases where the branch aperture is narrow, the intersection angle is unfavourable, or the local velocity is insufficient to overcome settling and wall resistance. Consequently, a fracture network may become selectively propped: wider primary fractures retain coarser grains and higher areal loading, while secondary fractures receive finer material, limited material or no effective proppant at all.
This sorting behaviour has direct implications for treatment design. A staged schedule may place a fine proppant class early to access narrow fracture branches, followed by a coarser, more conductive class once wider primary channels are established. However, the benefit of such a sequence must be verified for the specific reservoir because early fine material can also increase near-wellbore bed height, restrict subsequent coarse-sand transport or intensify flowback of fines. Field-scale design should therefore integrate fracture-width distributions, branch geometry, fluid rheology, proppant concentration history and laboratory transport observations. Li et al. [16] demonstrated experimentally that proppant placement in complex fracture systems is controlled jointly by fracture-intersection geometry, fluid properties, flow rate, sand ratio and particle size; source or nominal mesh class alone cannot predict distribution within a network (Table 4).
5. Particle Embedment and Long-Term Fracture Conductivity
5.1. Conductivity and the Time Dimension
Fracture conductivity is commonly expressed as the product of proppant-pack permeability and effective fracture width:
where Cf is fracture conductivity, kf is the permeability of the proppant pack, and ωf is the hydraulically effective width of the supported fracture. This relation clarifies why conductivity can decline rapidly during production even when the bulk proppant material itself appears mechanically competent. Increasing closure stress compacts and rearranges the particle pack, reducing effective width. At the same time, particle breakage and abrasion generate fines that occupy pore throats and lower pack permeability. In deformable formations, proppant embedment into the fracture walls further reduces aperture, alters contact geometry and may create uneven flow channels. Thus, conductivity loss usually reflects coupled changes in both kf and ωf, rather than a single crushing process [3,14].
Short-duration conductivity tests are useful for rapid screening but may overestimate performance during the production period. They can capture immediate compaction and early crushing, yet may not fully resolve progressive grain rearrangement, time-dependent rock-wall deformation, proppant embedment, chemical softening, polymer-residue damage, scale formation or fines migration. The degree of discrepancy between short- and long-term measurements is not constant: it depends on closure-stress history, proppant type and size, pack thickness, reservoir-rock stiffness, temperature, test-fluid chemistry and loading duration. Conductivity should therefore be interpreted as a time- and boundary-condition-dependent property, rather than as a fixed material constant [14,19,28].
Wang et al. [14] compared short- and long-term conductivity measurements using stepwise closure-stress loading and a holding duration exceeding seven hours at each stress level. Their results showed that long-term conductivity was consistently lower than short-term conductivity, reflecting continuing proppant-pack compaction and permeability loss during sustained loading. Although their experiments focused on ceramic proppant, the methodological conclusion applies directly to quartz-sand evaluation: a single conductivity value measured immediately after reaching a target stress is insufficient to represent long-term hydraulic performance. Similar concerns apply to natural sand in weak formations, where time-dependent embedment and stress-sensitive wall deformation may be at least as important as particle crushing.
Long-term conductivity reports should therefore provide the complete stress–time history rather than only a maximum closure-stress value. At minimum, the report should state proppant type and source, sieve distribution, placement concentration or pack thickness, closure-stress increments, loading rate, hold time at each stress point, temperature, test-fluid composition and viscosity, flow rate, rock-plate lithology, test-cell geometry, replicate number and the method used to calculate conductivity. If post-test material is available, particle-size distribution, fines mass, pack-height change, embedment depth and mineralogical alteration should also be documented. Such information allows comparison between studies and distinguishes conductivity loss caused primarily by compaction, crushing, fines plugging, wall embedment or fluid–proppant interaction.
For well-design purposes, laboratory long-term conductivity should be combined with reservoir-specific rock mechanics, effective-stress evolution, expected drawdown, fluid chemistry and flowback conditions. The relevant question is not “what is the conductivity at the highest laboratory stress?” but “how does conductivity evolve over time along the expected stress and fluid history of this particular well?”
5.2. Breakage, Compaction and Fines Migration
Closure load is transmitted through a heterogeneous network of grain-to-grain contacts rather than being uniformly distributed across the proppant pack. Local contact stresses may greatly exceed the applied average closure stress, particularly where particles are angular, poorly sorted or internally fractured. Microcracks, healed fractures, fluid or solid inclusions, residual cement and sharp grain edges therefore act as preferential crack-initiation sites. During the first loading cycle, stress concentration may induce brittle splitting, chipping and abrasion; these processes generate fine fragments even when the bulk quartz content is high and the nominal particle shape appears acceptable [3,5].
Under continued closure stress, both newly formed fragments and surviving coarse grains can rearrange into a denser configuration. Large pore throats progressively become occupied by fines or by smaller particles generated through crushing, reducing pack porosity and permeability. Some fines remain trapped at grain contacts or within pore throats and act as persistent flow restrictions, whereas others are mobilized by flowback or production fluids. Mobile fines may migrate until they deposit in lower-velocity regions, bridge narrow constrictions or accumulate near the wellbore. Consequently, conductivity loss may continue after the initial mechanical loading stage, particularly where stress cycling, pressure drawdown, fluid-chemistry changes or variable flow rates repeatedly disturb the proppant pack [14,29].
The engineering significance of fines is determined not only by total fines mass, but also by generation rate, particle-size distribution, shape, mineral composition, wettability, surface charge, brine salinity and the evolving local flow field. Very fine particles may remain suspended and be produced during early flowback, while intermediate-size particles are more likely to lodge at pore constrictions. Fines generated from weak quartz grains, feldspar remnants, clay coatings or embedded wall-rock fragments may exhibit different transport and retention behaviour. A low initial crush fraction is therefore a useful screening indicator, but it cannot exclude later stress-induced fragmentation, embedment or fines migration. Similarly, high bulk SiO₂ content does not demonstrate mechanical integrity, because the critical defects may occur at grain scale and occupy only a small fraction of the material volume. Long-term evaluation should combine crush testing, post-test particle-size analysis, microscopy of damaged grains, conductivity testing under representative stress, and flowback-fines monitoring.
5.3. Wall Embedment, Residues and Multiphase Flow
Embedment occurs when a proppant grain indents, fractures or becomes partially buried in a deformable fracture wall under closure stress. The resulting loss of fracture aperture can be substantial even where the proppant itself experiences limited crushing. Embedment is promoted by low wall-rock stiffness, high effective stress, small contact area, irregular grain shape, water-induced weakening, elevated temperature, chemical alteration and time-dependent creep. Consequently, a conductivity test using rigid metal plates or highly competent rock may overstate the field performance of quartz sand in shale, coal, mudstone, weakly cemented sandstone or other stress-sensitive formations [3,30].
Embedment does not act independently of other damage mechanisms. Local indentation increases grain-contact stress and can promote particle fracture; wall-derived fragments and crushed proppant fines can enter pore throats; and deformation may redirect flow into a small number of preferential channels. Polymer and crosslinker residues, surfactants, scale, hydrocarbons, emulsions and fines retained during cleanup can further reduce effective permeability. Under high flow velocity, inertial and non-Darcy pressure losses may become important, particularly where the conducting pack has been narrowed by embedment, fines accumulation or uneven proppant placement. Thus, the field-relevant conductivity of a proppant pack reflects coupled mechanical, chemical and hydrodynamic evolution rather than its initial permeability alone.
ISO conductivity procedures provide an essential controlled basis for comparing proppants, but their results should not be interpreted as absolute in-situ conductivity values. Where embedment, residue damage or multiphase flow is credible, project-specific testing should supplement standardized measurements with target reservoir-rock plates, representative brines or flowback fluids, relevant polymer and breaker residues, reservoir temperature, closure-stress cycling and sufficiently long hold periods. Post-test measurements should include pack-width change, embedment depth, particle-size distribution, retained fines, pressure-dependent permeability and, where possible, microscopy of rock–proppant contact zones. This approach allows the dominant cause of conductivity loss to be distinguished among proppant crushing, wall embedment, fluid residue and pore-scale flow restriction [14,19].
6. Resin-Coated, Ceramic and Mixed Proppants
Natural sand, resin-coated sand and ceramic proppants do not have a fixed ranking outside a reservoir-specific engineering context. Natural sand is generally attractive for cost-sensitive, moderate-stress applications because it is widely available, readily classified and capable of providing adequate conductivity where closure stress, embedment risk and fines generation remain limited. Resin-coated sand may improve grain bonding, constrain fines generation and reduce proppant flowback, but its benefit depends on coating continuity, curing behaviour, thermal stability and chemical compatibility with the actual brine, hydrocarbons and treatment-fluid additives. Coating damage, incomplete curing or chemical degradation under hot saline conditions can reduce the intended advantage and may itself introduce permeability impairment.
Ceramic proppants can retain conductivity more effectively under high closure stress because of their greater crush resistance and mechanical stability. However, their higher density, transport behaviour, cost, placement efficiency and effective fracture coverage must be evaluated together. A stronger proppant does not automatically create a more productive fracture if it settles near the wellbore, fails to enter distal branches or occupies only a limited portion of the stimulated fracture network. Thus, material selection should compare retained conductivity, transport distance, embedment resistance, flowback behaviour and cost per unit of effective conductive fracture area, rather than mechanical strength alone [3,14].
Mixed proppants and zoned placement can reduce cost while concentrating stronger ceramic materials in high-stress or near-wellbore domains. However, mixed-pack conductivity is commonly nonlinear with composition. Fine or weak sand fragments can occupy the pore spaces between stronger ceramic particles, and density or size contrasts can cause segregation during pumping and placement. Laboratory testing should therefore assess both the transport-stage distribution and the long-term conductivity of the mixed pack at representative closure stress. Sun et al. [31] showed that the conductivity of quartz-sand–ceramic mixtures lies between the end-member values but varies nonlinearly with particle size, ceramic fraction and closure stress; the optimal mixture cannot be inferred from mass ratio alone.
Figure 2 shows the concept of reservoir-specific selection of natural, resin-coated, ceramic and mixed proppants.
7. Gravel Packing and Frac-Pack Sand Control
Gravel packing uses a sized granular medium to form a permeable mechanical filter around a screen or slotted liner, thereby limiting formation-sand production while maintaining fluid inflow. Design should begin with the complete formation-sand particle-size distribution, including fine tails, sorting, grain angularity, mineral composition and the proportion of mobile fines, rather than with a single characteristic diameter such as (d=50mm). Classical gravel-to-formation-sand size ratios provide a useful initial design range, but they were developed for simplified and relatively uniform unconsolidated sands. They cannot substitute for evaluating formation heterogeneity, fines content, clay sensitivity, screen opening, flow rate, drawdown, completion geometry and actual packing efficiency [8,9].
The gravel pack and the screen must be selected as an integrated filter system. Gravel that is too coarse may allow formation sand to invade the pack; gravel that is too fine may reduce permeability, increase skin and become more susceptible to plugging by fines, scale or residual completion fluid. Similarly, an inappropriate screen opening can either permit gravel production or create excessive flow resistance. Formation-sand retention should therefore be demonstrated by representative sand-retention and flow testing, particularly for poorly sorted reservoirs or formations with abundant mobile fines. The relevant performance criterion is not merely initial pack permeability, but sustained sand control and inflow under the expected drawdown, fluid chemistry and stress history.
In frac-pack completions, the engineering task is more demanding because stimulation and sand control must be achieved simultaneously. The near-wellbore fracture must retain adequate conductivity, whereas the screen annulus and perforated interval must remain continuously packed to establish an effective sand-control barrier. Pumping rate, slurry viscosity, proppant/gravel concentration, settling, bridging, perforation geometry and fill completeness must consequently be designed as a coupled system. An incomplete pack may permit sand production and local erosion, whereas premature bridging or screenout may prevent effective fracture placement. Frac-pack design should therefore combine formation-sand analysis, screen–gravel compatibility tests, proppant transport modelling, pressure monitoring and post-treatment production surveillance rather than relying solely on a conventional grain-size ratio.
Figure 3 shows conceptual comparison of gravel packing and frac-pack completion for sand control and conductive-flow management.
8. Quartz Flour in High-Temperature Oil-Well Cementing and Produced-Water Filtration
8.1. High-Temperature Cementing
At elevated temperature, Portland-cement systems may undergo strength retrogression because metastable calcium-silicate-hydrate (C–S–H) products progressively transform and the effective Ca/Si ratio, pore structure and phase assemblage evolve unfavourably. In oil, gas and geothermal wells, this process can reduce compressive strength and elastic modulus while increasing water and gas permeability, thereby compromising long-term zonal isolation. Fine quartz flour is therefore commonly incorporated as a silica source to regulate hydrothermal hydration reactions, lower the effective Ca/Si ratio and promote comparatively stable calcium-silicate-hydrate assemblages, including tobermorite- and xonotlite-bearing products. Its function is chemical as well as physical: silica dissolution, ionic transport and nucleation occur simultaneously and are strongly conditioned by temperature, pressure, curing duration, water-to-cement ratio and admixture chemistry.
However, silica addition is not a simple “more is better” solution. Long-duration curing of silica-enriched Class G cement at 200 °C and 50 MPa still produced pronounced microstructural coarsening, permeability increase and strength loss, demonstrating that short-term strength or sonic measurements alone cannot establish long-term thermal stability [10]. Particle size is likewise non-linear in its effect. Under 260 °C and 21 MPa, cement modified with 200-mesh silica flour showed higher long-term compressive strength than systems containing much finer 1000-mesh flour; enhanced silica release from the latter altered Ca²⁺ transport and hydration kinetics in an unfavourable way [11]. Accordingly, the performance of quartz flour should be assessed through an integrated evidence set comprising compressive strength, permeability, phase assemblage, pore-size distribution and microstructure over a curing interval representative of the target well.
For formulation design, the key variables are silica dosage, crystalline state and reactivity, particle-size distribution, mixing sequence, curing path and the availability of calcium and water. At 260 °C and 21 MPa, silica content and the crystalline versus fused state of SiO₂ produced substantially different strength–permeability outcomes, confirming that a nominal silica percentage cannot be transferred directly among formulations [33]. Recent work further indicates that combined fly ash–silica systems may reduce the long-term retrogression of cements set and cured at 200 °C and 50 MPa, but this strategy should be validated with reservoir-specific pressure, thermal history and fluid conditions rather than adopted as a universal recipe [10,11,33].
Figure 4 shows conceptual control of high-temperature Portland-cement performance by quartz-flour dosage and particle-size distribution.
8.2. Produced-Water Filtration
Quartz filter sand removes suspended solids primarily by straining, interception, sedimentation within pore constrictions, and attachment to grain surfaces throughout the filter bed. Unlike a simple screen, an adequately designed sand bed provides depth filtration: particles may be retained progressively from the upper bed to deeper zones until deposit accumulation causes an unacceptable head-loss increase. The relevant material descriptors are therefore effective size (commonly d10), uniformity coefficient ((Cμ =d60/d10), grain shape, bed depth, porosity, cleanliness and resistance to attrition during repeated backwash cycles. Smaller and more uniform grains generally provide greater surface area and finer retention, but may shorten filter runs and demand greater pumping energy; coarser media can extend run duration but may permit more particle breakthrough. Media selection must consequently be integrated with influent particle-size distribution, solids loading, filtration velocity and the required effluent quality rather than specified through SiO₂ content alone.
For produced-water, reinjection-water and oily-wastewater treatment, oil droplets, iron-rich solids, scale precursors, organic films and microbial growth can alter quartz-surface wettability, block pore throats and accelerate pressure loss. The filter therefore requires operational evidence in addition to virgin-media characterization: influent oil and suspended-solids concentrations, differential-pressure development, breakthrough behaviour, backwash expansion, wash-water demand, turbidity recovery and residual fouling after repeated cycles should all be reported. Quartz is mechanically robust and generally chemically stable under ordinary water-treatment conditions, but untreated quartz sand is not intrinsically optimized for every oil–water system; modification of quartz-sand wettability can measurably change oil-removal performance, illustrating the importance of surface state rather than bulk mineral identity alone [34].
Filter sand and fracturing sand should thus be treated as distinct engineered products. Sphericity, acid solubility and crush resistance remain useful descriptive properties, but their acceptance limits cannot be transferred directly from hydraulic-fracturing specifications. Fracturing sand is selected to preserve conductivity under closure stress, whereas filter sand is qualified by hydraulic loading, particulate retention, head-loss development, cleanability, media loss and stable cyclic performance. Column-scale testing using representative water and a defined backwash protocol is the most defensible bridge between sieve data and field performance. Experimental results show that changes in effective size and uniformity coefficient can substantially alter filter-run duration and the backwash intensity required for bed expansion [13,35,36].
Figure 5 shows the conceptual mechanisms and qualification boundaries of quartz filter sand for deep-bed filtration.
9. Regional Supply, Environmental Health and Life-Cycle Considerations
Fracturing sand is a bulk, comparatively low-unit-value industrial mineral; accordingly, delivered cost is often governed as much by logistics as by mine-gate processing. Rail access, transload capacity, truck-haul distance, destination congestion, storage time and final transfer to the blender should therefore be treated as design variables rather than secondary commercial details. A nearby source can reduce haulage, inventory and handling exposure, but it may also involve a less mature geological resource or a plant with limited process control. Resource due diligence should establish mineable reserve, stripping ratio, raw-sand grain-size distribution, roundness, interbedded clay or carbonate layers, beneficiation yield, water balance and seasonal production constraints. Plant due diligence should further verify screening capacity, drying efficiency, dust collection, silo segregation, load-out sampling, retained samples and the documented disposition of nonconforming material. Product prices must always be reported with a date, region, sieve class, quantity, delivery boundary, contract term and transport mode; a spot price from another basin or year is not a transferable engineering parameter.
Crystalline silica dust may be generated during mining, crushing, drying, screening, pneumatic conveyance, transloading and wellsite handling. IARC classifies respirable crystalline silica dust in the form of quartz or cristobalite as carcinogenic to humans (Group 1), with silicosis and lung cancer being central occupational-health concerns IARC, 2012. Hydraulic-fracturing operations are particularly relevant because sand transfer, filling of sand movers, conveyor discharge and blender-hopper agitation are recognized dust-emission sources; field monitoring has documented worker exposures above occupational limits at such locations OSHA and NIOSH, 2012. The preferred risk-control hierarchy is therefore source control and containment: enclosed or low-drop transfer points, sealed hatches, local exhaust or negative-pressure dust collection, wet cleaning, traffic control and exposure monitoring. Respiratory protection is necessary where residual exposure requires it, but should be selected from measured exposure conditions and implemented as a supplement—not a substitute—for engineering controls.
Returned or flowback sand should not be considered reusable solely because its bulk SiO₂ content remains high. It can carry hydrocarbons, concentrated salts, residual fracturing additives, scale, trace metals and, in some basins, naturally occurring radioactive materials. Flowback-water chemistry is temporally variable and requires well- and basin-specific characterization before treatment or reuse decisions are made [36,37]. A defensible reuse protocol should document particle-size distribution, residual fines, sphericity and crushing response, together with hydrocarbon, salt, metal and radionuclide screening; it should also test leaching behaviour and confirm whether the recovered grains remain suitable for their proposed end use. Where these data are absent, recovered sand should be managed as a potentially contaminated process residue rather than presumed to be a qualified proppant.
10. Project-Based Material Selection and Quality Assurance
The second stage is batch qualification. Standard tests establish a common baseline for sieve distribution, turbidity, acid solubility, sphericity, roundness, bulk density and crush resistance, but they cannot independently predict in-situ lifetime [5,6]. The selected materials should therefore undergo long-term conductivity testing under target rock plates, representative temperature, formation brine or treatment-fluid residues, realistic stress history and a defined testing duration. Where shale or weakly cemented formations are involved, embedment and wall-softening tests are particularly important. Reports should state all boundary conditions, replicates and variability, because a nominally identical sieve class can behave differently owing to source mineralogy, microcracks, morphology, placement concentration and storage condition [3,14].
The final decision should integrate engineering performance with full-system economics. The relevant comparison is not simply mine-gate price per tonne, but the combined cost of material purchase, rail or road transport, storage, blending, pumping, chemical system, flowback management, disposal and the expected incremental production associated with sustained conductivity. A cheaper local sand may be preferable at moderate stress if transport and storage savings outweigh any modest performance difference; conversely, stronger ceramic or coated materials may be justified only where their additional conductivity, flowback control or reliability produces a measurable economic return. This project-based workflow provides a transparent basis for selecting quartz sand without treating any single laboratory indicator as a universal acceptance criterion.
Table 5 is Project-based decision sequence for quartz-sand selection.
Each batch should carry a unique identifier that links the finished product to its mine source, extraction domain, production date, processing line, sieve configuration, washing and drying conditions, silo, transport unit, site silo and assigned fracture stage. This traceability chain is essential because apparently identical sieve classes can differ in grain morphology, fines content, surface contamination and crush response after a change in raw material or plant operation. At minimum, sampling should include a production retained sample, an arrival-verification sample and a sealed arbitration sample. A change in mine source, screen condition, washing reagent, drying regime, storage silo or resin-coating formulation should trigger documented revalidation rather than being treated as routine batch variation.
Reports should clearly distinguish standard-property results from project-conditioned performance results. Standard data provide inter-batch comparability; conductivity, embedment and flowback tests must additionally report rock plates, stress history, temperature, fluid composition, duration, replicate number and uncertainty. Original conductivity-versus-time and conductivity-versus-stress series should be retained rather than reduced to a single terminal value. For mixed proppants, the mass ratio, particle-size distributions, mixing method and homogeneity verification are required; for resin-coated sand, coating mass, cure schedule and coating integrity must be specified. Gravel-pack reports require the complete formation-sand particle-size distribution, screen specification and pack design basis. High-temperature cementing silica must be reported with dosage, particle size, crystalline state, water/cement ratio, pressure–temperature path and curing duration. This information set is consistent with the principle that proppant performance is conditional on material identity and test boundaries, rather than an inherent constant of a nominal product grade [5,6,14].
Table 6 is the minimum information set for proppant research and procurement reports.
11. Scientific Appraisal and Future Research
A central scientific challenge is translating laboratory particle properties into reservoir-scale predictions of long-term fracture conductivity and hydrocarbon production. Single-particle strength, crush fraction, roundness, sphericity and acid solubility are useful for screening and batch comparison, yet none independently predicts the time-dependent conductivity of a propped fracture. The evidence chain commonly breaks between laboratory cells and the reservoir because direct constraints on actual proppant placement, fracture-width heterogeneity, wall embedment, polymer-residue distribution, stress cycling, multiphase flow and evolving effective stress are limited. Consequently, a high crush resistance or favourable morphology should be interpreted as a conditional indicator, not as proof of field performance. Future work should combine mineralogical and mechanical characterization, slot-scale fracture-flow experiments, geomechanical modelling and field diagnostics such as pressure responses, tracers, flowback solids and production history. The objective is to identify which indicators are transferable across scales and which remain valid only under specified stress, fluid, temperature and rock-boundary conditions [3,7,14].
Natural quartz sand is not a chemically or structurally uniform collection of inert grains. Clay coatings, iron oxides, feldspar fragments, heavy-mineral remnants, microcracks, healed fractures and intragranular inclusions can influence turbidity, acid solubility, grain breakage, fines generation and chemical compatibility with fracturing fluids. The appropriate role of materials geology is therefore not to apply the extreme purification criteria used for semiconductor-grade high-purity quartz, but to identify the impurity or defect that controls the critical failure mode under a given well condition. For example, a thin iron-rich coating may affect fluid compatibility or scale-related reactions, whereas a through-going microcrack may determine first-loading fragmentation and subsequent pore-throat plugging under high closure stress. Similarly, a small fraction of weak, altered grains may have little effect on bulk SiO₂ concentration but disproportionately influence fines generation and long-term pack permeability. Mineralogical, microscopic and image-based analysis should consequently accompany bulk chemistry and standard sieve tests.
Reproducibility requires full disclosure of material provenance and test boundaries. Reports should specify mine source, processing route, sieve class, sample mass, particle-size distribution, storage condition, fluid composition, loading rate, temperature–pressure path, calibration procedure, replicate number, uncertainty treatment and data-reduction rules. Long-term conductivity should be published as original time-series and stress-step data, rather than as a single terminal value; this preserves information on transient compaction, delayed embedment and progressive permeability loss. Negative outcomes from thermal treatment, resin coating, mixed placement or alternative carrier fluids are likewise valuable because they define failure boundaries and prevent repeated unproductive optimisation. Standard methods provide essential comparability, but project-conditioned tests are necessary whenever target rock, temperature, brine chemistry or stress history differ materially from the standard configuration [5,6].
Finally, proppant optimisation should be evaluated through material efficiency rather than a single performance maximum. Proppant consumption, mine-to-well transport, storage, pumping energy, fluid-system cost, flowback treatment or disposal, retained conductivity and cumulative production must be assessed in one integrated framework. A stronger or more expensive material is justified only if its improved placement, conductivity retention or flowback control creates a demonstrable production or risk-reduction benefit. Conversely, the lowest unit-cost sand is not necessarily optimal if it produces excessive fines, poor placement or early conductivity loss. This system-level approach links quartz geology, process control, fracture engineering and field economics, and offers a more defensible basis for both research priorities and procurement decisions.
12. Conclusions
Quartz sand is used principally as a hydraulic-fracturing proppant, but gravel packing, frac-pack operations, high-temperature cementing and produced-water filtration use different particle sizes and functional forms. High quartz content establishes only a basic mineral condition; it cannot substitute for evaluation of size, morphology, cleanliness, breakage and long-term conductivity.
The value of a proppant depends on delivery and long-term retention of conductivity. Particle size and density control settling and fracture access; rheology and rate control carriage; roughness and intersections control sorting and bridging; after pumping, breakage, wall embedment, fines migration, residues, multiphase and non-Darcy flow and stress cycling jointly reduce effective conductivity. Natural sand, resin-coated sand and ceramic proppants should therefore be compared under the target well rather than assigned a universal ranking.
API Std 19C and ISO 13503-2:2024 should be used for baseline characterization, and ISO 13503-5:2006 can organize long-term conductivity comparison. Target rock plates, realistic fluids, residues, multiphase conditions and cycling should be added where relevant. Batch traceability, construction-data review, crystalline-silica dust control and flowback-sand contaminant characterization belong in the same quality system.
Author Contributions
Conceptualization, Xiaoyong Yang, methodology, Siyu Li and Xiayong Yang; software, Siyu Li; validation, Xiaoyong Yang and Siyu Li; formal analysis, Siyu Li; investigation, Xiaoyong Yang and Siyu Li.; resources, Xiaoyong Yang and Siyu Li; writing—original draft preparation, Xiaoyong Yang and Siyu Li.; writing—review and editing, Xiaoyong Yang; visualization, Xiaoyong Yang and Siyu Li; supervision, Xiaoyong Yang ; project administration, Xiaoyong Yang; funding acquisition, Xiaoyong Yang. All authors have read and agreed to the published version of the manuscript.”.
Funding
This research was supported by the National Key R&D Program for Strategic Mineral Resources Development and Utilization (2024YFC2910101) and the Strategic Priority Research Program of the Chinese Academy of Sciences (XDA0430301).
Conflicts of Interest
The author declares no conflict of interest.
References
- Liang, F.; Sayed, M.; Al-Muntasheri, G.A.; Chang, F.F.; Li, L. A comprehensive review on proppant technologies. Petroleum 2016, 2, 26–39. [Google Scholar] [CrossRef]
- Palisch, T.T.; Duenckel, R.J.; Bazan, L.W.; Heidt, J.H.; Turk, G.A. Determining realistic fracture conductivity and understanding its impact on well performance: Theory and field examples. In Proceedings of the SPE Hydraulic Fracturing Technology Conference, College Station, TX, USA, 29–31 January 2007; p. SPE-106301-MS. [Google Scholar] [CrossRef]
- Bandara, K.M.A.S.; Ranjith, P.G.; Rathnaweera, T.D. Improved understanding of proppant embedment behavior under reservoir conditions: A review study. Powder Technol. 2019, 352, 170–192. [Google Scholar] [CrossRef]
- Wei, S.; Wang, C.; Gao, L.; Chen, H. Effect of calcination and water quenching on the removal of gas–liquid inclusions from high-purity quartz and the underlying mechanism. Minerals 2026, 16, 820. [Google Scholar] [CrossRef]
- 5; American Petroleum Institute. API Standard 19C: Measurement of and Specifications for Proppants Used in Hydraulic Fracturing and Gravel-Packing Operations, 2nd ed.; American Petroleum Institute: Washington, DC, USA, 2018. [Google Scholar]
- 6. International Organization for Standardization. ISO 13503-2:2024 Oil and Gas Industries Including Lower Carbon Energy—Completion Fluids and Materials—Part 2: Measurement of Properties of Proppants Used in Hydraulic Fracturing and Gravel-Packing OperationsInternational Organization for Standardization, 2nd ed.; Geneva, Switzerland, 2024. [Google Scholar]
- Ramlan, A.S.; Zin, R.M.; Abu Bakar, N.F.; Othman, N.H. Recent progress on proppant laboratory testing method: Characterisation, conductivity, transportation, and erosivity. J. Pet. Sci. Eng. 2021, 205, 108871. [Google Scholar] [CrossRef]
- Saucier, R.J. Considerations in gravel pack design. J. Pet. Technol. 1974, 26, 205–212. [Google Scholar] [CrossRef]
- Matanović, D.; Čikeš, M.; Moslavac, B. Sand Control in Well Construction and Operation; Springer: Berlin, Germany, 2012. [Google Scholar] [CrossRef]
- Pang, X.; Qin, J.; Sun, L.; Zhang, G.; Wang, H. Long-term strength retrogression of silica-enriched oil well cement: A comprehensive multi-approach analysis. Cem. Concr. Res. 2021, 144, 106424. [Google Scholar] [CrossRef]
- Jiang, T.; Geng, C.; Yao, X.; Song, W.; Dai, D.; Yang, T. Long-term thermal performance of oil well cement modified by silica flour with different particle sizes in HTHP environment. Constr. Build. Mater. 2021, 303, 123701. [Google Scholar] [CrossRef]
- Cheng, G.; Pang, X.; Sun, J.; Qiu, Z.; Wang, C.; Qin, J.; Li, N. Combined use of fly ash and silica to prevent the long-term strength retrogression of oil well cement set and cured at HPHT conditions. Pet. Sci. 2024, 21, 1122–1134. [Google Scholar] [CrossRef]
- Kim, T.H.; Oh, H.; Eom, J.; Park, C.H. A column study of effect of filter media on the performance of sand filter. Membr. Water Treat. 2020, 11, 247–255. [Google Scholar] [CrossRef]
- Wang, J.; Xiong, Y.; Jiao, G.; Lei, D. Assessment of long-term proppant conductivity. Front. Energy Res. 2022, 10, 813571. [Google Scholar] [CrossRef]
- Yao, S.; Chang, C.; Hai, K.; Huang, H.; Li, H. A review of experimental studies on the proppant settling in hydraulic fractures. J. Pet. Sci. Eng. 2022, 208, 109211. [Google Scholar] [CrossRef]
- Li, N.; Li, J.; Zhao, L.; Luo, Z.; Liu, P.; Guo, Y. Laboratory testing on proppant transport in complex-fracture systems. SPE Prod. Oper. 2017, 32, 382–391. [Google Scholar] [CrossRef]
- McClure, M. Bed load proppant transport during slickwater hydraulic fracturing: Insights from comparisons between published laboratory data and correlations for sediment and pipeline slurry transport. J. Pet. Sci. Eng. 2018, 161, 599–610. [Google Scholar] [CrossRef]
- Sahai, R.; Moghanloo, R.G. Proppant transport in complex fracture networks—A review. J. Pet. Sci. Eng. 2019, 182, 106199. [Google Scholar] [CrossRef]
- International Organization for Standardization. ISO 13503-5:2006 Petroleum and Natural Gas Industries—Completion Fluids and Materials—Part 5: Procedures for Measuring the Long-Term Conductivity of Proppants; International Organization for Standardization. Geneva, Switzerland, 2006.
- Katende, A.; O’Connell, L.; Rich, A.; Rutqvist, J.; Radonjic, M. A comprehensive review of proppant embedment in shale reservoirs: Experimentation, modeling and future prospects. J. Nat. Gas. Sci. Eng. 2021, 95, 104143. [Google Scholar] [CrossRef]
- Barboza, B.R.; Chen, B.; Li, C. A review on proppant transport modelling. J. Pet. Sci. Eng. 2021, 204, 108753. [Google Scholar] [CrossRef]
- Stokes, G.G. On the effect of the internal friction of fluids on the motion of pendulums. Trans. Camb. Philos. Soc. 1851, 9, 8–106. [Google Scholar]
- Al-Muntasheri, G.A. A critical review of hydraulic-fracturing fluids for moderate- to ultralow-permeability formations over the last decade. SPE Prod. Oper. 2014, 29, 243–260. [Google Scholar] [CrossRef]
- Geng, C.; Mei, Z.; Yao, X.; Wang, C.; Lu, D.; Chen, W. Effect of the crystalline state of SiO2 on the compressive strength of cement paste at HTHP. Constr. Build. Mater. 2023, 362, 129787. [Google Scholar] [CrossRef]
- Garagash, I.A.; Osiptsov, A.A.; Boronin, S.A. Dynamic bridging of proppant particles in a hydraulic fracture. Int. J. Eng. Sci. 2019, 135, 86–101. [Google Scholar] [CrossRef]
- Su, X.; Fan, J.; Wang, R.; Wang, L.; Zhao, F. An experimental study on factors controlling the proppant transport in hydraulic fractures of coal reservoirs. Coal Geol. Explor. 2023, 51, 62–73. [Google Scholar]
- Fernández, M.E.; Sánchez, M.; Pugnaloni, L.A. Proppant transport in a scaled vertical planar fracture: Vorticity and dune placement. J. Pet. Sci. Eng. 2019, 173, 1382–1389. [Google Scholar] [CrossRef]
- Wei, J.; Wang, X.; Fu, X.; Gong, P.; Zhou, X.; Li, Y.; Yang, Y.; Chen, Y.; Jia, B.; Wu, J. Optimization of long-term fracture conductivity with quartz: An experimental investigation. Front. Energy Res. 2022, 10, 973349. [Google Scholar] [CrossRef]
- Fan, M.; Chen, C. Numerical simulation of the migration and deposition of fine particles in a proppant-supported fracture. J. Pet. Sci. Eng. 2020, 194, 107484. [Google Scholar] [CrossRef]
- Liu, C.; Wang, W.; Wang, H.; Zhu, C.; Ren, B. A review on removal of iron impurities from quartz mineral. Minerals 2023, 13, 1128. [Google Scholar] [CrossRef]
- Sun, H.; He, B.; Xu, H.; Zhou, F.; Zhang, M.; Li, H.; Yin, G.; Chen, S.; Xu, X.; Li, B. Experimental investigation on the fracture conductivity behavior of quartz sand and ceramic mixed proppants. ACS Omega 2022, 7, 10243–10254. [Google Scholar] [CrossRef] [PubMed]
- Jatykov, T.; Sagindykov, B.; Bimuratkyzy, K. Hydraulic fracturing design improvements by proppant flowback mitigation method application during hydrocarbon production. Rud.-Geol.-Naft. Zb. 2021, 36, 87–100. [Google Scholar] [CrossRef]
- Cheng, G.; Pang, X.; Wang, H.; Sun, J.; Qiu, Z. Anti-strength retrogression cementing materials for deep and ultra-deep wells. Constr. Build. Mater. 2024, 411, 134407. [Google Scholar] [CrossRef]
- Wei, B.; Liu, J.; Wang, G.; Chang, Q. Filtration of oil from oily wastewater via hydrophobic modified quartz sand filter medium. J. Water Reuse Desalin. 2018, 8, 544–552. [Google Scholar] [CrossRef]
- Maiyo, J.K.; Dasika, S.; Jafvert, C.T. Slow sand filters for the 21st century: A review. Int. J. Environ. Res. Public Health 2023, 20, 1019. [Google Scholar] [CrossRef] [PubMed]
- Rosenblum, J.; Nelson, A.W.; Ruyle, B.; Schultz, M.K.; Ryan, J.N.; Linden, K.G. Temporal characterization of flowback and produced water quality from a hydraulically fractured oil and gas well. Sci. Total Environ. 2017, 596–597, 369–377. [Google Scholar] [CrossRef] [PubMed]
- Oetjen, K.; Chan, K.E.; Poulsen, K.G.; Christensen, J.H.; Blotevogel, J.; Borch, T.; Spear, J.R.; Cath, T.Y.; Higgins, C.P. Temporal characterization and statistical analysis of flowback and produced waters and their potential for reuse. Sci. Total Environ. 2018, 619–620, 654–664. [Google Scholar] [CrossRef] [PubMed]
Figure 1.
Conceptual pathway from surface blending of quartz fracturing sand to fracture support (after [15,16,17]). Caption: Graded quartz fracturing sand is transported from surface storage and blending equipment into the wellbore with a carrier fluid, then enters hydraulically generated fractures. During pumping, particle placement is governed by slurry velocity, fluid rheology, particle size, density, fracture aperture, wall roughness, gravity-driven settling, particle collision and the development of a deposited sand bed. After pumping ceases and reservoir pressure declines, the fracture tends to close under in-situ stress. The proppant pack forms a load-bearing granular skeleton that maintains an effective fracture width and hydraulically connected pore space, thereby sustaining conductivity. Actual placement can be heterogeneous because of settling, bed-load transport, bridging at constrictions, stress-dependent embedment and fines generation. Fracture geometry, particle dimensions and flow paths are schematic and are not to scale.
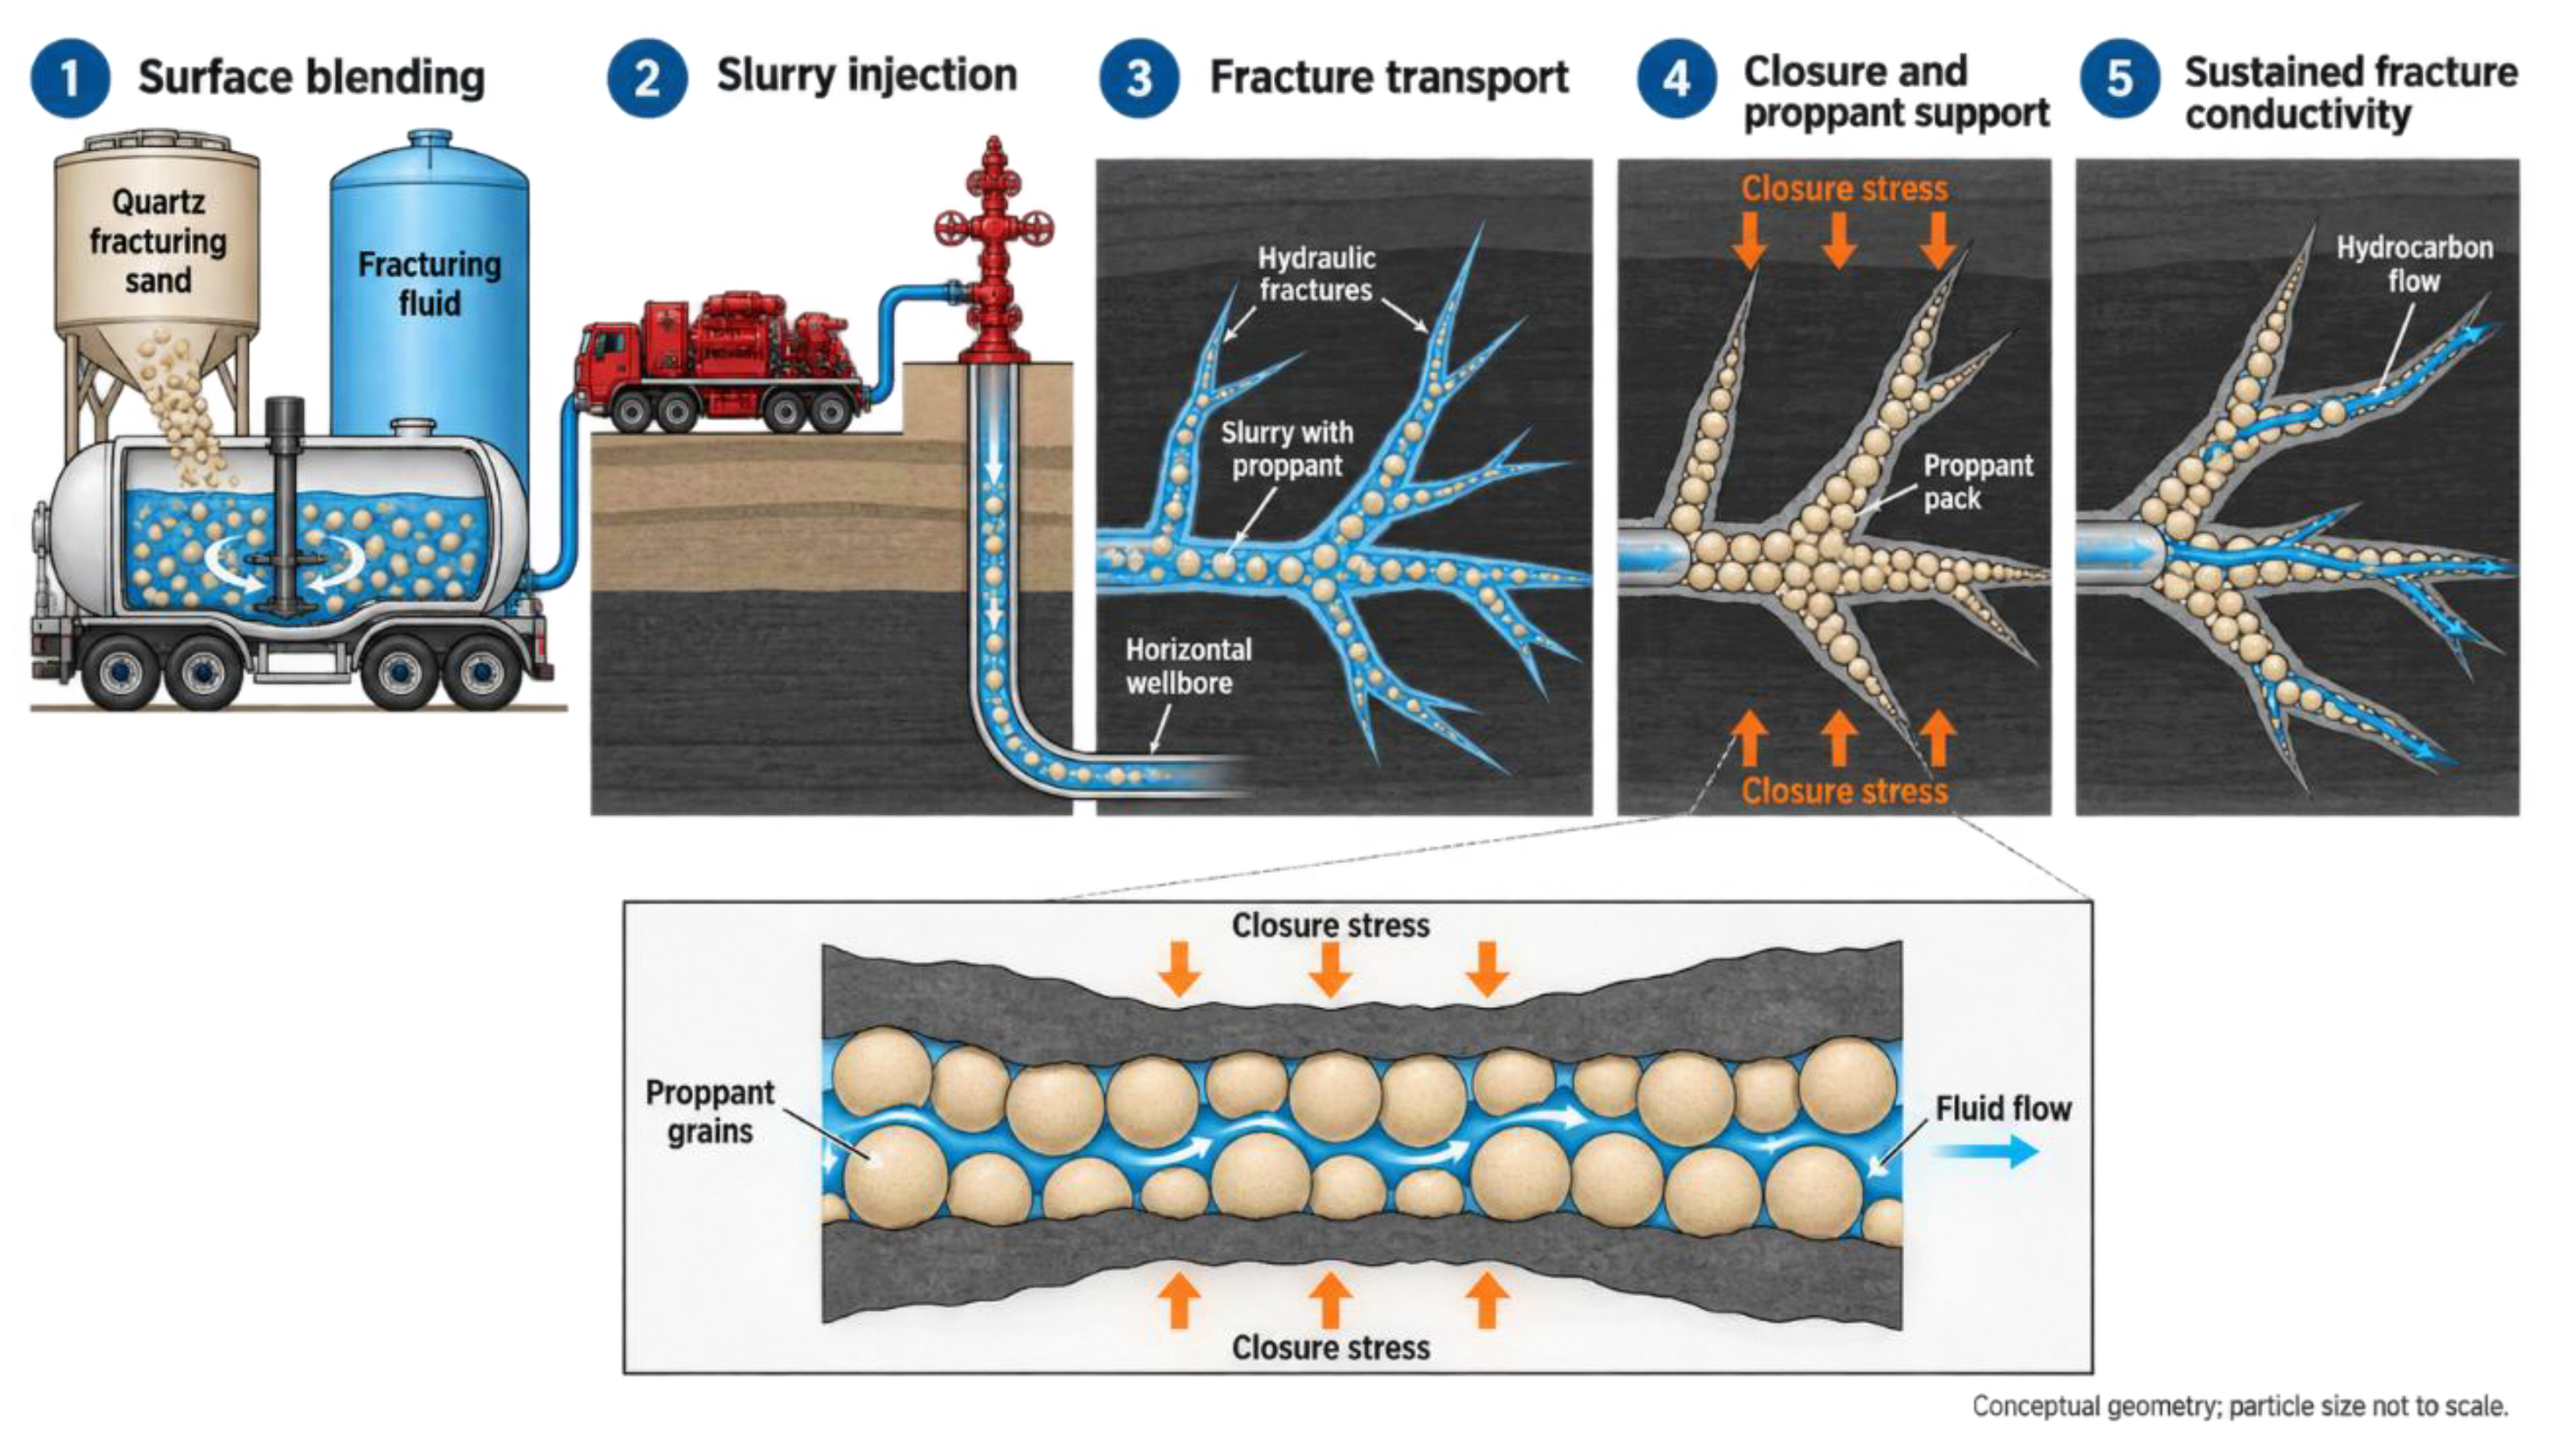
Figure 2.
Reservoir-specific selection of natural, resin-coated, ceramic and mixed proppants (after [7,24,31,32]). Caption: Conceptual comparison of the principal advantages and limitations of proppant categories under contrasting reservoir conditions. Natural sand is generally suited to moderate closure stress and cost-sensitive treatments; resin-coated sand may mitigate fines generation and proppant flowback, provided that coating integrity and curing are verified under reservoir temperature and brine conditions. Ceramic proppant offers higher mechanical strength for high-stress applications, whereas its particle-size distribution, density, transport efficiency and cost require site-specific assessment. Mixed or zoned placement can combine materials strategically, but segregation during pumping and the conductivity of m.
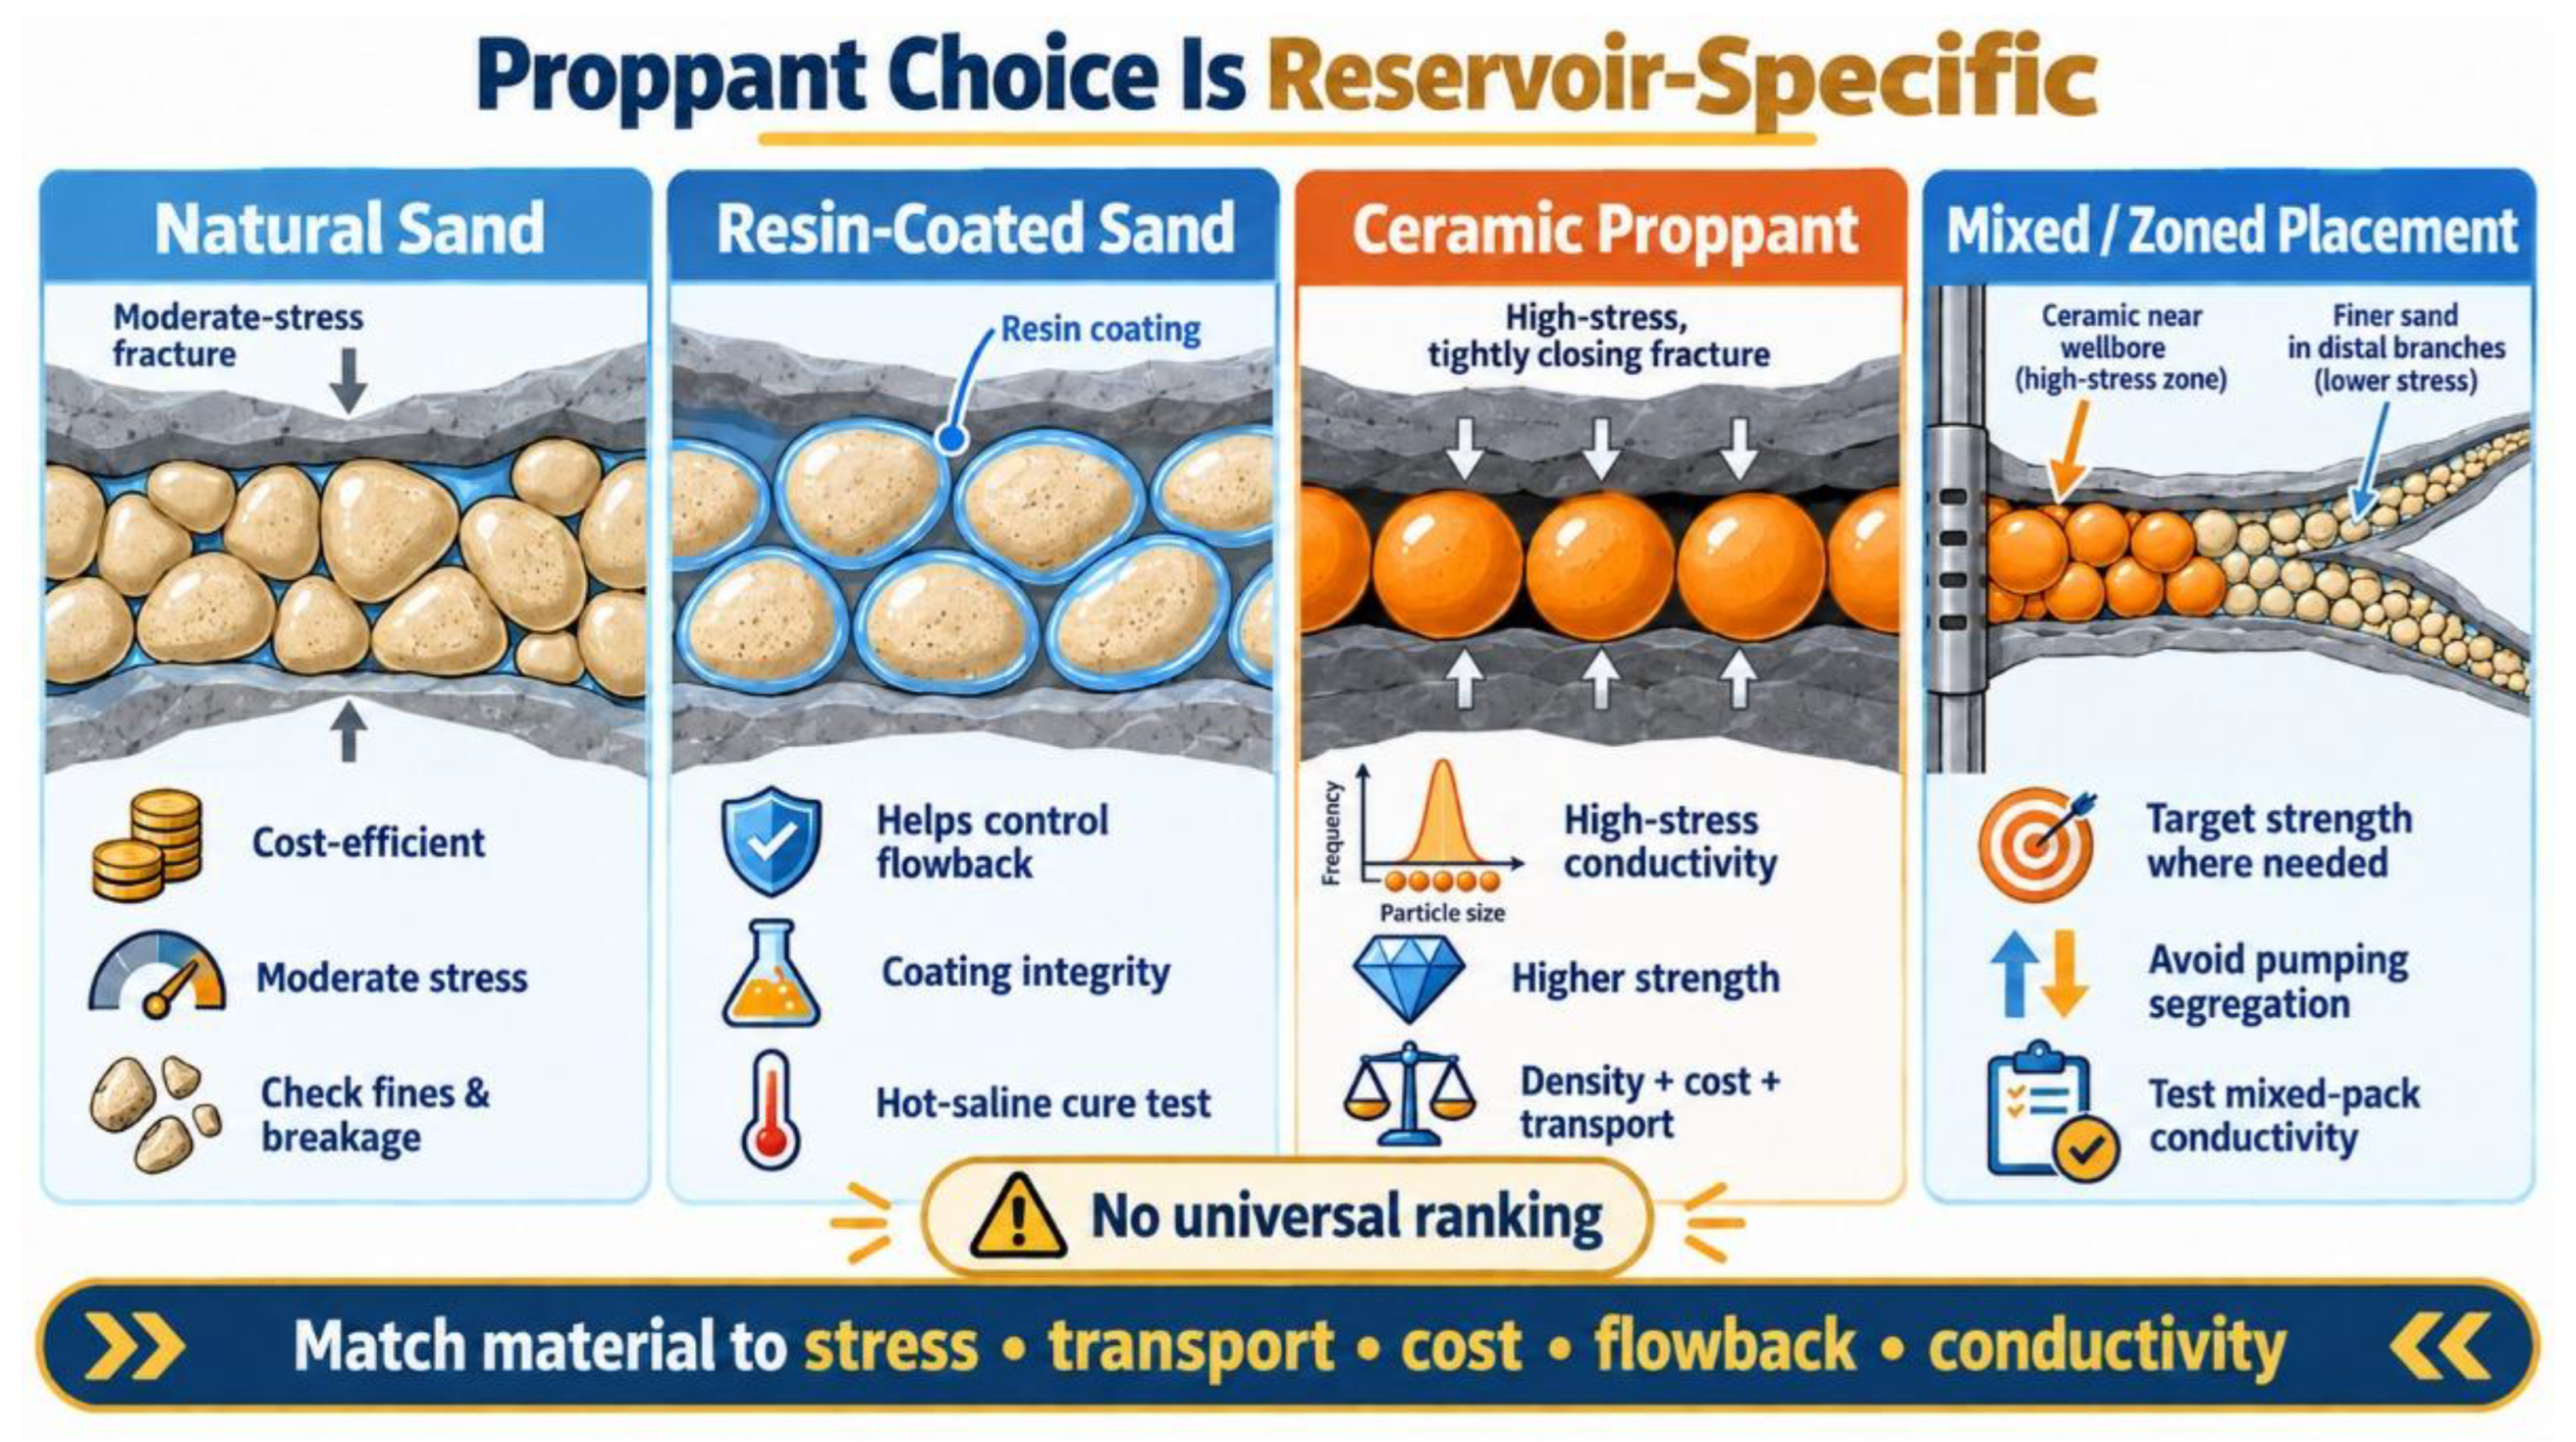
Figure 3.
Conceptual comparison of gravel packing and frac-pack completion for sand control and conductive-flow managemen (after [8,9]). Caption: (a) In gravel packing, a graded granular medium forms a permeable filter around the screen. Formation fluid passes through the gravel pack and screen, whereas formation-sand grains are retained outside the pack. Gravel selection should be based on the complete formation-sand size distribution, screen compatibility, fines content and the continuity of the packed annulus, rather than on a single characteristic grain diameter. (b) In frac-pack completion, a proppant-filled hydraulic fracture provides a conductive near-wellbore flow path, while the gravel-packed screen region maintains a continuous sand-control barrier. Successful treatment requires coordinated control of pumping, particle settling, bridging and fill completeness. Fracture geometry, grain size and particle distribution are schematic and not to scale.
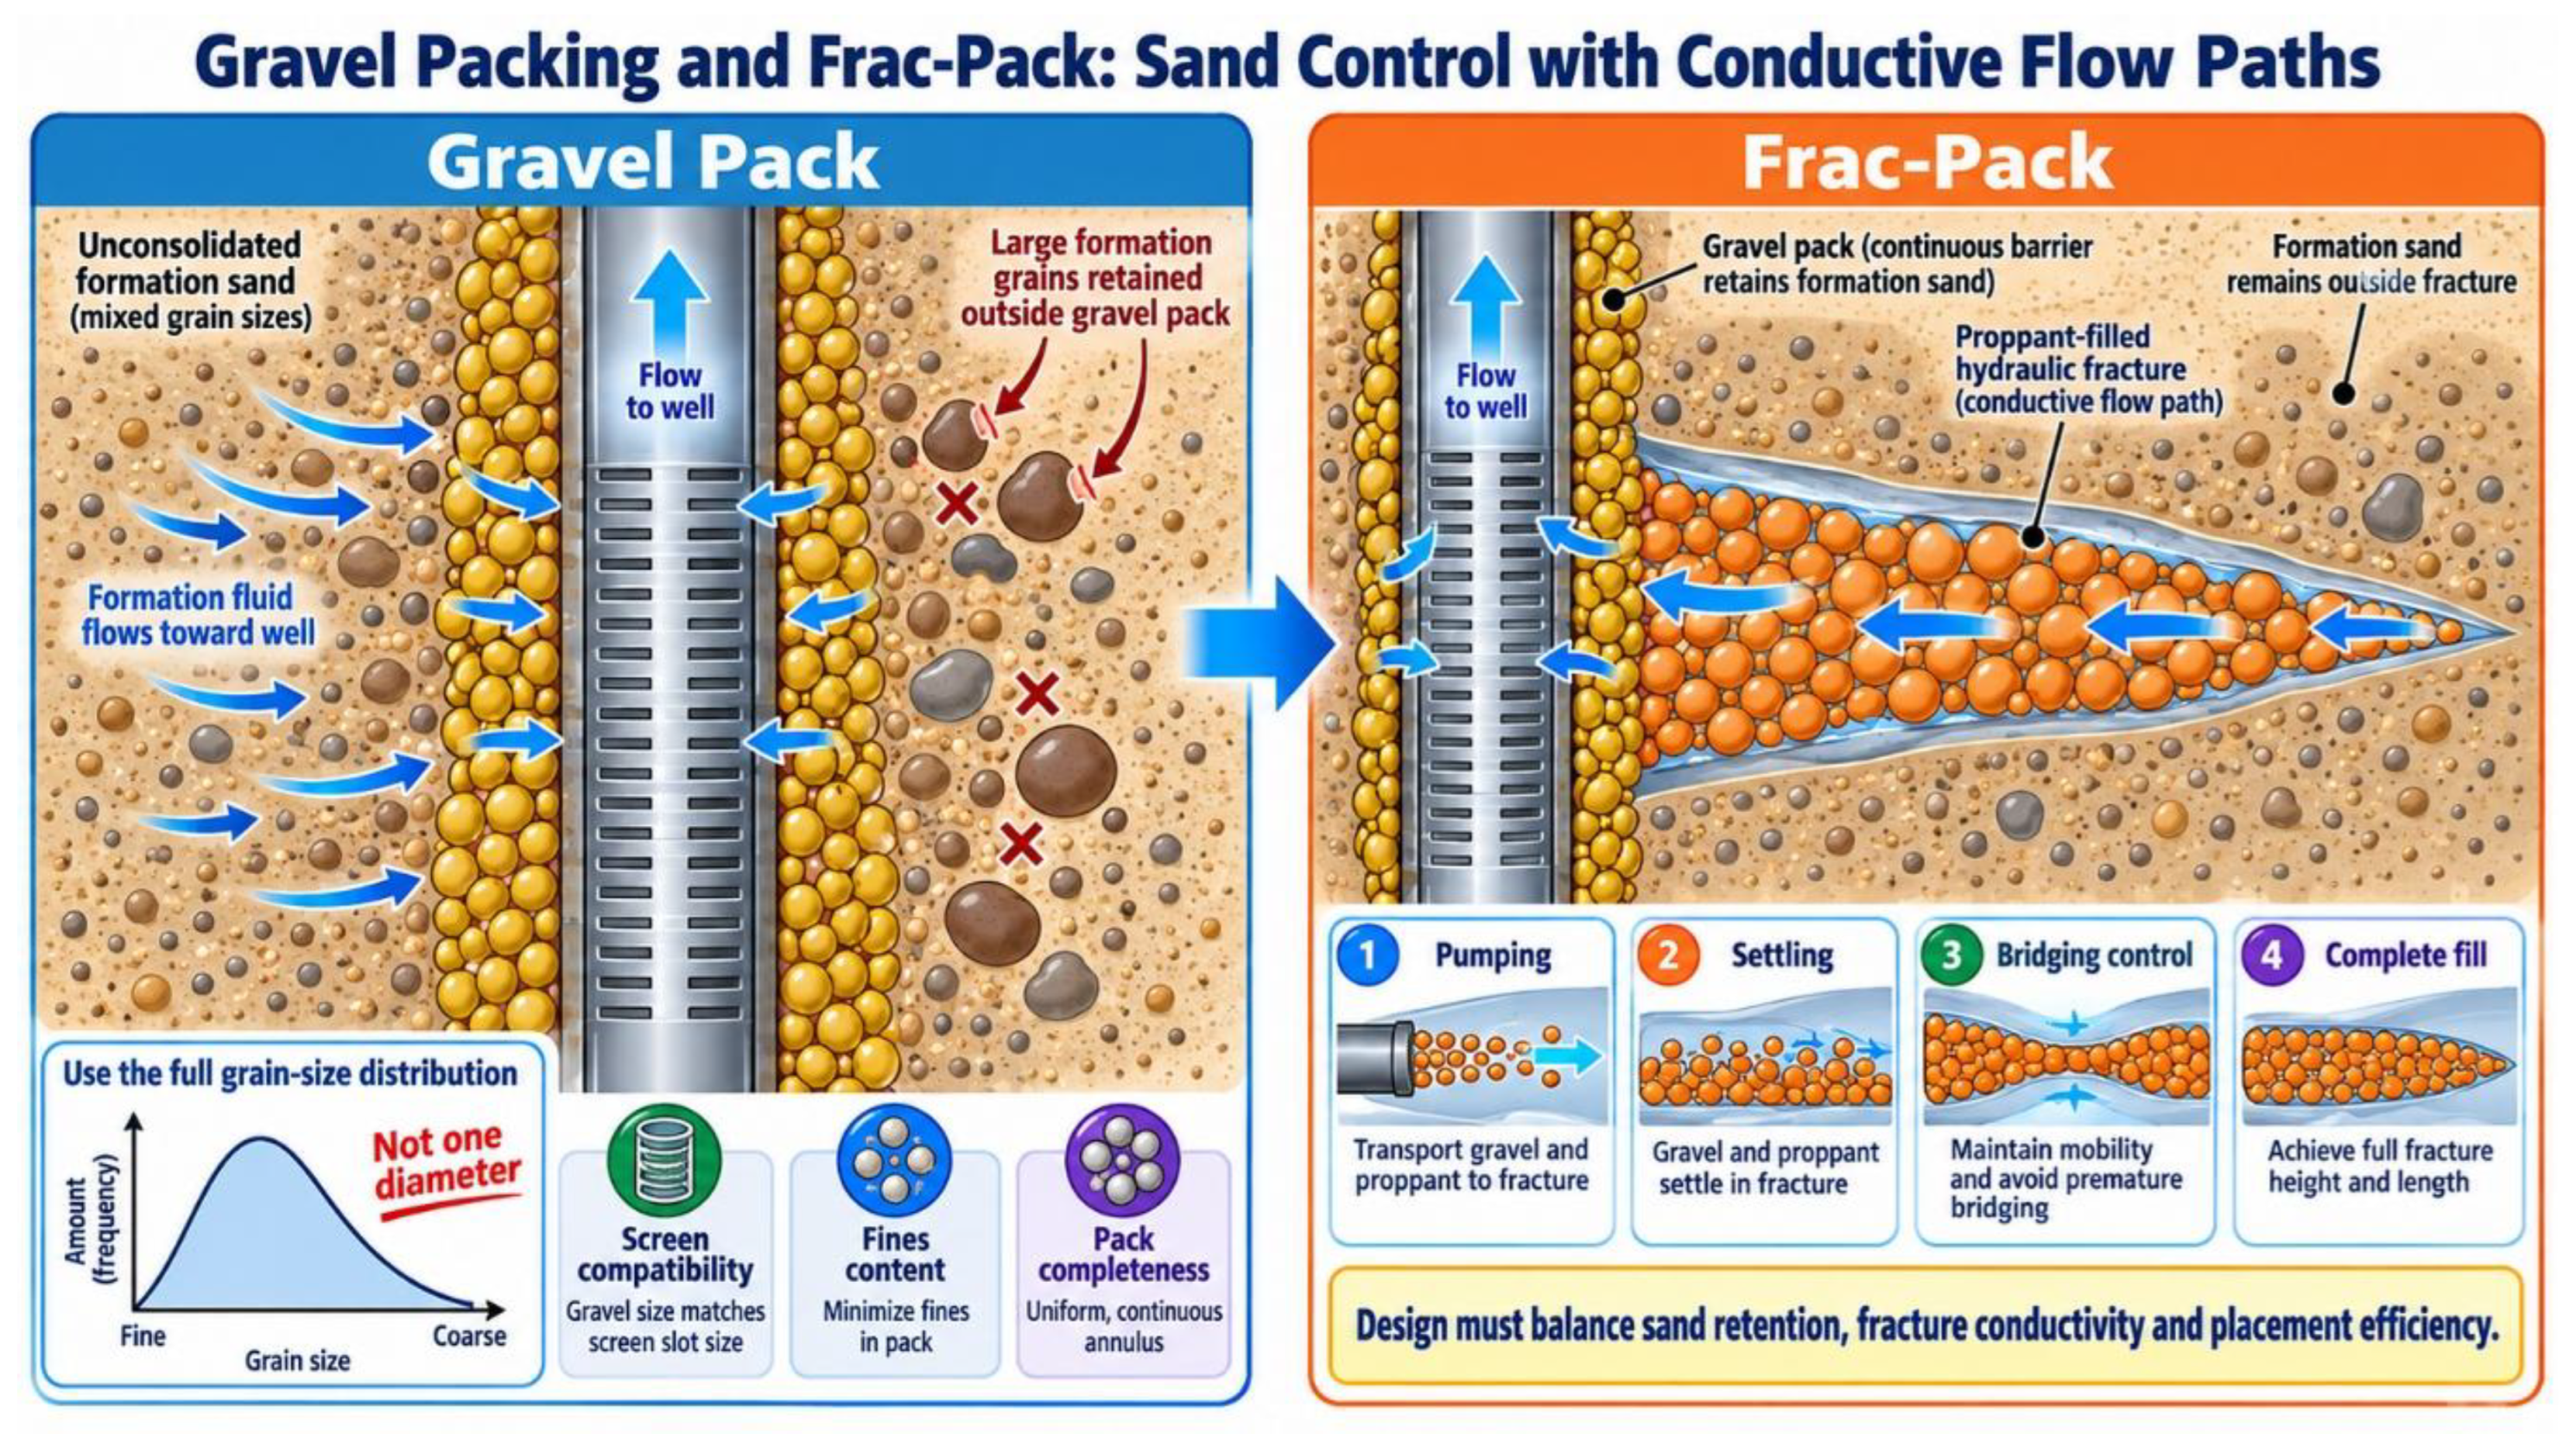
Figure 4.
Conceptual control of high-temperature Portland-cement performance by quartz-flour dosage and particle-size distribution (after [10,11,34]). Caption: At 200–260 °C, Portland-cement systems may undergo strength retrogression as hydration products, Ca/Si ratio and pore structure evolve. Quartz flour or other reactive silica sources can regulate hydrothermal reactions and promote more stable calcium-silicate-hydrate phases. Their effect is governed jointly by silica dosage, fineness, particle-size distribution, curing path, pressure and water/cement ratio. Neither higher silica content nor ultrafine silica necessarily provides superior long-term performance; compressive strength, permeability and phase composition should therefore be evaluated together over a curing duration representative of the target well conditions. Particle-size curves and microstructural sketches are conceptual, not measured data.
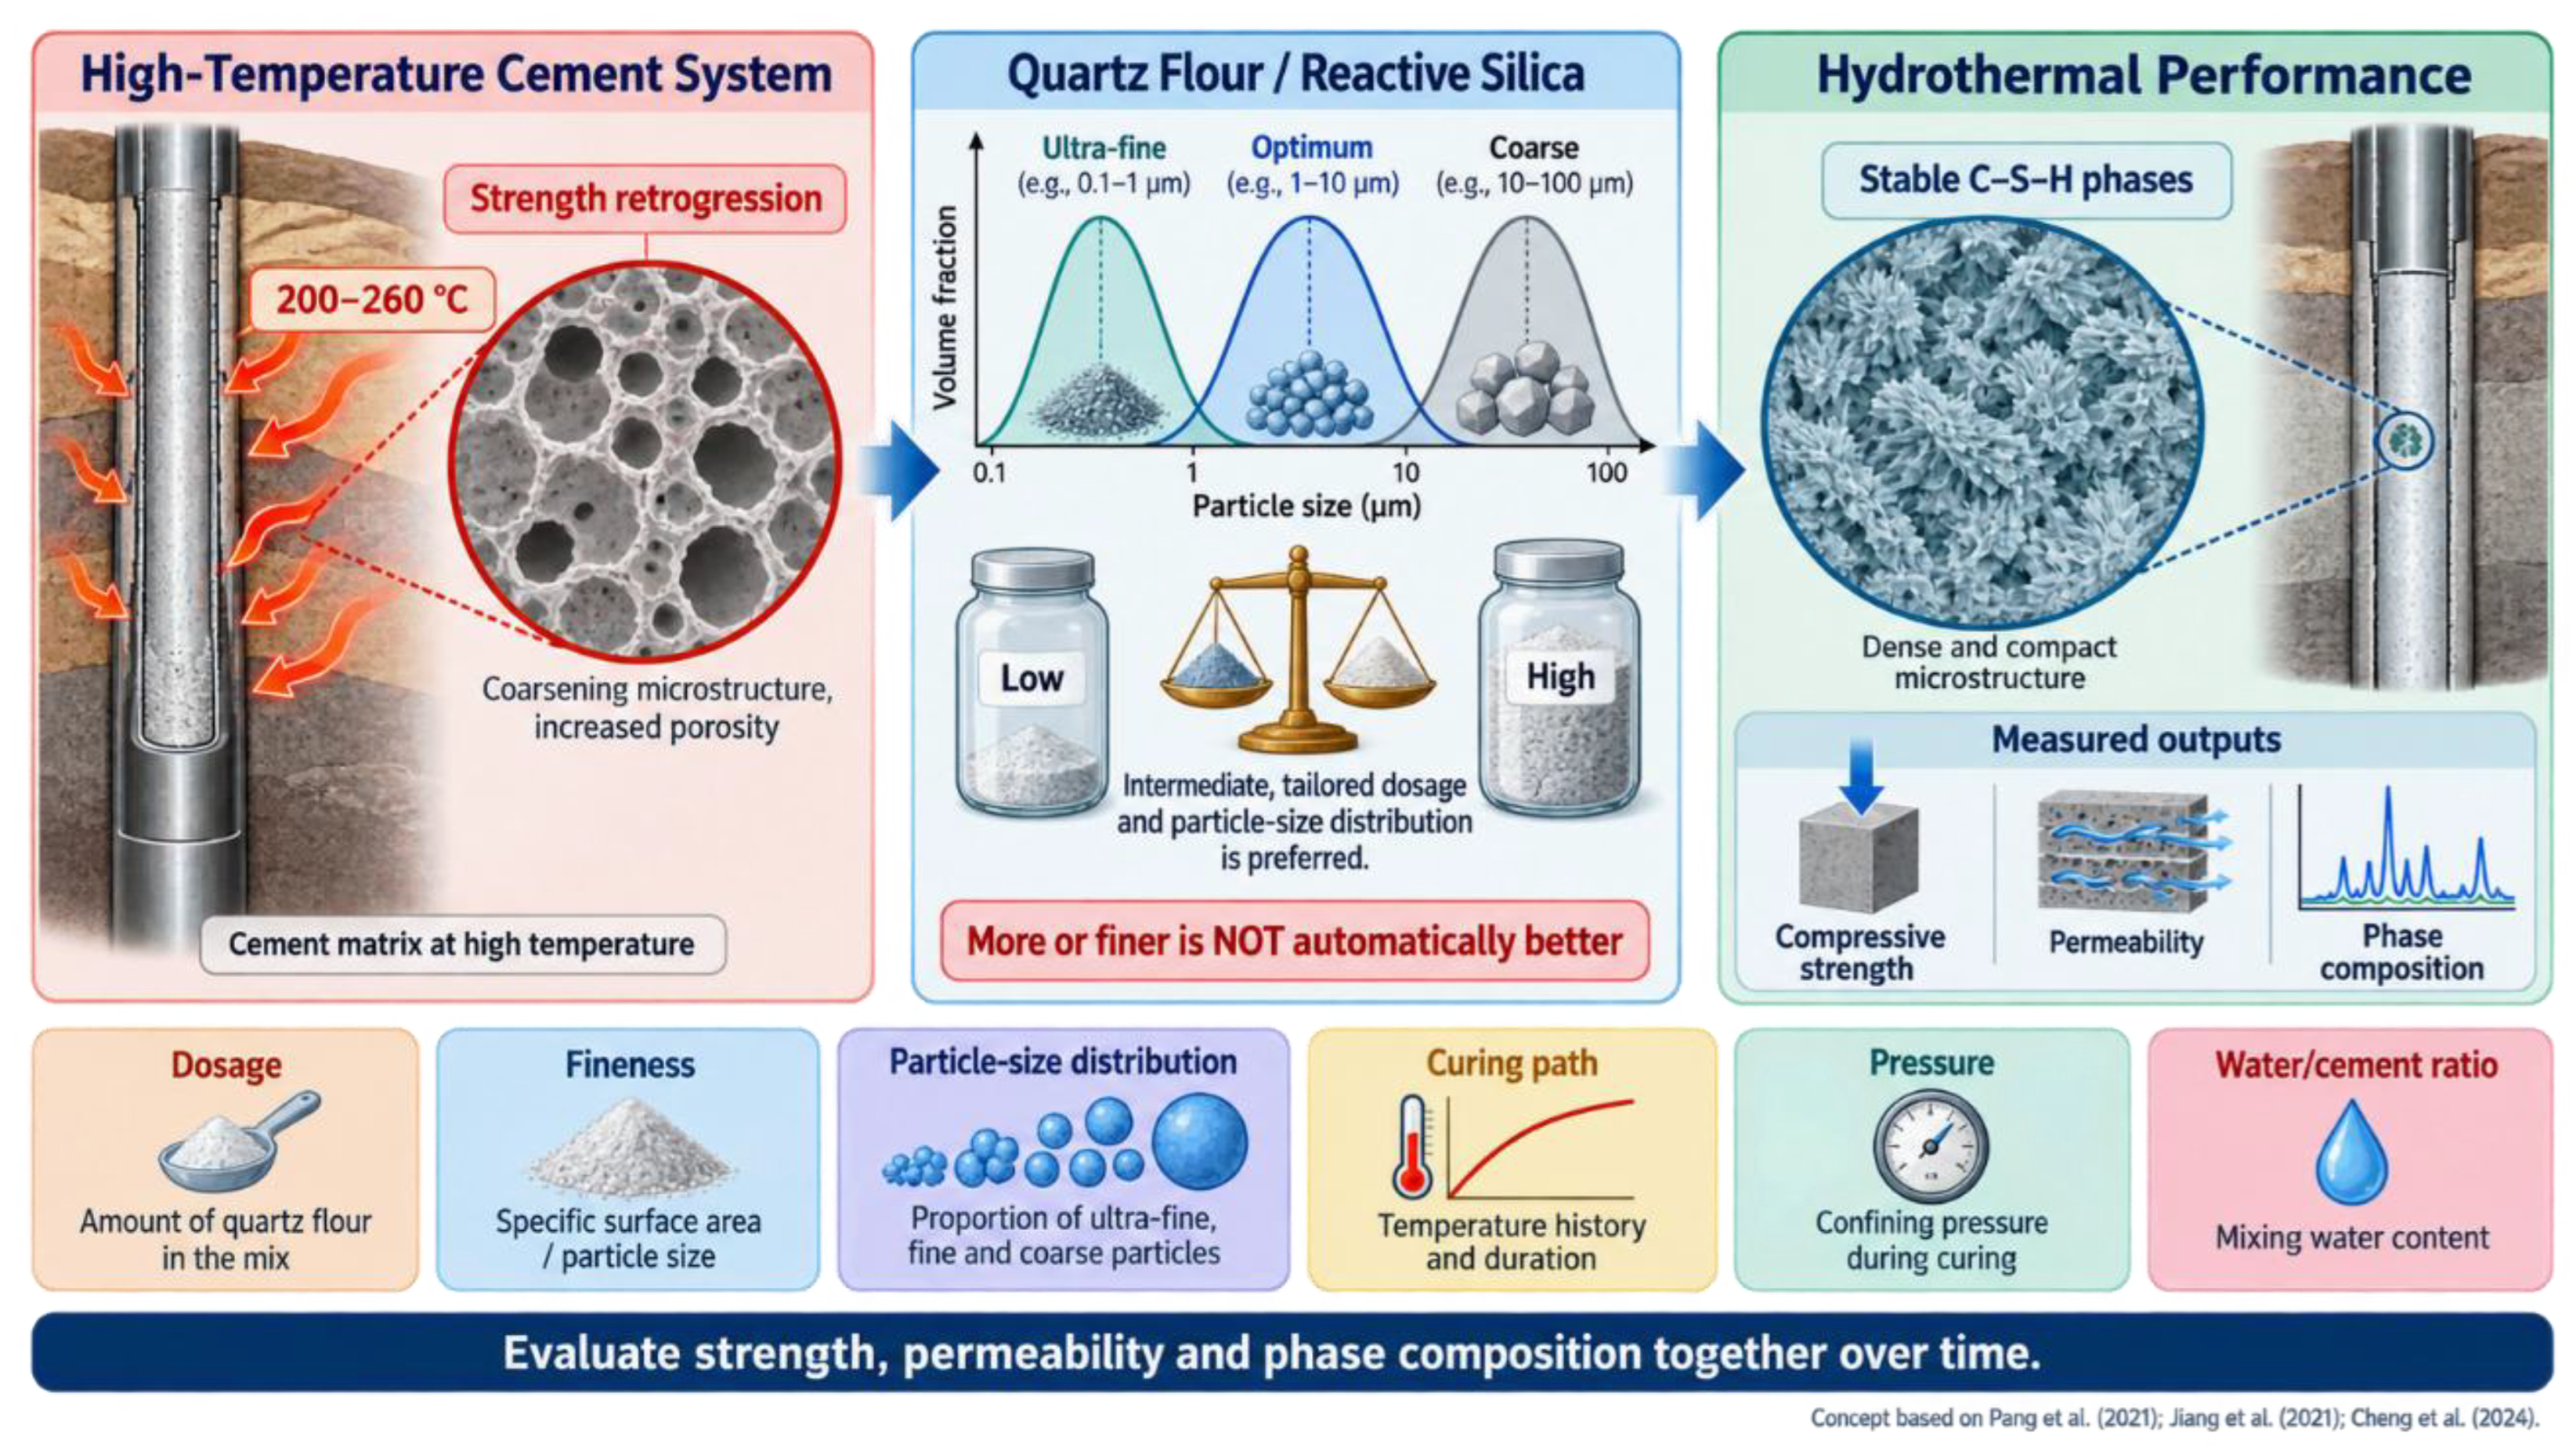
Figure 5.
Conceptual mechanisms and qualification boundaries of quartz filter sand for deep-bed filtration (after [13,35,36]). Caption: Quartz filter sand removes suspended solids through progressive bed retention and deep capture within a porous granular medium. Filter performance is controlled by effective size, uniformity coefficient, bed depth, filtration velocity, influent oil and solids loading, and backwash intensity. Oil coatings and biofilms can modify grain wettability, obstruct pore throats and accelerate head-loss development despite the intrinsic chemical stability and mechanical robustness of quartz. Accordingly, filter sand should be evaluated through particle-retention efficiency, hydraulic head loss, cleanability and cyclic backwash performance. Fracturing-sand metrics, including sphericity, acid solubility and crush resistance, describe closure-stress conductivity and must not be transferred unchanged to filter-sand acceptance criteria. All components are conceptual and not to scale.
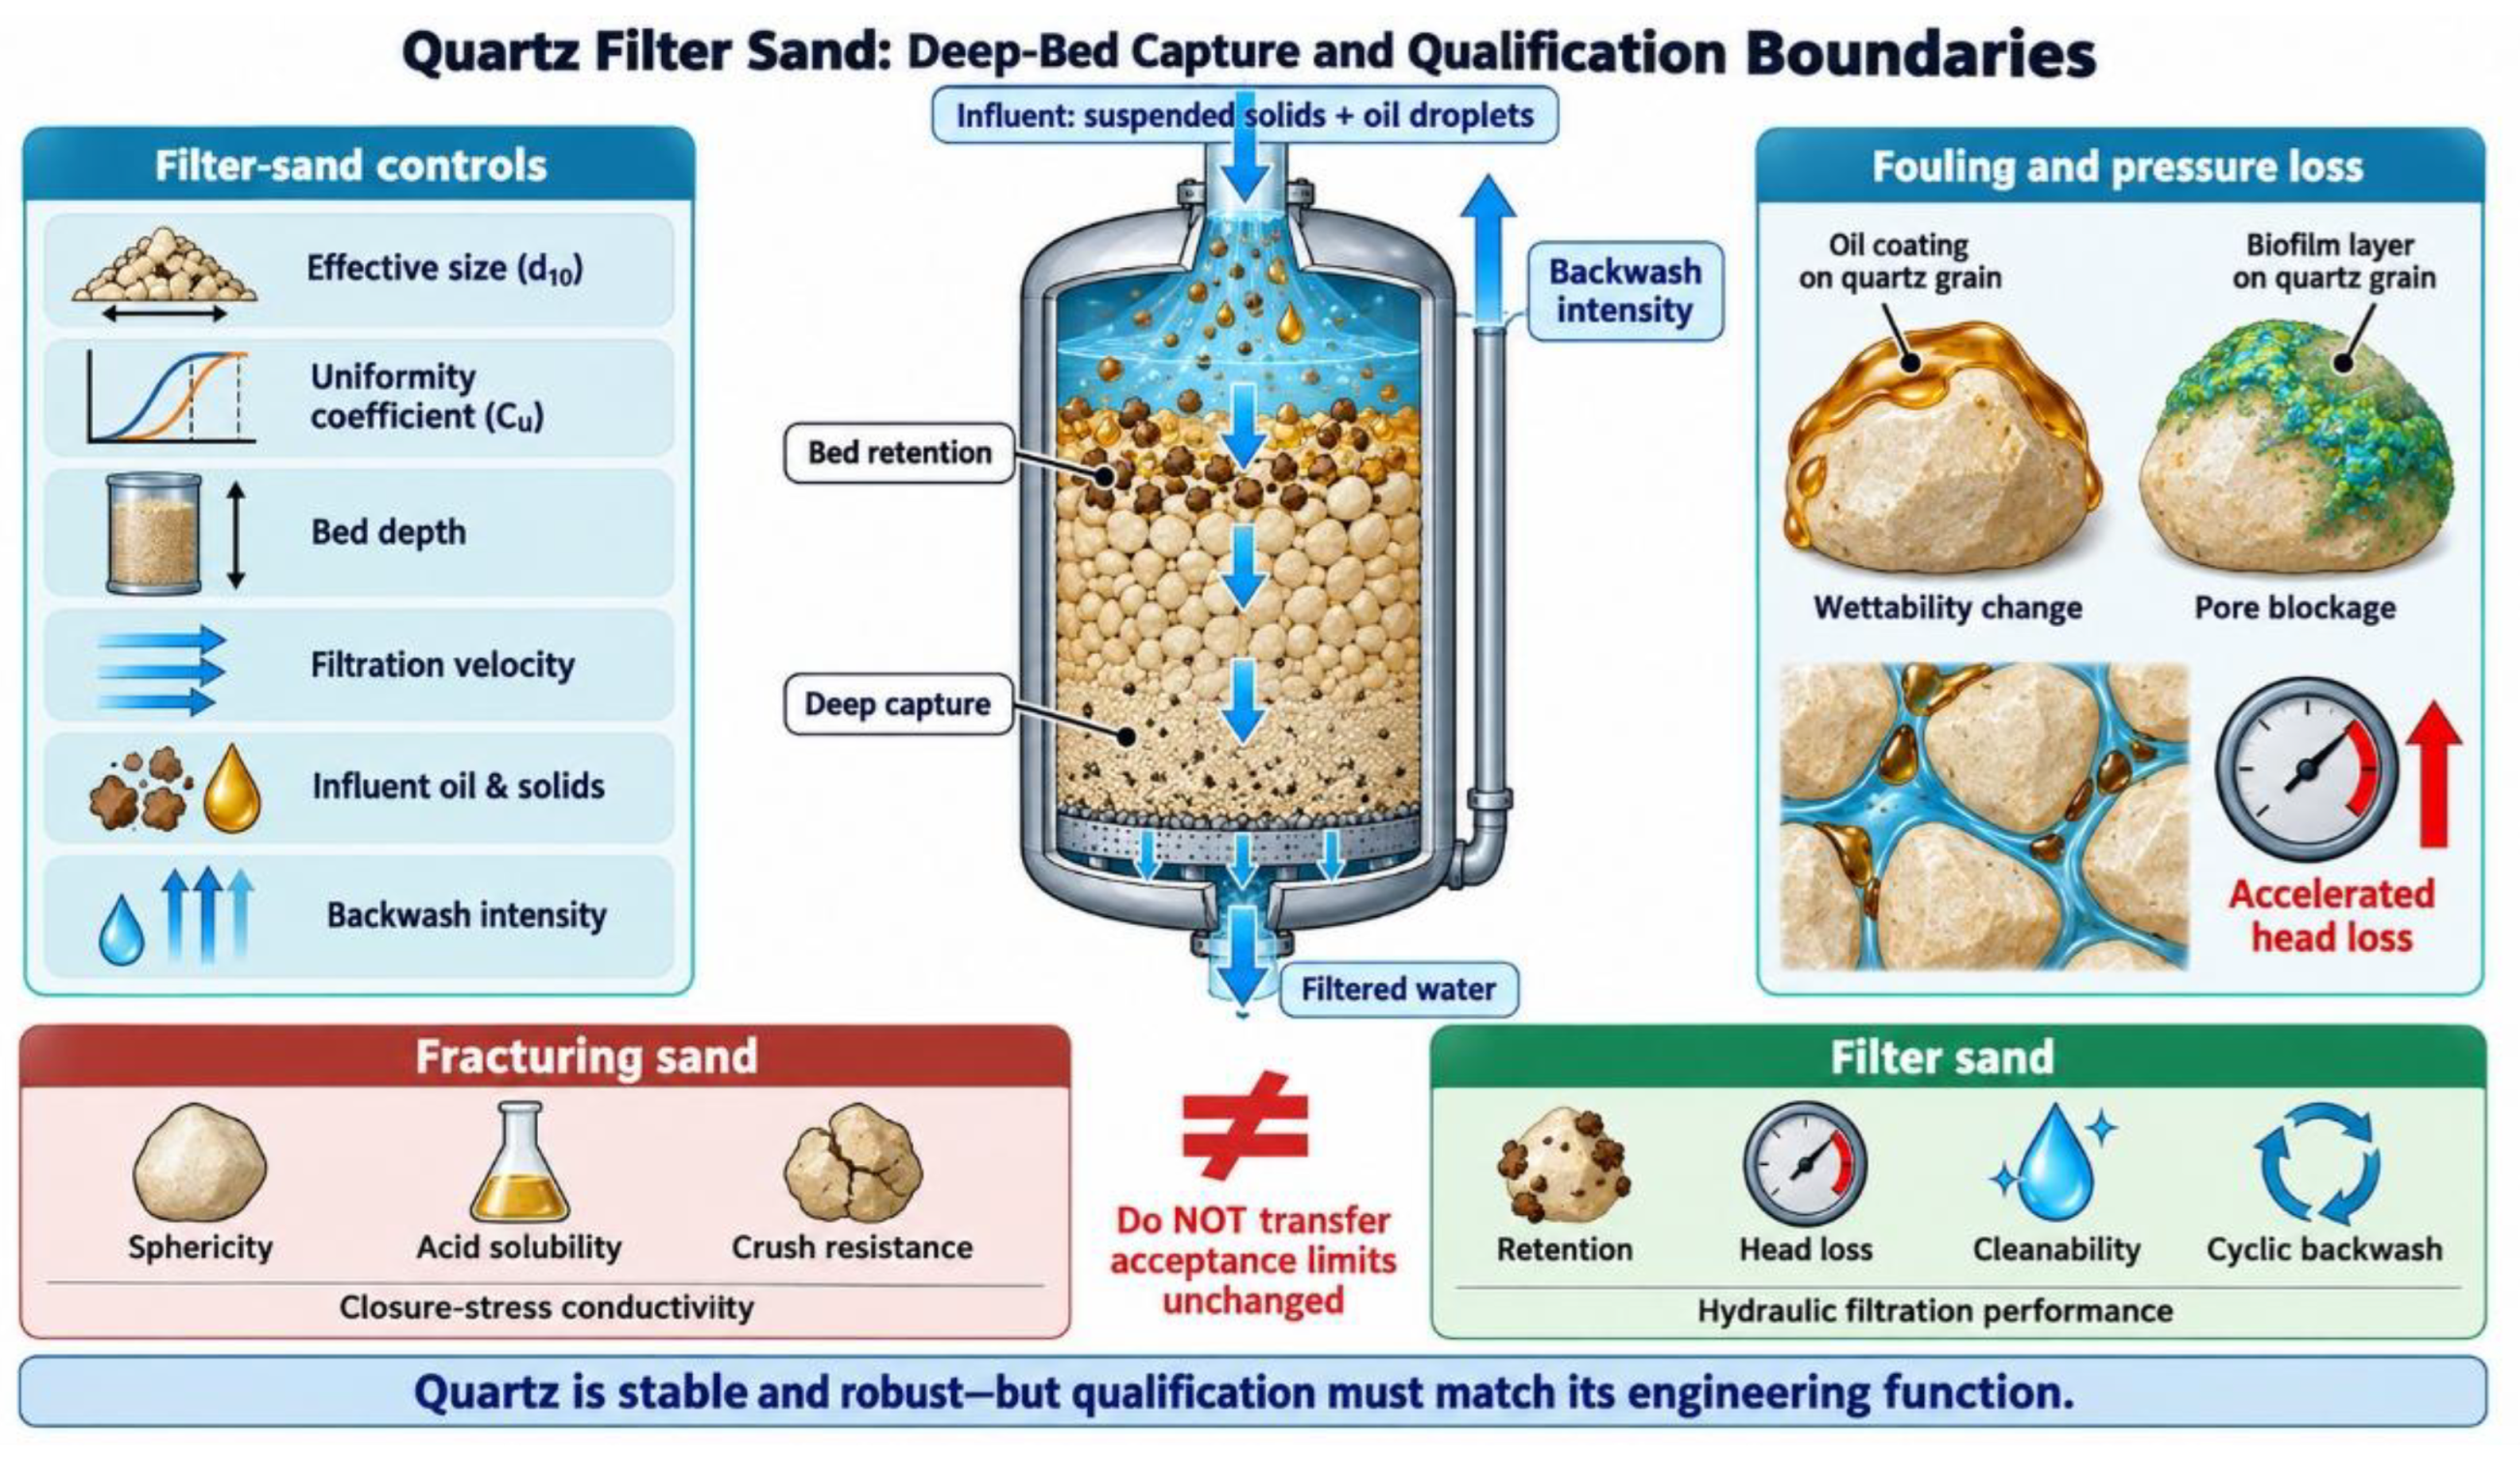

Table 1.
Functional roles, selection evidence and application boundaries of quartz-based materials in oil and gas well engineering (after [5,8,9,12,13,14]).
| Use | Material form | Primary function | Key selection evidence | Main performance indicators | Application boundary / common misuse |
|---|---|---|---|---|---|
| Hydraulic fracturing | Graded quartz sand, commonly supplied in defined sieve classes | Maintain fracture aperture and provide a permeable proppant pack after hydraulic pressure declines | Particle-size distribution, sphericity, roundness, mineral inclusions, microcracks, turbidity, acid solubility, crush response, transport behaviour and long-term conductivity | Conductivity under specified closure stress; fines generation; embedment; flowback; placement efficiency | High SiO₂ content alone does not predict conductivity; factory crush data cannot replace long-term tests using target stress, rock and fluid conditions |
| Gravel pack | Sized gravel or sand placed around a screen | Form a permeable granular filter that restricts formation-sand production while allowing fluid flow | Full formation-sand PSD, gravel PSD, grain-size ratio, screen aperture, fines content, formation heterogeneity, completion geometry and packing efficiency | Sand-exclusion efficiency; pack permeability; screen compatibility; pressure drop; pack stability | Fracturing-sand sieve classes and crush limits should not be directly adopted; the design must start with formation-sand distribution rather than a single median grain size |
| Frac-pack | Graded proppant or gravel placed in a near-wellbore fracture and around a screen | Combine fracture conductivity with sustained sand control | Fracture geometry, near-wellbore stress, formation-sand PSD, screen specification, slurry rheology, pumping schedule, settling, bridging risk and fill completeness | Near-wellbore conductivity; sand-control continuity; screenout risk; proppant flowback; retained permeability | A conductive fracture alone is insufficient if the screen region is incompletely packed; sand-control integrity and fracture placement must be evaluated together |
| High-temperature cementing | Fine quartz flour, silica flour, fused silica or other silica-rich additive | Regulate hydrothermal hydration products and reduce the risk of high-temperature strength retrogression | Silica dosage, particle-size distribution, specific surface area, crystalline state, water/cement ratio, admixtures, pressure–temperature history and curing duration | Compressive strength; water and gas permeability; Ca/Si ratio; phase assemblage; pore structure; long-term integrity | More silica or finer silica is not inherently superior; short curing tests may miss long-term phase evolution and permeability increase |
| Produced-water filtration | Graded quartz filter sand in a single- or multi-media bed | Remove suspended solids and residual dispersed oil through bed retention, interception and deep capture | Effective size (\(d_{10}\)), uniformity coefficient (\(C_u\)), bed depth, grain cleanliness, filtration velocity, influent oil and solids loading, head-loss development and backwash conditions | Particle retention; effluent turbidity; pressure loss; filter-run duration; media loss; cleanability after backwash | Sphericity, acid solubility and crush thresholds used for fracturing sand do not define filter quality; hydraulic retention and cyclic backwash performance are decisive |
| Wellsite water polishing or pretreatment | Quartz sand, commonly combined with coagulation, settling, walnut-shell media, carbon or membranes | Reduce suspended solids before reinjection, reuse or advanced treatment | Feedwater chemistry, oil-droplet size, suspended-solids concentration, salinity, scaling tendency, biological fouling and downstream treatment requirement | Solids removal; oil carryover; head loss; backwash-water demand; compatibility with downstream membranes or chemical treatment | Quartz filtration generally targets particulate phases; it does not independently remove dissolved salts, most dissolved organics or radionuclides |
| Sand handling and temporary storage | Dried graded quartz sand in silos, containers or pneumatic-transfer systems | Preserve particle-size distribution and cleanliness before blending and pumping | Silo segregation risk, moisture, fines generation, pneumatic-transfer conditions, loading-drop height, dust collection, batch traceability and sampling protocol | Sieve stability; fines increase; moisture; contamination; respirable-dust exposure; batch conformity | A laboratory-qualified material can become nonconforming through segregation, abrasion, contamination or moisture uptake during transport and wellsite transfer |
Note: Quartz-based materials share a SiO₂-rich feedstock but differ fundamentally in engineering function, relevant performance metrics and acceptance criteria. Material qualification should therefore be application-specific rather than transferred among fracturing, gravel packing, filtration and cementing operations.
Table 2.
Common fracturing-sand sieve classes and engineering trade-offs (after [16,515]).
Table 2.
Common fracturing-sand sieve classes and engineering trade-offs (after [16,515]).
| Nominal sieve class | Principal advantage | Main engineering limitation | Key verification items |
|---|---|---|---|
| 20/40 mesh | Large initial pore throats; potentially high low-stress conductivity | Faster settling; higher bridging sensitivity in narrow or tortuous fractures | Full sieve curve, settling behaviour, minimum fracture width, crush resistance |
| 40/70 mesh | Balance between transport, fracture access and conductivity | May still be affected by fines generation and embedment under high stress | Transport tests, conductivity under stress, morphology, fines generation |
| 70/140 mesh | Access to narrow secondary fractures and complex fracture branches | Smaller pore throats; greater sensitivity to fines migration and flowback | Undersize fraction, turbidity, flowback response, retained conductivity |
| Off-specification fines/oversize | None as a deliberate product fraction | Fines block pore throats; oversize grains may bridge or segregate | Particle-size distribution, mineralogy, handling and storage control |
Table 3.
Evidence hierarchy for fracturing-sand evaluation (after 5, 6, 20).
| Evidence level | Principal evidence | Key controlled variables | Main limitation | Appropriate decision |
|---|---|---|---|---|
| I. Material identity | Mine source, lithology, mineralogy, grain morphology, bulk chemical composition | Sampling domain, particle fraction, analytical method | Cannot predict process stability or downhole behaviour | Initial source screening |
| II. Standardized batch compliance | API Std 19C/ISO 13503-2 tests: sieve distribution, morphology, density, turbidity, acid solubility and crush resistance | Standard sieve class, specimen preparation, test procedure | Simplified loading and fluid conditions | Product release and inter-batch comparison |
| III. Reservoir-representative laboratory evaluation | Long-term conductivity, cyclic loading, fines generation, embedment and flowback tests | Closure stress, temperature, rock plates, fluid chemistry, pack thickness, duration | Laboratory geometry cannot fully reproduce fracture complexity | Well-specific material ranking |
| IV. Integrated engineering prediction | Fracture-propagation and transport modelling linked to laboratory inputs | Pumping schedule, fluid rheology, stress field, fracture geometry, formation properties | Model uncertainty and incomplete geological constraints | Treatment design and proppant schedule optimization |
| V. Field validation | Tracer, pressure response, flowback solids, production history and post-fracture diagnostics | Well completion, operational history, reservoir depletion, interference effects | Causal attribution may be non-unique |
Table 4.
Main controls on proppant transport and placement (after 15, 16, 21).
| Control variable | Principal transport effect | Potential benefit | Main trade-off or risk | Required evidence |
|---|---|---|---|---|
| Particle size and distribution | Controls settling velocity, fracture entry, pore-throat size and bridging tendency | Fine sand may access narrow branches; coarse sand may provide larger initial flow channels | Fine particles are more sensitive to fines migration; coarse particles may settle or bridge | Full sieve distribution, fracture-width range, slot tests and conductivity tests |
| Particle density and morphology | Influences settling, contact stress, packing and breakage | Lower density and rounded grains may improve transport and packing | Internal defects can still cause crushing and fines generation | Density, roundness/sphericity, microscopy and crush testing |
| Fluid rheology | Controls drag, suspension, bed-load motion and cleanup | Higher viscosity can improve carrying capacity | Polymer residues, incomplete cleanup and higher friction pressure | Rheology versus shear rate and temperature; residue and conductivity tests |
| Injection rate and schedule | Alters slurry velocity, bed growth, net pressure and branch access | High rate can enhance transport and delay settling | Excessive rate may increase pressure, erosion, leakoff or operational risk | Pumping records, fracture model, transport tests and pressure calibration |
| Proppant concentration | Controls particle interactions, dune height and pack thickness | Higher concentration may increase local proppant loading | Hindered flow, bridging and screenout risk | Concentration schedule, slot tests and pressure response |
| Fracture width and roughness | Determines wall confinement, aperture-to-grain ratio and contact geometry | Wider channels facilitate transport of coarse grains | Narrow or rough zones promote bridging and sorting | Geomechanics, fracture model, core/rock data and diagnostic interpretation |
| Intersection angle and branch geometry | Governs flow partition and particle turning into secondary fractures | Suitable geometry can enlarge propped fracture area | Unfavourable angles may retain sand in the main fracture | Network model, slot experiments and field diagnostics |
| Leakoff, fluid chemistry and cleanup | Changes local velocity, fluid volume and post-treatment permeability | Controlled leakoff may assist placement management | Excessive leakoff, scale, polymer residue or fines can damage conductivity |
| Decision stage | Required evidence | Main decision output | Common error to avoid |
|---|---|---|---|
| Define downhole conditions | Closure stress, temperature, lithology, rock stiffness, brine, pressure differential, flowback schedule | Performance envelope and dominant failure mechanisms | Using nominal reservoir depth as a substitute for effective stress |
| Screen placement design | Fracture model, transport tests, particle size, fluid rheology, rate and concentration schedule | Candidate sieve classes and pumping programme | Selecting particle size from conductivity alone |
| Characterize candidate batches | Sieve curve, morphology, turbidity, acid solubility, density, crush response, mineralogy | Batch-comparable baseline properties | Treating a mine source as a uniform material |
| Verify long-term conductivity | Target rock plates, temperature, brine, residues, stress path, duration and replicates | Expected conductivity retention and uncertainty | Relying only on short-duration rigid-wall tests |
| Integrate economics | Material, logistics, storage, pumping, flowback disposal and production forecast | Project-specific material ranking | Comparing mine-gate price without delivery and production effects |
| Monitor and update | Load-out samples, field pressure, flowback solids and production data | Feedback for subsequent stages | Assuming laboratory ranking remains valid without field validation |
| Information category | Minimum information to report | Purpose |
|---|---|---|
| Batch identity | Unique batch ID; mine source; extraction domain; production date; processing line; silo; transport unit; site silo; fracture stage | Enables traceability and root-cause analysis |
| Sample custody | Production retained sample; arrival-verification sample; sealed arbitration sample; sampling date, location and method | Ensures representative and auditable testing |
| Raw-material and process changes | Mine source, screen replacement, washing reagent, drying regime, storage condition, coating formulation | Defines triggers for revalidation |
| Standard properties | Sieve curve; turbidity; acid solubility; density; roundness; sphericity; crush response; mineralogical observations | Establishes a batch-comparable baseline |
| Project-conditioned tests | Rock plates; stress path; temperature; fluid chemistry; duration; proppant loading; replicates; uncertainty | Supports reservoir-specific performance prediction |
| Long-term conductivity | Raw time series; stress steps; flow rate; permeability; effective width; test interruptions and cleaning protocol | Prevents over-reliance on a single endpoint |
| Mixed proppants | Component IDs; mass ratio; particle-size distributions; mixing procedure; homogeneity verification; mixed-pack conductivity | Assesses segregation and mixed-pack behaviour |
| Resin-coated sand | Resin type; coating mass; cure temperature and duration; storage age; integrity and flowback testing | Verifies coating performance under use conditions |
| Gravel-pack material | Complete formation-sand PSD; gravel PSD; screen specification; placement method; pack efficiency | Evaluates sand control and screen compatibility |
| Cementing silica | Dosage; silica type; particle-size distribution; crystalline state; water/cement ratio; pressure–temperature path; curing time | Relates silica properties to hydrothermal cement performance |
Disclaimer/Publisher’s Note: The statements, opinions and data contained in all publications are solely those of the individual author(s) and contributor(s) and not of MDPI and/or the editor(s). MDPI and/or the editor(s) disclaim responsibility for any injury to people or property resulting from any ideas, methods, instructions or products referred to in the content. |
© 2026 by the authors. Licensee MDPI, Basel, Switzerland. This article is an open access article distributed under the terms and conditions of the Creative Commons Attribution (CC BY) license (http://creativecommons.org/licenses/by/4.0/).
Copyright: This open access article is published under a Creative Commons CC BY 4.0 license, which permit the free download, distribution, and reuse, provided that the author and preprint are cited in any reuse.