

Submitted:
10 October 2026
Posted:
12 October 2026
You are already at the latest version
Abstract
Background/Objectives: Iron replacement and investigation of the underlying disorder are complementary aspects of care. We described diagnoses recorded after intravenous iron treatment and gastrointestinal biopsy findings during follow-up.
Methods: This single-center retrospective cohort included 1,164 adults treated during 2015–2025. Linked diagnosis and pathology records were classified relative to the index infusion. Two authors manually reviewed and verified pathology reports. Five age- and sex-adjusted logistic models assessed associations between laboratory values obtained within 30 days before infusion and a gastrointestinal composite, with correction for multiple testing.
Results: Among 1,085 adults with observation beyond infusion, median follow-up was 38.2 months. Follow-up diagnosis status was documented in 601 patients; 47 had a diagnosis dated after infusion, including 24 after one year. Across linked sources, 33 patients had post-infusion malignancy records, including 10 with supporting pathology. Post-infusion gastrointestinal biopsies were available for 169 patients. Chronic gastritis was reported in 151 (89.3%), atrophy and/or intestinal metaplasia in 143 (84.6%), and malignant tumors in six (3.6%; 95% confidence interval, 1.6–7.5%). The gastrointestinal composite occurred in 52 patients (30.8%); none of the five laboratory associations met the multiplicity-adjusted threshold.
Conclusions: Malignant and nonmalignant diagnoses were documented during follow-up, including beyond the first year after intravenous iron treatment. Linked biopsy reports provided histologic detail in a selected subgroup; the findings do not establish the cause of the original iron deficiency or disease incidence in the treated population.
Keywords:
intravenous iron
; anemia
; etiologic evaluation
; gastrointestinal biopsy
; malignancy
; retrospective cohort
1. Introduction
Iron deficiency can arise from chronic blood loss, impaired absorption, or increased iron requirements [1]. Its laboratory assessment depends on the clinical setting, particularly in patients with inflammation or chronic kidney disease [2,3]. Adults receiving intravenous iron therefore vary in their underlying disorders and reasons for treatment.
Intravenous iron is recommended when oral iron is not tolerated, iron stores do not improve with oral treatment, or intestinal absorption is unlikely to be adequate [4]. Investigation of the cause remains part of care. British Society of Gastroenterology and American Gastroenterological Association guidelines recommend gastrointestinal evaluation in appropriate adults with iron-deficiency anemia, particularly men and postmenopausal women [5,6]. Previous studies have examined the timing of diagnostic investigation and cancer diagnoses after iron-deficiency anemia [7,8,9]. These findings raise a related question for patients receiving intravenous iron: which diagnoses are documented during subsequent care, and when?
We examined the spectrum and timing of diagnoses recorded after intravenous iron treatment and the findings in linked gastrointestinal biopsy reports. We also assessed the evidence supporting malignancy records and explored associations between baseline laboratory parameters and selected gastrointestinal findings.
2. Materials and Methods
2.1. Study Design, Setting, and Participants
We conducted a single-center retrospective cohort study using routinely collected records from Ondokuz Mayıs University Hospital, Samsun, Türkiye. Patients were identified from intravenous iron treatment authorization reports, with documented administration during the study period required for inclusion. The study database included demographics, infusion dates, laboratory results, follow-up diagnoses, encounters, mortality records, and linked pathology reports. It contained 1,175 unique patients; adults aged ≥18 years at the index infusion were eligible. Reporting followed the STROBE cohort checklist and the RECORD framework [10,11].
The index date was the intravenous iron infusion date verified by the study investigator. Index infusions occurred between 5 January 2015 and 21 October 2025, with one index observation per patient. Eligibility was based on intravenous iron treatment rather than a uniform laboratory definition of iron-deficiency anemia. Figure 1 shows patient selection and the overlapping analysis subgroups.
2.2. Follow-Up and Temporal Classification
Observation was measured from the index infusion to the latest available clinical record or recorded death. The patient-level observation endpoint incorporated encounter, diagnosis, procedure, and pathology dates; for patients with a recorded death, follow-up ended on the death date. Available records extended through 13 August 2026. Patients with an observation endpoint later than the infusion date contributed to longitudinal summaries and time-to-event analyses.
Diagnoses and biopsy reports were classified as preceding the infusion, occurring on the infusion date, or occurring after infusion. Post-infusion outcomes required an interval of at least one calendar day. Records without a date were retained in the descriptive assessment and excluded from temporal classification. Months were calculated using 365.25/12 days and person-years using 365.25 days.
2.3. Laboratory Parameters
Baseline laboratory measurements were obtained within the 30 days preceding the index intravenous iron infusion. Parameters included hemoglobin, mean corpuscular volume (MCV), ferritin, transferrin saturation (TSAT), creatinine, albumin, phosphate, C-reactive protein (CRP), erythrocyte sedimentation rate (ESR), and lactate dehydrogenase (LDH). Values reported below a quantification limit were retained as censored observations without assigning an exact concentration.
For descriptive characterization, anemia was defined operationally as hemoglobin <12 g/dL in females or <13 g/dL in males [5]. Ferritin <30 ng/mL or TSAT <20% was used to describe low iron indices; these thresholds were not applied as a universal diagnostic criterion across renal and inflammatory conditions. Last-available laboratory values were summarized separately as descriptive follow-up measurements. Analyses of laboratory associations used baseline parameters; last-available measurements were not treated as standardized treatment-response exposures.
2.4. Follow-Up Diagnoses and Malignancy Records
The follow-up diagnosis dataset was analyzed separately from the broader linkage of diagnosis, pathology, and cancer-history records described below. Diagnosis entries were classified as malignant, nonmalignant, premalignant, or uncertain-behavior neoplasms. An explicit entry indicating no additional diagnosis was distinguished from an undocumented diagnosis status. Timing was based on the recorded diagnosis date, and each patient was counted once in this analysis.
Malignancy records were also identified across linked diagnosis, pathology, and cancer-history sources. Records were linked at patient level to avoid duplicate counting. Pathology support required a corresponding report containing a malignant diagnosis or malignant morphology; clinical suspicion alone was insufficient. Dated prior malignancies and undated cancer-history entries were classified separately. The outcome was a malignancy recorded after infusion, without assigning incident or second-primary status.
2.5. Gastrointestinal Biopsy Findings
Pathology reports were obtained from the hospital pathology laboratory. Two study authors manually read each available report and verified the findings for all patients with pathology records. Gastrointestinal biopsy reports were identified from specimen and procedure descriptions; surgical resections and non-gastrointestinal specimens were excluded from this subgroup. Report timing used the specimen/request date, with the first acceptance date as a fallback. Diagnostic text, morphology, structured entries, and embedded endoscopic descriptions were assessed using the definitions in Supplementary Methods S1, accounting for negation and distinguishing diagnostic findings from clinical suspicion.
Repeated reports were aggregated at patient level, counting each finding once if it appeared in any post-infusion biopsy report. Findings could overlap. Upper- and lower-gastrointestinal sampling were recorded separately. Percentages used all patients with available post-infusion gastrointestinal biopsy reports as the denominator and describe recorded findings within this subgroup.
An exploratory gastrointestinal composite included malignant tumors, adenoma/dysplasia or Barrett-related premalignant findings, villous atrophy, histologic colitis, or ulcerative/erosive/potential bleeding findings. Isolated gastritis, atrophy or metaplasia without dysplasia, H. pylori positivity, and isolated intraepithelial lymphocytosis were excluded from this composite. This report-based endpoint was defined for exploratory association analysis and was not a validated measure of anemia causation.
2.6. Statistical Analysis
Continuous variables were summarized as medians and interquartile ranges (IQRs), and categorical variables as counts and percentages with specified denominators. Wilson 95% confidence intervals (CIs) were calculated for selected biopsy proportions. All eligible patients were included; no a priori sample-size calculation was performed. Each model used cases with the required variables available. Missing outcomes were not classified as absent.
Five separate logistic regression models examined baseline hemoglobin, MCV, ferritin, TSAT, or creatinine in relation to the exploratory gastrointestinal composite among patients with post-infusion biopsies. Each model adjusted for age per 10 years and sex and used robust standard errors. Marker contrasts were hemoglobin per 1 g/dL, MCV per 10 fL, TSAT per 5 percentage points, and ferritin or creatinine per doubling using a base-2 logarithm. The fitting rule required at least 30 composite-positive and 30 composite-negative observations. Adjusted odds ratios (ORs), 95% CIs, raw p values, and Benjamini–Hochberg false-discovery-rate-adjusted q values were reported for the five-marker family. A q value <0.05 was used as the exploratory multiplicity-adjusted threshold.
Ancillary Cox models examined recorded all-cause mortality among patients with observation beyond infusion. Each model included age, sex, and one baseline marker, used robust standard errors, and required at least 30 deaths. False-discovery-rate adjustment covered the six fitted marker models. Rank-transformed Schoenfeld residual diagnostics assessed the proportional-hazards assumption for each marker. Details are provided in Supplementary Methods S1 and Supplementary Table S1. Analyses used Python 3.12, pandas, statsmodels, SciPy, and lifelines. OpenAI ChatGPT/Codex assisted with statistical analyses and consistency checks; the authors reviewed the outputs.
2.7. Ethics
The study was approved by the Ondokuz Mayıs University Clinical Research Ethics Committee (approval no. 2026/261; 1 June 2026). Informed consent was not required for this retrospective study. Patient-level data were handled confidentially, and only aggregate results are presented.
3. Results
3.1. Cohort Characteristics and Follow-Up
Of 1,175 patients, 11 were younger than 18 years at infusion, leaving 1,164 adults. Median age was 49.1 years (IQR, 37.7–67.2), and 877 patients (75.3%) were female. The recorded clinical departments were internal medicine (n=884), hematology (n=224), and endocrinology (n=55), with one unclassified entry. Baseline characteristics are presented in Table 1.
Follow-up beyond the infusion date was available for 1,085 adults, contributing 3,438.0 person-years of observation. Median follow-up was 38.2 months (IQR, 10.1–55.6). Forty-eight adults had index-day-only observation and 31 did not contribute a post-infusion observation interval (Figure 1). Among 983 patients with hemoglobin measurements, 855 met the operational anemia thresholds. Anemia together with ferritin <30 ng/mL or TSAT <20% was documented in 537 adults.
Median baseline hemoglobin was 10.1 g/dL (IQR, 8.8–11.3), MCV 79.7 fL (IQR, 71.3–86.9), ferritin 17.84 ng/mL (IQR, 6.27–100.38), and TSAT 8.6% (IQR, 5.4–17.6).
3.2. Spectrum and Timing of Follow-Up Diagnoses
Follow-up diagnosis status was documented in 601 adults: 60 had a diagnosis entry and 541 had an explicit entry indicating no additional diagnosis. Status was undocumented in 563 adults. Of the 60 positive entries, 47 were dated after infusion, one on the infusion date, six before infusion, and six could not be assigned a time relative to infusion (Table 2).
The 47 post-infusion diagnoses comprised 28 malignant diagnoses, 16 nonmalignant diagnoses, two premalignant lesions, and one uncertain-behavior neoplasm. Nonmalignant diagnoses included leiomyoma (n=12), adenomyosis (n=1), focal segmental glomerulosclerosis (n=1), hemorrhoids (n=1), and celiac disease (n=1). The two premalignant entries were a low-grade cervical intraepithelial lesion and a colonic tubular adenoma with low-grade dysplasia. The full recorded spectrum is provided in Supplementary Table S3.
Median time to a post-infusion diagnosis was 15.1 months (IQR, 2.9–43.1). Twelve diagnoses (25.5%) were recorded within 90 days, three (6.4%) at 91–180 days, eight (17.0%) at 181–365 days, and 24 (51.1%) after one year.
3.3. Gastrointestinal Biopsy Findings
A total of 376 eligible gastrointestinal biopsy reports were linked to 263 adults. Of these, 229 reports from 169 patients were dated after infusion. Median interval from infusion to the first post-infusion biopsy was 3.9 months (IQR, 0.4–22.7). Upper-gastrointestinal sampling was documented in 159 patients (94.1%) and lower-gastrointestinal sampling in 43 (25.4%); 33 had both during follow-up.
Among the 169 patients with post-infusion biopsies, chronic gastritis was reported in 151 (89.3%), atrophy in 139 (82.2%), intestinal metaplasia in 65 (38.5%), and atrophy and/or metaplasia in 143 (84.6%). H. pylori positivity was recorded in 41 (24.3%). Ulcerative/erosive or potential bleeding findings occurred in 30 patients (17.8%), adenoma/dysplasia or other premalignant findings in 16 (9.5%), and benign polyps in 14 (8.3%). Villous atrophy was recorded in four patients, isolated intraepithelial lymphocytosis in three, and histologic colitis in three (Table 3).
Six patients had malignant tumors in post-infusion gastrointestinal biopsy reports (3.6%; Wilson 95% CI, 1.6–7.5%): four gastric carcinomas, one gastric neuroendocrine tumor, and one renal-cell carcinoma metastatic to the stomach. The exploratory gastrointestinal composite was present in 52/169 patients (30.8%; 95% CI, 24.3–38.1%).
3.4. Malignancy Records Across Linked Sources
Across linked sources, 33 adults had a malignancy recorded after infusion, including 10 with supporting pathology. The median interval to the first post-infusion malignancy record was 17.7 months (IQR, 3.0–51.3). The first recorded sites included gastric (n=7), colorectal (n=4), thyroid (n=3), and prostate (n=3); one additional record was classified as a gastrointestinal stromal tumor. Site-specific counts are provided in Supplementary Table S4.
Of these 33 patients, 27 had no dated prior malignancy or undated cancer-history entry, three had a dated prior malignancy, and three had only an undated cancer-history entry. One patient had a malignancy recorded at a different site after a dated prior cancer (Table 4).
3.5. Laboratory Parameters and Gastrointestinal Findings
Available-case logistic model samples ranged from 110 to 151 patients, with 30–45 composite-positive observations. Age- and sex-adjusted ORs were 1.04 (95% CI, 0.84–1.29) per 1 g/dL hemoglobin, 1.28 (0.89–1.84) per 10 fL MCV, 1.08 (0.90–1.28) per ferritin doubling, 0.93 (0.78–1.11) per 5-percentage-point TSAT increase, and 1.01 (0.63–1.61) per creatinine doubling. None met the multiplicity-adjusted threshold; all q values were ≥0.703 (Table 5).
Descriptive baseline and last-available laboratory measurements are presented in Supplementary Table S2.
3.6. Ancillary Mortality Analysis
Forty-two deaths were recorded, including one on the infusion date and 41 among patients with subsequent follow-up. Ancillary mortality model estimates and proportional-hazards diagnostics are reported in Supplementary Table S1.
4. Discussion
In this cohort of adults treated with intravenous iron, 24 of the 47 diagnoses in the follow-up diagnosis dataset were documented more than one year after infusion. The diagnoses included malignancies, gynecologic disorders, and gastrointestinal and renal disease. Linkage with pathology and cancer-history records identified 33 patients with malignancy records after infusion and provided tissue findings for the gastrointestinal biopsy subgroup.
The predominance of leiomyoma among nonmalignant diagnoses is clinically relevant in a cohort in which three quarters of patients were female. However, the records did not establish whether each leiomyoma caused abnormal uterine bleeding or accounted for the original iron deficiency. Likewise, a diagnosis recorded after the first year may reflect later documentation, pre-existing disease, or a newly developed condition; timing alone does not demonstrate a missed diagnosis.
Previous studies have examined the timing of investigation after iron-deficiency anemia and subsequent cancer diagnoses [7,8,9]. Our cohort was selected by treatment with intravenous iron and included patients without a uniform laboratory definition of iron-deficiency anemia. The findings therefore describe diagnoses documented during routine care in this treatment population. They do not estimate cancer incidence or an effect of intravenous iron on malignancy.
Chronic gastritis and atrophy or intestinal metaplasia were frequent in the biopsy subgroup. Atrophic gastritis is relevant to the evaluation of unexplained iron or vitamin B12 deficiency [12], but these histologic findings alone do not establish autoimmune gastritis or the cause of anemia. Gastric risk assessment also depends on the extent and severity of atrophy and metaplasia and other patient characteristics [13,14]. The present categories lack the information needed to assign individual surveillance intervals.
H. pylori was recorded in approximately one quarter of patients with post-infusion biopsies. Its contribution to iron-deficiency anemia in adults remains dependent on the clinical context [15]. Villous atrophy and isolated intraepithelial lymphocytosis were reported separately because the latter is not specific for celiac disease; histology must be interpreted with serologic and clinical findings [16].
Six patients had malignant gastrointestinal biopsy findings, including one renal-cell carcinoma metastatic to the stomach. These observations concern patients selected for tissue sampling and cannot be extrapolated to the entire cohort. The gastric predominance of malignant biopsy findings must also be considered alongside the unequal availability of upper- and lower-gastrointestinal samples.
None of the five baseline laboratory markers was associated with the gastrointestinal composite at the multiplicity-adjusted threshold. The modest model samples and heterogeneous endpoint limit interpretation. The IDIOM score predicts gastrointestinal cancer in patients with confirmed iron-deficiency anemia [17]; our analysis concerned a broader endpoint in patients selected for biopsy after intravenous iron treatment. Differences in population, sampling, and outcome prevent direct comparison, and these estimates do not exclude clinically useful cancer-specific associations.
The study combines several years of observation with patient-level linkage of diagnosis and pathology records and manual verification of pathology reports by two authors. Its main limitations concern selection and ascertainment. Intravenous iron treatment defined a heterogeneous population, and the single-center design limits generalizability. Follow-up diagnosis status was undocumented in 563 of 1,164 adults, so the recorded diagnoses cannot be treated as a complete account of disease during follow-up. Absence of a prior cancer record likewise does not confirm a cancer-free baseline.
Biopsy reports did not capture all endoscopic investigations or procedures performed elsewhere, and not every patient had sampling from each gastrointestinal site. Repeated sampling and variable observation periods also affected the opportunity to record a finding. Report-based categories did not independently establish anemia etiology. Available-case laboratory models were vulnerable to selection and adjusted only for age and sex. The ancillary mortality analyses were additionally limited by incomplete adjustment for renal disease, inflammation, malignancy, and other comorbidities; the albumin model showed a departure from proportional hazards.
5. Conclusions
Follow-up after intravenous iron treatment included documentation of malignant and nonmalignant disorders, with approximately half of the diagnoses in the follow-up diagnosis dataset recorded after one year. Linked gastrointestinal biopsy reports added histologic findings in a selected subgroup. These data describe the range and timing of recorded diagnoses; they do not establish which conditions caused the original iron deficiency or define a surveillance strategy.
Supplementary Materials
Supplementary Methods S1; Table S1, ancillary recorded-mortality models; Table S2, baseline and last-available laboratory measurements; Table S3, the dedicated post-infusion diagnosis spectrum; Table S4, first post-infusion malignancy sites; Table S5, crude and adjusted gastrointestinal associations; and the completed STROBE cohort checklist.
Author Contributions
F.E.G.U.: Conceptualization, methodology, data curation, and writing—original draft. E.N.Y.: Investigation and data curation. E.K.: Methodology, supervision, and writing—review and editing. M.T.: Conceptualization, supervision, and writing—review and editing.
Funding
This research received no external funding.
Institutional Review Board Statement
The study was approved by the Ondokuz Mayıs University Clinical Research Ethics Committee (approval no. 2026/261; 1 June 2026).
Informed Consent Statement
Informed consent was not required for this retrospective study.
Data Availability Statement
Patient-level data are not publicly available because they contain sensitive clinical information. De-identified data may be requested from the corresponding author, subject to institutional authorization and applicable confidentiality requirements. Aggregate statistical results and the analysis code are provided in the accompanying materials.
Acknowledgments
During manuscript preparation, the authors used OpenAI ChatGPT/Codex to assist with table formatting, statistical analyses and consistency checks, and language editing. The authors reviewed the AI-assisted outputs and take full responsibility for the final manuscript.
Conflicts of Interest
The authors declare no conflicts of interest.
References
- Iolascon, A.; Andolfo, I.; Russo, R.; et al. Recommendations for diagnosis, treatment, and prevention of iron deficiency and iron deficiency anemia. HemaSphere 2024, 8, e108. [Google Scholar] [CrossRef] [PubMed]
- Powers, J.M.; Lim, M.Y.; Achebe, M.O.; et al. American Society of Hematology 2026 guidelines for diagnosis of iron deficiency. Blood Adv. 2026 published online. 2026. [Google Scholar] [CrossRef] [PubMed]
- Kidney Disease: Improving Global Outcomes (KDIGO) Anemia Work Group. KDIGO 2026 Clinical Practice Guideline for the Management of Anemia in Chronic Kidney Disease (CKD). Kidney Int. 2026, 109(1S), S1–S99. [CrossRef] [PubMed]
- DeLoughery, T.G.; Jackson, C.S.; Ko, C.W.; Rockey, D.C. AGA Clinical Practice Update on Management of Iron Deficiency Anemia: Expert Review. Clin. Gastroenterol. Hepatol. 2024, 22, 1575–1583. [Google Scholar] [CrossRef] [PubMed]
- Snook, J.; Bhala, N.; Beales, I.L.P.; et al. British Society of Gastroenterology guidelines for the management of iron deficiency anaemia in adults. Gut 2021, 70, 2030–2051. [Google Scholar] [CrossRef] [PubMed]
- Ko, C.W.; Siddique, S.M.; Patel, A.; et al. AGA Clinical Practice Guidelines on the Gastrointestinal Evaluation of Iron Deficiency Anemia. Gastroenterology 2020, 159, 1085–1094. [Google Scholar] [CrossRef] [PubMed]
- Demb, J.; Liu, L.; Murphy, C.C.; Doubeni, C.A.; Martinez, M.E.; Gupta, S. Time to Endoscopy or Colonoscopy Among Adults Younger Than 50 Years With Iron-Deficiency Anemia and/or Hematochezia in the VHA. JAMA Netw. Open 2023, 6, e2341516. [Google Scholar] [CrossRef] [PubMed]
- Hung, N.; Shen, C.-C.; Hu, Y.-W.; Hu, L.-Y.; Yeh, C.-M.; Teng, C.-J.; Kuan, A.-S.; Chen, S.-C.; Chen, T.-J.; Liu, C.-J. Risk of cancer in patients with iron deficiency anemia: A nationwide population-based study. PLoS ONE 2015, 10, e0119647. [Google Scholar] [CrossRef] [PubMed]
- Krieg, S.; Loosen, S.; Krieg, A.; Luedde, T.; Roderburg, C.; Kostev, K. Association between iron deficiency anemia and subsequent stomach and colorectal cancer diagnosis in Germany. J. Cancer Res. Clin. Oncol. 2024, 150, 53. [Google Scholar] [CrossRef] [PubMed]
- von Elm, E.; Altman, D.G.; Egger, M.; Pocock, S.J.; Gøtzsche, P.C.; Vandenbroucke, J.P.; STROBE Initiative. The Strengthening the Reporting of Observational Studies in Epidemiology (STROBE) statement: Guidelines for reporting observational studies. J. Clin. Epidemiol. 2008, 61, 344–349. [Google Scholar] [CrossRef] [PubMed]
- Benchimol, E.I.; Smeeth, L.; Guttmann, A.; Harron, K.; Moher, D.; Petersen, I.; Sørensen, H.T.; von Elm, E.; Langan, S.M.; RECORD Working Committee. The REporting of studies Conducted using Observational Routinely-collected health Data (RECORD) statement. PLoS Med. 2015, 12, e1001885. [Google Scholar] [CrossRef] [PubMed]
- Shah, S.C.; Piazuelo, M.B.; Kuipers, E.J.; Li, D. AGA Clinical Practice Update on the Diagnosis and Management of Atrophic Gastritis: Expert Review. Gastroenterology 2021, 161, 1325–1332.e7. [Google Scholar] [CrossRef] [PubMed]
- Morgan, D.R.; Corral, J.E.; Li, D.; et al. ACG Clinical Guideline: Diagnosis and Management of Gastric Premalignant Conditions. Am. J. Gastroenterol. 2025, 120, 709–737. [Google Scholar] [CrossRef] [PubMed]
- Dinis-Ribeiro, M.; Libânio, D.; Uchima, H.; et al. Management of epithelial precancerous conditions and early neoplasia of the stomach (MAPS III): European Society of Gastrointestinal Endoscopy (ESGE), European Helicobacter and Microbiota Study Group (EHMSG) and European Society of Pathology (ESP) Guideline update 2025. Endoscopy 2025, 57, 504–554. [Google Scholar] [CrossRef] [PubMed]
- Rockey, D.C.; Altayar, O.; Falck-Ytter, Y.; Kalmaz, D. AGA Technical Review on Gastrointestinal Evaluation of Iron Deficiency Anemia. Gastroenterology 2020, 159, 1097–1119. [Google Scholar] [CrossRef] [PubMed]
- Rubio-Tapia, A.; Hill, I.D.; Semrad, C.; Kelly, C.P.; Greer, K.B.; Limketkai, B.N.; Lebwohl, B. American College of Gastroenterology Guidelines Update: Diagnosis and Management of Celiac Disease. Am. J. Gastroenterol. 2023, 118, 59–76. [Google Scholar] [CrossRef] [PubMed]
- Almilaji, O.; Smith, C.; Surgenor, S.; et al. Refinement and validation of the IDIOM score for predicting the risk of gastrointestinal cancer in iron deficiency anaemia. BMJ Open Gastroenterol. 2020, 7, e000403. [Google Scholar] [CrossRef] [PubMed]
Figure 1.
STROBE patient flow and overlapping analytical subgroups. Eleven patients younger than 18 years were excluded from the adult cohort. Follow-up beyond the verified index infusion was available for 1,085 adults. The post-infusion diagnosis, gastrointestinal biopsy, and malignancy subgroups overlap and must not be summed. Biopsy counts distinguish patients from reports.
Figure 1.
STROBE patient flow and overlapping analytical subgroups. Eleven patients younger than 18 years were excluded from the adult cohort. Follow-up beyond the verified index infusion was available for 1,085 adults. The post-infusion diagnosis, gastrointestinal biopsy, and malignancy subgroups overlap and must not be summed. Biopsy counts distinguish patients from reports.
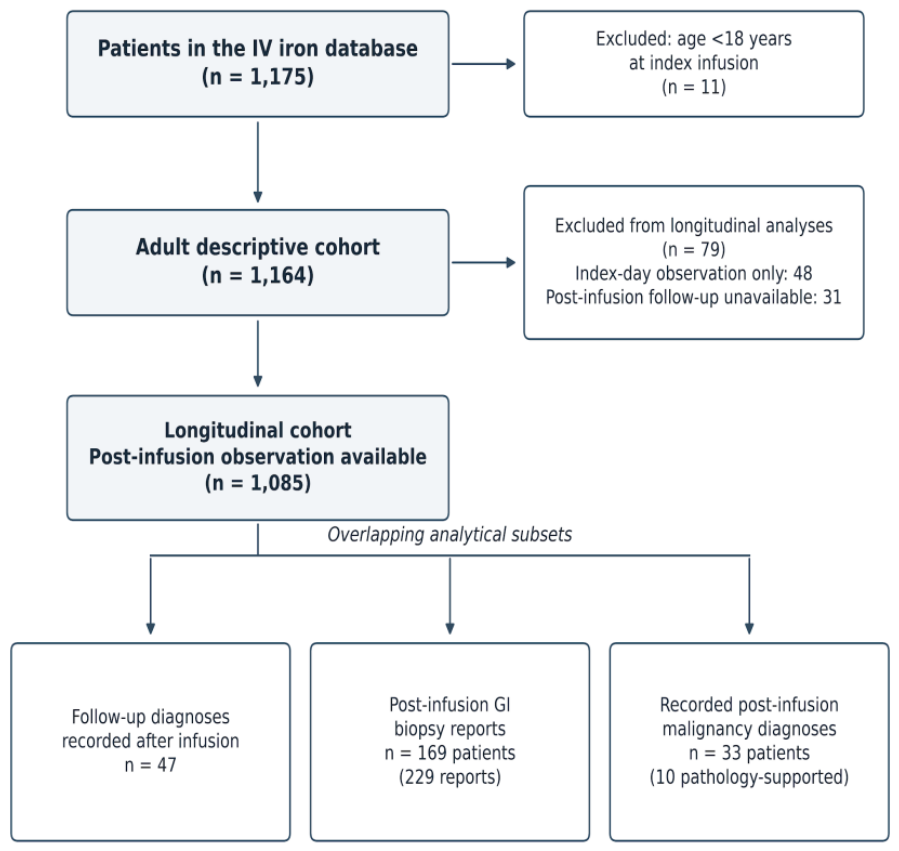

Table 1.
Demographic and baseline laboratory characteristics of the adult cohort (N=1,164).
| Characteristic | Available n | Median (IQR) or n (%) |
| Age, years | 1,164 | 49.1 (37.7–67.2) |
| Female sex | 1,164 | 877 (75.3%) |
| Hemoglobin, g/dL | 983 | 10.1 (8.8–11.3) |
| MCV, fL | 986 | 79.7 (71.3–86.9) |
| Ferritin, ng/mL | 804 | 17.84 (6.27–100.38) |
| TSAT, % | 623 | 8.6 (5.4–17.6) |
| Creatinine, mg/dL | 974 | 0.82 (0.64–1.68) |
| Albumin, g/dL | 722 | 4.30 (3.93–4.58) |
| Phosphate, mg/dL | 661 | 3.7 (3.3–4.3) |
| CRP, exact numerical results, mg/L | 367 | 7.47 (3.13–23.80) |
| ESR, mm/h | 724 | 33.0 (19.0–52.0) |
| LDH, U/L | 389 | 196.0 (169.0–234.0) |
IQR: interquartile range; MCV: mean corpuscular volume; TSAT: transferrin saturation; CRP: C-reactive protein; ESR: erythrocyte sedimentation rate; LDH: lactate dehydrogenase. Continuous CRP summaries include exact numerical results; 225 additional below-limit results were retained as censored observations.
Table 2.
Follow-up diagnosis documentation, chronology, and spectrum.
| Category | Patients n | Denominator |
| Positive diagnostic entry | 60 | 1,164 adults |
| Explicit no-additional-diagnosis entry | 541 | 1,164 adults |
| Diagnosis status not documented | 563 | 1,164 adults |
| Dated after infusion | 47 | 60 positive entries |
| On the infusion date | 1 | 60 positive entries |
| Dated before infusion | 6 | 60 positive entries |
| Without temporal assignment | 6 | 60 positive entries |
| Malignant diagnosis | 28 | 47 post-infusion diagnoses |
| Nonmalignant diagnosis | 16 | 47 post-infusion diagnoses |
| Premalignant lesion | 2 | 47 post-infusion diagnoses |
| Uncertain-behavior neoplasm | 1 | 47 post-infusion diagnoses |
The first three rows partition the adult cohort, the next four partition positive entries, and the final four partition diagnoses dated after infusion. The broader malignancy analysis uses additional linked sources (Table 4). Undocumented diagnosis status was not classified as absence of disease.
Table 3.
Post-infusion gastrointestinal findings among patients with biopsy reports (N=169).
| Report-based finding | Patients n (%) |
| Chronic gastritis | 151 (89.3) |
| Atrophy | 139 (82.2) |
| Intestinal metaplasia | 65 (38.5) |
| Atrophy and/or intestinal metaplasia | 143 (84.6) |
| H. pylori positivity | 41 (24.3) |
| Ulcer/erosion/potential bleeding finding | 30 (17.8) |
| Adenoma/dysplasia/premalignant finding | 16 (9.5) |
| Benign polyp | 14 (8.3) |
| Malignant tumor | 6 (3.6) |
| Villous atrophy | 4 (2.4) |
| Isolated intraepithelial lymphocytosis | 3 (1.8) |
| Histologic colitis | 3 (1.8) |
| Exploratory gastrointestinal composite | 52 (30.8) |
Each finding was counted once per patient across repeated reports; categories overlap. Percentages use all 169 patients in the biopsy subgroup, regardless of the anatomical sites sampled. Absence of a recorded finding does not imply that the relevant site was sampled and found normal. The malignant category includes one renal-cell carcinoma metastatic to the stomach. Ulcerative/erosive/potential bleeding findings may include endoscopic descriptions embedded in biopsy reports. The exploratory composite is defined inSection 2.5.
Table 4.
Evidence and chronology of post-infusion malignancy records (N=33).
| Classification | Patients n |
| Post-infusion malignancy record across linked sources | 33 |
| With available malignant pathology support | 10 |
| Neither dated prior malignancy nor undated cancer history | 27 |
| Dated prior malignancy evidence | 3 |
| Undated cancer history only | 3 |
| Different-site record after dated prior cancer | 1 |
The three history categories (27, 3, and 3 patients) partition the 33 patients. Pathology-supported and different-site records are overlapping subsets. Absence of a prior record does not confirm a cancer-free baseline; the different-site record was not classified as a confirmed second primary.
Table 5.
Exploratory baseline laboratory associations with the gastrointestinal composite.
| Marker / contrast | n / composite-positive | Adjusted OR (95% CI) | p | FDR q |
| Hb / per 1 g/dL | 151 / 45 | 1.04 (0.84–1.29) | 0.710 | 0.887 |
| MCV / per 10 fL | 151 / 45 | 1.28 (0.89–1.84) | 0.179 | 0.703 |
| Ferritin / per doubling | 125 / 35 | 1.08 (0.90–1.28) | 0.422 | 0.703 |
| TSAT / per 5 percentage points | 110 / 30 | 0.93 (0.78–1.11) | 0.397 | 0.703 |
| Creatinine / per doubling | 150 / 45 | 1.01 (0.63–1.61) | 0.978 | 0.978 |
Separate logistic models adjusted for age per 10 years and sex, with robust standard errors, among patients with post-infusion gastrointestinal biopsy reports. Model-specific available cases were used. FDR: false discovery rate; OR: odds ratio; CI: confidence interval. FDR adjustment covers the five marker tests.
Disclaimer/Publisher’s Note: The statements, opinions and data contained in all publications are solely those of the individual author(s) and contributor(s) and not of MDPI and/or the editor(s). MDPI and/or the editor(s) disclaim responsibility for any injury to people or property resulting from any ideas, methods, instructions or products referred to in the content. |
© 2026 by the authors. Licensee MDPI, Basel, Switzerland. This article is an open access article distributed under the terms and conditions of the Creative Commons Attribution (CC BY) license (http://creativecommons.org/licenses/by/4.0/).
Copyright: This open access article is published under a Creative Commons CC BY 4.0 license, which permit the free download, distribution, and reuse, provided that the author and preprint are cited in any reuse.