

Submitted:
11 October 2026
Posted:
12 October 2026
You are already at the latest version
Abstract
The stratospheric spring transition is the seasonal breakdown of the wintertime polar vortex and the progressive weakening of the westerly jet. It is a key dynamical event influencing stratosphere–troposphere coupling and medium-range weather predictability. Despite its importance, observational characterization of this transition is generally limited over the central Mediterranean area, a region of complex orography. In this study, we present an analysis of stratospheric wind structure derived from a series of radiosonde profiles at Decimomannu station (Sardinia, Italy) during May 2025. Soundings at 00 and 12 UTC provide vertical profiles of temperature, wind speed and direction, and relative humidity extending to the lower stratosphere. This dataset provides an observational perspective on the spring transition over the western Mediterranean, where orographic forcing from the Sardinian highlands and mesoscale marine circulation may locally modulate stratospheric wave activity. The main aim is the characterization of the mean zonal and meridional wind profiles in the stratosphere (15–20 km) and analysis of the temporal evolution of the zero-wind line, i.e., the altitude at which the zonal wind reverses sign, as a direct proxy for the progress of the spring transition. Finally, inertia-gravity wave activity was investigated by isolating wind perturbations from a slowly varying background estimated via a vertical running mean. Hodograph analysis of the residual profiles allows estimation of kinetic energy density and the orientation of dominant wave packets in the lower stratosphere. Results are expected to contribute to the observational characterization of this transitional regime and to serve as a reference for the validation of high-resolution NWP ICON simulations at the regional scale.
Keywords:
sudden stratospheric warming
; stratospheric polar vortex
; radiosonde
; numerical weather prediction
1. Introduction
In the last decades there has been increasing interest in the commercial usage of the stratosphere, especially for Earth observation systems. Being the horizontal motion of stratospheric balloons associated with winds, it is evident the relevance of accurate forecasts in this part of the atmosphere. Variability in stratospheric wind and temperature is mostly due to fluctuations in solar radiation and changes in composition (ozone depletion) [1]. The most distinctive phenomenon is the Sudden Stratospheric Warming (SSW), which occurs at high latitudes. During polar winter, stratosphere is very cold and a wide wind circulation rotating around the pole is visible, with westerly prevailing winds. However, with the start of spring, the Sun shines again over the polar regions and the stratosphere warms up [2], consequently the polar vortex loses strength and dissipates. The westerly winds also weaken, and they may even reverse direction. This change can propagate into the troposphere and influence the weather for weeks. Strong dynamical structures are expected, for this reason Numerical Weather Prediction (NWP) models generally struggle to reproduce this phenomenon. Numerical modeling of the stratosphere is therefore becoming an important issue for NWP centers, since stratosphere suffers from a lack of wind measurements, differently from the troposphere that is well monitored. For this reason, assessing the capabilities of NWP and reanalysis data in the middle atmosphere is a topic worth investigating [3].
In [4], long-term trends in temperature and wind climatology based on ERA5 data were analyzed, focusing on the pressure levels between 100–1 hPa, which covers the whole stratosphere. In [5], the author of the present work provided a review of wind prediction techniques in the stratosphere, achieved by the most popular global models: moreover, the capabilities of the COSMO limited area model to reproduce the wind speed in the stratosphere over a domain located in Southern Italy were investigated, assuming the radio sounding data at Pratica di Mare (Italy) airport as the reference. Monthly wind speed time series were also processed for selected heights by means of fast Fourier transform, revealing the existence of main frequencies and of a scaling regime with a power law of the form f−β over a broad range of time scales.
In [6], Song et al. extracted vertical and horizontal spectra in the stratosphere over southern China and investigated the connection with convective activity, demonstrating that the energy transfer among multiscale disturbances in the stratosphere is modulated by the convective activity. The spring transition in the whole middle atmosphere and the related connection between the final wind reversal in the stratosphere and mesosphere were investigated systematically in [2] by using global satellite observations from MLS and reanalysis data from MERRA-2. The impacts of SSW on three severe cold events over the northern hemisphere in early 2021 were investigated in [7] using ensemble forecasts, revealing that the stretching and weakening of the stratospheric polar vortex contributed to the cold event over Siberia.
The transition from western zonal winds (residuals of the winter vortex) to weaker summer eastern winds is often visible in May [8]. Despite its importance, observational characterization of this transition over the central Mediterranean area, a region of complex orography, is generally limited. Sardinia’s position in the Mediterranean basin makes it a strategic site for monitoring the tropospheric signatures of stratospheric warming events, whose downward dynamical coupling can modulate mid-latitude circulation across the region. Apart from the role in modulating large-scale circulation, SSW also disturbs the background wind and temperature fields through which gravity waves propagate, altering wave filtering, breaking heights and momentum deposition, motivating a joint analysis of stratospheric wind structure and gravity wave activity during such perturbed periods [9].
For this reason, this study includes the characterization of the mean zonal and meridional wind profiles in the lower stratosphere (15–20 km) and an analysis of the temporal evolution of the zonal wind reversal altitude, defined as the level where the mean zonal wind changes sign. This metric is used as a direct indicator of the progression of the stratospheric spring transition. In fact, in spring this inversion generally starts at the highest heights and then propagates downwards. When the whole column is easterlies dominated, the polar vortex can be considered completely dissipated. Moreover, inertia-gravity wave activity was investigated by isolating wind perturbations from a slowly varying background state, estimated by applying a vertical running mean to the observed profiles. The residual zonal and meridional perturbations were analyzed in the stratospheric layer using a hodograph approach. For each sounding, the covariance matrix of the perturbation field was used to estimate the perturbation kinetic energy density and the orientation of the hodograph major axis, which provides an approximation of the dominant wave propagation azimuth subject to a 180° directional ambiguity. The dominant vertical wavelength of the wave packets was further constrained by power spectral analysis.
The analysis provided in the present work aims to provide a reference benchmark to evaluate the capabilities of high-resolution NWP models in reproducing specific wind features in stratosphere. Specific targets include the ability of NWP to reproduce the descent of the zero-wind line, the vertical structure of the zonal wind during the westerly-to-easterly transition and the amplitude of gravity wave activity. This paper is organized as follows: Section 2 contains a description of the data and methodology adopted. Section 3 contains an analysis of averaged wind profiles. In Section 4, the identification process of zero wind line is described, while Section 5 contains an analysis of gravity waves and hodographs. Evaluation of Eddy Kinetic Energy is performed in Section 6, while implications for NWP validation are discussed in Section 7. Conclusions are then reported in Section 8.
2. Data and Methods
Data used in the present work is derived from a series of radiosonde from 1 to 31 May 2025 over Decimomannu, an Italian municipality with a population of approximately 10,000, located in the Metropolitan City of Cagliari, Sardinia (Figure 1). The climate is predominantly Mediterranean, characterized by hot, dry summers and relatively wet winters. Spring is pleasant and mild, in fact daytime maxima range between 18 °C and 25 °C during March–May. The entire area is strongly influenced by the Mistral (a north-westerly wind), which blows with high intensity throughout the year.
Soundings are available at 00 and 12 UTC and provide vertical profiles extending to the lower stratosphere. Currently, the Vaisala RS41-SG radiosonde is in use at the Italian Air Force Meteorological Service [10]. Specifically, an automatic sounding systems AUTOSONDE® MAS15 is adopted to modernize the upper air sounding system by fully automating the process of radiosonde preparation and balloon filling and release. Data were provided by the “Upper air BUFR—ECMWF” dataset, which is a collection of high-resolution upper air soundings by European Centre for Medium-Range Weather Forecasts (ECMWF), in the World Meteorological Organization’s (WMO) Binary Universal Form for the Representation of meteorological data (BUFR) format. Information captured at each level contains time, latitude and longitude displacement, geopotential height, pressure, temperature, dew point temperature, wind speed, wind direction, at 2s resolution. BUFR radiosonde data are archived at National Centers for Environmental Information (NCEI) and made available through the website https://www.ncei.noaa.gov/data/ecmwf-global-upper-air-bufr/ (accessed on 08 July 2026).
3. Average Wind Profiles
In stratosphere, winds are considered geostrophic (parallel to isobars), but at mid-latitudes they are characterized by a westerly component in winter and an easterly component in summer. The highest velocity values are about 40–50 m/s at 50 km above the Earth’s surface. In this section, an analysis of the average monthly wind profile and the average profiles per decade is presented, aimed at detecting the time evolution. Figure 2 shows the vertical profiles of zonal wind component U and wind speed over Decimomannu from the ground to about 22 km of altitude, averaged over 2025 May 1-31, and averaged per decades (1-10, 11-20, 21-31 May). All profiles display a well-defined tropospheric jet maximum near 10–12 km altitude, with mean speeds of 25–30 m/s, consistent with the climatological spring jet stream position over the western Mediterranean [11]. A clear intraseasonal evolution is evident in the stratospheric layer above 15 km. During the first decade (1–10 May), the zonal wind remains positive throughout the stratosphere, with values of 5–10 m/s between 15 and 20 km, indicative of a residual wintertime westerly regime. During the second decade (11–20 May) U decreases substantially, approaching zero near 18–20 km. In the third decade (21–31 May), U remains slightly negative above approximately 18 km, suggesting the onset of the easterly summer regime. This transition is further quantified by the zero-wind line analysis presented in Section 4. The total wind speed profiles confirm this picture, since stratospheric wind speeds decrease from approximately 8–12 m/s during 1–10 May to 3–5 m/s during 21–31 May, while the tropospheric jet remains comparatively stable across the three decades, highlighting that the dynamical transition is confined primarily to the stratosphere during this period. The altitude of the U maximum remains constant across all three decades, revealing that the westerly jet weakens in situ rather than migrating to lower levels during the transition, a behavior that reflects the specific dynamical conditions of the western Mediterranean stratosphere.
Table 1 summarizes the maximum, minimum values and standard deviation (m/s) of the zonal wind U, averaged over the whole month and over the three consecutive decades. The maximum zonal wind decreases monotonically from 31.23 m/s during 1–10 May to 14.56 m/s during 21–31 May, with a reduction of approximately 53% over 20 days, confirming the rapid weakening of the stratospheric westerly jet during the spring transition at Decimomannu. Negative values of U are already observed during the second decade, indicating that easterly episodes in the stratosphere occur in mid-May, before that the zonal mean flow reverses sign. This fact suggests that the spring transition is characterized by an early onset of localized easterly anomalies superimposed on a still-dominant westerly background, consistent with the intermittent descent of the zero-wind line observed around 14–15 May (see Section 4).
The standard deviation of U exhibits non-monotonic behavior, peaking during the second decade (13.8 m/s) when the transition is most active and the flow is neither in the winter nor in the summer regime. The lower standard deviation values observed during the first and third decades reflect the greater dynamical stability of the established regimes.
4. Zero Zonal Level Identification (Zero Wind Line)
SSW is based on three basic mechanisms: propagation of Rossby waves from the troposphere, interaction of the waves with the mean flow (due to wave breaking and dissipation) and finally an induced mean meridional overturning circulation leading to rapid adiabatic warming [1]. In winter, the stratospheric polar vortex is characterized by strong westerly winds covering a large portion of the stratospheric column. As explained, the polar vortex in spring loses strength, while the westerly winds weaken and reverse direction. The altitude at which the mean zonal wind shifts from westerlies (U > 0) to easterlies (U < 0) is significant because it serves as a direct measure of the stratosphere’s dynamic state during the seasonal transition. During spring, the reversal from westerlies to easterlies generally begins at higher altitudes; it subsequently propagates downward and once the entire stratospheric column is dominated by easterlies, the polar vortex can be considered fully dissolved. Therefore, the altitude of the U = 0 level (Zero Wind Line, ZWL) provides a simple measure about how the transition has progressed.
Figure 3 shows the time history of ZWL at Decimomannu over May 2025, along with the associated polynomial interpolation The red line clearly shows that the inversion height descends from 21.8 km in early May until about 20 km at the end of the month, with a total reduction of about 2 km in 30 days. This is an evident proof of the stratospheric wind transition with the weakening of the polar vortex. Specifically, during May 1-13 the ZWL maintains about high constant values and the stratosphere is in winter regime, with westerlies winds extending up to high heights. The ZWL decreases sharply to approximately 19 km on 14 May and then rapidly recovers to 22 km by 18 May. This dynamically significant event during the first half of the month may be associated with an episode of Easterly-air intrusion from the upper stratosphere. During 18–27 May, day-to-day fluctuations become more pronounced, with variations of approximately 1–2 km, while the polynomial trend continues to decrease toward about 21 km, indicating that the stratosphere has entered an active transition phase. During 28–31 May, the ZWL drops sharply from approximately 22 km to 17.5 km, corresponding to a decrease of more than 4 km within only three days.
The rate descent is consistent with values presented in [12], in which an analysis of the stratospheric Quasi-Biennial Oscillation (QBO) was performed using 41 years (1958-1998) of NCEP reanalyses data, characterizing the time progression and vertical structure of the equatorial zonal wind regimes, including the zero wind lines.
5. Gravity Waves and Hodographs
Atmospheric gravity waves are universal perturbations generated by processes such as orographic forcing, convection, jet-front imbalance. They play a main role in redistributing energy and momentum throughout the atmosphere [13]. As they propagate upward into regions of decreasing density, their amplitude grows until instability or critical-level filtering leads to wave breaking, depositing momentum that can significantly alter the background wind field. This momentum deposition is recognized as a key driver of middle-atmosphere circulation, influencing phenomena ranging from the Quasi-Biennial Oscillation to the dynamical coupling between the stratosphere and troposphere. Zink and Vincent [14] analyzed stratospheric gravity waves over Macquarie Island revealing a strong seasonal cycle with winter peaks in wave energy, dominated by downward energy propagation and south-westerly momentum fluxes. Furthermore, their ray-tracing simulations demonstrated that these localized wave packets induce critical mean-flow accelerations in the upper atmosphere, exceeding earlier standard estimate.
Among the observational techniques available for characterizing gravity wave activity, the hodograph method allows the extraction of wind perturbations from the background flow and the estimation of eddy kinetic energy, providing a practical means of quantifying wave activity and its vertical variability. A statistical analysis on seasonal and annual variation of gravity waves in the tropical lower stratosphere is presented in [15], while gravity wave activity and its variation with position and time was investigated in [16], to get information of wave sources by wave parameter analysis.
The extraction of gravity waves has been conducted following the approach described in [6], with the calculation of the background field (slow variation of wind with height) of the original vertical profile and then the definition of perturbation profile (Uʹ, V’) (fast oscillations produced by gravity waves) by subtracting the background profile from the original one (U, V). A 3-km window has been chosen to filter structures characterized by vertical length between 1 and 3 km (as in the case of gravity waves) [15,17]. Profiles of U’ and V’ are shown in Figure 4 (a,b) respectively for the radiosonde flight on May 01 (00 UTC), characterized by low gravity wave activity (EKE ~ 0.2 m2/s2), and 30 May 12 UTC, corresponding to the most energetic episode of the month (EKE ~ 6.9 m2/s2) (see Section 6). As regards U’, the contrast between the two profiles is noticeable: perturbation amplitudes on 30 May reach ± 5–6 m/s and are larger than those observed on 1 May, consistent with the difference in EKE between the two soundings. The profiles are generally dominated by waves with wavelengths of about 2.5 km, which are typical of inertial gravity waves in low stratosphere at middle latitudes. Both profiles exhibit a quasi-periodic vertical structure, but with different features, since the black line is less regular with a shorter wavelength, while the red line is characterized by wavelength of about 2-3 km, well visible between 16 and 21 km. The analysis of V’ profile reveals that the wave amplitudes are comparable with those of U’, suggesting that the wave frequency is close to the Coriolis parameter (f = 9.2 × 10⁻⁵ s−1 at 39°N), indicative of near-inertial oscillations. As expected, a phase shift of about a quarter of wavelength between the two components is observed in the 30 May profile, consistent with the polarization relations of inertia-gravity waves. In contrast, the 1 May profile shows smaller amplitudes with a less coherent vertical structure, consistent with the low EKE value characterizing the beginning of the month.
Figure 5 shows the hodograph of the perturbation motion (U’ vs. V’), related to the radio sounding already considered. The hodograph of the 30 May 12 UTC sounding displays a well-defined elliptical structure, with semi-axes of approximately 5–6 m/s, in contrast with the less coherent hodograph of 1 May 00 UTC, which remains within 4 m/s and shows no dominant elliptical pattern. The well-organized structure on 30 May provides direct evidence of a coherent inertia-gravity wave packet in the 15–22 km layer. This ellipse is nearly circular, confirming that the intrinsic frequency of the dominant wave is close to the local inertial frequency f. On the other side, the hodograph of 1 May 00 UTC shows a more complex structure without a dominant elliptical pattern, consistent with the superposition of several low-amplitude wave components and the absence of a single energetically dominant wave packet, as also reflected in the low EKE value.
The hodograph rotates clockwise with increasing altitude, which in the Northern Hemisphere indicates upward propagation of wave energy [18]. This result is consistent with a tropospheric wave source, such as orographic forcing from the Sardinian highlands, convective activity or jet stream instability, with wave energy propagating upward into the lower stratosphere. The temporal coincidence with the rapid descent of the zero-wind line on 29–30 May further supports the interpretation of an intense upward-propagating wave episode interacting with the stratospheric background flow near the critical level.
Figure 6 shows the power spectra of zonal (a) and meridional (b) wind perturbations on May 01 (00 UTC) and May 30 (12 UTC). Values of the main wavelengths are summarized in Table 2. Regarding U’, the power spectral analysis on 30 May 12 UTC reveals a dominant spectral peak at a vertical frequency of approximately 4 × 10⁻⁴, corresponding to a dominant vertical wavelength λ = 1.78 km. This peak is narrow with amplitude of about 1650, representing a well-defined packet. A second wave is characterized by λ = 1.01 km. On May 01 00 UTC, two main waves are also visible, with slightly shorter wavelengths. Regarding V’, the same wavelength as U’ was found on May 30, providing spectral confirmation that the two wind components belong to a single coherent wave packet, rather than to independent disturbances. The peak amplitude is slightly smaller (about 1250), leading to a ratio of spectral amplitudes of about 0.76, i.e., an energy ratio of about 0.58. This ratio implies an elliptical hodograph with the major axis oriented along the zonal direction, consistent with the hodograph analysis presented. On May 01 00 UTC, the two main waves are characterized by λ = 3.57 and 0.71 km.
The estimate presented is consistent with the visual inspection of the U’(z) and V’(z) profiles and falls within the range typical of inertia-gravity waves in the extratropical lower stratosphere.
6. Eddy Kinetic Energy Evaluation
The overall intensity of the wave activity is quantified through the kinetic energy of perturbation per unit mass, commonly referred to as Eddy Kinetic Energy (EKE). It can be calculated introducing the covariance matrix. Specifically, for each profile the second-order statistics of the perturbation field are condensed into a 2×2 covariance matrix, defined as:
In which, the diagonal elements represent the variance of the zonal and meridional perturbations respectively, while the off-diagonal element is their covariance:
N is the number of vertical levels in the range 15–22 km. The eigenvector associated with the larger eigenvalue of this matrix defines the orientation of the major axis of the hodograph ellipse while its angle Theta with respect to the zonal direction provides an estimate of the dominant wave propagation azimuth, subject to a 180° directional ambiguity inherent to the hodographic method [18]. In other words, Theta is the angle (in degrees, measured from East to North) along which the oscillation of the perturbed wind vector preferentially aligns as altitude increases. For inertial gravity waves, this angle is perpendicular to the wave’s horizontal propagation direction. The EKE is calculated as:
And represents a measure of the random motion intensity with respect to the background, providing a scalar measure of the wave energy content integrated over the 15–22 km layer for each individual sounding. It is used here to track the temporal evolution of gravity wave activity throughout May 2025.
Daily values of EKE were calculated using three different datasets: (i) 12:00 UTC radio soundings only, (ii) 00:00 UTC radio soundings only and (iii) daily values obtained by averaging the EKE calculated from the two soundings. The corresponding time series are shown in Figure 7.
The daily EKE in the 15–22 km layer ranges from near-zero values to a maximum of approximately 5 m2/s2 (12 UTC 30 May), with a monthly mean of 0.6 m2/s2. This range is consistent with values reported for the extratropical lower stratosphere during the spring transition season [15]. During the first half of May (1–14), gravity wave activity is generally suppressed, with daily EKE remaining below 0.3 m2/s2 except for an isolated enhancement at 00 UTC on 11 May (1.6 m2/s2), which was not sustained at the subsequent 12 UTC sounding. A comparison of the 00 and 12 UTC soundings reveals no persistent diurnal cycle in EKE throughout the month. The two series alternate without a systematic offset, suggesting that gravity wave sources during May 2025 were episodic. The most active episode over the observational period occurred during 29–30 May, when EKE exceeded 5 m2/s2 at both sounding times and peaked at approximately 6.9 m2/s2 at 12 UTC on 30 May. The rapid onset and decay of this event, confined to a 48-hour window, is indicative of a transient forcing mechanism, possibly associated with enhanced tropospheric forcing or a synoptic-scale disturbance over the western Mediterranean. The EKE peak coincides exactly with the already discussed ZWL final collapse, and this relationship is physically plausible, as energetic gravity waves can deposit momentum, thereby accelerating the seasonal transition through a lowering of the critical level.
Figure 8 shows the time series of the absolute value of hodograph major axis Theta angle over May 2025 at 00, 12 and average daily values, revealing values predominantly in the range 40°–90° throughout May 2025. This indicates that the dominant wave packets tend to propagate along an oblique-to-meridional axis. Since the hodograph major axis is aligned with the horizontal wavevector, this orientation implies a significant meridional component of propagation. A possible explanation is directional filtering by the seasonal weakening and reversal of the stratospheric zonal wind, which favors critical-level absorption of waves with zonal phase speeds close to the background flow. This result is physically consistent with a wave field generated by the tropospheric westerly jet stream. A notable exception is observed around 12–14 May, when Theta drops toward 0°–10°, indicating a near-zonal orientation of the hodograph major axis. This anomalous episode coincides with the transient depression of the zero-wind line documented in Figure 3, indicating a possible change in the wave source or propagation conditions during this short-lived dynamical event. On 29 May 00 UTC, coinciding with the EKE maximum, Theta reaches approximately 85°, confirming the near-meridional orientation of the hodograph major axis already identified from the individual hodograph analysis. This is consistent with forcing by the synoptic-scale flow or orographic interaction with the Sardinian highlands.
7. Implications for Numerical Weather Prediction Validation
The observational analysis presented in this study provides a valuable benchmark for the evaluation of high-resolution Numerical Weather Prediction (NWP) models in stratosphere over the central Mediterranean. Radiosonde profiles provide high-vertical-resolution measurements of the atmospheric state that are independent of the model first guess, making them particularly suited for assessing model performance in the stratosphere, where observational constraints are sparse compared to the troposphere. In this context, the results obtained in the present work, including decade-averaged zonal wind profiles, temporal evolution of the zero-wind line and the gravity wave kinetic energy, can be systematically compared against the output of NWP models, e.g., the ICON (Icosahedral Nonhydrostatic) model developed by the German Weather Service (DWD) and the Max Planck Institute for Meteorology [19]. At kilometer-scale horizontal resolutions, ICON is expected to explicitly resolve a significant part of the mesoscale gravity wave spectrum that is parameterized in coarser operational configurations. The May 2025 period is particularly demanding in this respect, as the rapid stratospheric spring transition, characterized by about 4 km descent of the zero-wind line over 30 days and episodic EKE peaks exceeding 6 m2 s−2, provides a dynamically rich test case for model evaluation. Specific interests include the ability of high-resolution ICON to reproduce the observed rate of descent of the zero-wind line, the vertical structure of the zonal wind during the westerly-to-easterly transition and the amplitude of stratospheric gravity wave activity as represented by EKE. Discrepancies between modelled and observed EKE would provide direct evidence of deficiencies in the model’s dynamical core or its gravity wave parameterization scheme, with implications for stratosphere–troposphere coupling and medium-range forecast skill over the Mediterranean region. It is worth noting that the forecast accuracy of stratosphere is closely related to the forecast skill in troposphere. In fact, as shown in [7], the prediction of cold weather events can be improved by more accurate forecasts of the key features of the evolution of the stratospheric polar vortex with a lead time of about two weeks.
The present observational dataset acquires additional relevance in the context of the ongoing transition toward artificial intelligence weather forecasting models (AIWFMs). In recent years, the development of artificial intelligence weather prediction models has revolutionized the world of weather forecasting. The possibility of improving the prediction of winds in the lower stratosphere using machine learning was demonstrated by Candido et al. [20]. Recently, GraphCast developed by Google DeepMind has been proven to outperform state-of-the-art NWP models at the surface and in the lower troposphere. However, Wu [21] showed that GraphCast fails to predict sudden stratospheric warmings due to its inability to simulate the wave-mean flow interactions. For this reason, a scarce stratospheric forecast after SSWs can lead to larger errors in surface predictions on a sub seasonal timescale. This suggests that AIWFMs are not yet mature for operational stratospheric prediction and that NWP models, including high-resolution configurations of ICON, will continue to play a central role in this dynamical regime for the foreseeable future.
6. Conclusions
In this study, an observational analysis of stratospheric wind structure and gravity wave activity over Decimomannu (Sardinia, Italy) was presented. The dataset is based on a one-month series of twice-daily radiosonde profiles collected during May 2025, comprising 62 soundings with wind, temperature and humidity coverage from the surface to the lower mesosphere. It provides a detailed picture of the stratospheric spring transition at a dynamically relevant location in the western Mediterranean.
The decade zonal wind profiles reveal a rapid weakening of the stratospheric westerly jet during the month, with a reduction of approximately 53% over 20 days. Negative zonal wind values appear already during the second decade, indicating that the onset of easterly episodes precedes the full reversal of the mean flow and that the spring transition at this location is characterized by an early onset of localized easterly anomalies superimposed on westerly background.
The temporal evolution of the zero-wind line shows a quasi-monotonic descent, consistent with the progressive breakdown of the polar vortex and the retreat of the westerly jet. A transient depression of the zero-wind line around 14–15 May, followed by a rapid recovery, reveals a short-lived dynamical perturbation superimposed on the general downward trend.
Gravity wave activity, quantified through the perturbation kinetic energy density derived from hodograph analysis of the residual wind profiles, exhibits a strongly intermittent character throughout the month. The EKE time series is characterized by values generally below 1 m2 s−2 during the first half of the month, with a pronounced and rapid intensification during 28–31 May. The temporal coincidence of the EKE maximum with the rapid descent of the zero-wind line during 28–31 May highlights a dynamical interaction between the propagating wave and the background flow near the critical level, accelerating the final stages of the spring transition. The hodograph of this most energetic event displays a well-defined ellipse with clockwise rotation with height, indicative of a coherent near-inertial wave packet propagating energy upward from a tropospheric source.
The observational results presented here provide a valuable benchmark for the validation of high-resolution numerical weather prediction models over the central Mediterranean. High-quality radiosonde observations such as those presented here thus remain essential both as validation benchmarks for NWP models and as independent ground truth against which the stratospheric performance of next-generation AIWFMs can be assessed.
Funding
This research received no external funding.
Data Availability Statement
Data stored at CIRA supercomputing center and available on request.
Acknowledgments
Alessandra Lucia Zollo (CIRA) is acknowledged for providing radio-sounding data.
Conflicts of Interest
The author declares no conflict of interest.
References
- Butchart, N. The stratosphere: a review of the dynamics and variability. Weather Clim. Dynam. 2022, 3, 1237–1272. [Google Scholar] [CrossRef]
- Matthias, V.; Stober, G.; Kozlovsky, A.; Lester, M.; Belova, E.; Kero, J. Vertical structure of the Arctic spring transition in the middle atmosphere, 2021. J. Geophys. Res. Atmos. 126, e2020JD034353. [CrossRef]
- Duruisseau, F.; Huret, N.; Andral, A.; Camy-Peyret, C. Assessment of the ERA-Interim Winds Using High-Altitude Stratospheric Balloons, 2017. J. Atmos. Sci. 74, 2065–2080. [CrossRef]
- Kozubek, M.; Lastovicka, J.; Zajicek, R. Climatology and Long-Term Trends in the Stratospheric Temperature and Wind Using ERA5, 2021. Remote Sens. 13, 4923. [CrossRef]
- Bucchignani, E. Wind Predictions in the Lower Stratosphere: State of the Art and Application of the COSMO Limited Area Model, 2022. Meteorology 1, 311–326. [CrossRef]
- Song, Y.; He, Y.; Sheng, Z.; Leng, H.; Sun, D.; Bai, Z.; Wang, J. Characteristics of stratospheric gravity wave spectra and their dynamic linkage with convection, 2025. Geophys. Res. Lett. 52, e2025GL117204. [CrossRef]
- Zhang, M.; Yang, X. Y.; Huang, Y. Impacts of sudden stratospheric warming on extreme cold events in early 2021: An ensemble-based sensitivity analysis, 2022. Geophys. Res. Lett. 49, e2021GL096840. [CrossRef]
- Hardiman, S. C.; et al. Improved predictability of the troposphere using stratospheric final warmings, 2011. J. Geophys. Res. 116, D18113. [CrossRef]
- Charlton, A.J.; Polvani, L.M. A New Look at Stratospheric Sudden Warmings. Part I: Climatology and Modeling Benchmarks. J. Clim. 2007, 20(3), 449–469. [Google Scholar] [CrossRef]
- Vaisala, Automation for modernization. Available online: https://www.vaisala.com/sites/default/files/documents/WEA-DEF-CaseStudy-Italian%20Air%20Force-B212306EN-A.pdf (accessed on 10/09/2026).
- Baldi, M.; Gaetani, M.; Dalu, G.; Maracchi, G. Jetstream and SeasonalAnomalies in the Mediterranea, 2008. Boll. Geofis. a. XXXI, 1-4, 51–69.
- Huesmann, A. S.; Hitchman, M.H. The stratospheric quasi-biennial oscillation in the NCEP reanalyses: Climatological structures, 2001. J. Geophys. Res. 106(D11), 11859–11874. [CrossRef]
- Li, W.; Ma, H.; Cai, Z. The Statistical Characteristics of Gravity Waves over Wuhan, 2011. Procedia Environ. Sci. 10, 1357–1363. [CrossRef]
- Zink, F.; Vincent, R. A. Wavelet analysis of stratospheric gravity wave packets over Macquarie Islan, 2001. J. Geophys. Res. 106(D10), 10275–10288. [CrossRef]
- Vincent, R. A.; Alexander, M.J. Gravity waves in the tropical lower stratosphere: An observational study of seasonal and interannual viability, 2000. J. Geophys. Res. 105(D14), 17971–17982. [CrossRef]
- Allen, S. J.; Vincent, R.A. Gravity wave activity in the lower atmosphere: Seasonal and latitudinal variations, 1995. J. Geophys. Res. 100, 1327–1350. [CrossRef]
- Tsuda, T.; Murayama, Y.; Wiryosumarto, H.; Harijono, S. W. B.; Kato, S. Radiosonde observations of equatorial atmosphere dynamics over Indonesia, 1994. J. Geophys. Res. 99(D5), 10491–10506. [CrossRef]
- Eckermann, S. D. Hodographic analysis of gravity waves: Relationships among Stokes parameters, rotary spectra and cross-spectral methods, 1996. J. Geophys. Res. Atmos. 101(D14), 19169–19174. [CrossRef]
- Zängl, G.; Reinert, D.; Rípodas, P.; Baldauf, M. The ICON (ICOsahedral Non-hydrostatic) modelling framework of DWD and MPI-M: Description of the non-hydrostatic dynamical core. Q. J. R. Meteorol. Soc. 2015, 141, 563–579. [Google Scholar] [CrossRef]
- Candido, S.; Singh, A.; Delle Monache, L. Improving Wind Forecasts in the Lower Stratosphere by Distilling an Analog Ensemble into a Deep Neural Network, 2020. Geophys. Res. Lett. 2020, 47, e2020GL089098. [Google Scholar] [CrossRef]
- Wu, Z. Assessing subseasonal predictions of stratosphere-troposphere coupling of GraphCast, 2026. J. Geophys. Res. Atmos. 131, e2025JD044852. [CrossRef]
Figure 1.
Location of Decimomannu (Sardinia) in the context of Italian peninsula.
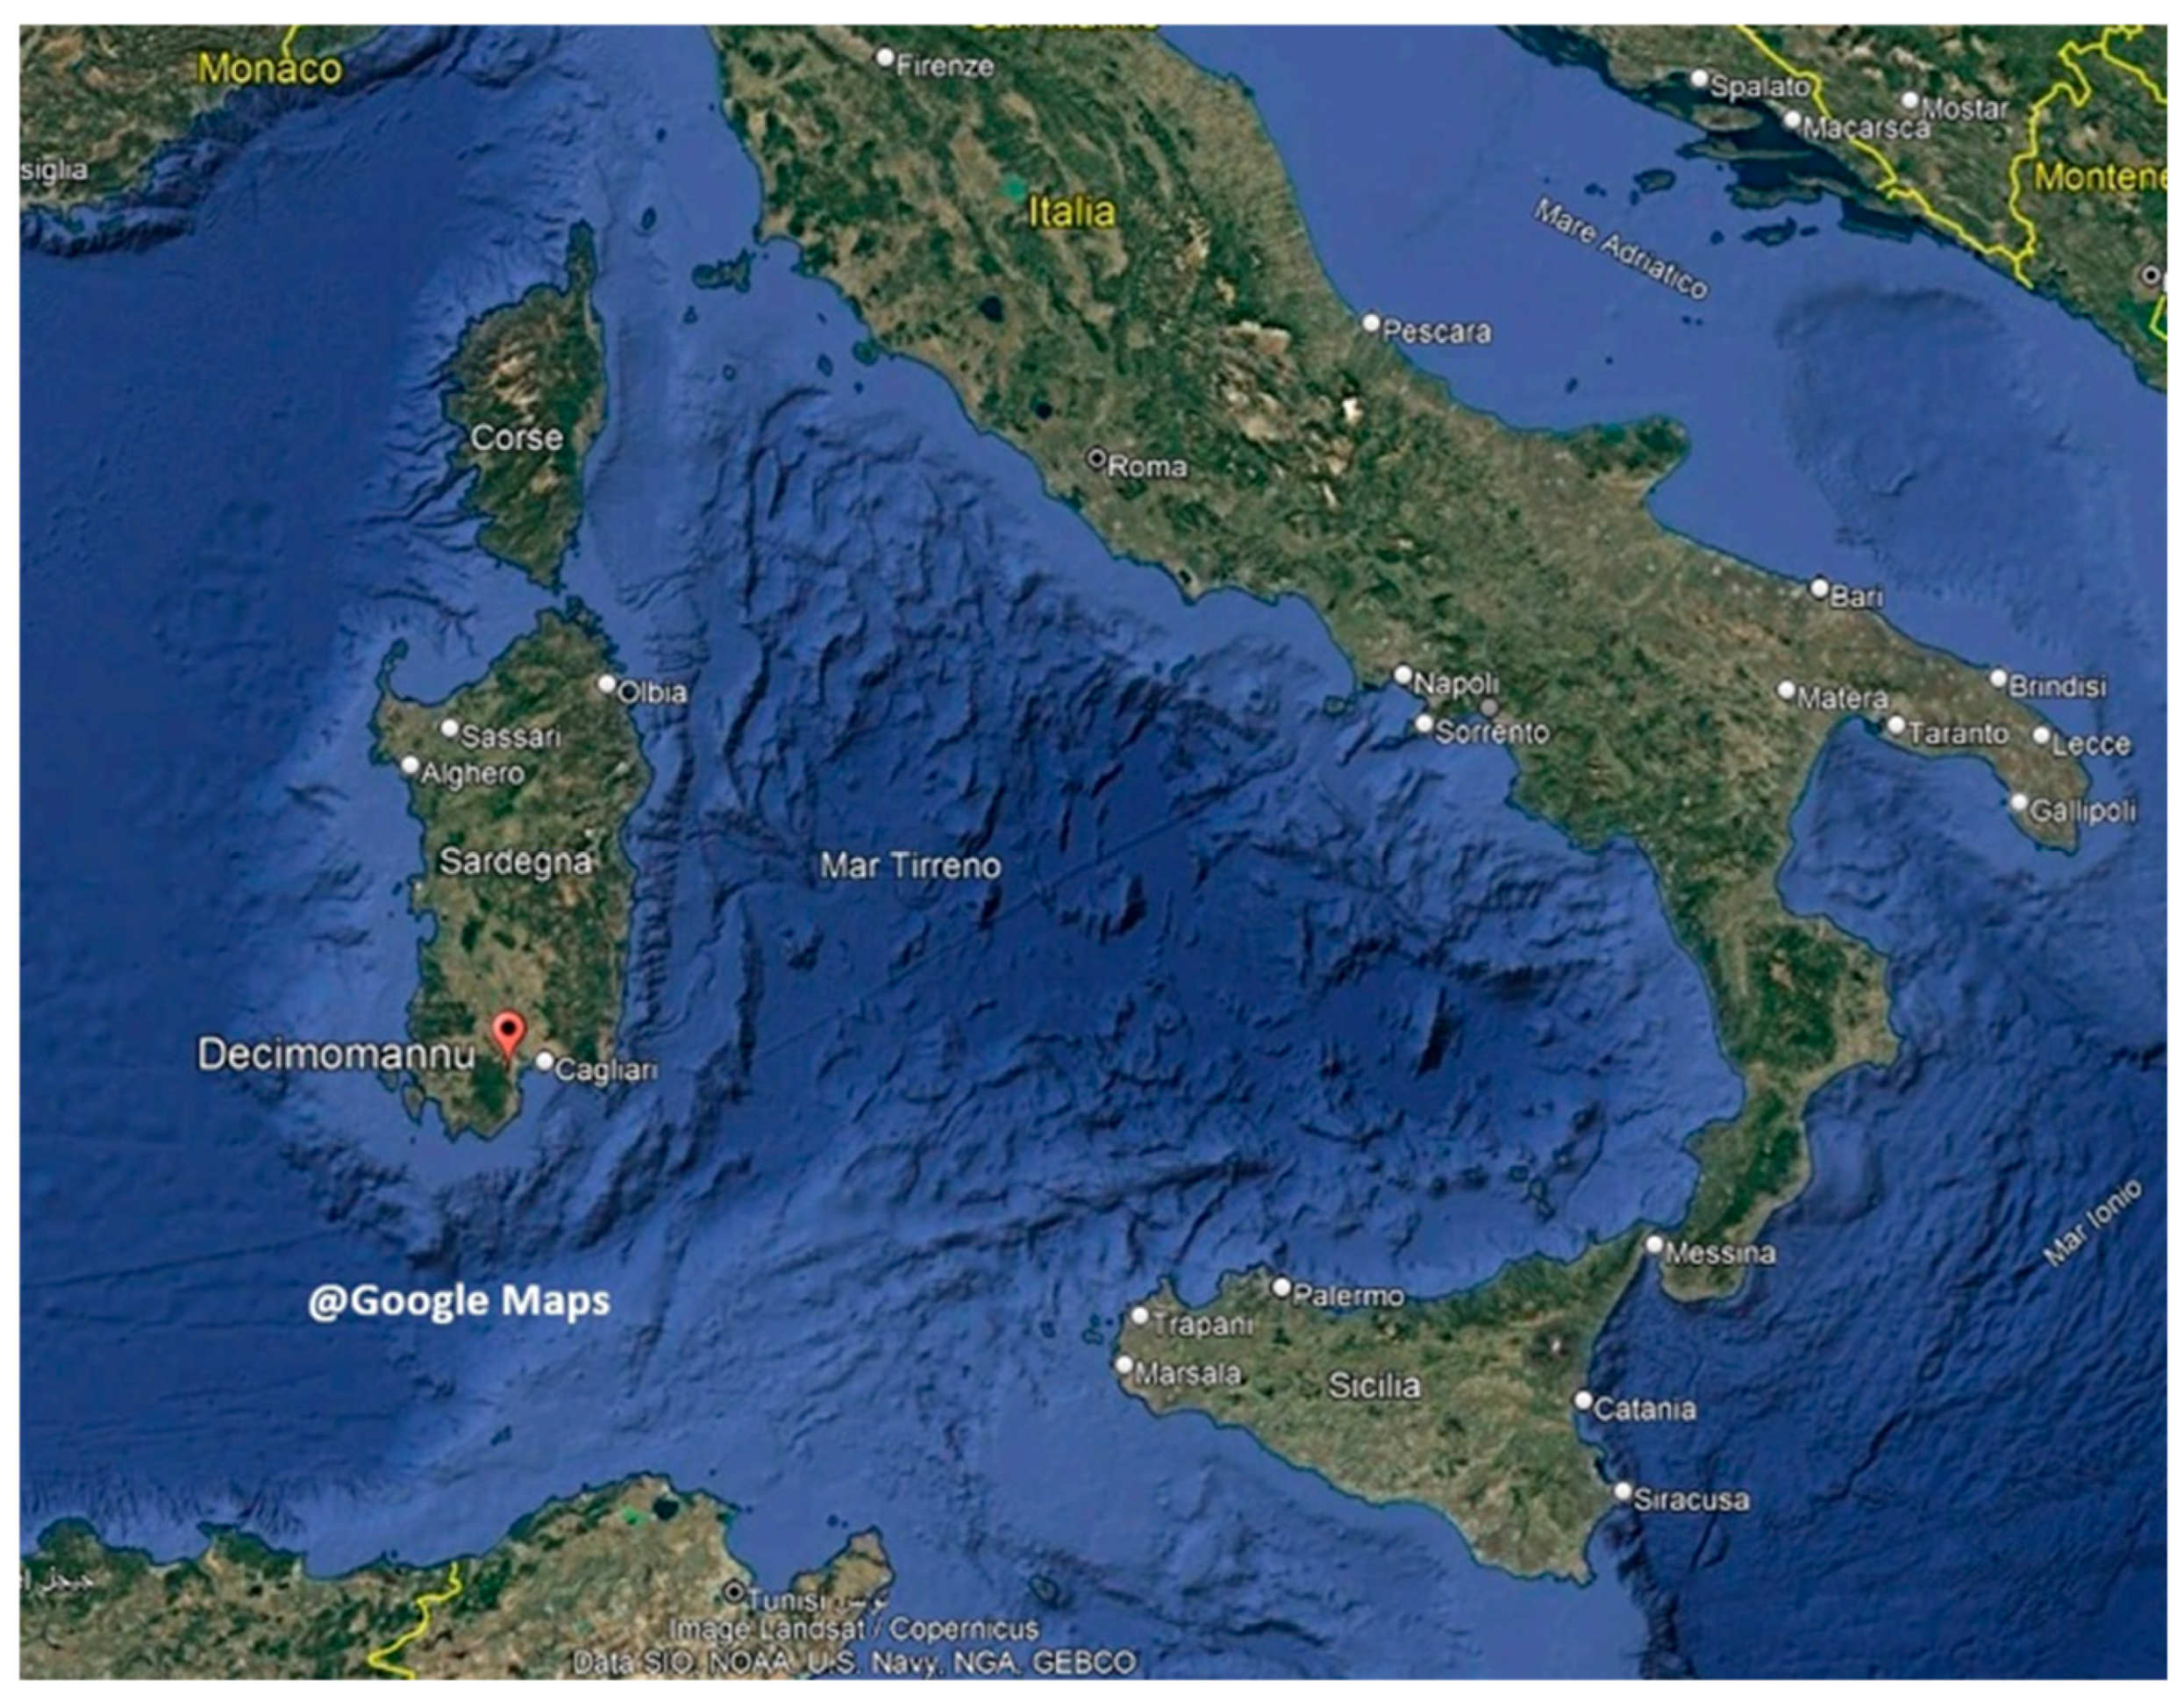
Figure 2.
Vertical profile of U (left) and wind speed (right), averaged over 2025 May 1-31, and averaged per decades (1-10, 11-20, 21-31 May).
Figure 2.
Vertical profile of U (left) and wind speed (right), averaged over 2025 May 1-31, and averaged per decades (1-10, 11-20, 21-31 May).
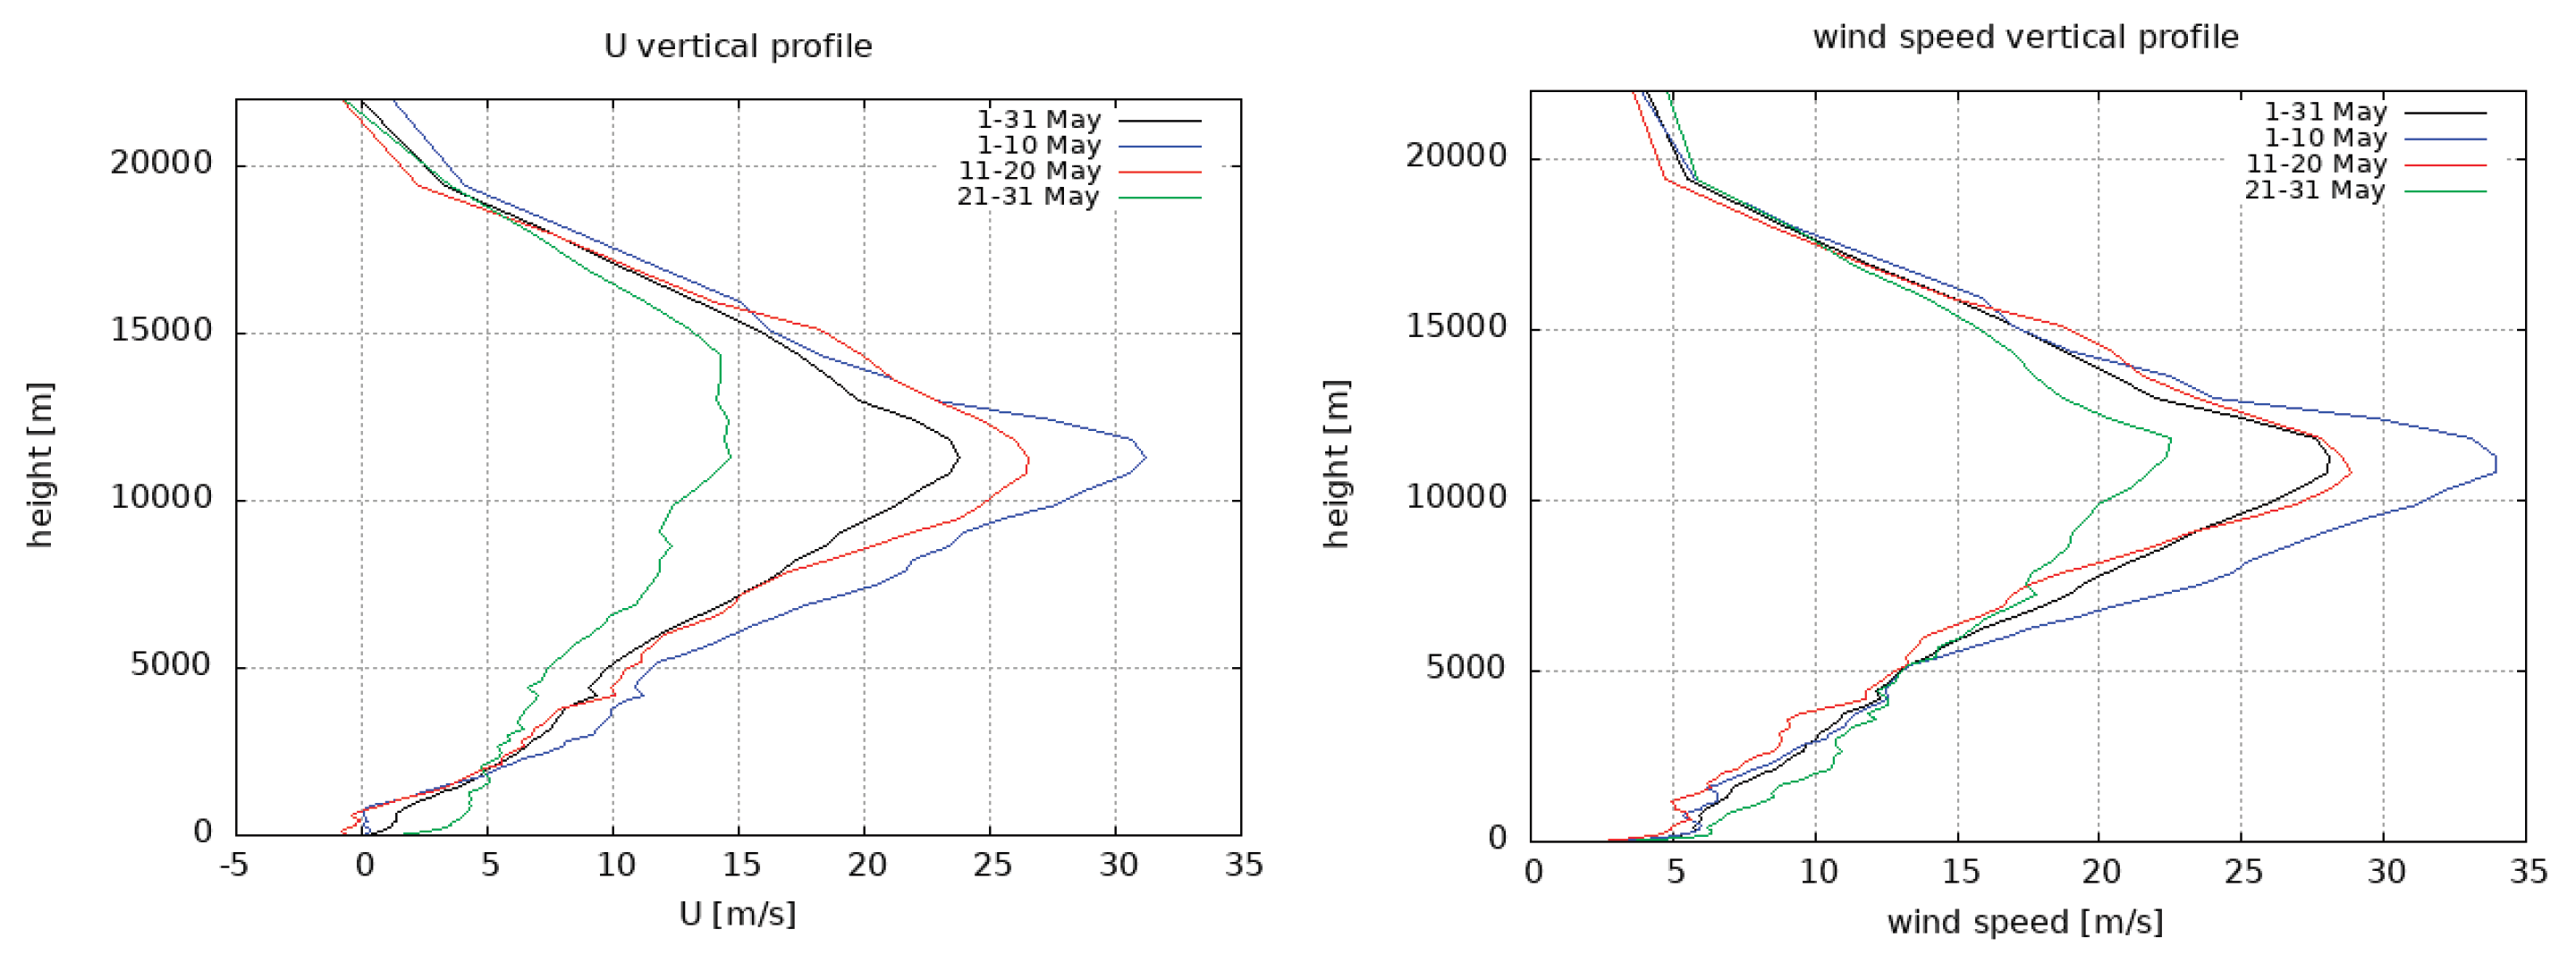
Figure 3.
Time history of Zero Wind Line (ZWL) over May 2025 and associated polynomial interpolation.
Figure 3.
Time history of Zero Wind Line (ZWL) over May 2025 and associated polynomial interpolation.
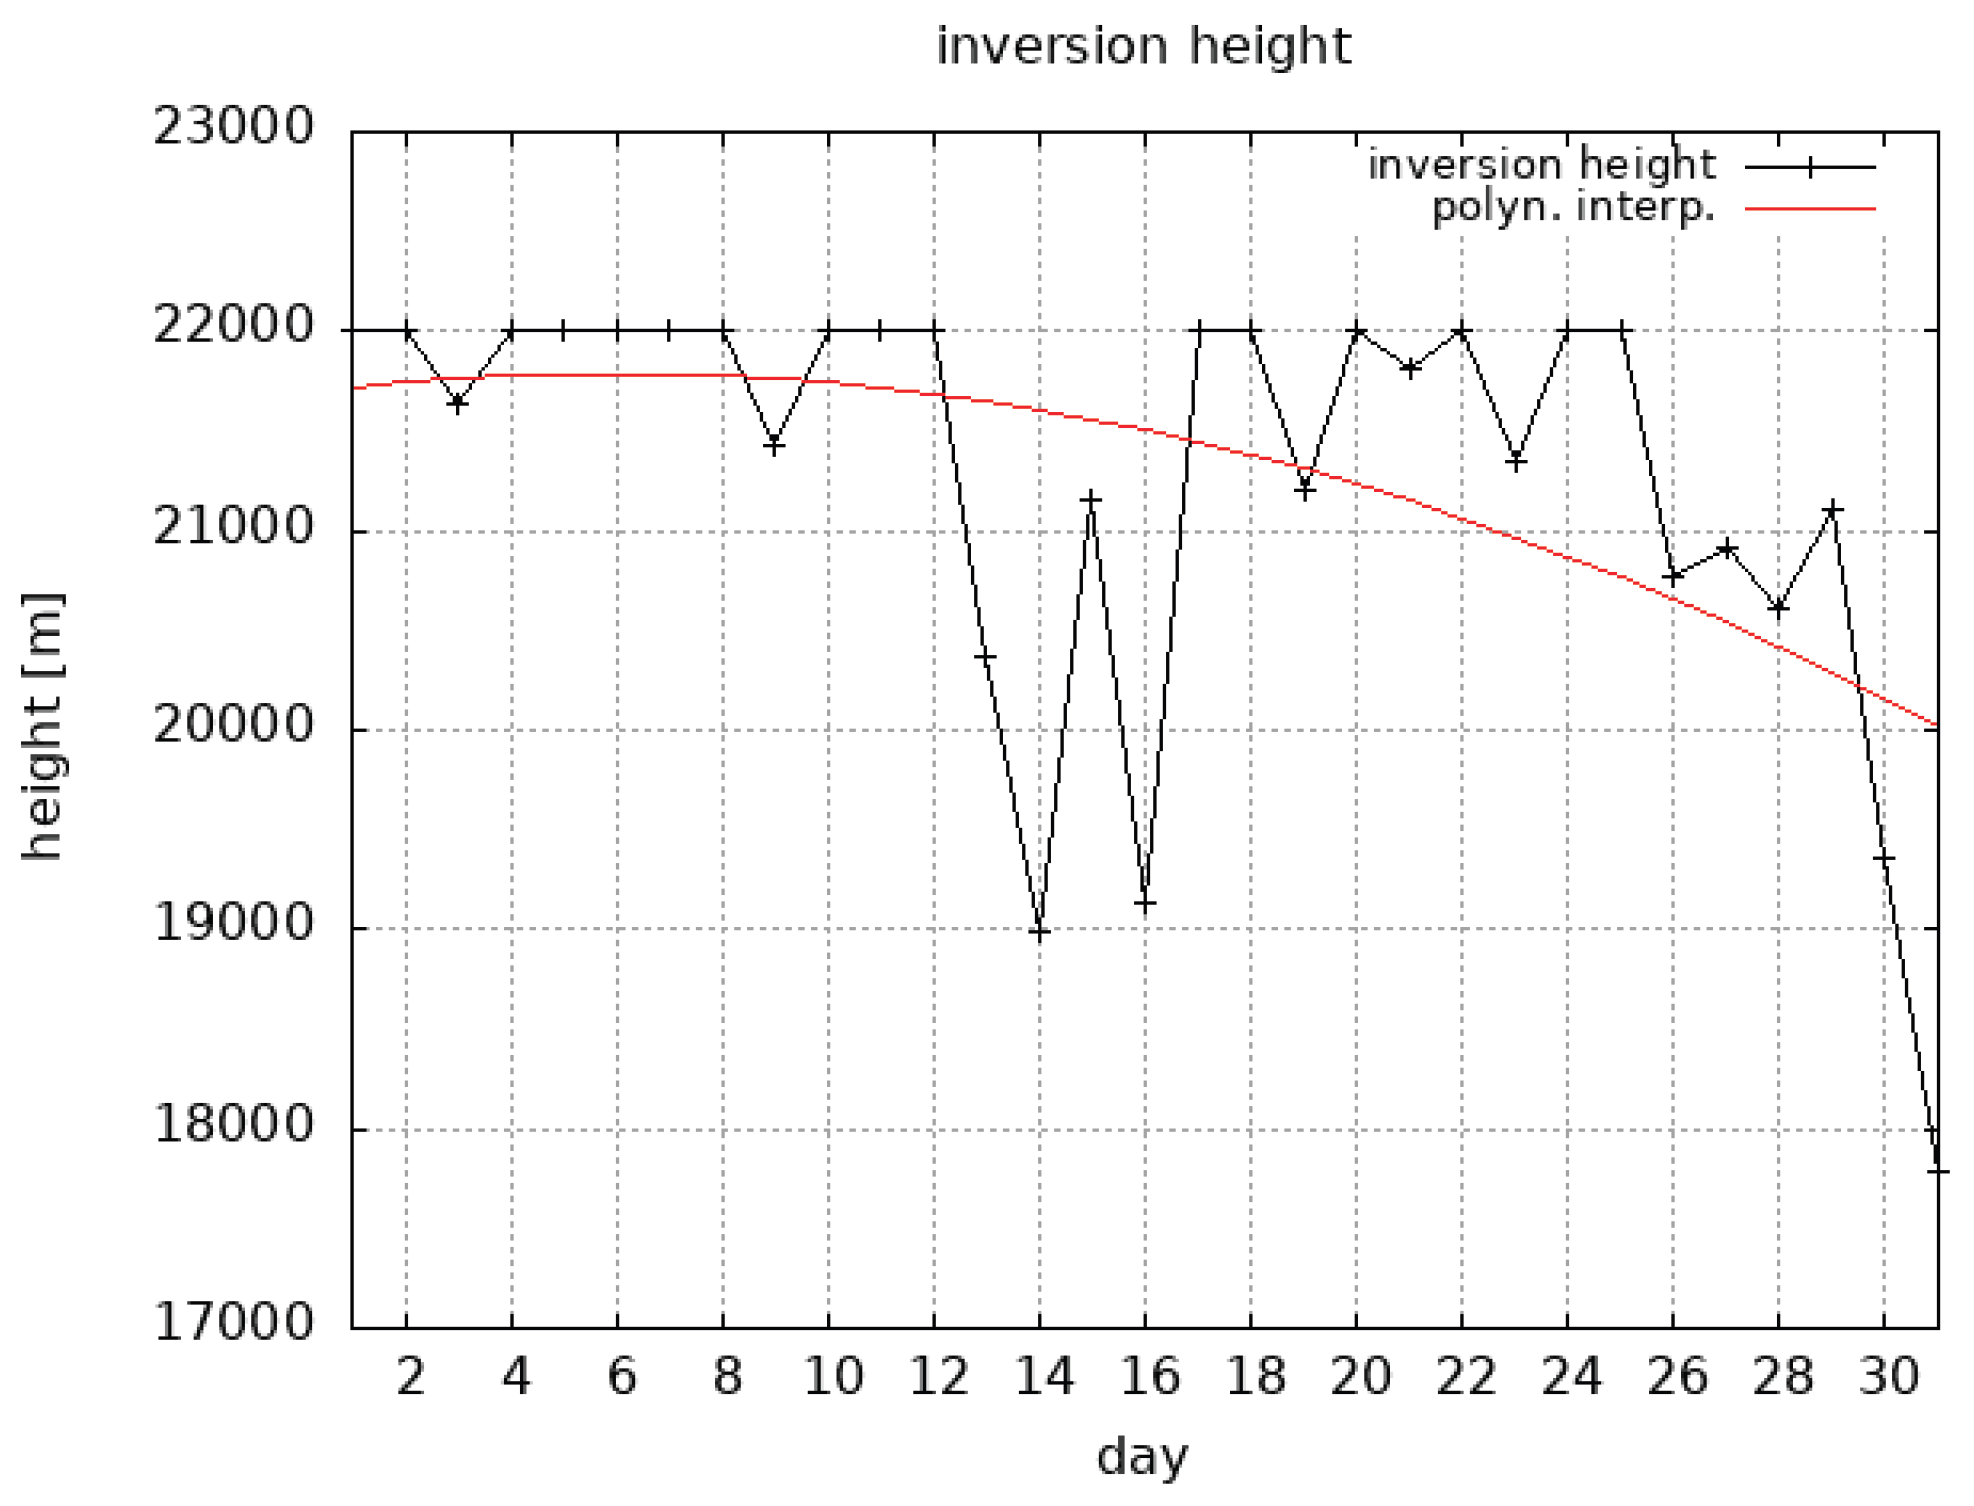
Figure 4.
Vertical profiles of zonal (a) and meridional (b) wind perturbations on May 01 (00 UTC) and May 30 (12 UTC).
Figure 4.
Vertical profiles of zonal (a) and meridional (b) wind perturbations on May 01 (00 UTC) and May 30 (12 UTC).
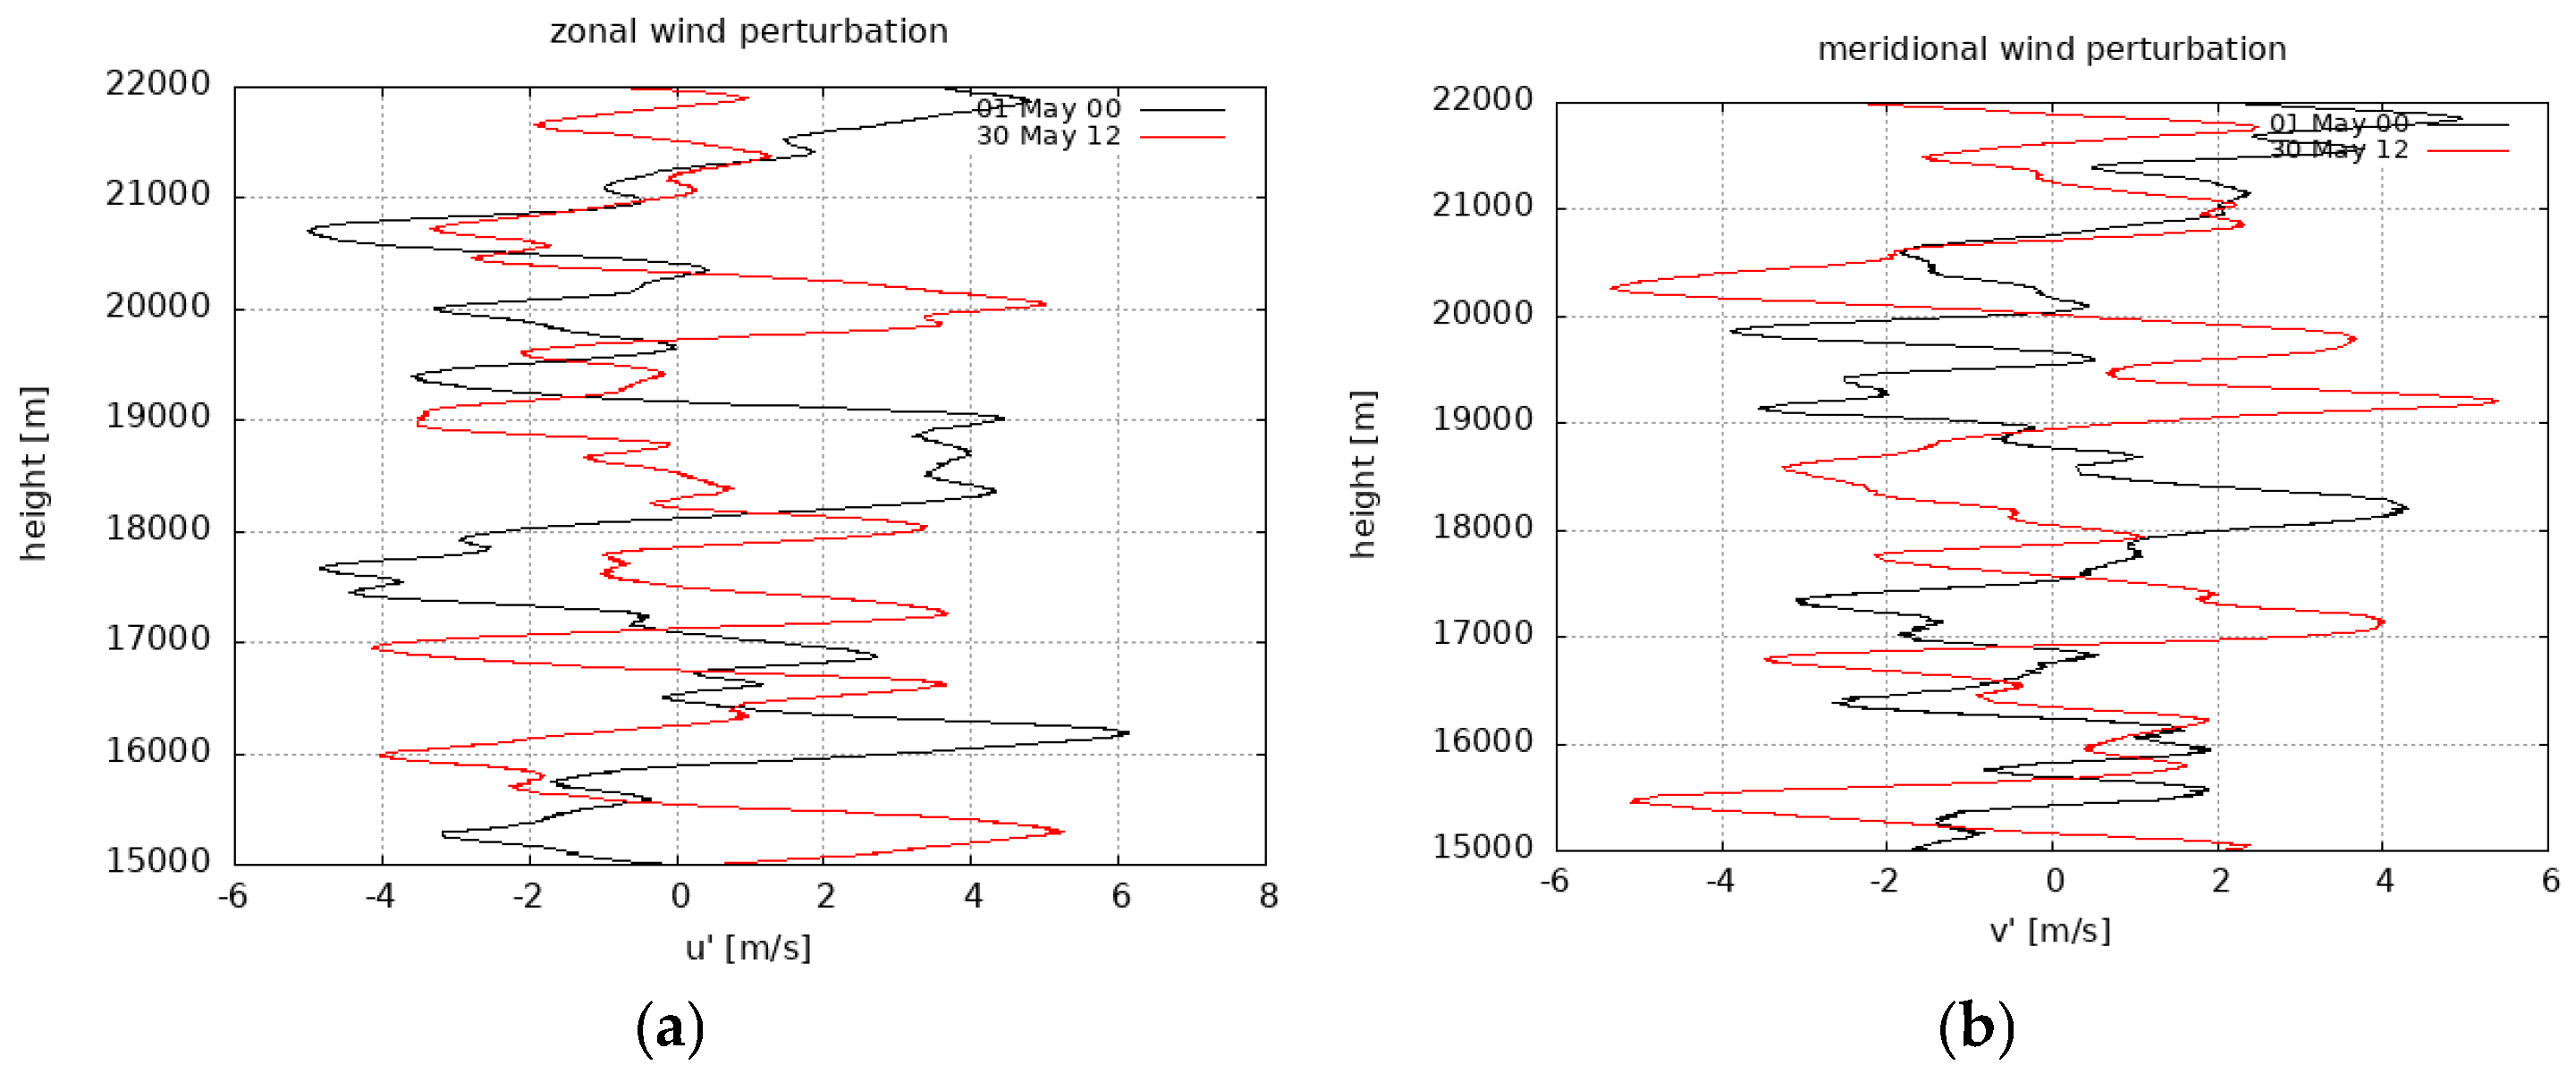
Figure 5.
Hodograph of the perturbation motions on May 01 (00 UTC) and May 30 (12 UTC).
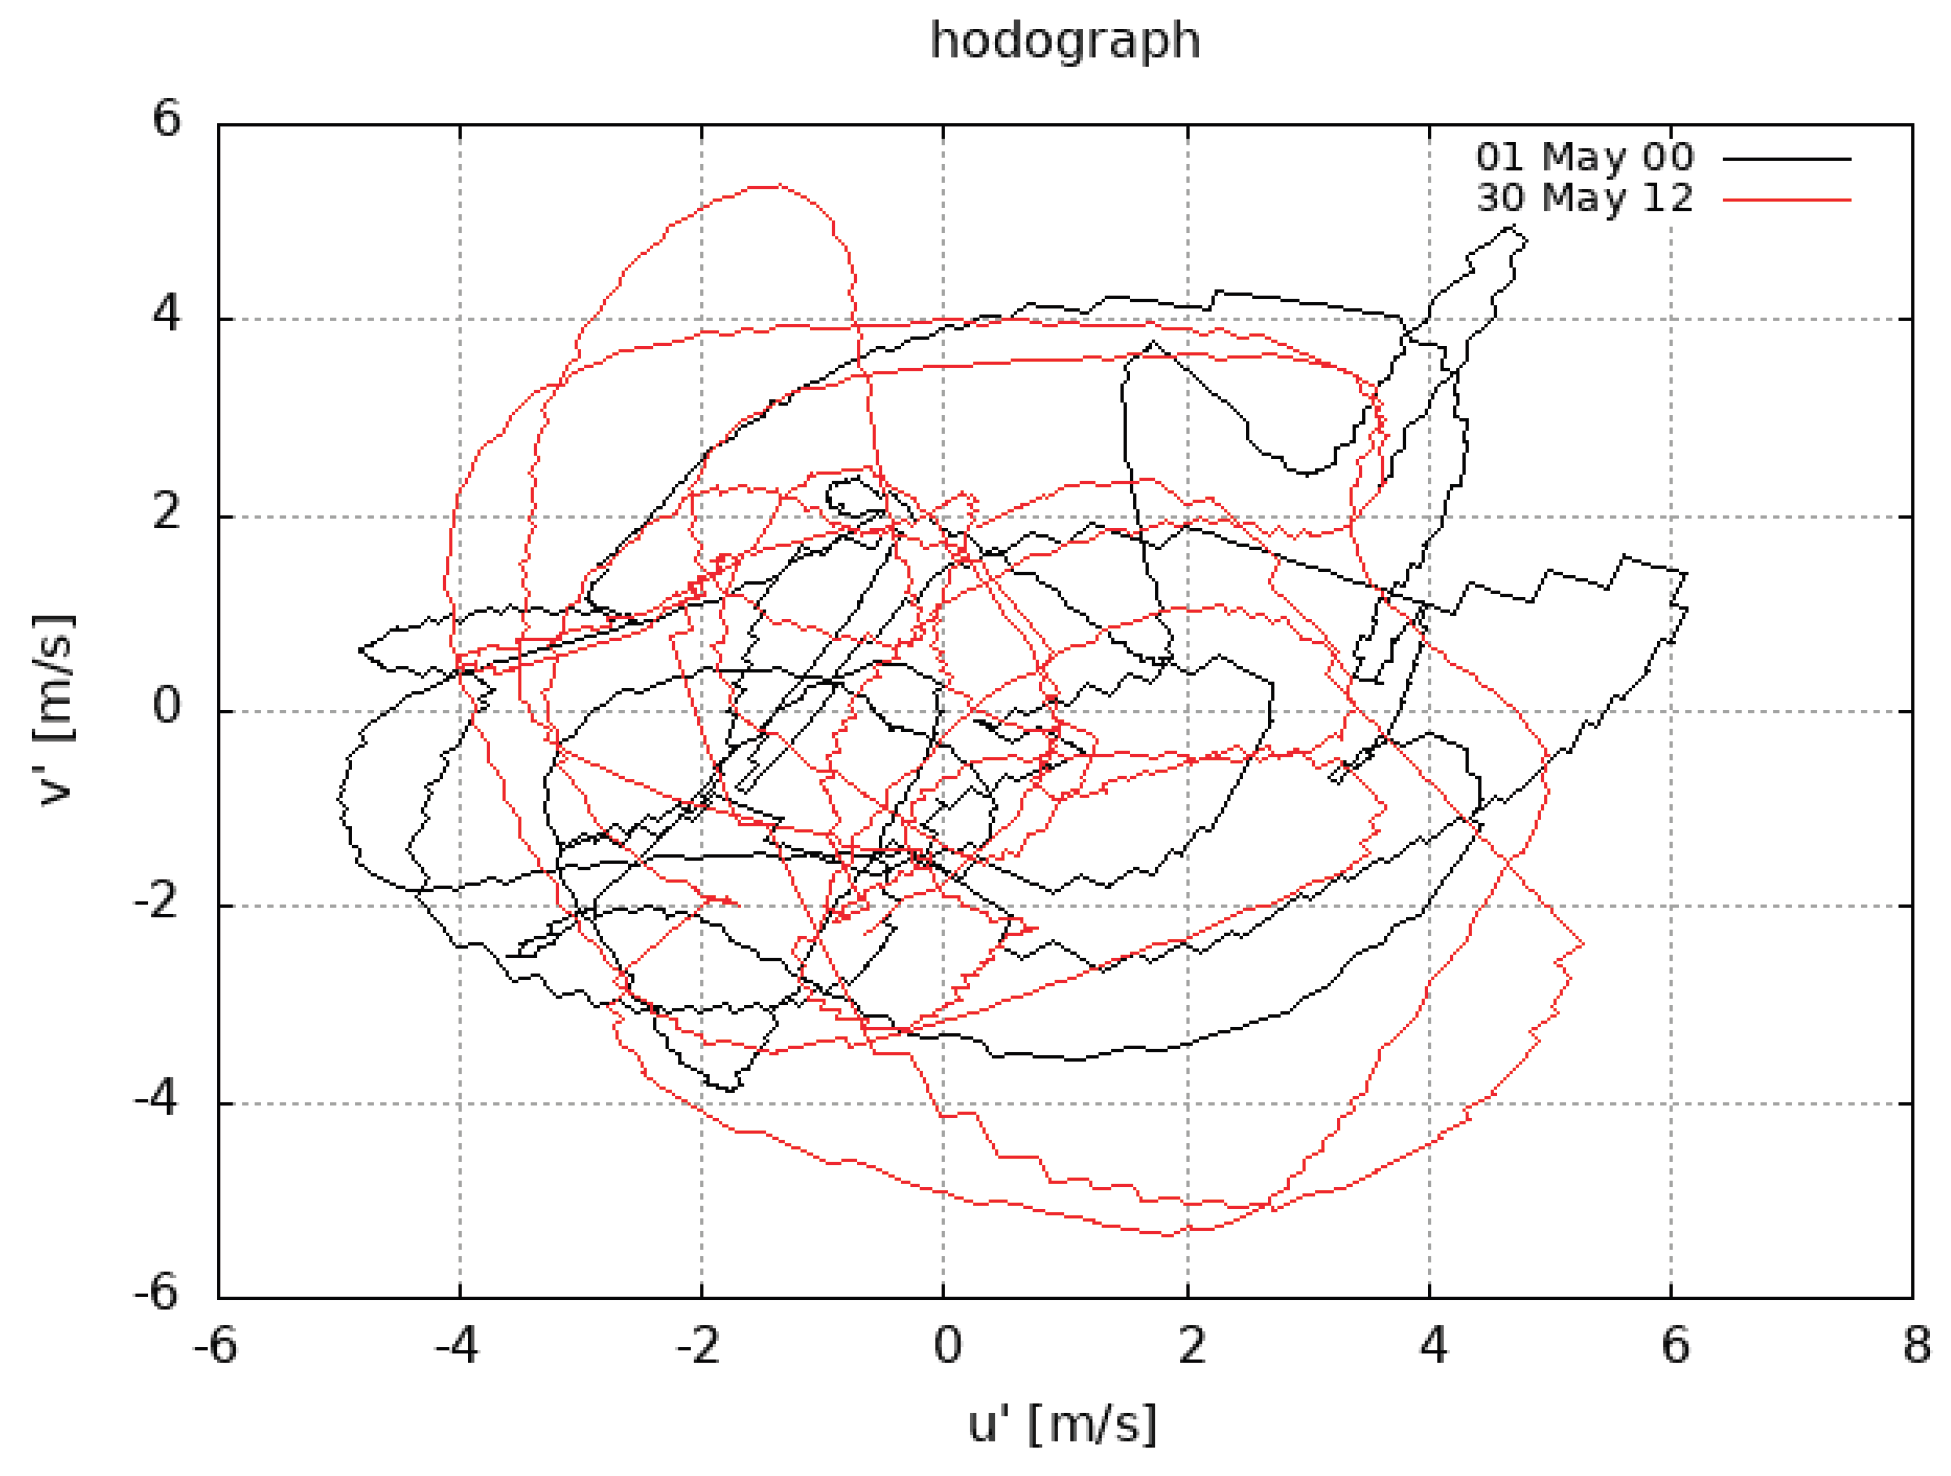
Figure 6.
Power spectra of zonal (a) and meridional (b) wind perturbations on May 01 (00 UTC) and May 30 (12 UTC).
Figure 6.
Power spectra of zonal (a) and meridional (b) wind perturbations on May 01 (00 UTC) and May 30 (12 UTC).
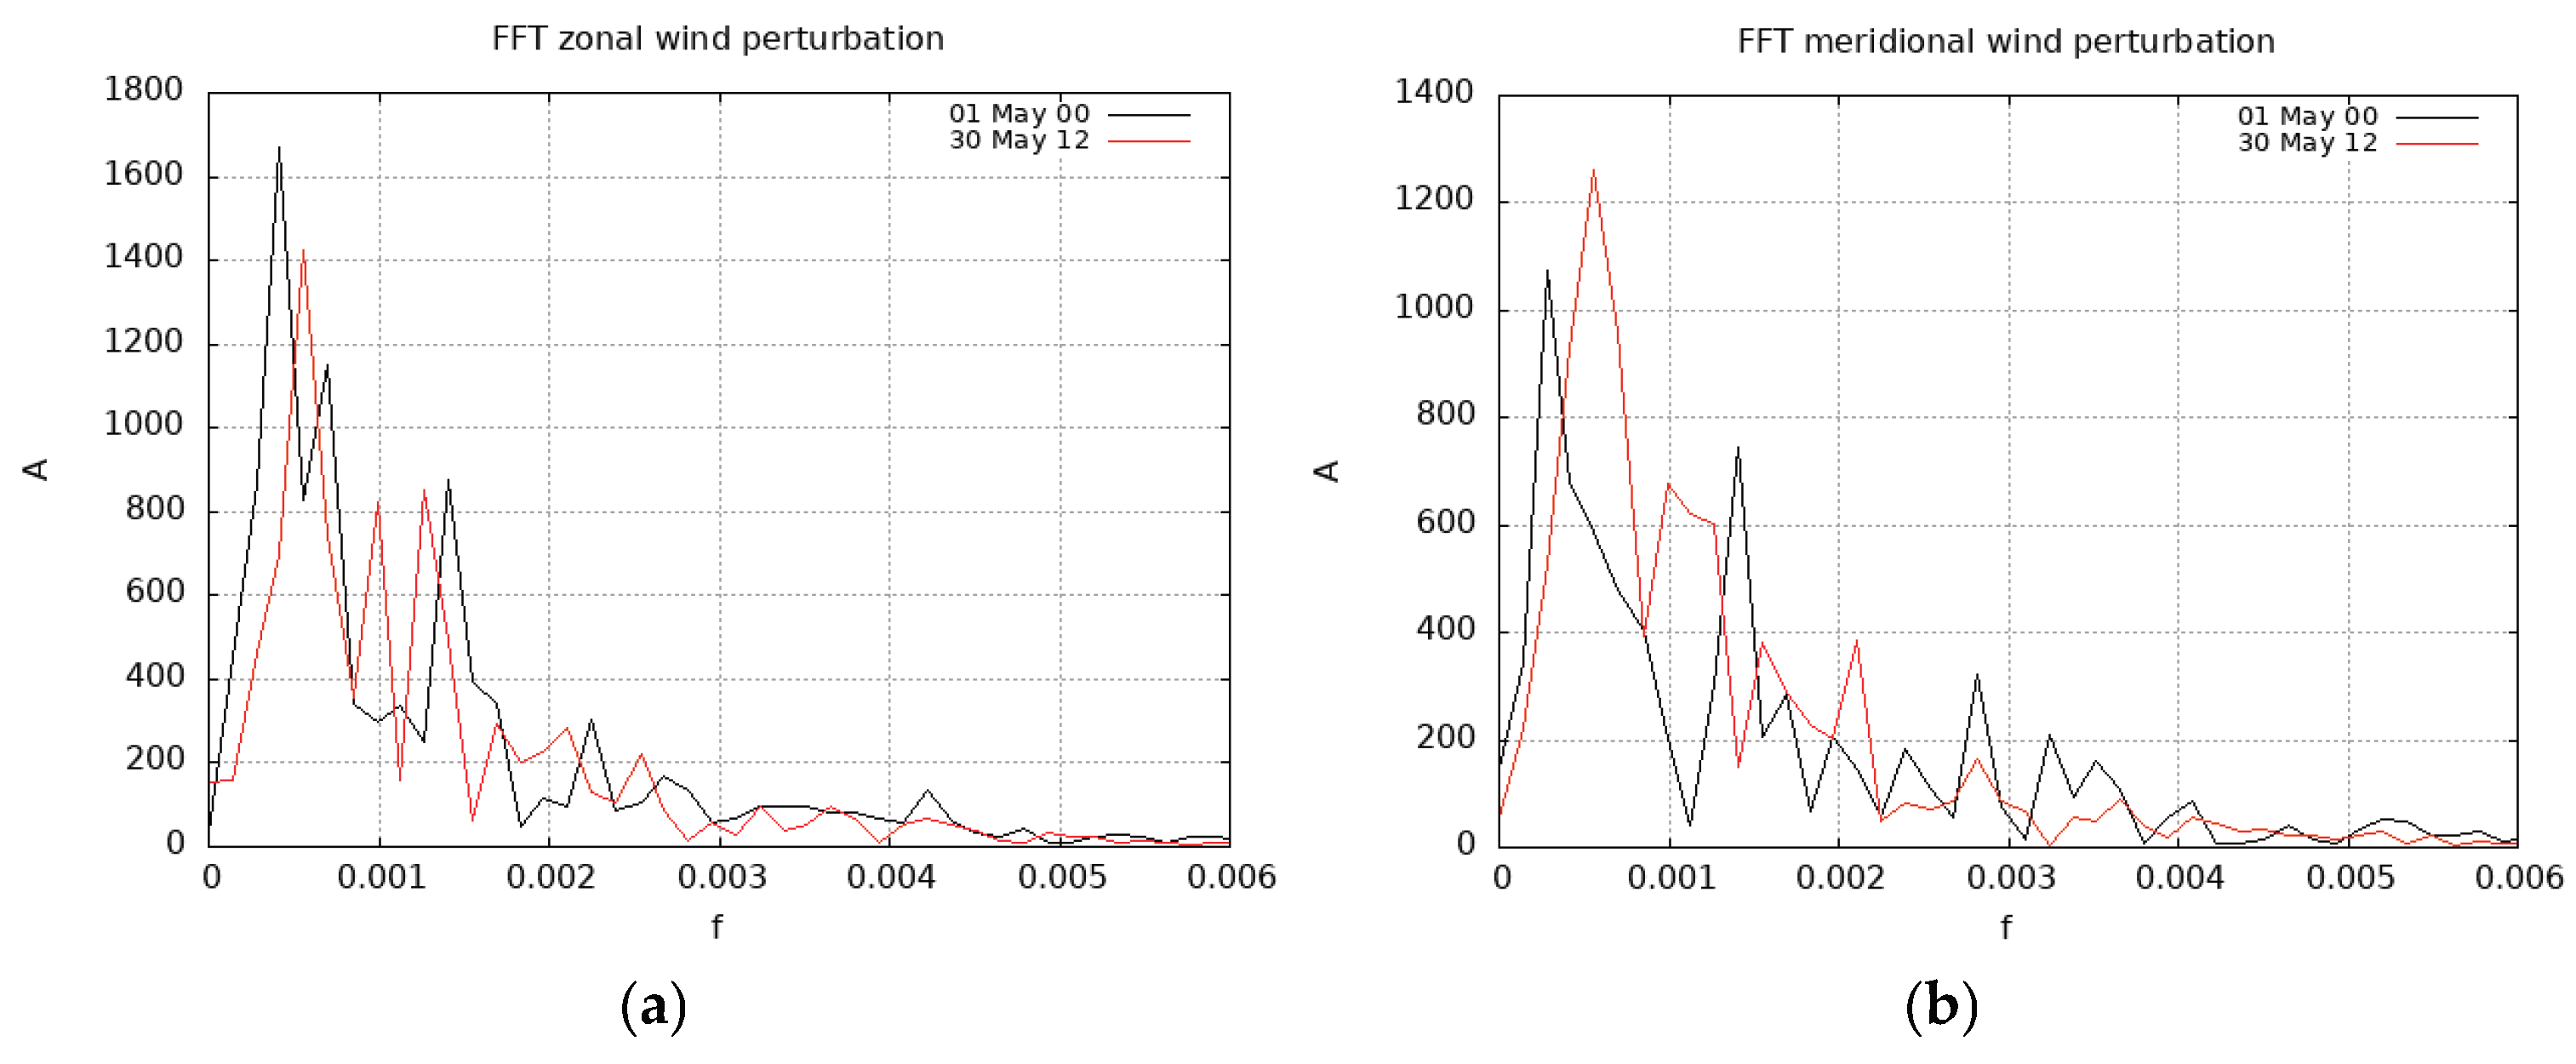
Figure 7.
Time series of EKE over May 2025 at 00, 12 and average daily values.
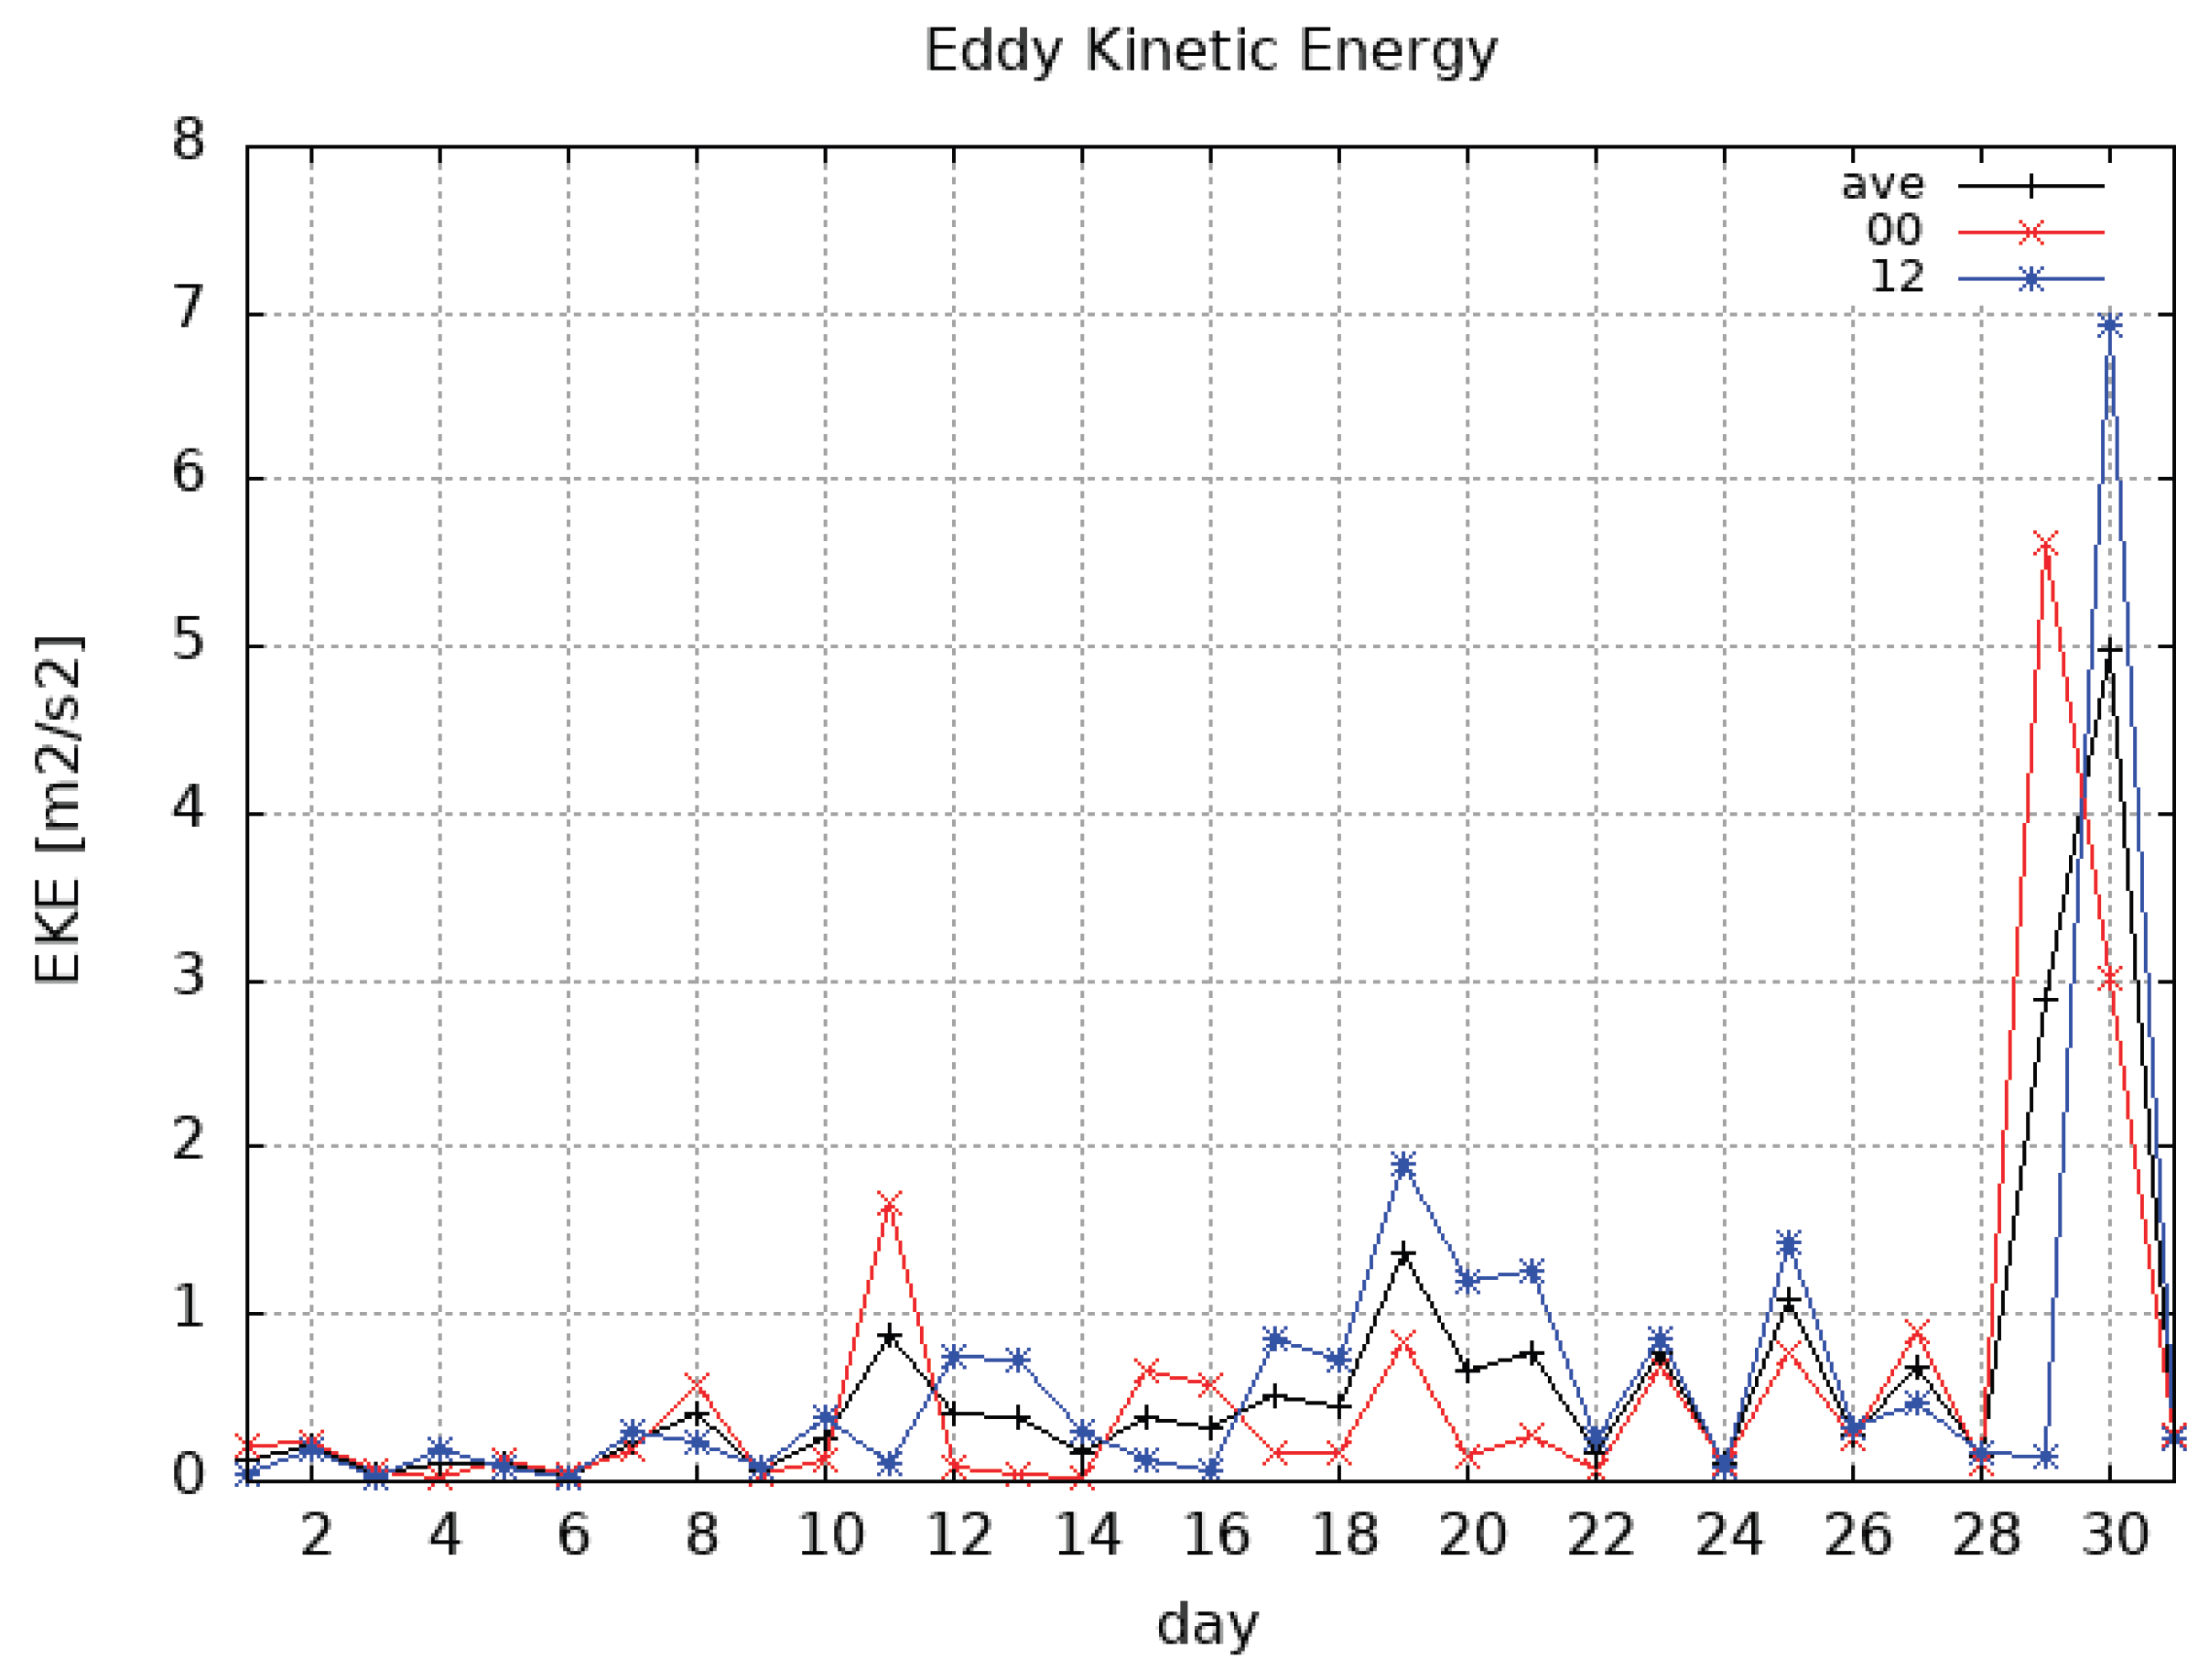
Figure 8.
Time series of Theta angle over May 2025 at 00, 12 and average daily values.
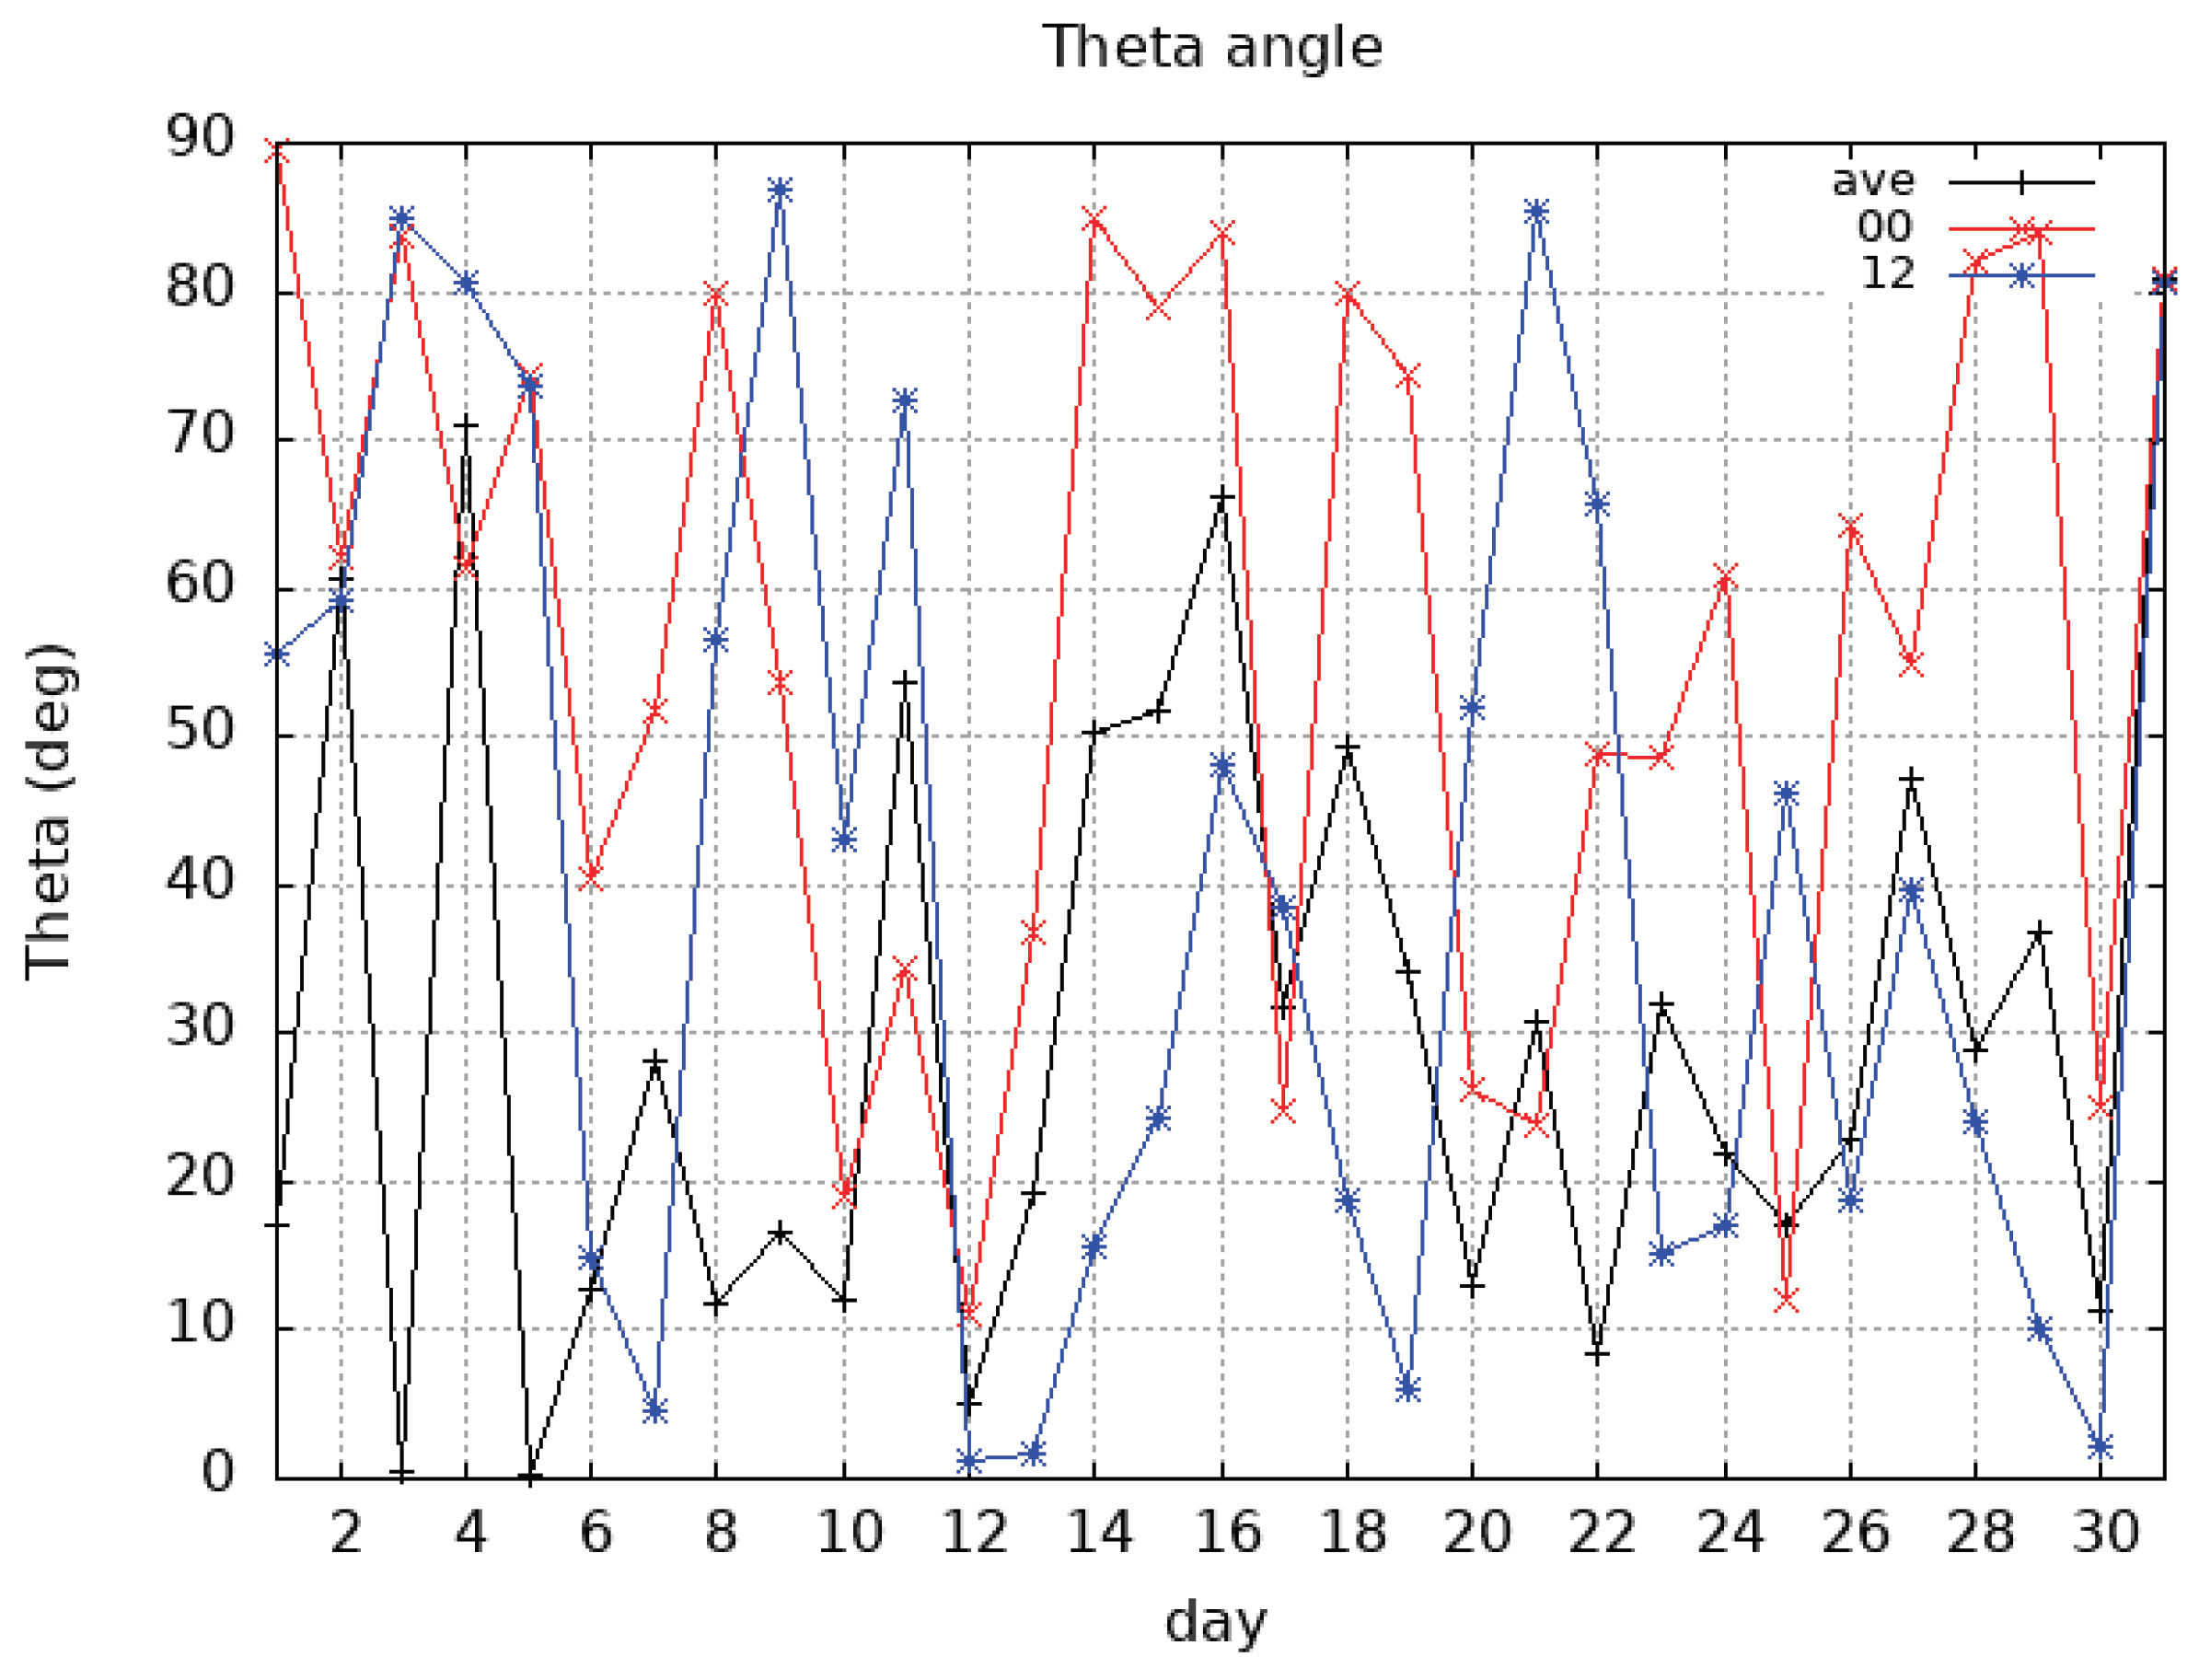

Table 1.
Maximum, minimum values and standard deviation of U (m/s) averaged over different decades.
| Period | U max | U min | U std |
|---|---|---|---|
| May 1-31 | 23.82 | -0.11 | 11.5 |
| May 1-10 | 31.23 | 1.24 | 8.9 |
| May 11-20 | 26.51 | -0.77 | 13.8 |
| May 21-31 | 14.56 | -0.79 | 6.9 |
Table 2.
Values of the main wavelengths (km) of zonal (U’) and meridional (V’) wind perturbations on May 01 h00 and May 30 h 12.
Table 2.
Values of the main wavelengths (km) of zonal (U’) and meridional (V’) wind perturbations on May 01 h00 and May 30 h 12.
| λ1 | λ2 | λ3 | |
| U’ May 01 h 00 | 2.38 | 1.43 | 0.70 |
| U’ May 30 h 12 | 1.78 | 1.01 | 0.78 |
| V’ May 01 h 00 | 3.57 | 0.71 | - |
| V’ May 30 h 12 | 1.78 | 1.01 | - |
Disclaimer/Publisher’s Note: The statements, opinions and data contained in all publications are solely those of the individual author(s) and contributor(s) and not of MDPI and/or the editor(s). MDPI and/or the editor(s) disclaim responsibility for any injury to people or property resulting from any ideas, methods, instructions or products referred to in the content. |
© 2026 by the authors. Licensee MDPI, Basel, Switzerland. This article is an open access article distributed under the terms and conditions of the Creative Commons Attribution (CC BY) license (http://creativecommons.org/licenses/by/4.0/).
Copyright: This open access article is published under a Creative Commons CC BY 4.0 license, which permit the free download, distribution, and reuse, provided that the author and preprint are cited in any reuse.