

Submitted:
10 October 2026
Posted:
12 October 2026
You are already at the latest version
Abstract
Celiac disease is a common immune-mediate inflammatory disease of the small intestine triggered by an environmental agent (gluten) in genetically predisposed individuals. It affects approximately 1% of the population and is characterized by diarrhea, malabsorption, and villous atrophy of the intestinal mucosa. In the context of dynamics systems, entropy is a measure of uncertainty. In computer vision, entropy is a statistical measure of randomness that can be used to characterize the texture and complexity of the input image. The hypothesis of this proof-of-concept study was that the loss of physiological structural balance could be measured by entropy. Entropy was measured in 16 patients with celiac disease (57 biopsies, 7294 image patches) and compared with 20 cases of small intestine control (54 biopsies/whole-tissue sections, 15810 image patches). The series was expanded with 18 cases of unspecific duodenal inflammation (5966 image patches) and 5 cases of duodenal adenocarcinoma (3723 image patches). Analysis was performed using 224×224×3 input non overlapping image patches and Matlab 2026a entropy function. In comparison with control, celiac disease was characterized by lower histological entropy (6.04 ± 0.39 vs. 6.59 ± 0.40, respectively, P < 0.001). In conclusion, the histological evaluation of entropy as a topological analysis is useful for the differential diagnosis between normal intestinal mucosa control and celiac disease. Loss of randomness characterized celiac disease.
Keywords:
celiac disease
; entropy
; computer vision
1. Introduction
The entropy concept originated from classical physics under the law of thermodynamics as a measure of the disorder of a system. The second law of thermodynamics states that the total entropy of a system either increases or remains constant in any spontaneous process [1,2,3,4,5,6,7].
In dynamical systems and information theory, entropy is a measure of information and uncertainty [4,6,7]. Information and uncertainty are related as more information is gained by removing uncertainty. In nonlinear dynamics, entropy is used to explain complex nonlinear behavior in real-world systems [6,7,8,9].
As described in the second law of thermodynamics, in a closed system, entropy tends to increase over time. In the context of biological systems, living organisms maintain internal order despite the tendency toward increased entropy [10,11]. This is achieved by continuous energy input and active export of entropy to their surroundings [7,9,12]. In the study of the pathology of cancer [13,14,15,16,17], entropy has been associated with cancer cell heterogeneity [6,7,8,9,12,13].
Bidimensional entropy functions are useful for applications such as image analysis [12,18,19]. This study analyzed the entropy of grayscale images. In this context, entropy is a statistical measure of randomness that can be used to characterize the texture of the input image [1,6,7,20,21,22,23,24]. This has practical applications. In the field of hematopathology, we have recently described that diffuse large B-cell lymphoma is characterized by lower entropy than reactive lymphoid tissue, and that high entropy is correlated by a poor prognosis of the patients [22].
Celiac disease is a common autoimmune disease that affects the small intestine and other organs. It is an immune disease triggered by an abnormal reaction to dietary gluten in predisposed individuals that leads to mucosal inflammation, villous atrophy, and crypt hyperplasia [25]. Clinically, is characterized by gastrointestinal symptoms such as chronic or recurrent diarrhea or constipation, malabsorption, and abdominal pain [26,27]. It is estimated that the global prevalence is around 1% [28], although it is less prevalent in Asian countries [29]. The diagnosis includes serologic testing (serum tissue transglutaminase (tTG)-immunoglobulin A (IgA) and endomysial (EMA)-IgA antibody tests) and upper endoscopy with small bowel biopsy. The histological features range from mild alterations with only increased intraepithelial lymphocytes to severe atrophy of the mucosa with complete loss of villi, enhanced epithelial apoptosis, and crypt hyperplasia [25,30,31,32,33,34].
The hypothesis of this proof-of-concept study was that the loss of balance of the immune system could be measured by entropy. Entropy was measured in 16 celiac disease patients and compared with 25 cases of small intestine control. The study found that the histological evaluation of entropy was useful for the differential diagnosis between normal intestinal mucosa control and celiac disease, and that loss of randomness characterized celiac disease.
2. Materials and Methods
2.1. Patients and Samples
The series of 41 cases included 16 patients with celiac disease and 20 cases of small intestine control. All cases were diagnosed with positive celiac serology and histological criteria. The cases were selected from the Department of Pathology, Hospital Clinic of Barcelona, Spain, as previously described [30,31,35]. The study was conducted following the guidelines of the Declaration of Helsinki of the World Medical Association. Lymphoid system research is under the Institutional Review Board of Tokai University, School of Medicine (protocol code: IRB20-156, date of approval: 1 April 2026).
To expand the differential diagnosis, the series was expanded with 18 cases of unspecific duodenal inflammation and 5 cases of duodenal adenocarcinoma.
Formalin-fixed, paraffin-embedded tissue samples were stained cut using a Yamato REM-7 microtome (Yamato Kohki Industrial Inc., Saitama, Japan) and stained with hematoxylin & eosin (H&E) using a Sakura Tissue-Tek Prisma Plus automated slide stainer connecting with the Tissue-Tek Glas g2 automated glass coverslipper (Sakura Finetek Japan Co., Ltd., Tokyo, Japan).
H&E staining was first visualized on an Olympus BX51 microscope (Olympus K.K., Hachioji, Tokyo, Japan) and later digitalized using a NanoZoomer S360 digital slide scanner (#C13220-01, Hamamatsu Photonics K.K., Hamamatsu, Japan). The digitalized images were visualized using NDP.view2 image viewing software (#U12388-01, Hamamatsu Photonics K.K., Hamamatsu, Japan) and exported into jpeg files.
The jpeg files were visualized using PhotoScape v3.7 (website: www.photoscape.org, last accessed on October 1, 2026) and split into 224×224×3 pixel resolution image patches. All image patches were manually revised to exclude image patches with less than 60% of tissue, broken tissue, and other artifacts that may create bias. The image patches were not overlapping, and patches of not 224×224 pixels were automatically excluded from the dataset. Appendix data describes the clinicopathological characteristics of the cases. Figure 1, Figure 2, Figure 3, Figure 4 and Figure 5 show characteristic image patches.
2.2. Assessment of Entropy in Histological Images
Entropy was measured in 16 patients with celiac disease (57 biopsies, 7294 image patches) and compared with 20 cases of small intestine control (54 biopsies/whole-tissue sections, 15810 image patches). To expand the differential diagnosis, the series was expanded with 18 cases of unspecific duodenal inflammation and 5 cases of duodenal adenocarcinoma. Analysis was performed using 224×224×3 input non overlapping image patches and Matlab 2026a entropy function.
The syntax is e = entropy (I) that returns the entropy of grayscale image I. Entropy is a statistical measure of randomness that can be used to characterize the texture of the input image [21,22]. Entropy is defined as -sum(p.*log2(p)), where p contains the normalized histogram counts returned from imhist [21,22].
The code to compute entropy on a group of images stored in a folder was as follows:
clc
clear
tic
imageLoc = "FolderName";
ds = imageDatastore(imageLoc);
for i = 1:length(ds.Files)
I = readimage(ds, i);
A = rgb2gray(I);
J(i) = entropy(A);
end
% Display the entropy values for each image
disp(J);
elapsedtime = toc
elapsettimehour = elapsedtime/3600
entropyT2 = table(ds.Files)
writetable(entropyT2,['entropytable_2.xlsx']);
J = J';
entropyT = table(J);
writetable(entropyT,'entropytable.xlsx');
filename = 'EntropyWorkspace'
save(filename)
Code run on MATLAB R2026a Update 5 (26.1.0.3346909) Aug 3 2026 (The Mathworks, Inc., Tokyo, Japan). The desktop was equipped with a 12-Core AMD Ryzen 9 5900X, 4941 MHz (49.5 x100) Veermer CPU, 49076 MB of physical memory, Gigabyte RTX 4080 Super WindForce V2 (GV-N408SWF3V2-16GD) graphics card (GPU), and Windows 10 IoT Enterprise LTSC (21H2, version 19044.7725).
Raw data can be downloaded at Supplementary data (Excel S1).
Statistical analysis was performed using non parametric tests (IBM SPSS Statistics version 27, release 27.0.1.0 64-bit edition; 1 Orchard Road, Armonk, New York, USA).
3. Results
3.1. Entropy Evaluation in Celiac Disease
3.3. Differential Diagnosis of Celiac Disease and Other Entities Using Entropy
The series was expanded with 18 cases of unspecific duodenal inflammation and 5 cases of duodenal adenocarcinoma. The descriptives are shown in Table 2 and Table 3, and Figure 7 and Figure 8. In comparison with duodenal inflammation and small intestine control, celiac disease was characterized by lower histological entropy (both P < 0.001).
4. Discussion
Celiac disease can be defined as a condition in which an abnormal small intestinal mucosa improves morphologically after a period of gluten-free diet and relapses after gluten is reintroduced into the diet [36].
It is a common autoimmune condition affecting approximately 1% of the population after exposure to gluten at any age. It is a malabsorption disorder characterized by mucosal inflammation, villous atrophy, and crypt hyperplasia [37].
The guidelines recommend serologic screening in patients with gastroinstestinal symptoms or extraintestinal signs/symptoms suggestive of celiac disease [36,37]. The diagnosis includes serum antibody essays, including anti-endomysial antibody, anti-tissue transglutaminase antibodies, anti-gliadin antibody assays, and endoscopy with small bowel biopsy. Endoscopic features include atrophic appearing of mucosa with loss of folds, presence of fissures, nodularity, and increased vascularity [26]. Histological characteristics range from mild alteration characterized only by increased intraepithelial lymphocytes to severe atrophic mucosa with loss of villi, enhanced apoptosis, and crypt hyperplasia [37,38]. HLA testing is useful in selected patients as haplotypes HLA-DQ2 and DQ8 are almost present in almost all patients with celiac disease [39].
The main treatment of celiac disease is a gluten-free diet. In non responders or refractory disease, other approaches, are used, such as glucocorticoids, and immunosuppressants, such as alemtuzumab, cladribine, and tofacitinib, are used in patients with immune disorders [26,36,37].
Proper treatment of celiac disease requires a correct diagnosis and differential diagnosis from other intestinal diseases. This study used the entropy function to differentiate between celiac disease and normal mucosa control. The use of the entropy function was successful.
Computer vision includes algorithms, applications, and artificial intelligence models for designing, simulating, calibrating, and deploying systems. Computer vision involves applications that are useful for visual inspection, object detection and tracking, feature detection, extraction, and matching [21]. Texture analysis refers to the characterization of regions in an image by their texture content by quantifying qualities such as roughness, smoothness by focusing on the spatial variants in pixel intensities [21]. This study analyzed the texture of the input images by measuring the randomness of the hematoxylin and eosin images after being transformed into a grayscale image. Entropy represents an alternative method for analyzing the bidimensional topology of tissue. Since celiac disease is histologically different from control, it is logical that entropy also differs. Entropy can be interpreted as a method of randomness quantification that characterizes tissue complexity: in comparison to control tissue, celiac disease is characterized by atrophic mucosa with loss of villi, enhanced apoptosis, and crypt hyperplasia. This pattern is recognized by the entropy function. From a systems biology perspective, a healthy immune system environment needs a heterogeneous distribution of immune cells. Lack of this balance leads to disease.
5. Limitations of the Study
This study included a relatively small number of cases. Entropy was measured in 16 patients with celiac disease (57 biopsies, 7294 image patches) and compared with 20 cases of small intestine control (54 biopsies/whole-tissue sections, 15810 image patches). The series was expanded with 18 cases of unspecific duodenal inflammation (5966 image patches) and 5 cases of duodenal adenocarcinoma (3723 image patches). Larger series of cases will be needed to confirm these findings.
6. Conclusions
In conclusion, the histological evaluation of entropy as a topological analysis is useful for the differential diagnosis between normal intestinal mucosa control and celiac disease. Loss of randomness characterized celiac disease.
Supplementary Materials
The following supporting information can be downloaded at the website of this paper posted on Preprints.org, Excel S1: raw data.
Author Contributions
Conceptualization, J.C.; methodology, J.C.; formal analysis, J.C.; writing—original draft preparation, J.C.; writing—review and editing, J.C.; visualization, X.X.; funding acquisition, J.C. All authors have read and agreed to the published version of the manuscript.
Funding
This research was funded by Ministry of Education, Culture, Sports, Science and Technology (MEXT) and the Japan Society for the Promotion of Science (JSPS) through KAKEN grant numbers 15K19061, 18K15100, 23K06454 and 25K10272 awarded to J.C.
Institutional Review Board Statement
The study was conducted following the Declaration of Helsinki and approved by the Institutional Review Board of Tokai University, School of Medicine (protocol code: IRB20-156, date of approval: 1 April 2026).
Informed Consent Statement
Informed consent was obtained from all subjects involved in the study.
Data Availability Statement
All data are available upon request to Joaquim Carreras (joaquim.carreras@tokai.ac.jp) and are also shown in the Supplementary File.
Acknowledgments
I want to thank Josep A. Bombi from the Department of Pathology, Hospital Clinic of Barcelona (Spain) for the celiac disease cases.
Conflicts of Interest
The authors declare no conflicts of interest.
Appendix A
Appendix A.1

Table A1.
Clinicopathological characteristics of the series.
| Age | Sex | Location | Diagnosis | Marsh |
|---|---|---|---|---|
| 70 | Male | Duodenum | Celiac disease | 3a |
| 62 | Male | Pylorus/duodenum | Celiac disease/Chronic gastritis | 2 |
| 62 | Male | Duodenum | Celiac disease | 2 |
| 78 | Female | Duodenum | Celiac disease | 3b |
| 59 | Male | Duodenum | Celiac disease | 3a |
| 44 | Female | Duodenum | Celiac disease | 2 |
| 17 | Female | Duodenum | Celiac disease | 3b |
| 56 | Female | Duodenum | Celiac disease | 3a |
| 54 | Female | Duodenum | Celiac disease | 2 |
| 58 | Female | Duodenum | Celiac disease | 3b |
| 61 | Female | Duodenum | Celiac disease | 3c |
| 45 | Male | Duodenum | Celiac disease | 3a |
| 70 | Female | Duodenum | Celiac disease | 2 |
| 40 | Female | Duodenum | Celiac disease | 3a |
| 61 | Female | Duodenum | Celiac disease | 3c |
| 44 | Female | Duodenum | Celiac disease | 3a |
Table A2.
Clinicopathological characteristics of the series of duodenal inflammation.
| Age | Sex | Location | Diagnosis |
|---|---|---|---|
| 75 | Male | Duodenum | Chronic inflammation |
| 52 | Male | Duodenum | Inflammation |
| 47 | Female | Duodenum | Chronic inflammation, mild |
| 18 | Female | Duodenum | Chronic inflammation |
| 57 | Male | Duodenum | Erosive inflammation |
| 42 | Female | Duodenum | Active inflammation |
| 81 | Male | Duodenum | Chronic inflammation, moderate |
| 70 | Female | Duodenum | Chronic active inflammation |
| 61 | Male | Duodenum | Chronic inflammation |
| 53 | Female | Duodenum | Chronic inflammation |
| 70 | Male | Duodenum | Chronic inflammation, mild |
| 68 | Male | Duodenum | Chronic inflammation, mild |
| 77 | Male | Duodenum | Chronic inflammation |
| 78 | Male | Duodenum | Chronic inflammation |
| 87 | Male | Duodenum | Inflammation, mild |
| 54 | Male | Duodenum | Chronic inflammation |
| 52 | Female | Duodenum | Chronic inflammation |
| 63 | Male | Duodenum | Chronic inflammation |
Table A2.
Clinicopathological characteristics of the series of duodenal adenocarcinoma.
| Age | Sex | Location | Diagnosis |
|---|---|---|---|
| 71 | Female | Duodenum | Adenocarcinoma |
| 77 | Male | Duodenum | Adenocarcinoma |
| 82 | Female | Duodenum | Adenocarcinoma |
| 74 | Male | Duodenum | Adenocarcinoma |
| 56 | Male | Duodenum | Adenocarcinoma |
Table A2.
Clinicopathological characteristics of the series of small intestine control.
| Age | Sex | Location | Diagnosis |
|---|---|---|---|
| 73 | Female | Small intestine | Control |
| 63 | Female | Small intestine | Control |
| 49 | Male | Small intestine | Control |
| 53 | Female | Small intestine | Control |
| 63 | Male | Small intestine | Control |
| 64 | Male | Small intestine | Control |
| 72 | Male | Small intestine | Control |
| 63 | Male | Small intestine | Control |
| 68 | Female | Small intestine | Control |
| 63 | Male | Small intestine | Control |
| 64 | Male | Small intestine | Control |
| 59 | Male | Jejunum | Control |
| 76 | Male | Duodenum | Control |
| 77 | Male | Duodenum | Control |
| 70 | Female | Duodenum | Control |
| 70 | Male | Duodenum | Control |
| 78 | Male | Duodenum | Control |
| 75 | Female | Duodenum | Control |
| 76 | Male | Duodenum | Control |
| 55 | Female | Duodenum | Control |
N/A, not applicable.
References
- Balaban, M.O.; Gumus, B.; Gumus, E. Comparison of three image-analysis-based visual texture calculation methods: energy, entropy, and texture change index. J Sci Food Agric 2022, 102, 5984-5994. [CrossRef]
- Kleidon, A. The second law of thermodynamics, life and Earth’s planetary machinery revisited. Phys Life Rev 2024, 51, 382-389. [CrossRef]
- Koczan, G.M.; Zivieri, R. Revisions of the Phenomenological and Statistical Statements of the Second Law of Thermodynamics. Entropy (Basel) 2024, 26. [CrossRef]
- Struchtrup, H. Entropy and the Second Law of Thermodynamics-The Nonequilibrium Perspective. Entropy (Basel) 2020, 22. [CrossRef]
- Tajima, H. Second law of information thermodynamics with entanglement transfer. Phys Rev E Stat Nonlin Soft Matter Phys 2013, 88, 042143. [CrossRef]
- Tsui, P.H. Information Entropy and Its Applications. Adv Exp Med Biol 2023, 1403, 153-167. [CrossRef]
- Yin, X.; Ng, B.W.; He, J.; Zhang, Y.; Abbott, D. Accurate image analysis of the retina using hessian matrix and binarisation of thresholded entropy with application of texture mapping. PLoS One 2014, 9, e95943. [CrossRef]
- Tsalatsanis, A.; Hozo, I.; Djulbegovic, B. Research synthesis of information theory measures of uncertainty: Meta-analysis of entropy and mutual information of diagnostic tests. J Eval Clin Pract 2021, 27, 246-255. [CrossRef]
- Xu, K.; Yin, Q. Goal Identification Control Using an Information Entropy-Based Goal Uncertainty Metric. Entropy (Basel) 2019, 21. [CrossRef]
- Olde Scheper, T.V. Criticality Analysis: Bio-Inspired Nonlinear Data Representation. Entropy (Basel) 2023, 25. [CrossRef]
- Stolnicu, A.; Ikonomi, N.; Eckhardt-Bellmann, P.; Kraus, J.M.; Kestler, H.A. Robust signalling entropy estimation for biological process characterisation. Brief Bioinform 2025, 26. [CrossRef]
- Zakharov, V.M.; Trofimov, I.E. Developmental noise, entropy, and biological system condition. Biosystems 2024, 244, 105310. [CrossRef]
- Teschendorff, A.E. On epigenetic stochasticity, entropy and cancer risk. Philos Trans R Soc Lond B Biol Sci 2024, 379, 20230054. [CrossRef]
- Nijman, S.M.B. Perturbation-Driven Entropy as a Source of Cancer Cell Heterogeneity. Trends Cancer 2020, 6, 454-461. [CrossRef]
- Estrada-Estrada, E.; Ramirez-Arellano, A.; Ortiz-Vilchis, P. Histopathological cancer images classification with Deng entropy. Biomed Phys Eng Express 2025, 11. [CrossRef]
- Feng, L.; Sun, Y.D.; Li, C.; Li, Y.X.; Chen, L.N.; Zeng, R. Pan-cancer network disorders revealed by overall and local signaling entropy. J Mol Cell Biol 2021, 13, 622-635. [CrossRef]
- Monyak, D.L.; Holloway, S.T.; Gumbert, G.J.; Grimm, L.J.; Hwang, E.S.; Marks, J.R.; Shibata, D.; Ryser, M.D. Mapping the temporal landscape of breast cancer using epigenetic entropy. Commun Biol 2025, 8, 1477. [CrossRef]
- Ayunts, H.; Grigoryan, A.; Agaian, S. Novel Entropy for Enhanced Thermal Imaging and Uncertainty Quantification. Entropy (Basel) 2024, 26. [CrossRef]
- EntropyHub. An open-source toolkit for entropic data analysis. Copyright 2025, Matthew W. Flood. Website: https://www.entropyhub.xyz/ (Last accessed on October 1, 2026).
- Gonzalez, R. C., R. E. Woods, and S. L. Eddins. Digital Image Processing Using MATLAB. New Jersey, Prentice Hall, 2003, Chapter 11.
- MATLAB Help Center. Documentation. Entropy of grayscale image. https://www.mathworks.com/help/images/ref/entropy.html (Last accessed on October 1st, 2026).
- Carreras, J.; Kikuti, Y.Y.; Nagase, S.; Roncador, G.; Ikoma, H.; Ito, A.; Orita, M.; Tomita, S.; Tanigaki, Y.; Ueno, A.; et al. High Histological Entropy Is Correlated with Poor Overall Survival and Death Within the First 2 Years in Diffuse Large B-Cell Lymphoma. Cancers 2026, 18, 2279. [CrossRef]
- Du, B.; Ying, H.; Zhang, J.; Chen, Q. Multi-Space Feature Fusion and Entropy-Based Metrics for Underwater Image Quality Assessment. Entropy 2025, 27, 173. [CrossRef]
- Zaprzałka, J.; Topczewska, M. Unsupervised Approaches to Finding Outliers in Caption-Represented Images. Entropy 2025, 27, 661. [CrossRef]
- Schuppan, D.; Rostami, K. Further Progress to Quantify Histological Damage in Patients With Celiac Disease. Clin Gastroenterol Hepatol 2024, 22, 1188-1189. [CrossRef]
- Al-Toma, A.; Zingone, F.; Branchi, F.; Schiepatti, A.; Malamut, G.; Canova, C.; Rosato, I.; Ocagli, H.; Trott, N.; Elli, L.; et al. European Society for the Study of Coeliac Disease 2025 Updated Guidelines on the Diagnosis and Management of Coeliac Disease in Adults. Part 1: Diagnostic Approach. United European Gastroenterol J 2025, 13, 1855-1886. [CrossRef]
- Shiha, M.G.; Chetcuti Zammit, S.; Elli, L.; Sanders, D.S.; Sidhu, R. Updates in the diagnosis and management of coeliac disease. Best Pract Res Clin Gastroenterol 2023, 64-65, 101843. [CrossRef]
- Singh, P.; Arora, A.; Strand, T.A.; Leffler, D.A.; Catassi, C.; Green, P.H.; Kelly, C.P.; Ahuja, V.; Makharia, G.K. Global Prevalence of Celiac Disease: Systematic Review and Meta-analysis. Clin Gastroenterol Hepatol 2018, 16, 823-836 e822. [CrossRef]
- Makharia, G.K.; Catassi, C. Celiac Disease in Asia. Gastroenterol Clin North Am 2019, 48, 101-113. [CrossRef]
- Carreras, J.; Roncador, G.; Hamoudi, R.; Bombi, J.A.; Masugi, Y. Intraepithelial Lymphocytes and LAIR1 Expression in Celiac Disease. Biomedicines 2025, 13. [CrossRef]
- Carreras, J. Artificial Intelligence Analysis of Celiac Disease Using an Autoimmune Discovery Transcriptomic Panel Highlighted Pathogenic Genes including BTLA. Healthcare (Basel) 2022, 10. [CrossRef]
- Liu, H.; Brais, R.; Lavergne-Slove, A.; Jeng, Q.; Payne, K.; Ye, H.; Liu, Z.; Carreras, J.; Huang, Y.; Bacon, C.M.; et al. Continual monitoring of intraepithelial lymphocyte immunophenotype and clonality is more important than snapshot analysis in the surveillance of refractory coeliac disease. Gut 2010, 59, 452-460. [CrossRef]
- Oberhuber, G. Histopathology of celiac disease. Biomed Pharmacother 2000, 54, 368-372. [CrossRef]
- Charlesworth, R.P.G.; Agnew, L.L.; Scott, D.R.; Andronicos, N.M. Celiac disease gene expression data can be used to classify biopsies along the Marsh score severity scale. J Gastroenterol Hepatol 2019, 34, 169-177. [CrossRef]
- Carreras, J. Celiac Disease Deep Learning Image Classification Using Convolutional Neural Networks. J Imaging 2024, 10. [CrossRef]
- Ciclitira PJ, Lamont JT, Hussain Z. Management of celiac disease in adults. In UpToDate (website: www.uptodate.com; last accessed on October 3, 2026). UpToDate, Inc. Wolters Kluwer.
- Murray, J.A.; Husby, S. Celiac Disease. N Engl J Med 2026, 394, 1421-1429. [CrossRef]
- Werkstetter, K.J.; Korponay-Szabo, I.R.; Popp, A.; Villanacci, V.; Salemme, M.; Heilig, G.; Lillevang, S.T.; Mearin, M.L.; Ribes-Koninckx, C.; Thomas, A.; et al. Accuracy in Diagnosis of Celiac Disease Without Biopsies in Clinical Practice. Gastroenterology 2017, 153, 924-935. [CrossRef]
- Kaukinen, K.; Partanen, J.; Maki, M.; Collin, P. HLA-DQ typing in the diagnosis of celiac disease. Am J Gastroenterol 2002, 97, 695-699. [CrossRef]
Figure 1.
Image splitting. Images were split at 224×224 pixels into non overlapping image patches. A and B, celiac disease. C and D, small intestine control.
Figure 1.
Image splitting. Images were split at 224×224 pixels into non overlapping image patches. A and B, celiac disease. C and D, small intestine control.
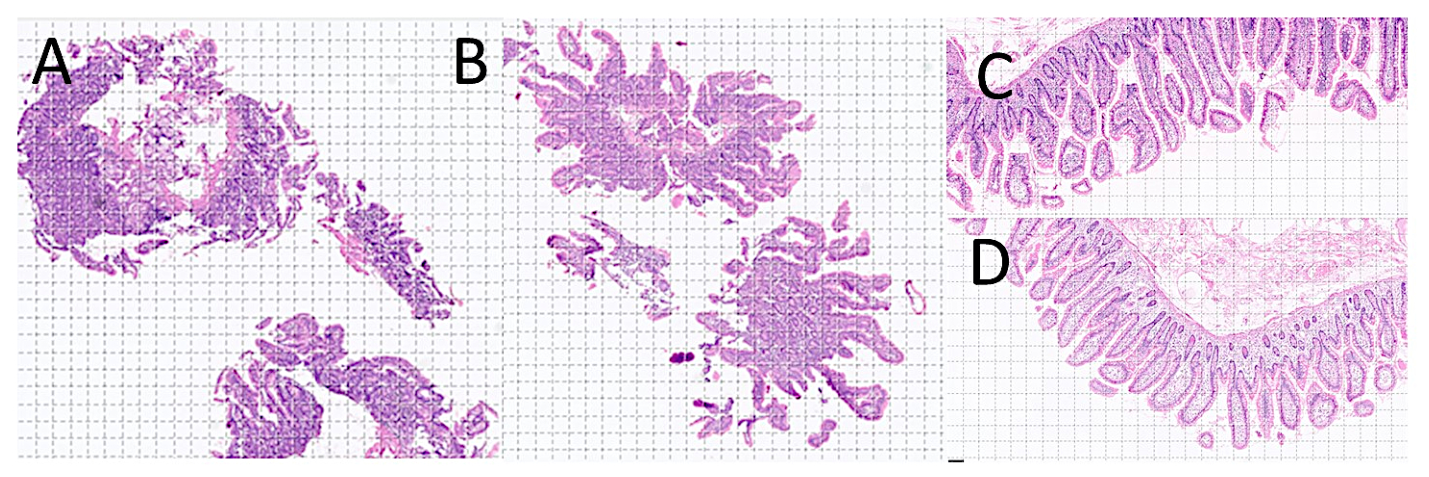
Figure 2.
Celiac disease image patches. Celiac disease is a small bowel disorder characterized by mucosal inflammation, villous atrophy, and crypt hyperplasia.
Figure 2.
Celiac disease image patches. Celiac disease is a small bowel disorder characterized by mucosal inflammation, villous atrophy, and crypt hyperplasia.
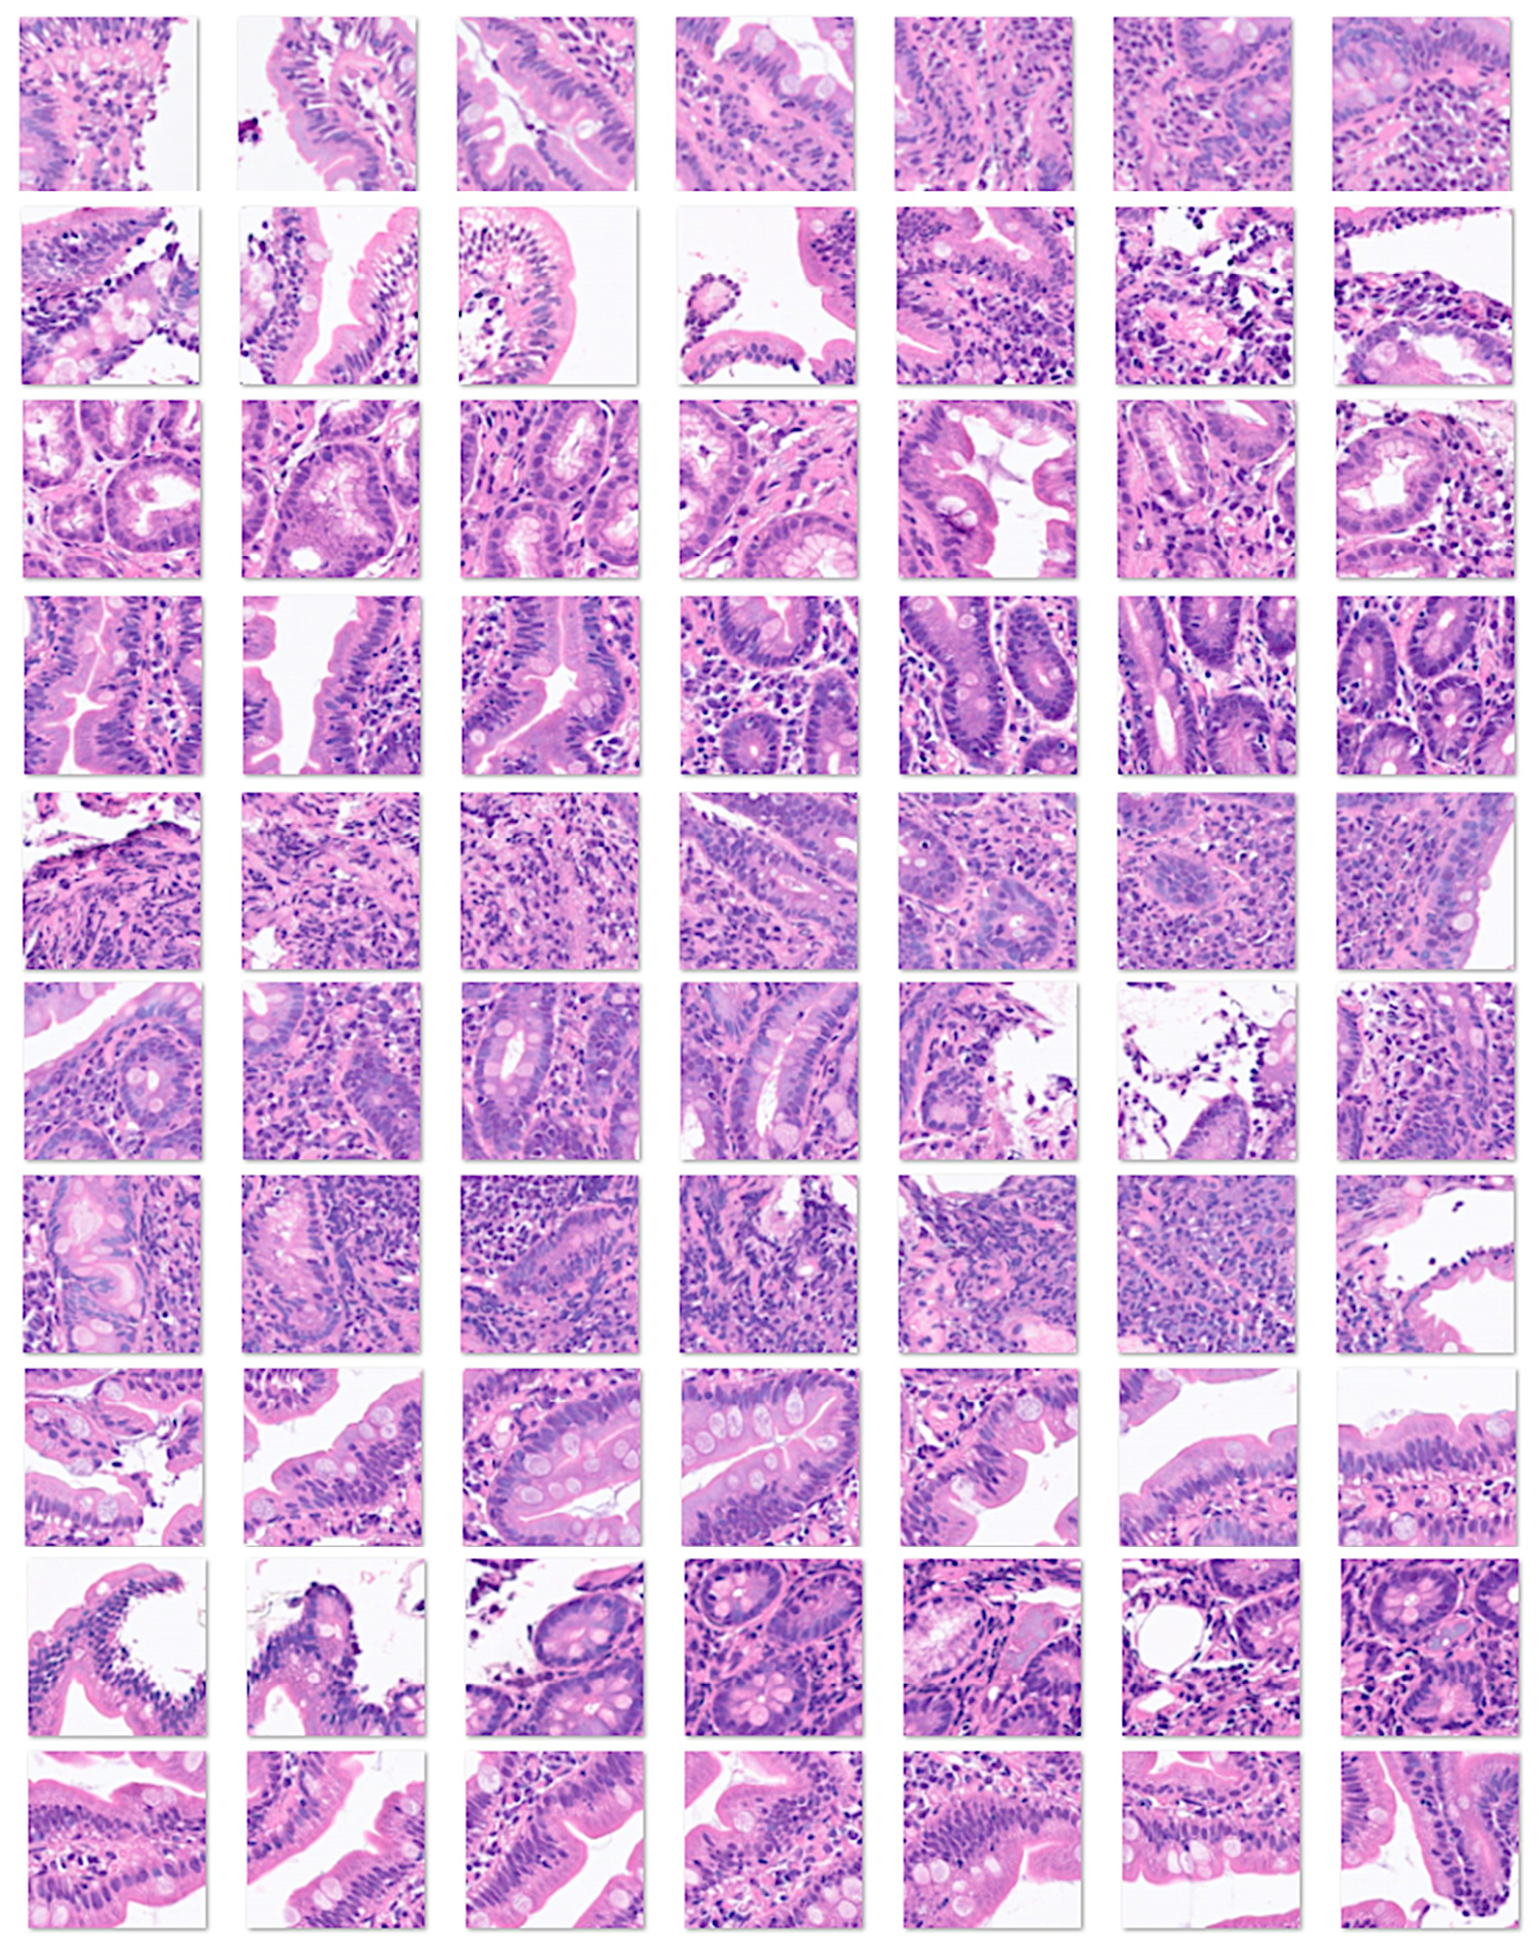
Figure 3.
Small intestine control image patches. Under physiological conditions, the small intestine contains large numbers of immune cells that create the mucosa-associated lymphoid tissue.
Figure 3.
Small intestine control image patches. Under physiological conditions, the small intestine contains large numbers of immune cells that create the mucosa-associated lymphoid tissue.
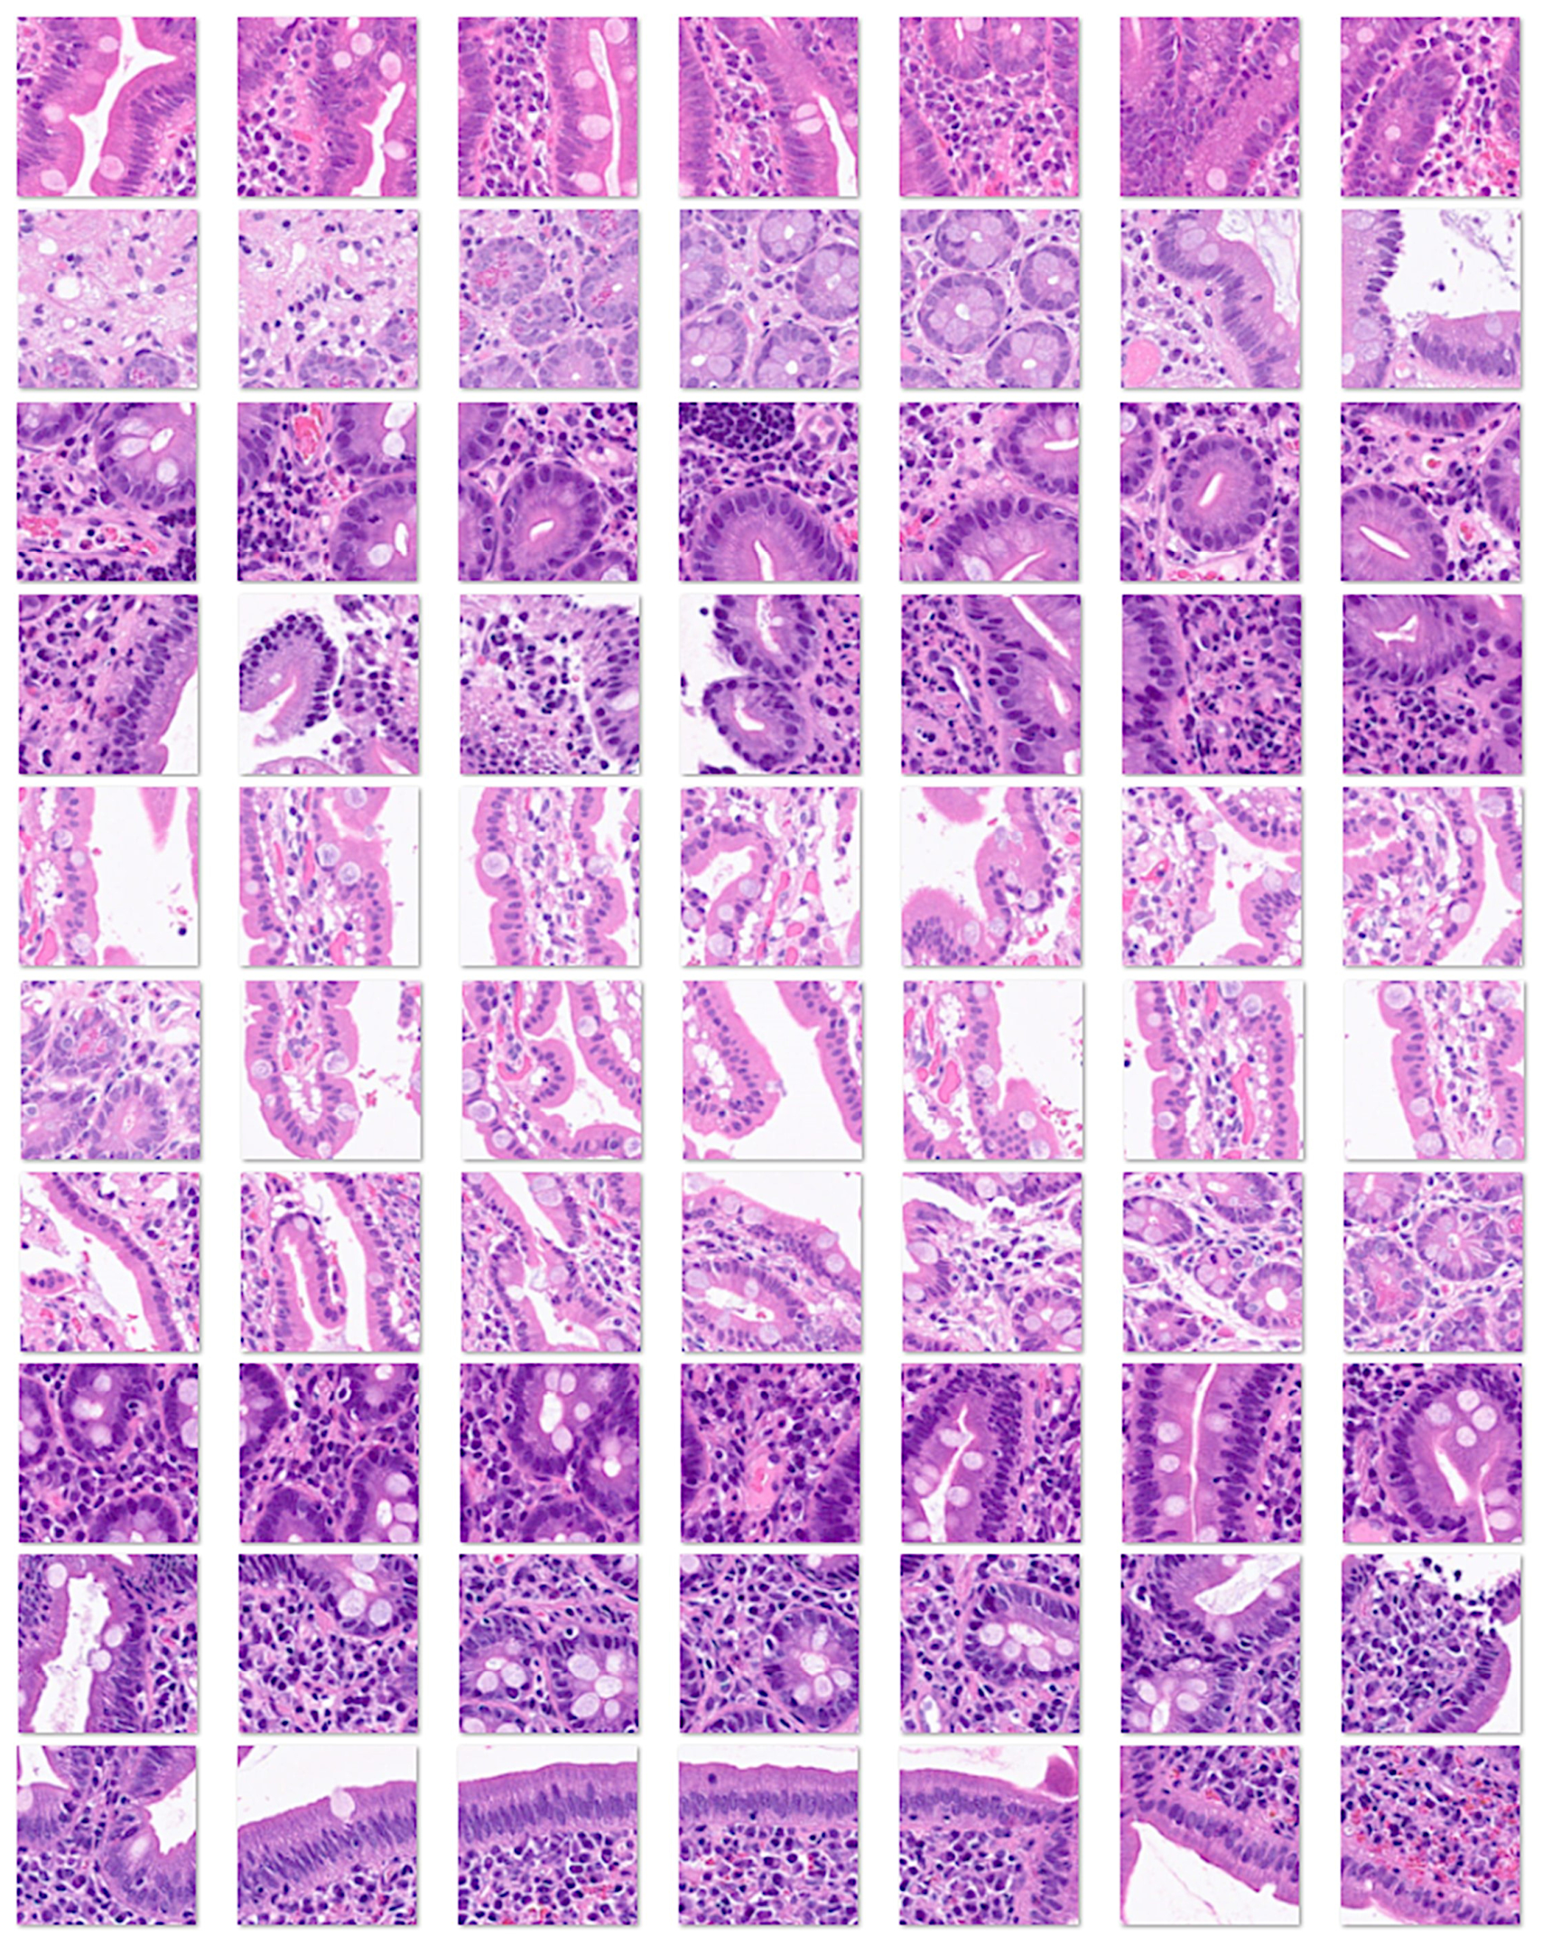
Figure 4.
Duodenal inflammation image patches. Unspecific inflammatory changes are often found in intestinal biopsies, but these changes are not characteristic of celiac disease.
Figure 4.
Duodenal inflammation image patches. Unspecific inflammatory changes are often found in intestinal biopsies, but these changes are not characteristic of celiac disease.
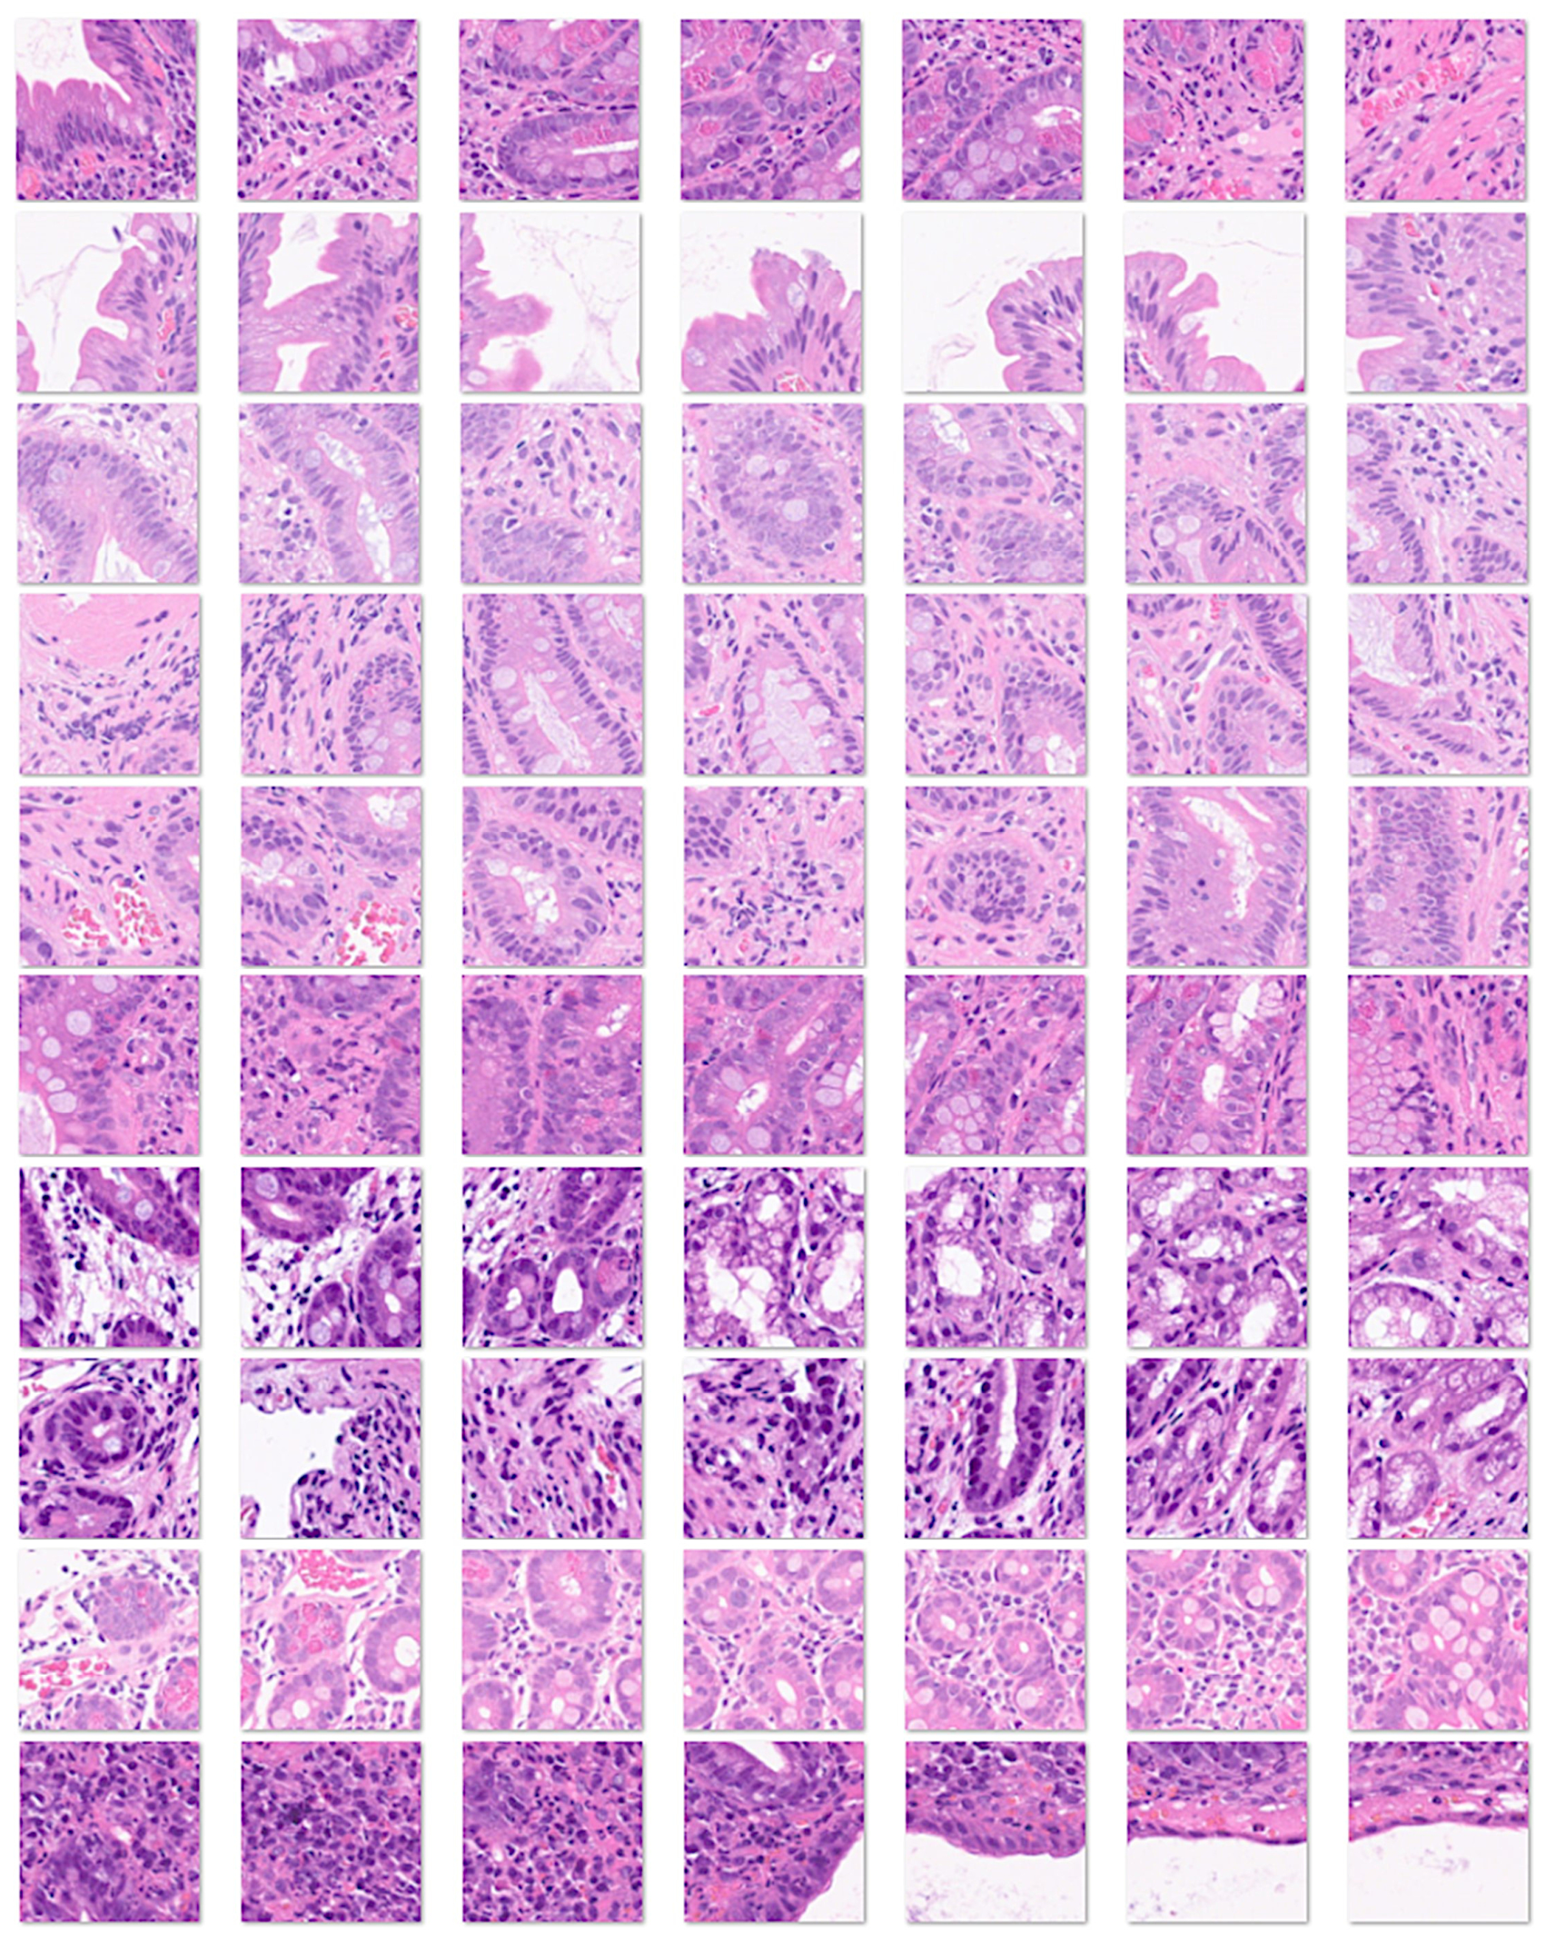
Figure 5.
Duodenal adenocarcinoma image patches. Adenocarcinoma of the small intestine is less common than colorectal cancer. However, is an important differential diagnosis.
Figure 5.
Duodenal adenocarcinoma image patches. Adenocarcinoma of the small intestine is less common than colorectal cancer. However, is an important differential diagnosis.
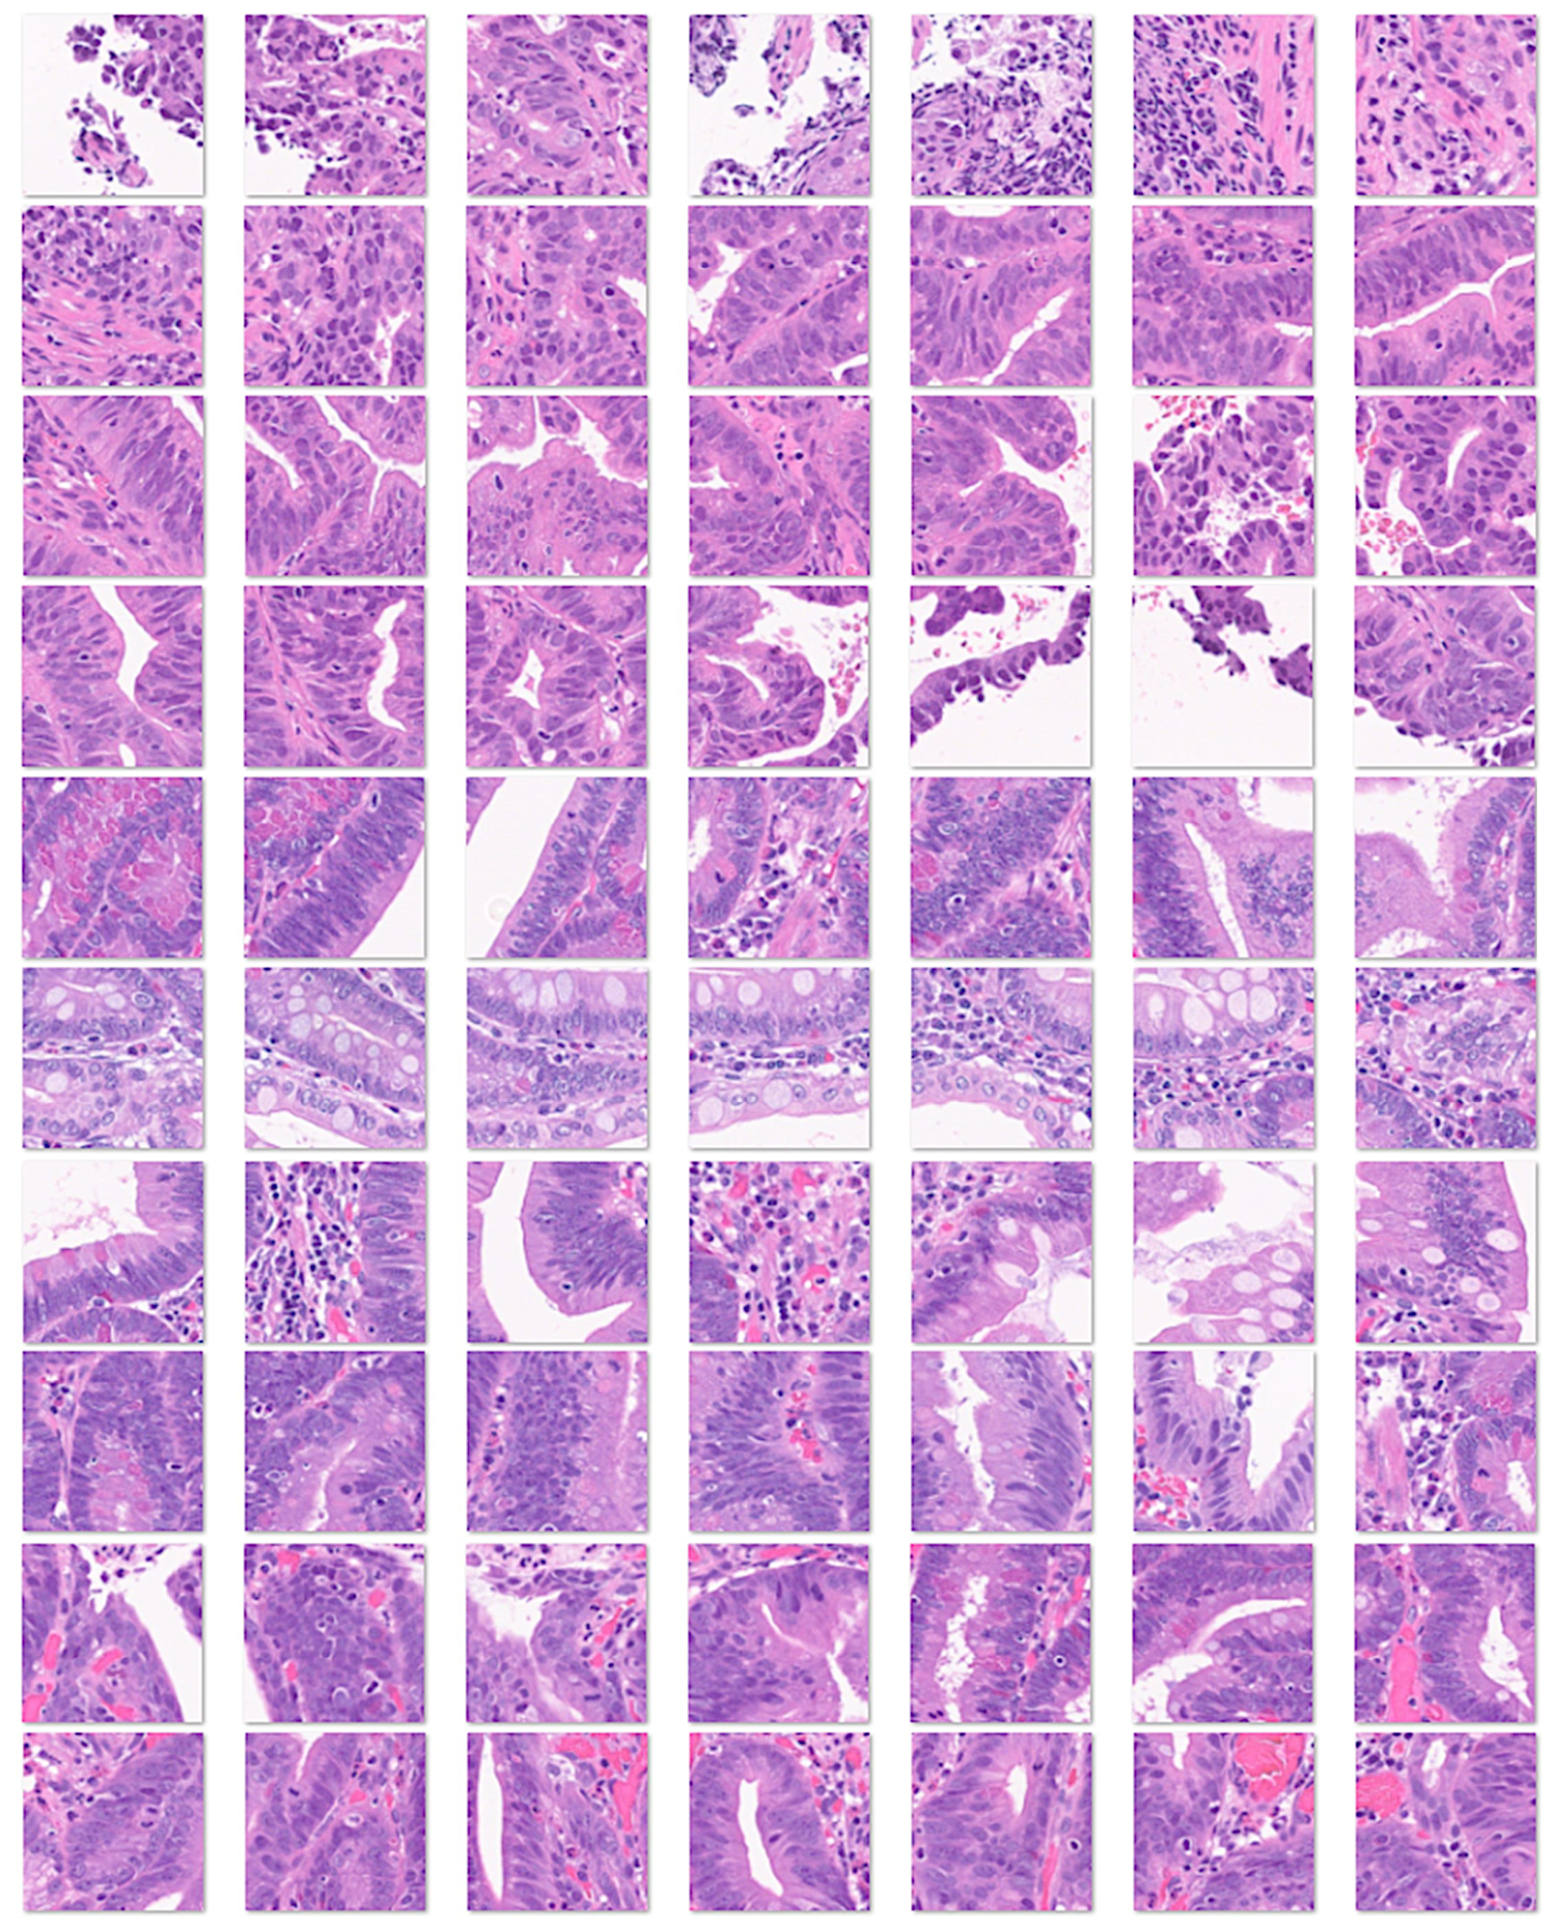
Figure 6.
Measurement of entropy in celiac disease.
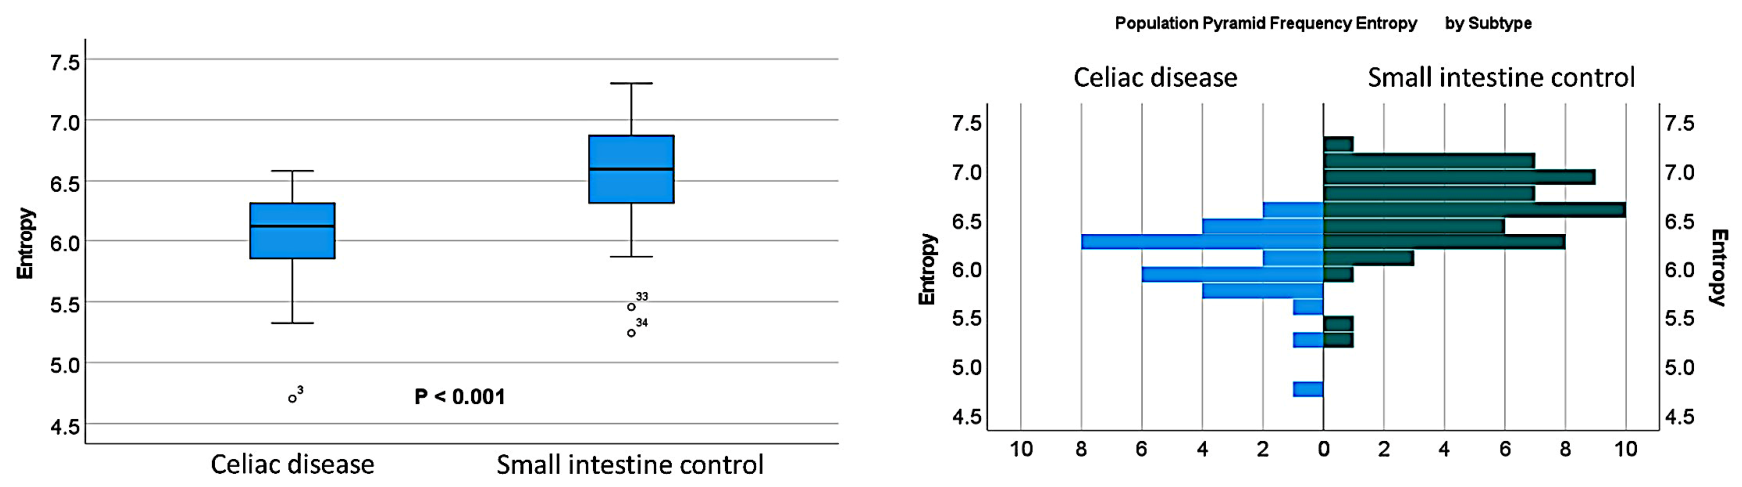
Figure 7.
Measurement of entropy in celiac disease and differential diagnosis. In comparison with duodenal inflammation and small intestine control, celiac disease was characterized by lower histological entropy (both P < 0.001).
Figure 7.
Measurement of entropy in celiac disease and differential diagnosis. In comparison with duodenal inflammation and small intestine control, celiac disease was characterized by lower histological entropy (both P < 0.001).
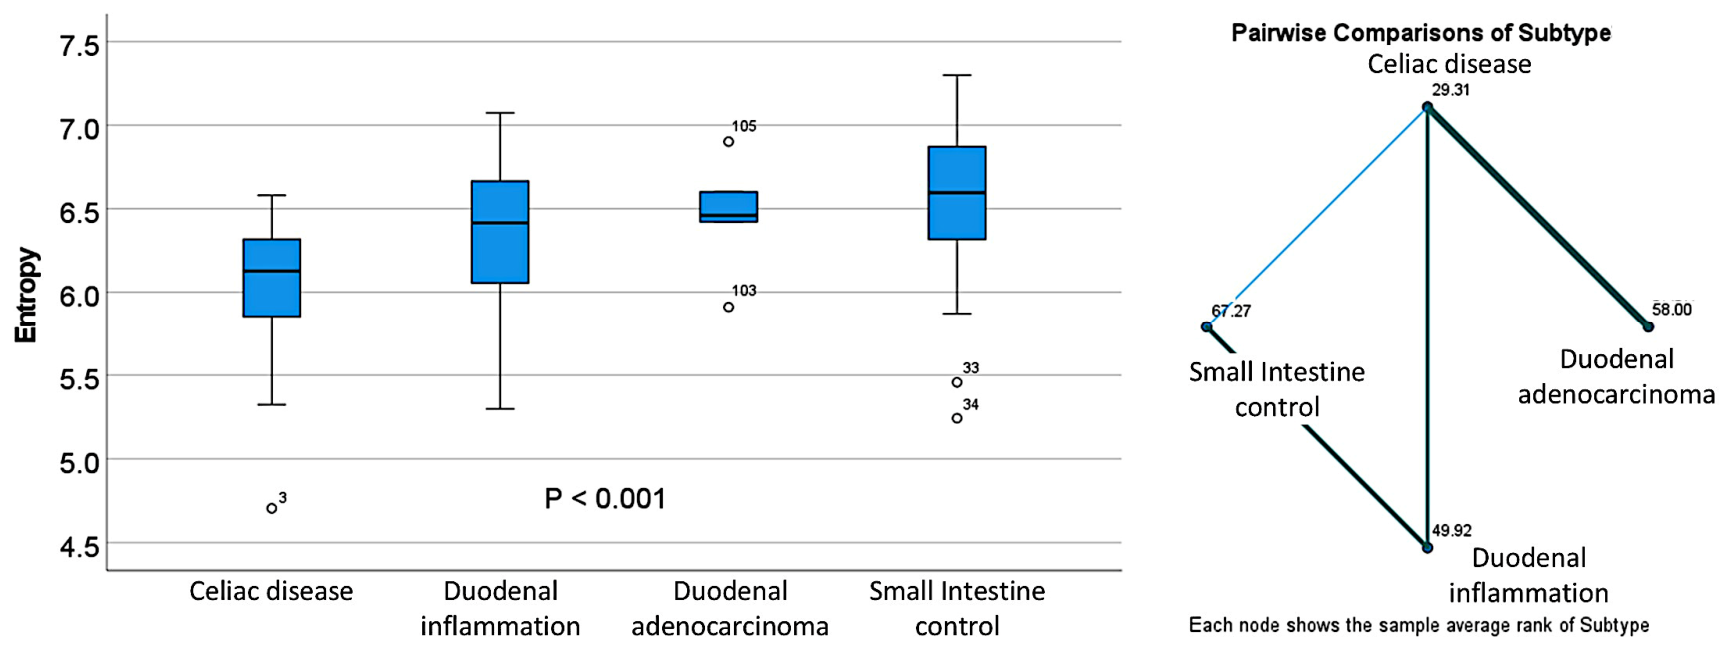
Figure 8.
Entropy measurement in celiac disease, control, and other diagnoses. In comparison with duodenal inflammation and small intestine control, celiac disease was characterized by lower histological entropy (both P < 0.001).
Figure 8.
Entropy measurement in celiac disease, control, and other diagnoses. In comparison with duodenal inflammation and small intestine control, celiac disease was characterized by lower histological entropy (both P < 0.001).
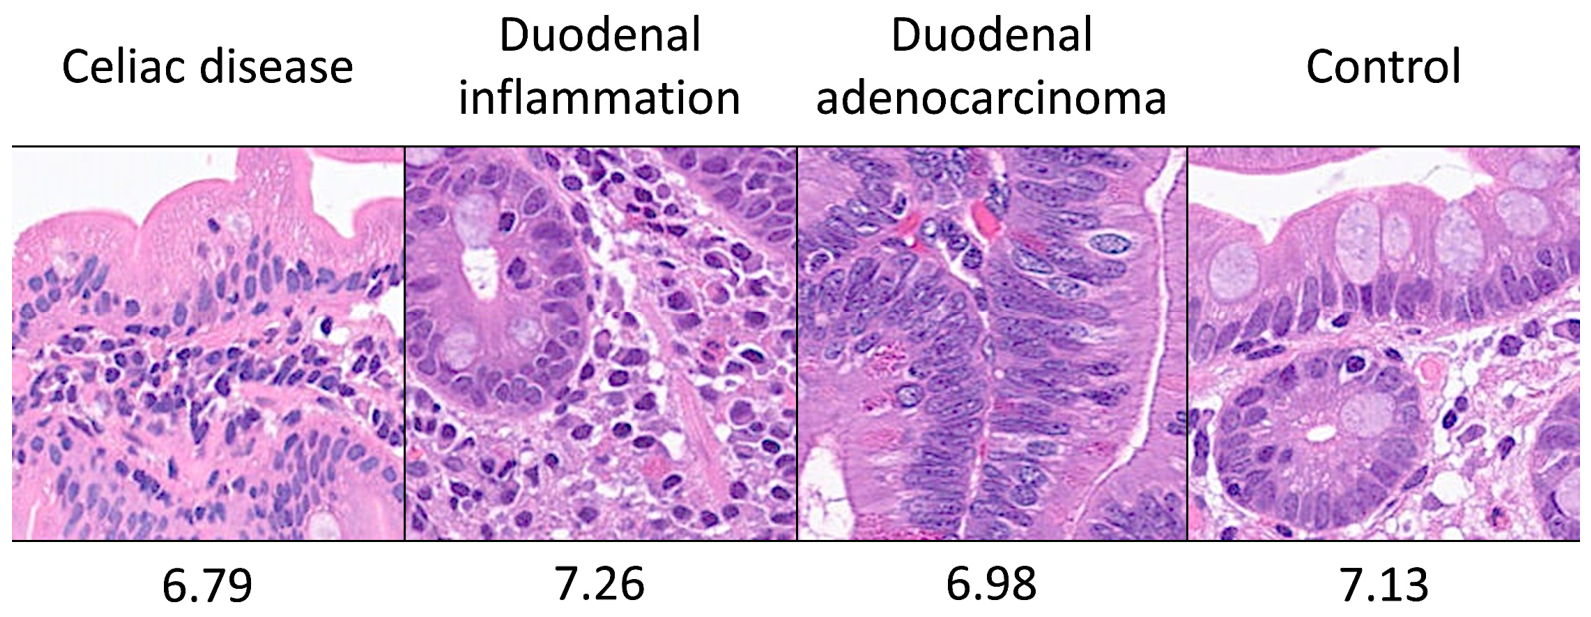
Table 1.
Evaluation of entropy in celiac disease.
| Descriptives | Celiac disease | Small intestine control |
|---|---|---|
| Mean Std. Deviation | 6.04 ± 0.39 | 6.59 ± 0.40 |
| Median | 6.13 | 6.60 |
| Minimum | 4.70 | 5.24 |
| Maximum | 6.58 | 7.30 |
| Range | 1.88 | 2.06 |
Std. Deviation, standard deviation.
Table 2.
Entropy descriptives between celiac disease and 4 differential diagnoses.
| Descriptives | Celiac disease | Duodenal inflammation | Duodenal adenocarcinoma | Small intestine control |
|---|---|---|---|---|
| Mean Std. Deviation | 6.04 ± 0.39 | 6.31 ± 0.48 | 6.46 ± 0.36 | 6.59 ± 0.40 |
| Median | 6.13 | 6.42 | 6.46 | 6.60 |
| Minimum | 4.70 | 5.30 | 5.91 | 5.24 |
| Maximum | 6.58 | 7.08 | 6.90 | 7.30 |
| Range | 1.88 | 1.78 | 0.99 | 2.06 |
Std. Deviation, standard deviation.
Table 3.
Pairwise comparisons between celiac disease and 4 differential diagnoses.
| Subtype 1- Subtype 2 | Test statistic | Std. error | Std. test statistic | P value | Adjusted P value |
|---|---|---|---|---|---|
| Celiac disease-Duodenal inflammation | -20.61 | 9.23 | -2.23 | 0.025 | 0.153 |
| Celiac disease-Duodenal adenocarcinoma | -28.69 | 14.89 | -1.93 | 0.054 | 0.324 |
| Celiac disease-Small intestine control | -37.96 | 7.08 | -5.36 | <0.001 | <0.001 |
| Duodenal inflammation-Duodenal adenocarcinoma | -8.08 | 15.54 | -0.52 | 0.603 | 1.000 |
| Duodenal inflammation-Small intestine control | -17.35 | 8.37 | -2.07 | 0.038 | 0.229 |
| Duodenal adenocarcinoma-Small intestine control | -9.27 | 14.37 | -0.65 | 0.519 | 1.000 |
Std., standard. Significance values have been adjusted by the Bonferroni correction for multiple tests.
Disclaimer/Publisher’s Note: The statements, opinions and data contained in all publications are solely those of the individual author(s) and contributor(s) and not of MDPI and/or the editor(s). MDPI and/or the editor(s) disclaim responsibility for any injury to people or property resulting from any ideas, methods, instructions or products referred to in the content. |
© 2026 by the authors. Licensee MDPI, Basel, Switzerland. This article is an open access article distributed under the terms and conditions of the Creative Commons Attribution (CC BY) license (http://creativecommons.org/licenses/by/4.0/).
Copyright: This open access article is published under a Creative Commons CC BY 4.0 license, which permit the free download, distribution, and reuse, provided that the author and preprint are cited in any reuse.