

Submitted:
09 October 2026
Posted:
12 October 2026
You are already at the latest version
Abstract
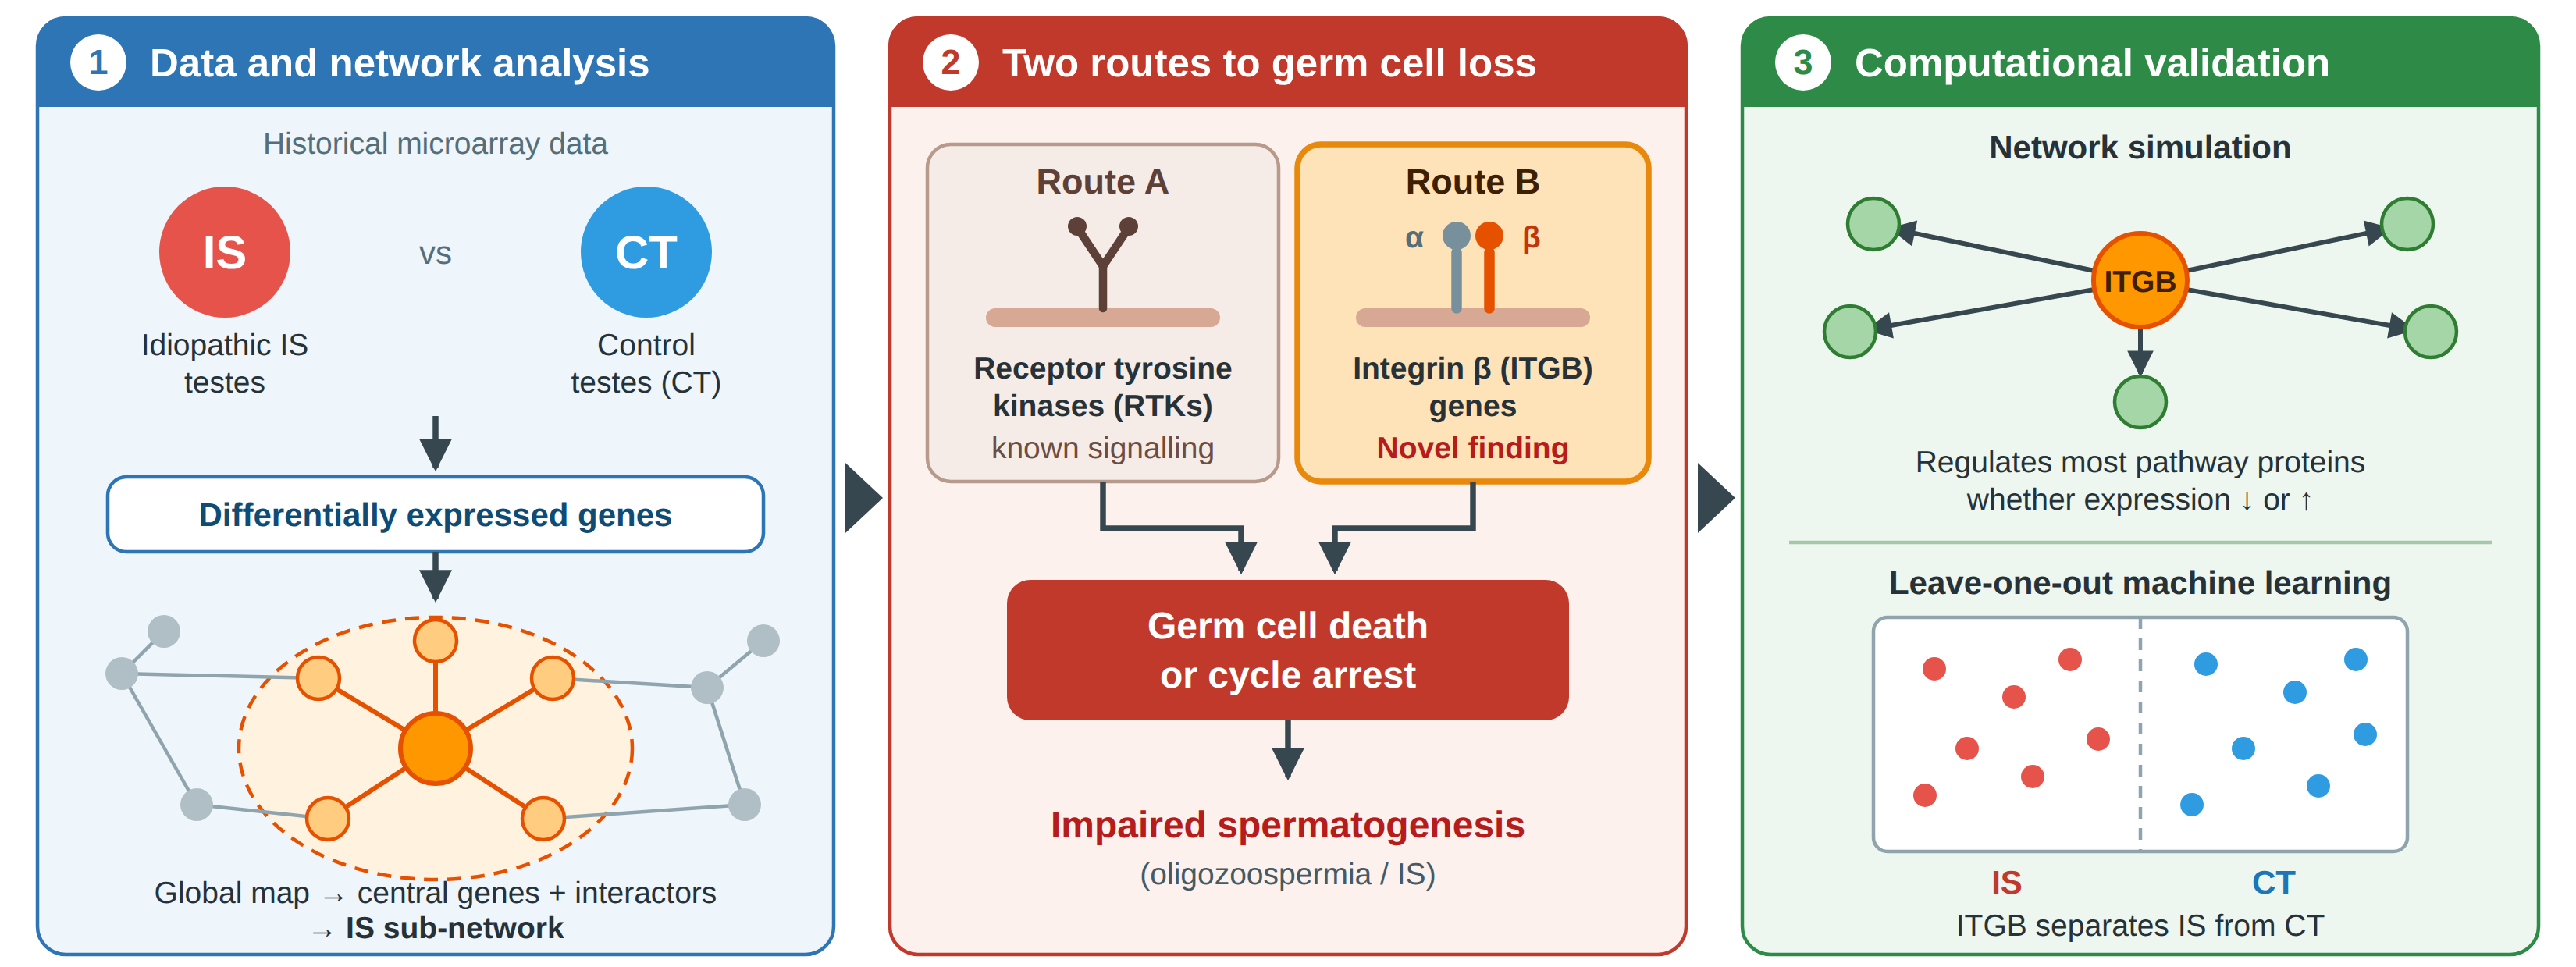
Background/Objectives: Primary, idiopathic, impaired spermatogenesis (IS) affects approximately 2% of men and can manifest as oligozoospermia or azoospermia. Methods: In order to gain insights into the genetic mechanisms involved, a systematic analysis of historical microarray data from testes with IS was conducted by first constructing a global map of signalling networks involving genes differentially expressed between IS and control testes (CT). The centrally located genes and their interacting genes were then extracted to create a sub-network representing the pathways active in IS. Results: Two routes to germ cell death or cycle arrest were revealed: either via receptor tyrosine kinases or integrin β (ITGB) genes; the latter being a novel finding. Another analysis, using leave-one-out machine-learning validation, was performed and also showed that ITGB expression distinguished IS from CT. Computational simulation confirmed the ITGB protein family regulates a majority of the other proteins in its pathway whether the expression level was reduced or increased, indicating ITGB could be a key protein in IS. Conclusions: These computational analyses identify ITGB, particularly ITGB1, as a potential molecular marker associated with idiopathic impaired spermatogenesis and provide insights into signalling mechanisms underlying the condition.
Keywords:
integrin beta-1
; impaired spermatogenesis
; non-obstructive azoospermia
; signalling pathway simulation
1. Introduction
Infertility is becoming increasingly recognised as an important medical concern, as infertile phenotypes and their underlying causes are substantially diverse, markedly in men, and remain poorly understood despite available treatments [1]. Despite thorough clinical evaluation, a substantial proportion of infertile men have no identifiable cause and are therefore classified as having primary idiopathic impaired spermatogenesis (IS) [2]. The lack of a known aetiology limits diagnosis and the development of targeted therapies, highlighting the need to better understand the molecular mechanisms underlying impaired spermatogenesis. At the cellular level, impaired spermatogenesis can result from germ-cell death, cell-cycle arrest or both, and can potentially occur at any stage of life [3]. Testis maldescensus, failures of hormonal support, and a wide range of exogenous factors may contribute to this impairment of spermatogenesis [4], likely resulting a significant reduction in numbers of sperm in the ejaculate, leading to oligozoospermia or azoospermia [5]. The latter is a form of infertility that presents particular challenges, since the only available interventions are assisted conception using sperm extracted from the testis or epididymis– if they can be found – or donor sperm [6]. DNA microarray has been used extensively to detect RNA expression patterns, and the findings are usually deposited in publicly accessible databases. Among these, the Gene Expression Omnibus (GEO) database is a free microarray data resource that was created by the National Centre for Biotechnology Information (NCBI) in 1999 [7]. Over the last decades, over 20,000 microarray datasets have been published into the GEO database [8]. For instance, in 2007, Dubé et al., discovered using microarrays that 414 genes were expressed at least 2-fold higher or lower in IS patients compared with fertile men, in whom the genes CRISP1, SPINLW1, FAM12B and DEFB129 were up-regulated. These genes were involved in gene transcription, immune function and fertility but it was determined that genes involved in water and ion transport, including CFTR, AQP5 and KCNK4, were the most likely to be associated with IS because their expression was repressed in infertile patients [9]. In another study, the gene ART3 was identified as a susceptibility gene for IS using genome-wide gene expression analysis with microarray on IS and CT samples of testicular tissue [10].
All the studies mentioned above, however, suffer from the same problem, namely that any pathology that impairs development of a particular cell type or types within an organ, thereby also perturbs the relative abundance of the different cell types in that organ. Consequently, it is very difficult to interpret accurately expression data obtained from such studies and is particularly problematic in the testis, where spermatogenic cell-type specific effects are common. One solution to this could be to use pathway analysis on expression data from testis samples. To the best of our knowledge, the present report describes the first attempt to apply that approach to human testicular data.
A signalling pathway is a cascade of gene activity that changes a biological function in response to signal transduction from outside to inside the cell [11]. Since 1972 [12], such pathways have been one of the major projects in biological research. There had been over 10,000 such signalling pathways described up to 2017 in the Kyoto Encyclopedia of Genes and Genomes (KEGG) pathway database and are important in the regulation of every type of cellular process [13]. It is logical therefore to use pathway analysis to investigate pathological alterations in gene expression. Pathological processes that result in the ablation of a particular cell type will distort the apparent relative expression levels of genes expressed in the organ as whole, given that different cell types have different profiles of gene expression. Therefore, in such cases, microarrays analyzed at the level of single gene expression are of limited value since it is impossible to determine whether changes are the result of actual alterations in expression or the result of the depletion of a particular cell type. Accordingly, the present work used statistical and computational procedures to analyze microarray data from a mixed cell system to determine alterations in pathways.
2. Materials and Methods
2.1. Microarray Data
Microarray datasets GSE9210 and GSE25518 were downloaded from the Gene Expression Omnibus (GEO) database (https://www.ncbi.nlm.nih.gov/geo/). GSE9210 contains data of 58 testicular biopsy samples, including 47 non-obstructive azoospermia (NOA) samples and 11 obstructive azoospermia (OA) samples. OA was defined as the presence of motile spermatozoa from microsurgical epididymal sperm aspiration (MESA) and testicular sperm extraction (TESE) in the absence of any sperm in the ejaculate. NOA samples have no epididymal testicular or ejaculate spermatozoa [10]. A total of 2,611 transcripts showed statistically significant, differential expression between the two groups [10]. GSE25518 contained 19 IS samples from cryptorchid testes and 4 CT samples from descended, contralateral testes. The paper reported 483 genes absent or under-expressed in the cryptorchid group but their association with the impaired spermatogenesis needed to be confirmed with future work [14]. Comparable methodologies were used in both studies, full details of which are given in the appropriate references [10,14].
2.2. Four-Phase NBI Framework Methodology
The methodology developed for pathway analysis (54) of signalling gene expression in microarray data consists of four phases, summarized as: (1) integrated analysis of differential microarray expression (55, 56); (2) signalling network construction; (3) network analysis for the identification of key biomarkers; (4) corroboration using biological samples. Phase 1 selected those genes in human signalling pathways whose apparent expression levels significantly differ between IS and CT samples. Network degree and centrality analysis was then used to identify and functionally characterize the central nodes [15]. Candidate biomarkers were then selected by comprehensive consideration of their biological functions in pathways and in orthologous functional gene groups (DAVID Bioinformatics resources 6.8) (57-65). Biological simulation was conducted to determine the significance of individual proteins in the regulation of the network and to select and then verify the final target gene. Full details of the methodology are in the supplementary Materials.
3. Results
3.1. Sertoli Cell- and Germ Cell-Specific Genes
The GSE9210 [10] and GSE25518 [14] contain microarray data of 22575 genes and 54675 genes respectively. Although these two microarray datasets were both obtained from biopsied testes, it is not clear from the publications whether the samples contained germ cells. Therefore, the expression of genes specific for Sertoli cells and for germ cells in the two microarray datasets was examined, which revealed the presence of transcripts for 7 Sertoli cell-specific genes and 6 germ cell-specific genes in GSE9210, while GSE25518 showed expression of 10 Sertoli cell-specific and 7 germ cell-specific, genes as identified from PubMed searches (shown in Table S1). The heatmaps of these genes form each database is shown in Figure 1.
Individual genes show differences in expression among individual samples both within and between the two datasets, possibly indicating some variation in cellular composition. However, in general, the germ cell-specific genes (DAZL-HPRT1) in GSE9210 (Figure 1, left-hand panel) show markedly higher expression levels than Sertoli cell-specific, genes in CT samples (x-axis, listed in red) and lower levels in the IS samples (x-axis, listed in black). This suggests that while both the CT and IS samples contain both Sertoli cells and germ cells, the proportion of germ cells in IS is likely to have been lower than in CT. The latter pattern (higher Sertoli-cell gene expression than germ-cell gene expression in IS samples) can also be discerned in the right-hand panel of Figure 1, which shows the equivalent data for GSE25518.
3.2. Network Construction
In total, 1889 genes in the GSE9210 data were found to be significantly differently expressed (p-value <= 0.05 and fold change greater or equal to 2 in the IS compared with the CT samples (Table 1). Of those, 744 were up-regulated and 1145 down-regulated. In the same way, a further 331 genes (298 up regulated and 33 down regulated) were found to be significantly differentially expressed in the GSE25518 data (Table 2). Thus, 2220 apparently significantly differentially expressed genes were found by combining the two gene sets and therefore used in the subsequent pathway analysis. The genes found to be significantly differently expressed in the IS group compared with the CT group are represented in 229 KEGG pathways, in which 51 of the 229 pathways were found to be statistically significant (p <= 0.05) using Fisher’s exact test. Nine of these pathways belong to the cellular processes of the biological signalling pathway class (shown in Table 2), on which we chose to focus as being particularly likely to yield targets for intervention. A total of 161 genes were involved in the 9 pathways and showed significant difference in expression between the IS and CT groups.
A network that combined all of the 9 signalling pathways was built consisting of: 697 genes including 161 genes significantly differentially expressed between CT and IS; 536 downstream genes; and 13 different gene-to-gene interaction types including activation, binding, compound, phosphorylation, dephosphorylation, dissociation, expression, indirect, inhibition, missing, repression, state change and ubiquitination (KEGG database). This network was then modularity analyzed using the software package Gephi (https://gephi.org/) to cluster all genes in the network based on their interactions and to assess their functional characteristics. In a given module, all nodes share a specific function in a pathway process. Based on our network analysis, 16 models were identified, with modularity score of 0.776, which, according to this software package, indicates a high probability of clustering into distinct functional model. The number of genes in the 16 models is given in Table 3.
3.3. Network Analysis
Based on the above network, several network parameters for each node including eccentricity, closeness centrality, betweenness centrality, degree, in-degree, out-degree, clustering coefficient, number of triangles and modularity class were calculated according to the formula given in the methods. Afterwards, 78 genes were extracted from this network based on the above parameter calculation (eccentricity, closeness centrality, betweenness centrality, degree, in-degree, out-degree, clustering coefficient, number of triangles and modularity class) and their result condition (in-degree >= 1 & betweenness centrality >= 1000) (Table S4). These 78 genes showed high centrality in the network so a change in expression of any of them could potentially affect the whole network.
3.4. Target Gene and Male infertility Relative Analysis
A set of functional analyses were performed to validate whether the 78 target genes were positively related to azoospermia. DAVID Bioinformatics resources, the GeneCards database (http://www.genecards.org/) and the Human Mutation Database (http://www.hgmd.cf.ac.uk/ac/index.php) were used to reveal different types of information. DAVID analysis indicated that 11 of those 78 target genes were classified in 9 Reproduction Related clusters and all the other 67 genes were linked with the 11 in the 9 clusters (shown in Table 4).
Based on the 78 genes, a sub-network was then created (Figure 2). The red nodes indicate the associated genes that have previously been reported in the literature to have relevance to azoospermia or male infertility, while the genes in the green box are those identified here for the first time to be associated with azoospermia.
Figure 2.
The suspected signalling network for IS based on 78 central genes. The signalling network for IS based on the 78 genes that appear to have different expression levels between IS and CT testes. Gene names in red are genes that have previously been found to be related to azoospermia or male infertility; the genes in the green box are novel candidate genes for involvement in azoospermia. The interaction types between genes were determined from biological pathway databases. Genes in same box are paralogs. Arrows = expression/activation; T-bars = inhibition; straight lines = binding/association; dashed arrow = indirect expression/activation; dashed T-bar = indirect inhibition; empty boxes represent other genes that were not identified by our methods; empty circles indicate other molecules.
Figure 2.
The suspected signalling network for IS based on 78 central genes. The signalling network for IS based on the 78 genes that appear to have different expression levels between IS and CT testes. Gene names in red are genes that have previously been found to be related to azoospermia or male infertility; the genes in the green box are novel candidate genes for involvement in azoospermia. The interaction types between genes were determined from biological pathway databases. Genes in same box are paralogs. Arrows = expression/activation; T-bars = inhibition; straight lines = binding/association; dashed arrow = indirect expression/activation; dashed T-bar = indirect inhibition; empty boxes represent other genes that were not identified by our methods; empty circles indicate other molecules.
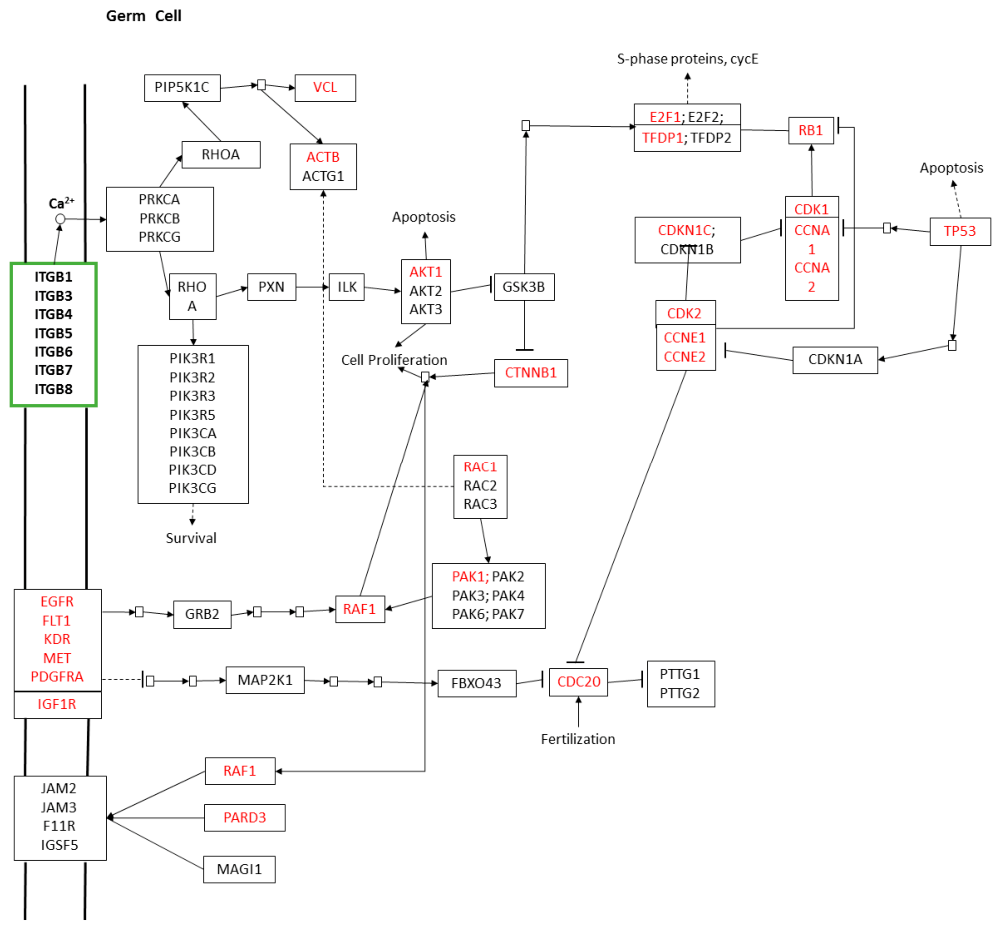
The 78 genes in the sub-network were analyzed using DAVID, GAD and PubMed to identify genes that could be associated with azoospermia if their expression were perturbed (susceptibility genes). These include the genes that had been reported previously in the literature shown in red in Figure 2. The DAVID and GAD analyses identified 18 genes in the network as susceptible: ITGB1, ITGB3, ITGB4, ITGB5, ITGB6, ITGB7, ITGB8, TP53, CDC20, CDK2, CCNA1, CCNA2, EGFR, FLT1, KDR, MET, PDGFRA and IGF1R. PubMed searches showed that 11 of them had been reported to be related to azoospermia or male infertility [16,17,18,19,20,21,22,23,24,25,26]. The remaining 8 were the ITGB genes, which according to the DAVID GO analysis, are clustered into the subgroup “reproduction”. The ITGB paralog genes have not previously been reported in the literature as related to azoospermia, so they are potentially novel, candidate biomarkers of IS (Figure 2a).
3.5. Candidate Biomarker Validation
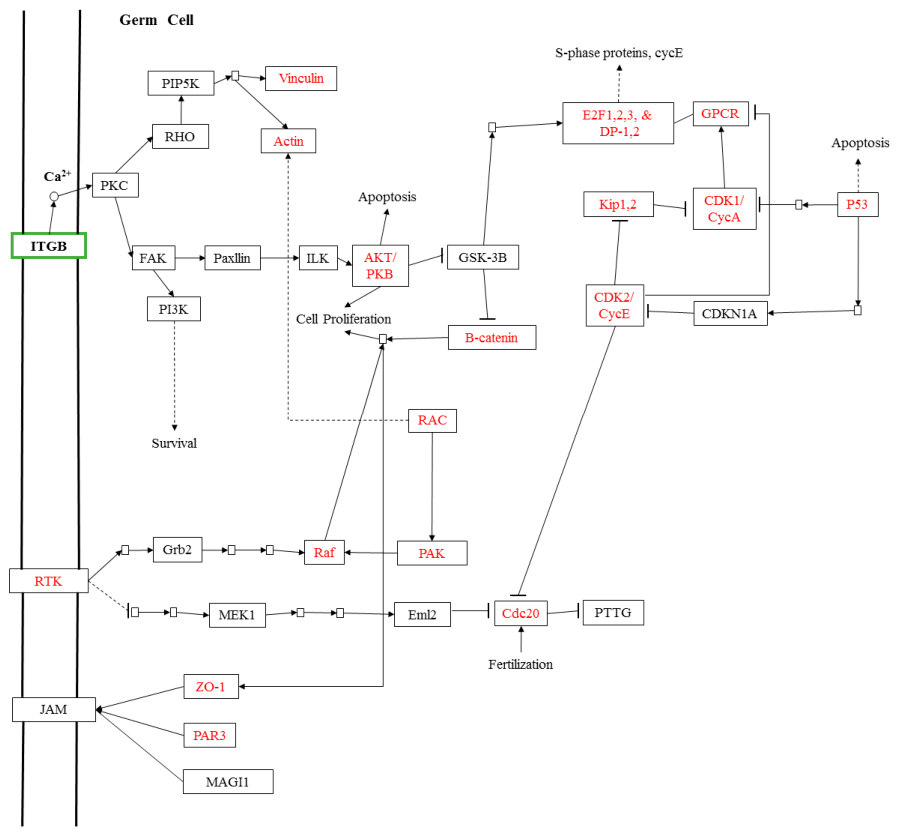
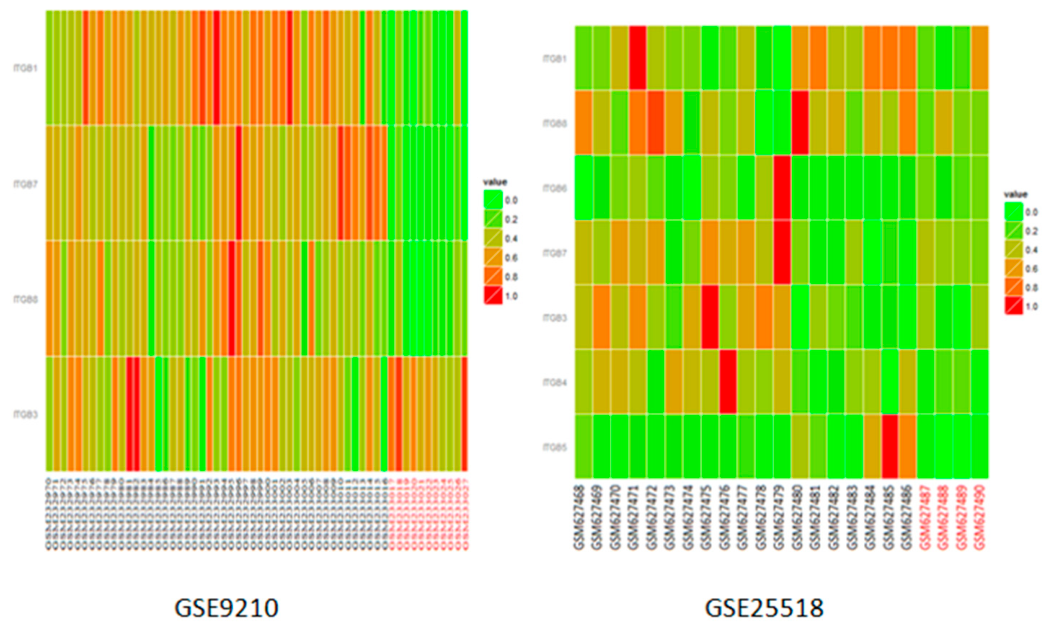
We used leave-one-out support vector machine (SVM), which is a supervised learning algorithm for classification data analysis [27], to check the power of the 7 candidate genes in the classification of IS and CT samples based on the original expression data. The correct rate of classification for GSE9210 data was 97% and for GSE25518 was 83%. The heatmaps for these genes, as shown in Figure 3, demonstrate the differential expression patterns of those 7 genes in CT and IS. The two panels show the original data for the 7 candidate biomarkers in GSE9210 and GSE25518, in which the sample codes in red are the CT samples. A statistically significant up-regulation between IS and CT samples was found, illustrated in Figure 3.
Figure 3.
Heatmaps for the SVM results based on 7 candidate genes. The x-axis samples given in red are CT samples, those in black, IS samples. Only 4 of the ITGB genes were represented on GSE9210 and ITGB1, ITGB7 and ITGB8 were clearly up-regulated and ITGB3 slightly up-regulated in the disease samples. Although the results in GSE25518 (right) were not as clear as those from GSE9210, all 7 of the putative biomarkers were upregulated in at least some of the disease samples.
Figure 3.
Heatmaps for the SVM results based on 7 candidate genes. The x-axis samples given in red are CT samples, those in black, IS samples. Only 4 of the ITGB genes were represented on GSE9210 and ITGB1, ITGB7 and ITGB8 were clearly up-regulated and ITGB3 slightly up-regulated in the disease samples. Although the results in GSE25518 (right) were not as clear as those from GSE9210, all 7 of the putative biomarkers were upregulated in at least some of the disease samples.
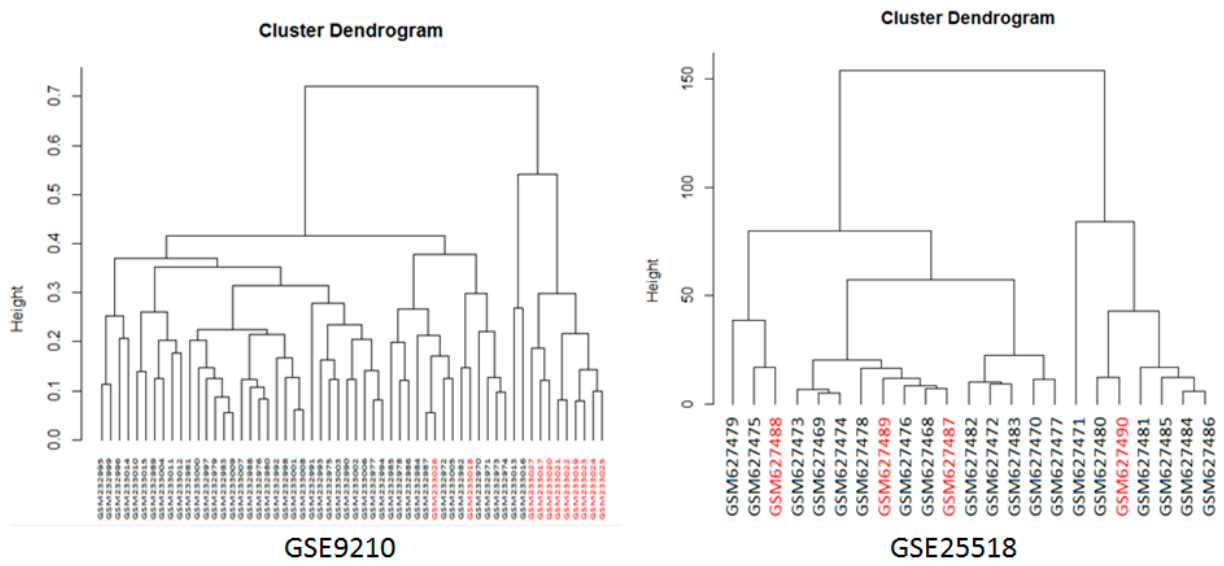
We also used Hierarchical Clustering (HC) to analyze clustering of the samples using the expression data of the 7 candidate genes in the two sets of microarray data, and the results showed a clear separation between the IS and CT samples (Figure 4). Note that the GSE9210 database was derived from approximately twice as many samples as GSE25518 and the differences are qualitatively clearer although significant differences were found for both.
Figure 4.
HC results for the 7 candidate biomarkers. Samples listed in red are CT samples, those in black are IS samples. In GSE9210, two CT samples clustered into the IS group while in GSE25518, three CT samples clustered into same group as 13 IS samples and the other CT samples clustered with the remaining 6 IS samples.
Figure 4.
HC results for the 7 candidate biomarkers. Samples listed in red are CT samples, those in black are IS samples. In GSE9210, two CT samples clustered into the IS group while in GSE25518, three CT samples clustered into same group as 13 IS samples and the other CT samples clustered with the remaining 6 IS samples.
To investigate further the relevance of the proteins derived from the 78 genes to IS, we performed a computational simulation for the network using the software package Cell Illustrator (The University of Tokyo). Since, as shown in Figure 2a, the sub-network contains genes that produce several closely related proteins or isoforms of the same protein, it only represents 33 types of protein. Of these, 23 were regulated by ITGB including E2F, which represents 5 paralogs. Therefore 19 proteins or protein groups were used in the simulation, which involved changing the effective parameter of each protein type from 0-10 while keeping the parameters of the rest unchanged (Figure 5).
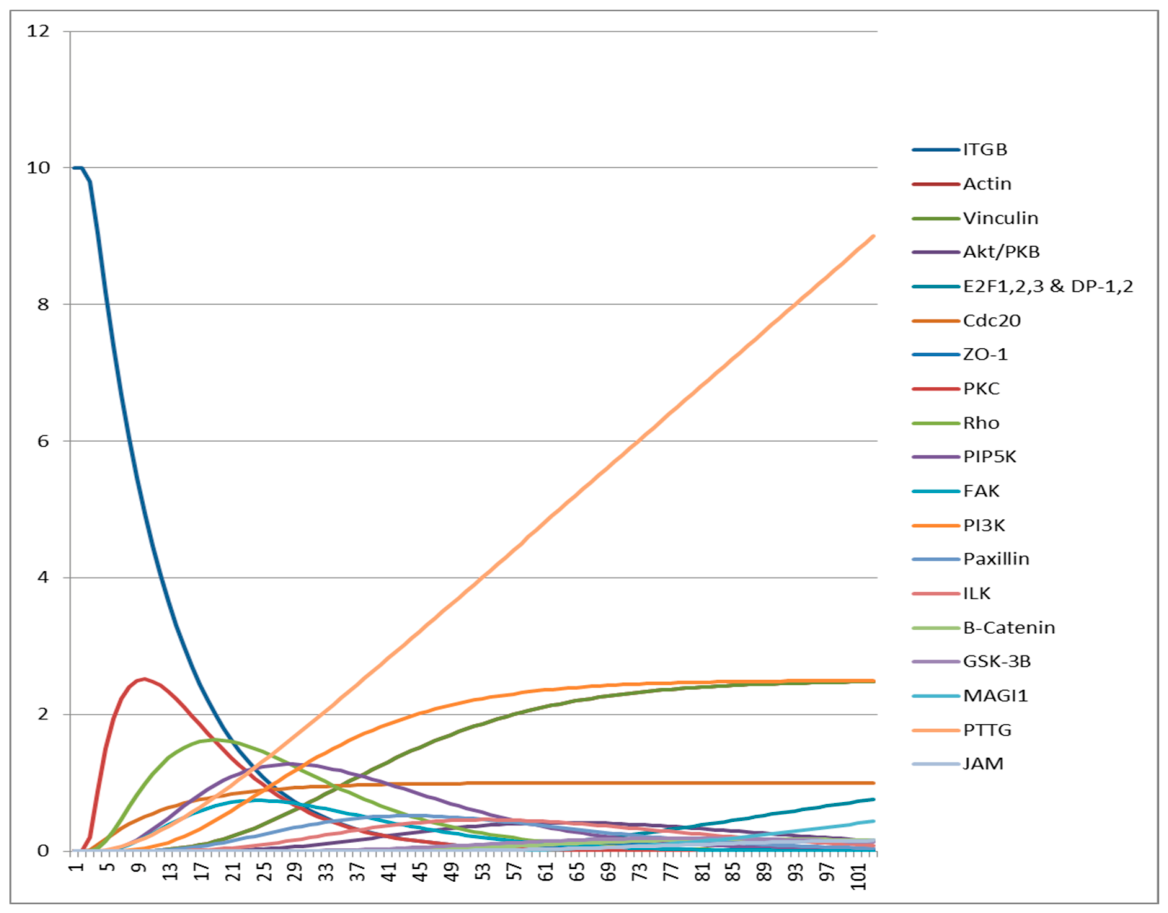
Only altering ITGB had an effect on the majority of other genes in its pathways (Figure 6). The most significant results of the simulation were thus that the genes in ITGB affected the expression levels of the proteins at 18 nodes in the sub-network, which is about 80% of the total (Figure 6). p53 (TP53) influenced about 24% of nodes while the CDK2/CycE and RTK genes affected 21% of nodes in the network, while CDC20 only affected the genes PTTG1 and PTTG2 (data not shown). This simulation result demonstrates that ITGB appears to be the major determinant of the development of IS, and that the higher the expression of ITGB genes, the greater the effect on the network.
Figure 5.
Cell illustrator simulation file for the sub-network. This figure displays the cell illustrator simulation file including 33 paralog nodes, which contains 76 target genes and 46 process edges. The number at each node’s bottom left-hand corner is the value of each node, which was changed from 0-10 during each simulation. The top left-hand corner shows the name of each node.
Figure 5.
Cell illustrator simulation file for the sub-network. This figure displays the cell illustrator simulation file including 33 paralog nodes, which contains 76 target genes and 46 process edges. The number at each node’s bottom left-hand corner is the value of each node, which was changed from 0-10 during each simulation. The top left-hand corner shows the name of each node.
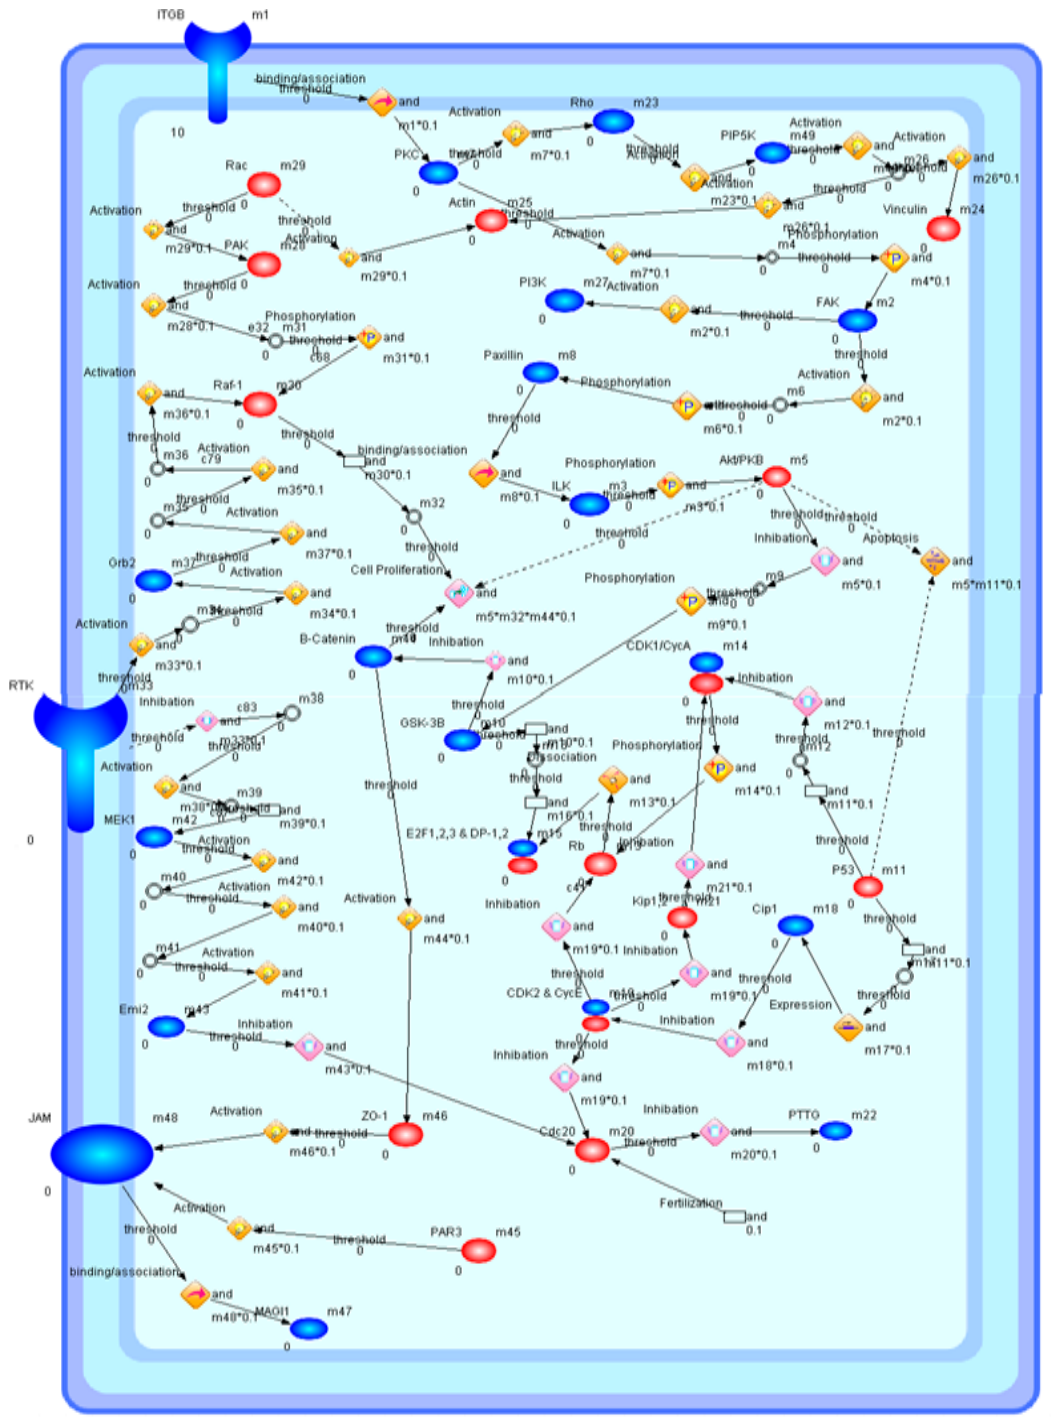
Figure 6.
Simulation results for the effect of ITGB on the proteins in the network whose expression it regulates. This figure displays the simulation curve distribution results for ITGB and the nodes that it affected. In order to use Cell Illustrator to simulate the effect of each gene on the network, the expressed proteins were used to represent each gene or group of paralog genes; a total of 33 proteins are produced by the 78 genes in the sub-network (see figures 2 and 2a). ITGB represents 7 susceptible genes and as shown here, affects the highest number (18) genes or groups of paralogs, six of which have been previously reported as being related to azoospermia.
Figure 6.
Simulation results for the effect of ITGB on the proteins in the network whose expression it regulates. This figure displays the simulation curve distribution results for ITGB and the nodes that it affected. In order to use Cell Illustrator to simulate the effect of each gene on the network, the expressed proteins were used to represent each gene or group of paralog genes; a total of 33 proteins are produced by the 78 genes in the sub-network (see figures 2 and 2a). ITGB represents 7 susceptible genes and as shown here, affects the highest number (18) genes or groups of paralogs, six of which have been previously reported as being related to azoospermia.
4. Discussion
Conventional approaches to expression analysis with microarrays use both fold-change in expression and expression p-value [28,29]to identify significantly altered genes. However, this is based on single-gene expression, so if a particular cell type is lost or depleted in a mixed population of cells, the apparent expression level of any gene expressed in other cell types is likely to be higher than it would be in an unaffected cell population. Potentially, this greatly limits the utility of tissue-level expression profiles.
Furthermore, focusing on the expression of individual genes ignores the importance of gene-to-gene interaction. The expression of individual genes influences the expression of others, forming cascades of gene-to-gene interactions that describe biological pathways. These pathways can themselves interact, forming complex networks [30]. Our hypothesis was that the problem of expression-level distortion in organ-based microarray studies could be circumvented by analyzing expression in terms of pathways, using gene to gene co-expression relationships with computational simulation that identifies the driving power of individual target genes/proteins. Thus, although Table 4 shows there was no significant difference in average ITGB1 expression between IS and CT in the two databases, pathway analysis was able to demonstrate a significant increase in expression in IS compared with CT. In the sub-network created, >50% (49 of the 78 genes) are represented in the focal adhesion [31] pathway (Figure 2) with most of the downstream genes leading the pathways to cell proliferation, apoptosis, cell cycle regulation or survival. Furthermore, 25 of the 78 genes are characterized as being in GO groups related to male infertility, and 12 of those 25 are specifically related to azoospermia (David Bioinformatics Resources Database 6.7). To corroborate a functional relationship between any of the 78 potential target genes and azoospermia, the list of network members was compared with 77 azoospermia-related genes identified from GAD (see Materials & Methods). Four genes occurred in both sets: TP53, CCNE1, CCNE2 and CDK2. TP53 is one of the most important genes involved in cellular decision making between DNA repair, cell cycle arrest or apoptosis and has previously been suggested to be involved in idiopathic male infertility [32] . Two of the others, CCNE1 and CCNE2 are key regulators of the cell cycle to activate the fourth gene, CDK2, which forms a complex with CycE [33]. The dysregulation of CDK2/CycE leads to testicular atrophy and a reduction in male fertility because it can arrest spermatogonial mitosis [34] The pathways in the network can be divided into two sets of signal transduction cascades, each headed by a group of membrane-bound genes. One is ITGB, a group of 8 paralog genes, of which 7 members were associated with IS: ITGB1, ITGB3, ITGB4, ITGB5, ITGB6, ITGB7 & ITGB8. The other is RTK, which includes the genes EGFR, FLT1, KDR, MET, PDGFRA & IGF1R, classed as paralogs by the KEGG database. Expression changes in all of the genes in the RTK group have previously been shown to be associated with male infertility including EGFR [35], FLT1 & KDR [23], MET [36], and IGF1R [26]. None of the ITGB paralog genes has been reported in the literature as having any functional relationship with azoospermia or male infertility although DAVID functional annotation allocates ITGB1 into the gamete generation GO group. Its isoform integrin beta-1 is expressed in differentiated prostate gland epithelial cells and regulates primordial germ cell migration [37]. From the present work, the SVM results show a high correct rate in microarray data GSE9210 and the Gephi results (Table 2) for ITGB were also high with 60 in-degree value and over 4000 betweenness centrality values. In addition, the simulation result shows that altering the levels of ITGB would have the greatest effect of all genes in the pathway and around one third of the affected genes have been shown to be directly or indirectly related to azoospermia[10,12,16,18,19,26,38,39,40,41]. This includes genes downstream of ITGB (VCL, ACTB, AKT1, E2F1, TFDP1) as shown in the sub-network in Figure 1, which have all previously been found to a direct effect on azoospermia [10,12,16,18,19,26,38,39,40,41].Together, all these lines of evidence point to the ITGB genes as being key, novel mediators of IS. The work was limited to only two microarray datasets, albeit derived from two different types of pathology, so it is possible that the inclusion of more types could have revealed other pathways. In addition, the computationally derived pathways showing alterations in the microarray data do not explain the staining in interstitial or tubule-wall cells. This may be because the pathways leading to IS are controlled by 7 of the 8 ITGB family members. If fewer ITGB genes were involved in in the tubule wall and interstitial cell events, then the pathway analysis would preferentially identify testicular pathways.
The microarray data identified ITGB1 expression as a key component of the observed gene-expression profile in the IS testicular tissue in the arrays. These findings suggested that altered ITGB1 expression could be associated with testicular changes observed in the microarray dataset and provide a basis for further investigation of its potential contribution in male infertility However, the microarray results alone do not establish a functional role for ITGB1, confirm its value as a diagnostic molecular marker, or demonstrate that modulation of ITGB1 could prevent germ-cell loss or induce infertility for contraceptive purposes. Further work, using direct methods such as immunohistochemistry, is required to confirm that changes in ITGB1 are associated with perturbations of spermatogenesis.
5. Conclusions
This study presents a framework methodology for the analysis of testicular gene expression data, based on the construction of a signalling network of susceptible genes, for the systematic analysis of microarray data. The proposed approach firstly constructs a global map of signaling networks of the differentially expressed genes extracted from microarray data. The central genes of the global signaling network and their interacting genes are then used to create a susceptible signaling network for IS. The computational simulation is finally employed to identify the gene biomarkers. By using this approach, 6 statistical candidate genes for IS were revealed. The integrin-β family genes are particularly interesting as they act as membrane receptors involving cell adhesion and recognition in a variety of processes including embryogenesis and immune responses etc. Defects in the adhesion of germ cells within their micro-environment could thus be an important factor in the development of IS. The HC and SVM results confirm their importance in distinguishing IS from CT. This is the first time such an approach has been used to identify key changes in testicular gene expression associated with impaired spermatogenesis.
Supplementary Materials
The following supporting information can be downloaded at the website of this paper posted on Preprints.org: Table S1: Germ cell and Sertoli cell marker genes and the source references for each. Table S3: Microarray data and p-values of specific genes in germ cells and Sertoli cells from GSE25518. Table S4: Network parameters calculated for the 78 target node genes. Table S5: Results of Fisher’s exact test.
Author Contributions
C.Y.G. contributed to the experimental design, performed the simulations, and analyzed and interpreted the data. K.H. drafted the manuscript. M.H.B. supervised the study and contributed to manuscript preparation. Y.H.P. conceived the project, contributed to the analysis of the computational results and supervised the study. All authors reviewed and approved the final manuscript.
Funding
The work was conducted while C.Y.G. was the recipient of a self-funded PhD studentship at the University of Bradford. Further support was provided by the China Postdoctoral Science Foundation (Grant No. 2016M590126) to C.Y.G. and Commercial Development Funding from the University of Bradford (Grant No. 66024/000000) to K.H.
Institutional Review Board Statement
Not applicable.
Informed Consent Statement
Not applicable.
Data Availability Statement
The microarray data we analyzed are available at Gene Expression Omnibus (https://www.ncbi.nlm.nih.gov/geo/:Access No: GSE9210 and GSE25518).
Conflicts of Interest
The authors declare no conflicts of interest.
Abbreviations
The following abbreviations are used in this manuscript:
| IS | Impaired spermatogenesis |
| ITGB | Integrin beta-1 |
| NOA | Non-obstructive azoospermia |
| OA | Obstructive azoospermia |
| CT | Control testes |
References
- Wyrwoll, M.J.; Temel, Ş.G.; Nagirnaja, L.; Oud, M.S.; Lopes, A.M.; van der Heijden, G.W.; Heald, J.S.; Rotte, N.; Wistuba, J.; Wöste, M. Bi-allelic mutations in M1AP are a frequent cause of meiotic arrest and severely impaired spermatogenesis leading to male infertility. Am. J. Hum. Genet. 2020, 107, 342–351. [Google Scholar] [CrossRef] [PubMed]
- Krausz, C. Male infertility: pathogenesis and clinical diagnosis. Best Pract. Res. Clin. Endocrinol. Metab. 2011, 25, 271–285. [Google Scholar] [CrossRef] [PubMed]
- Wang, X.; Zhang, Y.; Zhu, Z.; Wang, C.; Yao, M.; Xu, H.; Zhang, Z.; Ping, H.; Xia, X.; Meng, K. Mechanism and potential therapeutic strategies of genetic abnormalities involved in deoxyribonucleic acid double-strand breaks leading to the development of human non-obstructive azoospermia. Reprod. Biol. Endocrinol. 2026. [Google Scholar] [CrossRef] [PubMed]
- Malik, M.; Thiagarajan, T.; Haymete, M.A.; Batra, N.V.; Bayne, C.E. Diagnosis and Management of the Undescended Testicle: A Modern Update on Cryptorchidism for the Primary Care Clinician. Curr. Treat. Options Pediatr. 2026, 12, 8. [Google Scholar] [CrossRef]
- Achermann, A.P.P.; Esteves, S.C. Diagnosis and management of infertility due to ejaculatory duct obstruction: summary evidence. Int. Braz. J. Urol. 2021, 47, 868–881. [Google Scholar] [CrossRef] [PubMed]
- ASRM. Report on evaluation of the azoospermic male; American Urological Association and American Society for Reproductive Medicine, 2006. [Google Scholar]
- Edgar, R.; Domrachev, M.; Lash, A.E. Gene Expression omnibus: NCBI gene expression and hybridization array data repository. Nucleic Acids Res. 2001, 30, 207–210. [Google Scholar] [CrossRef] [PubMed]
- Barrett, T.; Troup, D.B.; Wilhite, S.E.; Ledoux, P.; Evangelista, C.; Kim, I.F.; Tomashevsky, M.; Marshall, K.A.; Phillippy, K.H.; Sherman, P.M.; et al. NCBI GEO: archive for functional genomics data sets--10 years on. Nucleic Acids Res. 2011, 39, D1005–1010. [Google Scholar] [CrossRef] [PubMed]
- Dubé, E.; Hermo, L.; Chan, P.T.; Cyr, D.G. Alterations in gene expression in the caput epididymides of nonobstructive azoospermic men. Biol. Reprod. 2008, 78, 342–351. [Google Scholar] [CrossRef] [PubMed]
- Okada, H.; Tajima, A.; Shichiri, K.; Tanaka, A.; Tanaka, K.; Inoue, I. Genome-wide expression of azoospermia testes demonstrates a specific profile and implicates ART3 in genetic susceptibility. PLoS Genet. 2008, 4, e26. [Google Scholar] [CrossRef] [PubMed]
- Silverthorn, D.U. Human physiology: an integrated approach, media update, 4 ed.; Personal Education, 2008. [Google Scholar]
- Rensing, L. Periodic geophysical and biological signals as zeitgeber and exogenous inducers in animal organisms. Int. J. Biometeorol. 1972, 16, 113–125. [Google Scholar] [PubMed]
- Kanehisa, M.; Furumichi, M.; Tanabe, M.; Sato, Y.; Morishima, K. KEGG: new perspectives on genomes, pathways, diseases and drugs. Nucleic Acids Res. 2017, 45, D353–D361. [Google Scholar] [CrossRef] [PubMed]
- Hadziselimovic, F.; Hadziselimovic, N.O.; Demougin, P.; Oakeley, E.J. Testicular gene expression in cryptorchid boys at risk of azoospermia. Sex. Dev. 2011, 5, 49–59. [Google Scholar] [CrossRef] [PubMed]
- Koschutzki, D.; Schreiber, F. Centrality analysis methods for biological networks and their application to gene regulatory networks. Gene Regul. Syst. Biol. 2008, 2, 193–201. [Google Scholar] [CrossRef] [PubMed]
- Mashayekhi, F.; Hadiyan, S.P. A single-nucleotide polymorphism in TP53 may be a genetic risk factor for Iranian patients with idiopathic male infertility. Andrologia 2012, 44, 560–561. [Google Scholar] [CrossRef] [PubMed]
- Yang, B.; Yuan, J.L.; Gao, X.K.; Qin, W.J.; Liu, F.; Shao, C.; Liu, H.L.; Kang, F.X. Expression of cell cycle molecules in human azoospermic testes. Xi Bao Yu Fen Zi Mian Yi Xue Za Zhi 2009, 25, 393–395. [Google Scholar] [PubMed]
- Miyamoto, T.; Koh, E.; Sakugawa, N.; Sato, H.; Hayashi, H.; Namiki, M.; Sengoku, K. Two single nucleotide polymorphisms in PRDM9 (MEISETZ) gene may be a genetic risk factor for Japanese patients with azoospermia by meiotic arrest. J. Assist. Reporduction Genet. 2008, 25, 553–557. [Google Scholar] [CrossRef] [PubMed]
- Schrader, M.; Müller-Tidow, C.; Ravnik, S.; Müller, M.; Schulze, W.; Diederichs, S.; Serve, H.; Miller, K. Cyclin A1 and gametogenesis in fertile and infertile patients: a potential new molecular diagnostic marker. Hum. Reprod. 2002, 17, 2338–2343. [Google Scholar] [CrossRef] [PubMed]
- Wolgemuth, D.J.; Lele, K.M.; Jobanputra, V.; Salazar, G. The A-type cyclins and the meiotic cell cycle in mammalian male germ cells. Int. J. Androl. 2004, 27, 192–199. [Google Scholar] [CrossRef] [PubMed]
- Dubé, E.; Dufresne, J.; Chan, P.T.; Cyr, D.G. Epidermal growth factor regulates connexin 43 in the human epididymis: role of gap junctions in azoospermia. Hum. Reprod. 2012, 27, 2285–2296. [Google Scholar] [CrossRef] [PubMed]
- Ai, Q.Y.; Tian, H.; Ma, L.; Miao, N.Z.; Huo, Y.W.; Wang, H.X.; Wang, L.R.; Qiu, S.D.; Zhang, Q.Y. Experimental varicocele affects VEGF and Flt-1 protein expressions in the testis and epididymis of adolescent rats. Zhonghua Nan Ke xue=National J. Androl. 2009, 15, 488–492. [Google Scholar]
- Obermair, A.; Obruca, A.; Pöhl, M.; Kaider, A.; Vales, A.; Leodolter, S.; Wojta, J.; Feichtinger, W. Vascular endothelial growth factor and its receptors in male fertility. Fertil. Steril. 1999, 72, 269–275. [Google Scholar] [CrossRef] [PubMed]
- Leroith, D.; Potashnik, G.; Dunn, J.; Spitz, I.M. The exaggerated prolactin response to thyrotropin-releasing hormone and metoclopramide in 1,2-dibromo-3-chloropropane-induced azoospermia. J. Clin. Endocrinol. Metab. 1981, 52, 38–41. [Google Scholar] [CrossRef] [PubMed]
- Fleishman, R.A.; Saltman, D.L.; Stastny, V.; Zneimer, S. Deletion of the c-kit protooncogene in the human developmental defect piebald trait. Proceeding Natl. Acad. Sci. USA 1991, 88, 10885–10889. [Google Scholar] [CrossRef] [PubMed]
- Sánchez-Luengo, S.; Fernández, P.J.; Romeu, A. Insulin growth factors may be implicated in human sperm capacitation. Fertil. Steril. 2005, 83, 1064–1066. [Google Scholar] [CrossRef] [PubMed]
- Cortes, C.; Vapnik, V. Support-vector networks. Mach. Learn. 1995, 20, 273–297. [Google Scholar] [CrossRef]
- McCarthy, D.J.; Smyth, G.K. Testing significance relative to a fold-change threshold is a TREAT. Bioinformatics 2009, 25, 765–771. [Google Scholar] [CrossRef] [PubMed]
- Dalman, M.R.; Deeter, A.; Nimishakavi, G.; Duan, Z.H. Fold change and p-value cutoffs significantly alter microarray interpretations. BMC Bioinform. 2012, 13 Suppl 2. [Google Scholar] [CrossRef] [PubMed]
- Weng, G.; Bhalla, U.S.; Iyengar, R. Complexity in biological signaling systems. Science 1999, 284, 92–96. [Google Scholar] [CrossRef] [PubMed]
- Chen CS, A.J.; Ostuni, E.; Whitesides, G.M.; Ingber, D.E. Cell shape provides global control of focal adhesion assembly. Biochem. Biophys. Res. Commun. 2005, 307, 355–361. [Google Scholar]
- Li, J.; Huang, X.; Luo, L.; Sun, J.; Guo, Q.; Yang, X.; Zhang, C.; Ni, B. The role of p53 in male infertility. Front. Endocrinol. 2024, 15, 1457985. [Google Scholar] [CrossRef] [PubMed]
- Liberal, V.; De, M.M.P.; Henze, M.; Nistal, M.; Reed, S.I. Reduced spermatogonial proliferation and decreased fertility in mice overexpressing cyclin E in spermatogonia. Cell Cycle 2010, 9, 4222–4227. [Google Scholar] [CrossRef] [PubMed]
- Bruter, A.V.; Varlamova, E.A.; Stavskaya, N.I.; Antysheva, Z.G.; Manskikh, V.N.; Tvorogova, A.V.; Korshunova, D.S.; Khamidullina, A.I.; Utkina, M.V.; Bogdanov, V.P. Knockout of cyclin-dependent kinases 8 and 19 leads to depletion of cyclin C and suppresses spermatogenesis and male fertility in mice. Elife 2025, 13, RP96465. [Google Scholar] [CrossRef] [PubMed]
- Dubé, E.; KDufresne, J.; Chan, P.T.; Cyr, D.G. Epidermal growth factor regulateds connexin 43 in the human epididymis: role of gap junctions in azoospermia. Hum. Reprod. 2012, 27, 2285–2296. [Google Scholar] [CrossRef] [PubMed]
- Leroith, D.; Potashnik, G.; Dunn, J.; Spitz, I.M. The exaggerated prolactin response to thyrotropin-releasing hormone and metoclopramide in 1, 2- dibromo -3- chloropropane - induced azoospermia. J. Clin. Endocrinol. Metab. 1981, 52, 38–41. [Google Scholar] [PubMed]
- Campos, L.S.; Decker, L.; Taylor, V.; Skarnes, W. Notch, epidermal growth factor receptor, and beta1- integrin pathways are coordinated in neural stem cells. J. Biol. Chem. 2006, 281, 5300–5309. [Google Scholar] [CrossRef] [PubMed]
- Müller-Pillasch, F.; Wallrapp, C.; Lacher, U.; Friess, H.; Büchler, M.; Adler, G.; Gress, T.M. Identification of a new tumour-associated antigen TM4SF5 and its expression in human cancer. Gene 1998, 208, 25–30. [Google Scholar] [CrossRef] [PubMed]
- Whitmore, T.E.; Peterson, A.; Holzman, T.; Eastham, A.; Amon, L.; McIntosh, M.; Ozinsky, A.; Nelson, P.S.; Martin, D.B. Integrative analysis of N-linked human glycoproteomic data sets reveals PTPRF ectodomain as a novel plasma biomarker candidate for prostate cancer. J. Proteome Res. 2012, 11, 2653–2665. [Google Scholar] [CrossRef] [PubMed]
- Santi, D.; Granata, A.R.; Simoni, M. FSH treatment of male idiopathic infertility improves pregnancy rate: a meta-analysis. Endocr. Connect. 2015, 4, R46–58. [Google Scholar] [CrossRef] [PubMed]
- Rogers, M.B.; Hosler, B.A.; Gudas, L.J. Specific expression of a retinoic acid-regulated zinc finger gene, Rex-1, in preimplantation embryos, trophoblast and spermatocytes. Development 1991, 113, 815–824. [Google Scholar] [CrossRef] [PubMed]
Figure 1.
Heatmap of specific germ cell and Sertoli cell genes in two sets of microarray data. Heatmap results for germ cell-specific genes (y-axis, red) and Sertoli cell-specific genes (y-axis, black). The column refers to testing samples, CT samples were listed in red (x-axis) and the IS samples were listed in black (y-axis). Data are from GSE9210 microarray (left) and GSE25518 microarray (right) (https://www.ncbi.nlm.nih.gov/geo/).
Figure 1.
Heatmap of specific germ cell and Sertoli cell genes in two sets of microarray data. Heatmap results for germ cell-specific genes (y-axis, red) and Sertoli cell-specific genes (y-axis, black). The column refers to testing samples, CT samples were listed in red (x-axis) and the IS samples were listed in black (y-axis). Data are from GSE9210 microarray (left) and GSE25518 microarray (right) (https://www.ncbi.nlm.nih.gov/geo/).
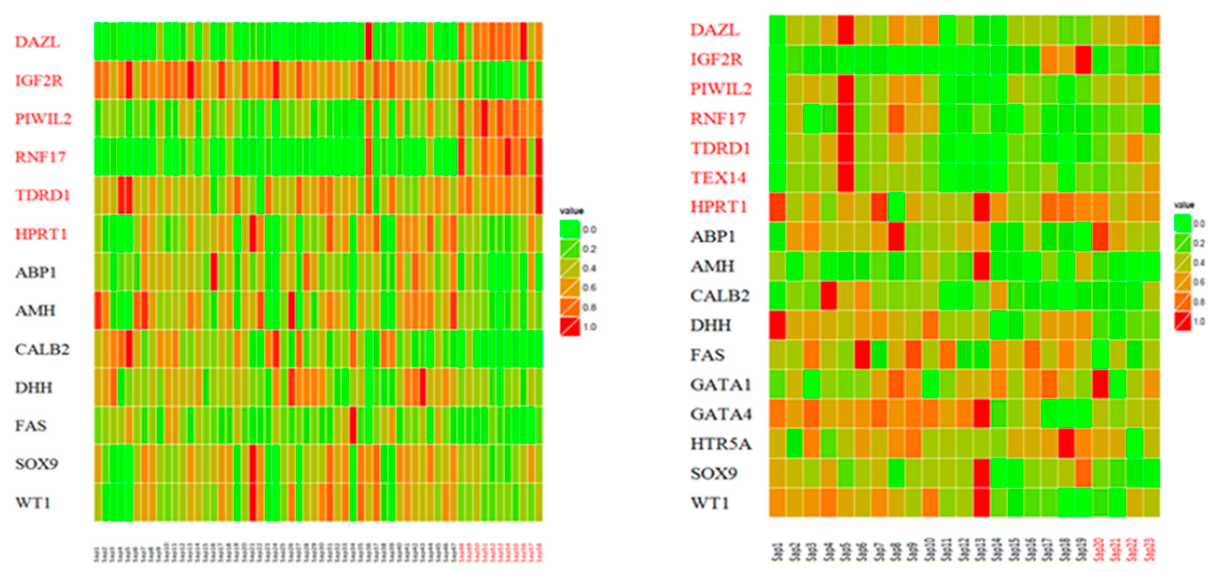

Table 2.
The 9 cellular process pathways with statistically significant differences between the IS and CT groups.
Table 2.
The 9 cellular process pathways with statistically significant differences between the IS and CT groups.
| Pathway Type | Pathway ID | Pathway Name | p-value |
|---|---|---|---|
| Cell Growth and Death | hsa04110 | Cell Cycle | 4.46E-07 |
| Cell Growth and Death | hsa04114 | Oocyte Meiosis | 0.00028 |
| Cell Growth and Death | hsa04115 | p53 Signalling Pathway | 0.00131 |
| Transport and Catabolism | hsa04142 | Lysosome | 0.026797 |
| Transport and Catabolism | hsa04144 | Endocytosis | 0.010227 |
| Transport and Catabolism | hsa04145 | Phagosome | 0.002576 |
| Cell Growth and Death | hsa04210 | Apoptosis | 0.040073 |
| Cell Communication | hsa04510 | Focal Adhesion | 0.038086 |
| Cell Communication | hsa04530 | Tight Junction | 0.024704 |
Table 3.
The gene numbers in each model are produced by the Gephi modularity analysis.
| Model No. | hsa04110 | hsa04114 | hsa04115 | hsa04142 | hsa04144 | hsa04145 | hsa04210 | hsa04510 | hsa04530 | Total | |
|---|---|---|---|---|---|---|---|---|---|---|---|
| mitotic cell cycle progression | oocyte meiosis | P53 signalling pathway | lysosomal processes | endocytosis | phagocytosis | tissue homeostasis | focal adhesion | intramembrane and paracellular diffusion barriers | No. of genes | ||
| 1 | - | - | - | - | - | - | - | - | 41 | 41 | |
| 2 | 7 | 19 | - | - | 9 | 1- | - | 52 | 63 | 121 | |
| 3 | 1 | 3 | 4 | - | 39 | - | 21 | 48 | 5 | 89 | |
| 4 | - | - | 1 | - | 4 | 11 | 1 | 87 | 7 | 89 | |
| 5 | 2 | 9 | 6 | - | - | - | 42 | 7 | - | 52 | |
| 6 | 16 | 25 | 39 | - | - | - | 8 | - | - | 68 | |
| 7 | - | - | - | - | - | 4 | - | - | - | 4 | |
| 8 | - | - | - | - | 1 | 27 | - | - | - | 27 | |
| 9 | - | - | - | - | 17 | 5 | - | - | - | 18 | |
| 10 | - | - | - | - | 17 | - | - | - | - | 17 | |
| 11 | - | - | - | - | 3 | - | - | - | - | 3 | |
| 12 | - | - | - | - | 24 | - | - | - | - | 24 | |
| 13 | - | - | - | - | 3 | 1 | - | - | - | 3 | |
| 14 | - | - | - | 8 | - | - | - | - | - | 8 | |
| 15 | 83 | 55 | 18 | - | 5 | - | 12 | 6 | 3 | 118 | |
| 16 | 15 | - | - | - | - | - | - | - | - | 15 |
Table 4.
The GO clusters that relate gene identity to reproductive or sexual functions (genes in blue are genes that do not have biological experimentation to support this classification).
Table 4.
The GO clusters that relate gene identity to reproductive or sexual functions (genes in blue are genes that do not have biological experimentation to support this classification).
| GO Term | Genes | ||||||||
|---|---|---|---|---|---|---|---|---|---|
| GO:0032504 | EGFR | AKT1 | CCNE1 | MET | PTTG2 | PTTG1 | CCNA1 | ITGB1 | KDR |
| GO:0048609 | EGFR | AKT1 | CCNE1 | MET | PTTG2 | PTTG1 | CCNA1 | ITGB1 | KDR |
| GO:0042698 | EGFR | CCNE1 | KDR | ||||||
| GO:0048511 | EGFR | CCNE1 | KDR | ||||||
| GO:0007276 | AKT1 | PTTG2 | PTTG1 | CCNA1 | ITGB1 | ||||
| GO:0019953 | AKT1 | PTTG2 | PTTG1 | CCNA1 | ITGB1 | ||||
| GO:0003006 | AKT1 | IGF1R | PTTG1 | PDGFRA | KDR | ||||
| GO:0045137 | CCNE1 | PDGFRA | KDR | ||||||
| GO:0007548 | CCNE1 | PDGFRA | KDR |
Disclaimer/Publisher’s Note: The statements, opinions and data contained in all publications are solely those of the individual author(s) and contributor(s) and not of MDPI and/or the editor(s). MDPI and/or the editor(s) disclaim responsibility for any injury to people or property resulting from any ideas, methods, instructions or products referred to in the content. |
© 2026 by the authors. Licensee MDPI, Basel, Switzerland. This article is an open access article distributed under the terms and conditions of the Creative Commons Attribution (CC BY) license (http://creativecommons.org/licenses/by/4.0/).
Copyright: This open access article is published under a Creative Commons CC BY 4.0 license, which permit the free download, distribution, and reuse, provided that the author and preprint are cited in any reuse.