

Submitted:
09 October 2026
Posted:
10 October 2026
You are already at the latest version
Abstract
Triply Periodic Minimal Surface (TPMS)-based Interpenetrating Phase Composites (IPCs) combine two co-continuous solid phases across a smooth, doubly curved interface, providing a multifunctional design space for tailoring mechanical and thermal properties. This study investigates the effective thermo-elastic and thermal-transport behavior of TPMS-based IPCs using two homogenization approaches: Finite Element (FE)-based Representative Unit Cell (RUC) homogenization and Mechanics of Structure Genome (MSG)-based homogenization. Four TPMS topologies – gyroid, diamond (Schwarz D), PMY, and F-Rhombic Dodecahedron (F-RD) – are considered over relative densities ranging from 0.1 to 0.5. Conforming-mesh RUC models are generated using Microgen and analyzed in Abaqus for FE simulations with periodic boundary conditions, and in the in-house CmbsFE code for MSG-based homogenization. The two approaches are assessed for predicting effective elastic properties, coefficients of thermal expansion (CTEs), and thermal conductivities. The study further examines the influence of TPMS topology and relative density on the multifunctional response of two-phase IPCs, supporting the design and optimization of lightweight structural–thermal materials.
Keywords:
interpenetrating phase composites
; triply periodic minimal surfaces
; thermo-elastic homogenization
; Mechanics of Structure Genome
1. Introduction
Lightweight, multifunctional materials are in growing demand across the aerospace, automotive, and energy sectors. Structural components in these sectors increasingly need high specific stiffness together with tailored thermal transport and dimensional stability. Examples include structural heat exchangers, battery thermal-management housings, and precision optomechanical mounts, all of which must combine load-bearing capacity with controlled heat flow and minimal thermal distortion. Architected cellular materials and metamaterials have emerged as a design paradigm for meeting these coupled demands. Their effective properties depend not only on the constituent materials but also on a freely tunable unit-cell topology. This gives a much larger design space than conventional stochastic foams or fiber-reinforced composites offer [1,2,3]. However, realizing this potential requires predictive, physically grounded models. These models must resolve the coupled elastic and thermal response of such architectures across the topology and density ranges now capable of being manufactured through Additive Manufacturing (AM).
Among architected topologies, those based on TPMS are a particularly promising class. Their smooth, doubly curved, non-self-intersecting interfaces minimize local stress and heat-flux concentrations relative to strut-based lattices. TPMS geometries were first identified mathematically by Schwarz [4] and Neovius [5] in the nineteenth century. Schoen [6] later classified these surfaces, establishing the gyroid, diamond, and further surfaces now in widespread engineering use. The same morphologies recur in biological and self-assembled systems, from butterfly-wing scales to block-copolymer mesophases, suggesting that evolutionary and thermodynamic optimization alike favor them as load- and transport-bearing interfaces [7]. TPMS RUCs are represented implicitly through trigonometric level-set functions. They can be instantiated as either sheet or solid (network) architectures and continuously tuned in relative density, giving a single geometric framework that spans a wide range of stiffness, energy-absorption, and multifunctional design targets [8]. This tunability is not merely empirical. For the equal-volume-fraction Schwarz P and D surfaces, Jung and Torquato [9] showed that the bi-continuous morphology is simultaneously near-optimal for fluid and heat/electrical transport and, by geometric analogy, for elastic stiffness under a compliant second phase. This provides a rigorous physical basis for TPMS interfaces as natural candidates for multifunctional composite design, rather than an arbitrary geometric choice.
This last observation motivates a natural evolution in TPMS design. Single-phase (sheet or solid) TPMS lattices leave one region void. TPMS-based IPCs instead fill both regions defined by the TPMS level set, with distinct, mutually continuous solid phases. In particulate or short-fiber composites, the reinforcing phase is discontinuous and load transfer relies on interfacial shear. An IPC is different: each phase is independently self-supporting and load-bearing, a topological feature already recognized in early micromechanical treatments of interpenetrating multiphase media [10]. When the TPMS surface itself defines the phase interface, this co-continuity yields smooth, low-concentration load paths between phases. It also improves damage tolerance through crack deflection and delocalization at the curved interface. It also gives access to property combinations that are difficult to realize with either constituent alone, for example, simultaneously high stiffness and high toughness, or tailored stiffness-conductivity pairings [11,12]. Recent work has extended this concept toward increasingly application-relevant configurations. These include spinodal and stochastic TPMS-like topologies with tunable strength-toughness trade-offs [13], and centimeter-scale carbon- and polymer-based architected IPCs. In the latter, matrix infiltration was shown to distribute stress effectively and delocalize failure, achieving specific energy-absorption levels competitive with wound fiber tubes [14]. A recent comprehensive review consolidates this rapidly growing body of work on TPMS-based IPCs, spanning structural, thermal, and even piezoelectric functionalities. It also highlights that quantitative, method-verified predictions of their coupled thermo-elastic and transport properties remain comparatively scarce [15].
Reliable exploitation of this design space requires efficient, accurate homogenization frameworks. These frameworks must predict the effective properties of a RUC as functions of topology and relative density. The dominant benchmark approach is Finite-Element (FE) homogenization of the RUC under Periodic Boundary Conditions (PBCs). It has been applied extensively to TPMS lattices to predict effective elastic moduli [16,17,18]. Complementary numerical strategies include voxel-based asymptotic homogenization [19] and Fast-Fourier-Transform-based homogenization, the latter achieving comparable accuracy at substantially reduced computational cost for periodic microstructures [20]. FE-RUC homogenization is accurate, but it requires a distinct system factorization for every independent load case, typically six for the full elastic stiffness tensor alone. Its cost therefore scales unfavorably when multiple physics and many topology/density combinations must be swept, as is the case for the multifunctional design studies motivating this work.
The MSG offers a computationally efficient alternative. It was developed by Yu and co-workers from its predecessor, the Variational Asymptotic Method for Unit Cell Homogenization (VAMUCH) [21], which our group has also applied and extended [22,23]. MSG casts homogenization as a single variational statement, solved once per physics on the Structure Genome (SG). For three-dimensionally periodic media, this recovers the same effective properties as RUC-based FE analysis, while requiring only inexpensive back-substitutions for each additional load case [24,25,26]. The theoretical equivalence and comparative accuracy of the two approaches were established for single-phase TPMS lattices in our companion study [27]. That work built on earlier applications of MSG to the effective elastic and thermal-conductivity properties of particulate and nano-reinforced composites [28,29]. Practical FE-RUC implementations, in turn, rely on established periodic-boundary-condition and finite-element-analysis frameworks for composite materials [30,31].
The elastic homogenization of TPMS architectures is now comparatively well established. Their thermal characterization is not: both thermal expansion and thermal conductivity have received considerably less systematic attention, despite being equally central to the multifunctional applications motivating this work. Existing studies of TPMS thermal conductivity show that effective conductivity is governed primarily by relative density and topology. This has been demonstrated for pure TPMS lattices manufactured by laser powder bed fusion [32], TPMS-structured phase-change materials for battery thermal management [33], ceramic TPMS lattices [34], and TPMS-based porous media more generally [35]. A smaller body of work extends this analysis to two-phase TPMS foams and IPCs, where effective conductivity and elastic moduli depend jointly on topology and phase contrast [36,37]. The underlying MSG-based thermal-conductivity homogenization framework has itself been established for composite materials with general interfacial conditions, including imperfect interfaces [29]. The CTE of TPMS-based IPCs is still markedly less explored. To our knowledge, only a handful of studies address it explicitly. The most notable is a numerical investigation of the combined thermo-elastic response of gyroid-based composites, including the role of phase-modulus contrast and Poisson’s ratio [38]. To the best of our knowledge, no study to date has jointly addressed effective elastic properties, CTE, and thermal conductivity for the same set of TPMS-based IPC topologies. Still less has any study compared FE-RUC and MSG predictions of all three property groups over a broad relative-density range.
This gap is significant. TPMS lattices, TPMS-based IPCs, FE-RUC homogenization, and the MSG/VAMUCH framework have each been well studied individually. Yet no systematic investigation has compared FE-RUC and MSG predictions of effective elastic properties, CTE, and thermal conductivity for multiple TPMS-based IPC topologies over a broad range of relative densities. Closing this gap matters for two reasons. First, MSG offers an intrinsic computational advantage for multi-physics, multi-configuration design studies; validating it against FE-RUC would establish it as a lower-cost substitute for the multifunctional design of TPMS-based IPCs. Second, it is a prerequisite for understanding how topology and relative density govern the coupled stiffness-CTE-conductivity trade-offs relevant to lightweight thermal-management and dimensionally stable structural applications.
To address this gap, we develop two-phase RUC models with conforming meshes for four TPMS-based IPC topologies: gyroid, diamond (Schwarz D), PMY, and F-Rhombic Dodecahedron (F-RD). Relative densities ranging from to are considered. For each configuration, the effective elastic properties, coefficients of thermal expansion, and thermal conductivities are determined using two homogenization approaches applied to the same discretization: FE-RUC in Abaqus, with periodic boundary conditions imposed through the Abaqus Micromechanics Plugin [30,39], and MSG/VAMUCH through the in-house CmbsFE implementation. The MSG predictions are then quantitatively assessed against the FE-RUC results for all three groups of effective properties. In doing so, the present work extends the purely elastic, single-phase comparison reported in our companion study [27] to the thermo-elastic and thermal-transport behaviour of two-phase IPCs. Finally, the combined influence of topology and relative density on stiffness, thermal expansion, and conductivity is examined to identify topology-dependent trade-offs relevant to the design of lightweight structures with coupled mechanical and thermal requirements.
The remainder of the paper is organized as follows. Section 2 describes the generation of the TPMS-based IPC RUCs and the FE- and MSG-based homogenization procedures. Section 3 presents and discusses the resulting effective properties, including validation against the literature and a quantitative comparison of the two homogenization approaches. Section 4 presents concluding remarks.
2. Methodology
This section describes the procedures used to generate the TPMS-based IPC representative unit cells, the constituent phase properties, and the two homogenization strategies compared in this work, namely FE-based RUC homogenization and MSG-based homogenization. For each strategy, the effective elastic properties, CTEs, and thermal conductivities are obtained following analogous, physically consistent procedures, so that the two approaches can be compared on an equal footing.
2.1. Generation of TPMS-Based Interpenetrating Phase Composite Unit Cells
The TPMS-based IPC microstructures are generated with the open-source Python library Microgen [40], following the same modeling workflow adopted in the companion study on single-phase TPMS architectures [27]. Four TPMS topologies are investigated, matching those considered in the companion study: the gyroid, the diamond (Schwarz D) surface, the PMY surface, and the F-Rhombic Dodecahedron (F-RD, Schoen F-RD) surface. Each topology is implicitly defined, within a cubic cell, by a level-set function . In Microgen, this function is expressed in terms of dimensionless coordinates (), where are the physical Cartesian coordinates of a point within the cubic RUC of edge length L. This is the same local position vector used to describe the RUC/SG domain throughout Section 2.3 and Section 2.4:
each topology being generated, in the RUC, as the zero level set of the corresponding function. A level-set sampling resolution of 25 was used to generate all RUCs, except for the F-RD topology at . That case required a resolution of 40. F-RD has a strongly asymmetric level-set range, unlike the other three topologies. At low relative density, this makes the solid network sensitive to under-resolution: the coarser sampling produced a mesh with a higher actual volume fraction than intended. The finer resolution corrects this.
This same configuration, F-RD at , required a second exception. All analyses in this study were run on a workstation with an Intel Core i7-8665U CPU and 48 GB of RAM. Its quadratic-element system exceeded the memory available to the MUMPS direct solver used by CmbsFE, even on this workstation. The MSG analysis for this configuration therefore used linear (first-order) tetrahedral elements, rather than the quadratic elements used elsewhere in this study. For a fair comparison, the FE analysis for this same configuration was also rerun with linear elements. Every other topology-density combination in this study uses quadratic elements for both FE and MSG. Section 3.3 discusses the effect on FE-MSG agreement.
Unlike the single-phase (sheet or solid) TPMS lattices considered previously [27], the microstructures investigated here are two-phase IPCs. For a given topology, the corresponding level-set function of Eqs. (1)–() partitions the cubic RUC of volume V into two fully interpenetrating, co-continuous solid phases. These two phases jointly fill the entire RUC volume, with no void space. The solid TPMS network (phase 1) is generated as a Microgen Tpms object with a prescribed relative density , where is the volume enclosed by the TPMS solid region and V is the volume of the cubic RUC bounding box. This matches the terminology of the companion study [27] and Microgen’s own density parameter; is varied in the range – for each of the four topologies. The complementary phase (phase 2, denoted the “matrix” phase) occupies the remaining volume , so that . The two solid, conforming phases are obtained using the Boolean cutting procedure implemented in Microgen’s cut_phases function. This function subtracts the TPMS solid region from the cubic box and returns two topologically complementary, non-overlapping solids, sharing a common internal interface coincident with the TPMS level-set surface.
Figure 1 shows the solid TPMS network of each of the four topologies, extracted at a representative relative density () directly from the level-set functions of Eqs. (1)–(). The color code (gyroid, diamond, PMY, F-RD) is used consistently for these four topologies throughout the remainder of this paper. In the two-phase IPC, the complementary matrix phase occupies the remaining volume of each unit cell, sharing the smooth, doubly curved interface visible in Figure 1.
A conforming, periodic tetrahedral mesh of the two-phase RUC is subsequently generated with Gmsh [41], through Microgen’s mesh_periodic utility. The two-phase geometry is first imported into Gmsh via the OpenCASCADE kernel. The two phases are meshed as separate solids sharing a common interface, so a Boolean fragment operation is applied next. This operation shares (rather than duplicates) the interface faces, edges, and nodes between the two phases, ensuring a conforming mesh across the phase boundary. Periodicity is then enforced geometrically, prior to meshing. For each of the three RUC axes, boundary faces on the negative side of the cube are paired with their corresponding faces on the positive side, identified by matching bounding boxes offset by the RUC edge length. Each pair is declared periodic to Gmsh via an affine (translational) transformation. This constrains the mesher to generate identical node distributions on corresponding master and slave faces. The volume mesh is then generated for a prescribed target element size, using tetrahedral elements optimized with Netgen [42]. The element order is subsequently elevated to obtain quadratic (second-order) tetrahedral elements, consistent with the meshing strategy validated in the companion elastic study [27]. One exception applies, as noted above: F-RD at uses linear (first-order) elements for both FE and MSG. As a final safeguard, the periodicity of the generated mesh is verified numerically: for each pair of opposite faces, the in-plane coordinates of corresponding nodes are compared to within a specified tolerance. The same periodic mesh is exported in two formats from a single geometry-and-meshing script: a Gmsh .msh file for the MSG-based analysis with CmbsFE (Section 2.4), and an Abaqus .inp file for the FE-based analysis (Section 2.3). Both homogenization approaches therefore operate on an identical discretization of the RUC, so differences between the two sets of predictions cannot be attributed to differences in geometry or mesh discretization. Figure 2 shows the conforming, periodic two-phase meshes for the four TPMS-based IPC topologies at . The mesh resolution adopted for the FE analyses is justified by the convergence study presented in Section 3.1.
2.2. Constituent Phase Properties
Both constituent phases are modeled as homogeneous, isotropic, linear thermo-elastic conducting solids. Each is fully characterized by five properties: a Young’s modulus E, a Poisson’s ratio , a coefficient of thermal expansion , a thermal conductivity , and a (mass-)specific heat capacity c. Both phases are treated as generic engineering materials. They are distinguished only by their elastic-modulus, CTE, and thermal-conductivity contrasts, not as specific, named polymer, metal, or ceramic constituents. The elastic moduli, Poisson’s ratios, and CTEs follow the application example [43], itself based on the gyroid IPC studied by Chawla and Kiran [38]. Chawla and Kiran [38] report an elastic-modulus ratio of 20 between the two phases. On this basis, the COMSOL example [43] assumes representative values of 200 GPa and 10 GPa for the TPMS and matrix phases, respectively, together with a common Poisson’s ratio of . The corresponding CTEs are 1/K (TPMS phase) and 1/K (matrix phase). Neither [38] nor the COMSOL example [43] reports a thermal conductivity or specific heat capacity, since both are purely elastic/thermo-elastic studies. Representative thermal conductivities of W/(m·K) (TPMS phase) and W/(m·K) (matrix phase) are therefore assigned for the present thermal-conductivity study, together with a common specific heat capacity of 1650 J/(kg·K) for both phases. The specific heat capacity is required by the CmbsFE/MSG solver formulation of Section 2.4.3. However, only steady-state (time-independent) problems are considered here, so its value does not influence any of the effective properties reported in this work. The resulting properties are summarized in Table 1.
The matrix and TPMS phases are assigned different isotropic thermal conductivities, with a contrast ratio ; the anisotropy of the effective conductivity tensor of the IPC therefore reflects the combined effect of the geometric arrangement of the two phases (topology and relative density) and this conductivity contrast, consistent with standard two-phase conductivity homogenization.
2.3. Finite-Element-Based Homogenization
The FE-based homogenization of the TPMS-based IPC RUCs is performed in Abaqus, using the Abaqus Micromechanics Plugin [30,31,39]. It follows the general RUC homogenization framework validated for single-phase TPMS lattices in [27]. Here, this framework is extended to the coupled thermal-expansion and heat-conduction problems, using the numerical procedures described in [44].
2.3.1. Periodic Boundary Conditions and Macro-Homogeneity
For a two-phase RUC of volume V, let , and denote, respectively, the local (position-dependent) stiffness, CTE, and thermal-conductivity tensors at a point within the RUC. Each phase is itself homogeneous and isotropic (Section 2.2), so these piecewise-constant fields take the matrix-phase properties of Table 1 when lies in the matrix phase, and the TPMS-phase properties when lies in the TPMS phase. Throughout this section, a superposed asterisk (e.g., ) denotes an effective (homogenized) property of the whole IPC. An overbar (e.g., ) denotes a macroscopic (volume-averaged) field. Unmarked symbols (e.g., ) denote local fields that vary from point to point within the RUC. The local displacement field at a point within the RUC is decomposed into a macroscopic, affine part and a periodic fluctuation [27]:
where is the prescribed macroscopic strain. Analogously, the local temperature field (with a stress-free reference temperature) is decomposed as
where is the prescribed macroscopic temperature gradient and w is a periodic temperature fluctuation. Periodic boundary conditions require that and w take equal values at corresponding points on opposite faces of the RUC [27,44], i.e.,
together with anti-periodicity of the corresponding tractions and normal heat fluxes on opposite faces. In Abaqus, Eq. (8) is implemented through multi-point constraint equations, linking the degrees of freedom of matching node pairs on opposite RUC faces [27,30,44]. This is enabled by the conforming periodic mesh described in Section 2.1. PBCs are used throughout this study since among the classical boundary-condition choices (kinematic-uniform, static-uniform, and periodic), they are widely recognized as giving the most accurate estimate of the effective properties for a given RUC size. Also, they satisfy the Hill–Mandel macro-homogeneity condition of equivalent strain energy (respectively, thermal dissipation) between the heterogeneous RUC and its homogenized counterpart [27,44].
2.3.2. Effective Elastic Properties
The effective elastic response of the homogenized IPC is described by the generalized Hooke’s law, , where and denote the volume-averaged (macroscopic) stress and strain,
and is the sought effective stiffness tensor of the IPC. Following [27], the full effective stiffness matrix is populated column-by-column from six independent linear-elastic analyses. In each analysis, a single component of the macroscopic strain tensor is prescribed to unity through the PBCs of Eq. (8), while all other components are set to zero. This gives three axial load cases (, , ) and three shear load cases (, , ). For each load case, the resulting local stress field , obtained from a static analysis of the two-phase RUC, is volume-averaged according to Eq. (9). This yields the corresponding column of , expressed in contracted (Voigt) notation as the matrix . The standard index pairs map the tensor indices as , , , , , . Only this direct, unit-strain extraction procedure is used in the present study; the least-squares regression alternative of [44], relevant for more general, non-isolating strain states, is not required here. The effective compliance matrix is obtained by inversion, . The nine independent engineering constants of the (generally orthotropic) homogenized IPC are then recovered from the components of [44]: the effective Young’s moduli , shear moduli , and Poisson’s ratios .
2.3.3. Effective Coefficients of Thermal Expansion
The effective CTE tensor is obtained following the numerical procedure of [44], based on the Duhamel–Neumann thermo-elastic constitutive law relating the macroscopic stress to the macroscopic total strain and a uniform temperature change :
where is the sought effective CTE tensor. A single thermal-expansion analysis is performed. The PBCs of Eq. (8) are applied with a zero prescribed macroscopic strain, , while a uniform temperature change is imposed over the entire RUC. Under these conditions, Eq. (10) reduces, in contracted notation, to . The effective CTE vector is then recovered from the homogenized thermal stresses and the previously computed effective compliance matrix (Section 2.3.2) as
2.3.4. Effective Thermal Conductivity
The effective thermal conductivity tensor is obtained from a steady-state heat-conduction analysis of the RUC. This is based on Fourier’s law, , and the local energy balance in the absence of internal heat generation [44]. Three thermal load cases are considered. The macroscopic temperature gradient is prescribed through the PBCs of Eq. (8), along each of the three orthogonal directions in turn: (), where is the magnitude of the imposed temperature difference across the RUC. For each load case, the resulting local heat flux and temperature gradient fields are volume-averaged,
The effective conductivity tensor is then obtained from the homogenized Fourier’s law, , applied to the three load cases simultaneously:
2.4. Mechanics of Structure Genome-Based Homogenization
The MSG-based homogenization is performed with CmbsFE, the in-house C++ implementation of the MSG framework. CmbsFE is built on GetFEM [45] for finite element assembly, MUMPS [46,47] for direct linear-system solution, and MuParser [48] for symbolic expression parsing. MUMPS is run in serial mode. CmbsFE was previously used for the effective elastic properties of nano-composites and for the effective thermal conductivity of composites with imperfect interfaces [28,29], and was extended to TPMS architectures in the companion elastic study [27]. MSG is a unified, semi-analytical multiscale constitutive theory [24,25], based on the Structure Genome concept: the smallest mathematical building block of a material or structure that contains its complete constitutive information. For a material with three-dimensional heterogeneity, such as the TPMS-based IPCs considered here, the SG coincides geometrically with the RUC used for the FE analysis of Section 2.3. The same periodic mesh (Section 2.1) is used for both approaches [27].
2.4.1. Variational Foundation
MSG constructs the homogenized (effective) model by minimizing, over the SG, the loss of information, expressed, for a linear thermo-elastic conducting material, in terms of strain energy and thermal “energy”, between the original heterogeneous body and the homogenized body [24,26,27]. The kinematic and thermal fields within the SG are decomposed, analogously to Eqs. (6)–(7), as
Here, and denote, respectively, the macroscopic (structural-scale) and local (SG-scale) position vectors, distinct from the dimensionless level-set coordinates of Section 2.1; coincides with the local RUC position used in Section 2.3. and are the volume-averaged, homogenized displacement and temperature fields. and w are unknown, periodic fluctuation functions satisfying and [27,49]. The corresponding local strain and temperature-gradient fields are
where the comma denotes differentiation with respect to the local (micro) coordinates, and parentheses denote the symmetric part of the gradient.
2.4.2. Effective Elastic Properties
For the purely mechanical problem, the strain-energy functional to be minimized over the SG, subject to the periodicity and zero-average constraints on , is [26,27]
whose Euler–Lagrange stationarity condition yields the governing equation for the fluctuation function,
with periodic on the SG boundary. Equation (17) is solved numerically via finite element discretization of the SG in CmbsFE. The solution is linear in the macroscopic strain, , where is an influence-function tensor relating the macroscopic strains to the local displacement fluctuations. The effective stiffness tensor is then obtained by volume-averaging the strain-energy density [26,27]:
2.4.3. Effective Coefficients of Thermal Expansion
For the coupled thermo-elastic problem, the strain-energy functional of Eq. (16) is extended to include the local thermal-stress coupling and thermal-storage terms, following the two-step MSG thermo-elastic homogenization of [49]:
where is the local thermal-stress coefficient tensor of a constituent phase, related to the local CTE and stiffness by . is the local specific heat per unit volume at constant volume: a volumetric quantity, distinct from the mass-specific heat capacity c of Table 1. The two would coincide only if scaled by a mass density, which is not required elsewhere in this study and hence not assigned a value. Discretizing the fluctuation functions and w over the SG mesh, and minimizing Eq. (20), yields a linear system for the nodal fluctuation unknowns. This system is linear in both and [49]. Substituting the solution back into Eq. (20) gives the homogenized strain-energy density in the reduced form
where is the effective stiffness matrix of Eq. (18), is the effective thermal-stress coefficient vector, and is the effective specific heat. The effective CTE vector then follows directly as [49]
2.4.4. Effective Thermal Conductivity
For the heat-conduction problem, MSG minimizes an analogous thermal “energy” functional over the SG [29,50]:
subject to and periodicity of w on the SG boundary. The temperature fluctuation is discretized over the SG finite element mesh as
where is the matrix of standard finite element shape functions defined over the SG mesh, of the same type as used for the FE analysis of Section 2.3. is the vector of unknown nodal values of the fluctuation function w. Imposing stationarity of Eq. (23) with respect to , subject to Eq. (24), yields a linear system of the form . Here is the SG conductance matrix. and are further SG operator matrices, assembled from the local conductivity tensors of the two phases and the finite element shape functions of the SG mesh. is the gradient (differential) operator matrix relating nodal shape-function values to their spatial derivatives over the SG [50]. The solution of this linear system is linear in the macroscopic temperature gradient, , obtained from a single factorization of . Substituting back into Eq. (23) gives the reduced thermal energy , from which the effective thermal conductivity tensor is identified as [50]
The local temperature gradient and heat-flux fields within the SG can subsequently be recovered by dehomogenization [50]:
2.5. Comparison Framework Between the FE and MSG Approaches
Both approaches solve, over the same RUC/SG domain and the same periodic mesh (Section 2.1), governing equations that are formally equivalent for a three-dimensional, periodic heterogeneous medium [26]. The FE displacement- and temperature-based boundary value problems of Section 2.3, and the MSG variational statements of Section 2.4, reduce to the same Euler–Lagrange equations when periodic boundary conditions are used. In the absence of numerical discretization and solver error, the two methods are therefore expected to yield identical effective properties and local fields. They differ, however, in computational implementation. The FE-based approach requires one full system factorization and solve for each of the ten load cases considered in this study: six for the elastic problem, one for the CTE problem, and three for the thermal-conductivity problem. This is because the assembled system differs between mechanical and thermal degrees of freedom, and between the individual load cases under PBCs [26,27]. The MSG-based approach, by contrast, requires only a single factorization of the SG system matrix for each physics (mechanical or thermal), followed by multiple, computationally inexpensive back-substitutions for the different load cases [26,27,50]. This intrinsic computational advantage was already reported for the purely elastic problem in [27]. It is expected to be more pronounced in the present multifunctional study, since three separate sets of effective properties (elastic, CTE, and thermal conductivity) are extracted for every topology and relative density considered.
3. Results and Discussion
This section first establishes the adequacy of the mesh resolution used in the numerical analyses (Section 3.1). The FE and MSG frameworks are then validated against previously published single-phase TPMS results (Section 3.2). Next, the effective elastic properties, coefficients of thermal expansion, and thermal conductivities of the two-phase IPCs are presented property-by-property (Section 3.3, Section 3.4 and Section 3.5), followed by a joint discussion of their multifunctional response (Section 3.6) and a quantitative comparison of the two homogenization approaches (Section 3.7).
3.1. Mesh Convergence Study
Before validating the homogenization frameworks and presenting the two-phase IPC results, a mesh convergence study was performed for the gyroid topology at the lowest and highest relative densities considered, and . The target element edge length was varied while the level-set sampling resolution used to generate the TPMS surface was kept fixed. For each mesh, the effective axial Young’s modulus , coefficient of thermal expansion , and thermal conductivity were evaluated using the FE-based RUC procedure described in Section 2.3.
Table 2 and Table 3 show that the predicted properties converge rapidly at both relative densities. For , reducing the target element edge length from 10 mm to 3 mm changes , , and by less than , , and , respectively. The corresponding changes at are below , , and , respectively.
Based on these results, a target element edge length of mm was selected for the analyses reported in this study. For a 100 mm unit cell, this corresponds to approximately elements at and elements at . The selected mesh agrees with the finest mesh to within for all three effective properties at both relative densities, while maintaining a computational cost suitable for the full set of topology–density configurations.
3.2. Validation of the FE and MSG Frameworks
Before presenting the new two-phase IPC results, the FE and MSG homogenization procedures of Section 2 are validated against two previously published reference cases. This uses the same RUC/SG generation, meshing, and solution workflow, applied here to the single-phase (bulk-material) limit of the gyroid and diamond topologies, following the validation strategy adopted in the companion elastic study [27]. The two reference cases are the titanium gyroid lattice of Refai et al. [16] (, bulk properties GPa, GPa, ), and the diamond lattice of Zhang et al. [18] (, bulk properties GPa, GPa, ); the latter includes both a numerical (FEM) and two experimental measurements (EXP). Table 4 compares the effective properties obtained in this study with these literature values.
Both the FE and MSG predictions agree with the gyroid reference of Refai et al. [16] to within , and with the diamond FEM reference of Zhang et al. [18] to within . The largest deviation, , is against Zhang et al.’s first experimental measurement; this is consistent with the level of numerical-experimental scatter reported by the original authors. These deviations are consistent with, and in fact tighter than, those reported for the same validation cases in the companion elastic study [27]. This confirms that the FE and MSG frameworks employed here reproduce established literature results, before being applied to the new two-phase IPC configurations discussed below.
3.3. Effective Elastic Properties
Figure 3 presents the effective axial Young’s modulus , shear modulus , and Poisson’s ratio of the four TPMS-based IPC topologies as a function of relative density , predicted by the FE and MSG approaches.
Table 5 reports the numerical values underlying Figure 3, for all four topologies and the full relative-density range investigated.
For all four topologies, and increase monotonically with relative density. At , ranges from about to GPa across the four topologies. At , it ranges from about 62 to 76 GPa. This increase is consistent with the growing volume fraction of the stiffer TPMS phase ( GPa), relative to the compliant matrix phase ( GPa, Table 1). The F-RD topology is the stiffest at every relative density investigated. At , F-RD leads by about over the softest topologies, gyroid and PMY. This gap widens steadily with relative density, reaching about at . The gyroid topology is consistently the most compliant. Diamond and PMY fall between gyroid and F-RD, with their relative ranking varying with . The effective Poisson’s ratio decreases with increasing relative density for all four topologies, from – at towards – at . This reflects the progressively smaller influence of the compliant, higher-Poisson’s-ratio matrix phase, as the stiffer TPMS network comes to dominate the load path. The same qualitative trend was reported for single-phase TPMS lattices in the companion study [27].
Only the axial components , and are shown in Figure 3. Across all four topologies, all five relative densities, and both homogenization methods, the remaining tensor components differ from their axial counterparts by at most (Young’s modulus), (shear modulus), and (Poisson’s ratio). This confirms that the effective elastic response of all four TPMS-based IPCs remains quasi-isotropic (more precisely, cubic-symmetric, consistent with the cubic point-group symmetry of the underlying TPMS unit cells) over the density range investigated, as already observed for the corresponding single-phase lattices in [27].
3.4. Effective Coefficients of Thermal Expansion
Figure 4 presents the effective axial CTE as a function of relative density.
Table 6 reports the numerical values underlying Figure 4, for all four topologies and the full relative-density range investigated.
The effective CTE decreases monotonically with increasing relative density for all four topologies. At , ranges from about to /K across the four topologies. At , it ranges from about to /K. This decrease occurs because the low-CTE TPMS phase (/K) increasingly constrains the thermal expansion of the high-CTE matrix phase (/K). The reduction is markedly stronger than a rule-of-mixtures estimate would suggest. For example, at , a Voigt-type volume average gives /K, roughly – the values in Figure 4. This reflects the elastic-constraint (Turner-type) mechanism inherent to the Duhamel–Neumann formulation of Section 2.3.3: the stiffer TPMS network suppresses the free thermal expansion of the compliant matrix, well beyond what a volume-weighted average would predict. Unlike the elastic properties, no single topology has the lowest CTE across the whole density range. Diamond has the lowest CTE at and . PMY takes over at and . F-RD has the lowest CTE only at , where it is also the stiffest topology (Section 3.3). This shifting ranking shows that the CTE-stiffness relationship is not a simple, universal trend across topologies. It depends on the specific network geometry at each relative density.
3.5. Effective Thermal Conductivity
Figure 5 presents the effective axial thermal conductivity as a function of relative density.
Table 7 reports the numerical values underlying Figure 5, for all four topologies and the full relative-density range investigated.
The effective conductivity decreases monotonically with relative density for all four topologies. At , ranges from about to W/(m·K) across the four topologies: a narrow spread of less than . At , the spread widens to about W/(m·K). This decrease occurs as the low-conductivity TPMS phase ( W/(m·K)) progressively displaces the higher-conductivity matrix phase ( W/(m·K)). At , the predicted values for all four topologies fall within the Hashin–Shtrikman bounds for a two-phase isotropic conductor of the same constituent conductivities and volume fractions (, W/(m·K)). This provides an additional, physics-based consistency check on the conductivity homogenization procedure, beyond the mesh convergence study of Table 2. As with the CTE, no single topology has the lowest conductivity across the whole density range. Diamond is lowest at ; PMY is lowest at ; F-RD is lowest only at , mirroring the CTE ranking of Section 3.4.
3.6. Cross-Property Discussion
Figure 3, Figure 4 and Figure 5 reveal a consistent multifunctional trade-off with density. Increasing relative density raises stiffness. At the same time, it lowers both CTE and thermal conductivity. All three effective properties are governed by the same underlying competition: the stiff, low-CTE, low-conductivity TPMS phase against the compliant, high-CTE, higher-conductivity matrix phase. The four topologies respond to this trade-off differently. Stiffness ranking is stable with density: gyroid is the most compliant topology, and F-RD is the stiffest, at every relative density investigated. CTE and thermal conductivity rankings are not stable. Diamond has the lowest CTE and conductivity at low relative density. PMY takes over at intermediate density. F-RD only becomes the lowest-CTE, lowest-conductivity topology at , where it is also the stiffest. At that density, F-RD combines the best stiffness, CTE, and conductivity of the four topologies simultaneously. At lower densities, the stiffest topology and the best thermal-transport topology are not the same. From a design standpoint, this has a direct implication: at low relative density, a designer should choose diamond for the lowest thermal expansion and conductivity, or F-RD for the highest stiffness; a single topology cannot deliver both simultaneously. At high relative density, F-RD is the clear choice: it dominates all three properties at once, at low mass. The gyroid topology, with its low stiffness and comparatively strong thermal transport at high density, remains preferable where higher thermal conductivity is the priority, such as in heat-exchanger applications.
3.7. Comparison Between the FE and MSG Approaches
Figure 6 presents parity plots comparing the FE- and MSG-predicted effective Young’s modulus, CTE, and thermal conductivity for all four topologies and all five relative densities considered.
All data points lie close to the line across the full range of topologies, relative densities, and properties, confirming the close agreement between the two homogenization approaches anticipated on theoretical grounds in Section 2.5. Table 8 summarizes the relative error between the MSG and FE predictions, , for the representative axial elastic modulus, shear modulus, Poisson’s ratio, CTE, and thermal conductivity. Values are maximized over the five relative densities for each topology.
The maximum relative error between the two approaches is below for the elastic properties, for the CTE, and for the thermal conductivity, across all four topologies and the full relative-density range investigated. This level of agreement is consistent with that reported for the purely elastic, single-phase TPMS lattices in the companion study [27], and with the theoretical equivalence of the two formulations established in Section 2.5. The largest discrepancies are observed for the elastic properties of the gyroid topology and for the CTE of the PMY topology. These differences are mesh-independent (Table 2) and consistent with the validation-level agreement of Section 3.2. They are attributed to the differing numerical discretizations underlying the FE (Abaqus, six-load-case direct extraction) and MSG (CmbsFE, single-factorization variational) solution procedures, rather than to a methodological inconsistency between the two frameworks. The F-RD topology at shows the closest agreement of the entire study (Table 8). This is the only configuration in which both FE and MSG use the same linear element order, as noted in Section 2.1. Its tight agreement supports the view that most of the small remaining differences, elsewhere in the study, stem from the different solution procedures, rather than from the geometry or mesh itself.
4. Conclusions
This study has compared FE-based and MSG-based homogenization for predicting the effective elastic properties, coefficients of thermal expansion (CTE), and thermal conductivities of TPMS-based interpenetrating phase composites (IPCs). Four topologies (gyroid, diamond, PMY, and F-Rhombic Dodecahedron (F-RD)) were investigated over relative densities from to . Conforming-mesh RUC models were analyzed identically by both approaches.
Both frameworks were validated against published literature results for single-phase TPMS lattices, with predictions agreeing to within . This confirms that the homogenization procedures developed here reproduce established results before being extended to the new two-phase IPC configurations. All four IPC topologies exhibit a consistent multifunctional trade-off with density. Increasing relative density raises stiffness. It also reduces both CTE and thermal conductivity. All three properties are governed by the same competition between the stiff, low-CTE, low-conductivity TPMS phase and the compliant, high-CTE, higher-conductivity matrix phase. The F-RD topology is the stiffest of the four at every relative density studied. It combines the lowest CTE and lowest conductivity only at the highest relative density, , where it is the clear multifunctional choice. At lower relative densities, diamond and PMY offer lower CTE and conductivity than F-RD, even though F-RD remains stiffer. Topology selection therefore depends on both the target relative density and the property being prioritized. MSG predictions agree with FE-RUC to within for elastic properties, for CTE, and for thermal conductivity, across all topologies and densities. MSG also has an intrinsic computational advantage: a single system factorization per physics, rather than one per load case. Together, this level of agreement and this efficiency support the use of MSG as a validated, lower-cost substitute for FE-RUC homogenization in multifunctional design studies of TPMS-based IPCs.
Future work could extend this framework to additional TPMS topologies and volume-fraction combinations, incorporate nonlinear or temperature-dependent constituent behavior, and experimentally validate the predicted thermo-elastic and transport properties of the two-phase IPC configurations considered here.
Author Contributions
Conceptualization, Y.K., S.M. and L.B.; methodology, Y.K., S.M. and L.B.; software, Y.K.; validation, L.K., J.Y., J.G.-G. and G.G.; formal analysis, J.Y., J.G.-G. and G.G.; investigation, Y.K., S.M., L.B., J.Y., J.G.-G. and G.G.; resources, L.K.; writing—original draft preparation, Y.K.; writing—review and editing, S.M., L.B., L.K., J.Y., J.G.-G. and G.G.; funding acquisition, G.G.; project administration, G.G. All authors have read and agreed to the published version of the manuscript.
Funding
This research was funded in part by the Luxembourg National Research Fund (FNR), grant reference INTER/ANR/25/19565082/METACLOAK.
Institutional Review Board Statement
Not applicable.
Informed Consent Statement
Not applicable.
Data Availability Statement
The data supporting the findings of this study are available from the corresponding author upon reasonable request.
Acknowledgments
This research was funded in part by the Luxembourg National Research Fund (FNR), grant reference INTER/ANR/25/19565082/METACLOAK.
Conflicts of Interest
The authors declare no conflicts of interest.
References
- Ozden, M.C.; Simsek, U.; Ozdemir, M.; Gayir, C.E.; Sendur, P. Innovative Vibration Control of Triply Periodic Minimum Surfaces Lattice Structures: A Hybrid Approach with Constrained Layer Damping Silicone–Viscoelastic Layer Integration. Adv. Eng. Mater. 2024, 26, 2201851. [Google Scholar] [CrossRef]
- Kashfi, M.; Nourbakhsh, S.H.; Amiripour, A.; Lim, H.J. Constrained Functionally Graded Gyroid Structure for Tunable Energy Absorption. Mater. Des. 2025, 258, 114693. [Google Scholar] [CrossRef]
- Honari, P.; Rahmatabadi, D.; Bayati, A.; Rassi, E.; Ghasemi, I.; Baniassadi, M.; Bodaghi, M.; Baghani, M. Simultaneous 4D Printing and In-Situ Foaming for Tailoring Shape Memory Behaviors in Polylactic Acid Foams. Manuf. Lett. 2025, 43, 33–36. [Google Scholar] [CrossRef]
- Schwarz, H.A. Gesammelte Mathematische Abhandlungen: Erster Band; Springer: Berlin, Germany, 1890. [Google Scholar] [CrossRef]
- Neovius, E.R. Bestimmung zweier speciellen periodischen Minimalflächen, auf welchen unendlich viele gerade Linien und unendlich viele ebene geodätische Linien liegen; Frenckell: Helsinki, Finland, 1883. [Google Scholar]
- Schoen, A.H. 1970. Infinite Periodic Minimal Surfaces Without Self-Intersections. Technical Report NASA Technical Note TN D-5541. NASA Electronics Research Center: Cambridge, MA, USA. [Google Scholar]
- Han, L.; Che, S. An Overview of Materials with Triply Periodic Minimal Surfaces and Related Geometry: From Biological Structures to Self-Assembled Systems. Adv. Mater. 2018, 30, 1705708. [Google Scholar] [CrossRef] [PubMed]
- Al-Ketan, O.; Abu Al-Rub, R.K. Multifunctional Mechanical Metamaterials Based on Triply Periodic Minimal Surface Lattices. Adv. Eng. Mater. 2019, 21, 1900524. [Google Scholar] [CrossRef]
- Jung, Y.; Torquato, S. Fluid Permeabilities of Triply Periodic Minimal Surfaces. Phys. Rev. E 2005, 72, 056319. [Google Scholar] [CrossRef] [PubMed]
- Feng, X.Q.; Mai, Y.W.; Qin, Q.H. A Micromechanical Model for Interpenetrating Multiphase Composites. Comput. Mater. Sci. 2003, 28, 486–493. [Google Scholar] [CrossRef]
- Al-Ketan, O.; Assad, M.A.; Abu Al-Rub, R.K. Mechanical Properties of Periodic Interpenetrating Phase Composites with Novel Architected Microstructures. Compos. Struct. 2017, 176, 9–19. [Google Scholar] [CrossRef]
- Abueidda, D.W.; Dalaq, A.S.; Abu Al-Rub, R.K.; Younes, H.A. Finite Element Predictions of Effective Multifunctional Properties of Interpenetrating Phase Composites with Novel Triply Periodic Solid Shell Architectured Reinforcements. Int. J. Mech. Sci. 2015, 92, 80–89. [Google Scholar] [CrossRef]
- Zhang, Y.; Hsieh, M.T.; Valdevit, L. Mechanical Performance of 3D Printed Interpenetrating Phase Composites with Spinodal Topologies. Compos. Struct. 2021, 263, 113693. [Google Scholar] [CrossRef]
- Chen, A.Y.; Portela, C.M. Mechanics of Micro-Architected Carbon- and Polymer-Based Interpenetrating Phase Composites. Int. J. Solids Struct. 2025, 323, 113638. [Google Scholar] [CrossRef]
- Shingare, K.B.; Alkunte, S.; Li, B.; Schiffer, A.; Kinloch, I.; Liao, K. Multifunctional TPMS-Based Interpenetrating Phase Composites: A Comprehensive Review of Structure, Properties, Piezoelectricity and Applications. Compos. Part C Open Access 2025, 17, 100596. [Google Scholar] [CrossRef]
- Refai, K.; Montemurro, M.; Brugger, C.; Saintier, N. Determination of the Effective Elastic Properties of Titanium Lattice Structures. Mech. Adv. Mater. Struct. 2020, 27, 1966–1982. [Google Scholar] [CrossRef]
- Ramírez, E.A.; Béraud, N.; Montemurro, M.; Pourroy, F.; Villeneuve, F. Effective Elastic and Strength Properties of TPMS Lattice Structures by Numerical Homogenization. Mech. Adv. Mater. Struct. 2024, 31, 9571–9583. [Google Scholar] [CrossRef]
- Zhang, J.; Xie, S.; Jing, K.; Wang, H.; Li, T.; He, G. Study on Isotropic Design of Triply Periodic Minimal Surface Structures Under an Elastic Modulus Compensation Mechanism. Compos. Struct. 2024, 342, 118266. [Google Scholar] [CrossRef]
- Liu, P.; Liu, A.; Peng, H.; Tian, L.; Liu, J.; Lu, L. Mechanical Property Profiles of Microstructures via Asymptotic Homogenization. Comput. Graph. 2021, 100, 106–115. [Google Scholar] [CrossRef]
- Chen, Z.; Xie, Y.M.; Wang, Z.; Li, Q.; Wu, X.; Zhou, S. A Comparison of Fast Fourier Transform-Based Homogenization Method to Asymptotic Homogenization Method. Compos. Struct. 2020, 238, 111979. [Google Scholar] [CrossRef]
- Yu, W.; Tang, T. Variational Asymptotic Method for Unit Cell Homogenization of Periodically Heterogeneous Materials. Int. J. Solids Struct. 2007, 44, 3738–3755. [Google Scholar] [CrossRef]
- Koutsawa, Y.; Belouettar, S.; Makradi, A.; Tiem, S. X-FEM Implementation of VAMUCH: Application to Active Structural Fiber Multi-Functional Composite Materials. Compos. Struct. 2012, 94, 1297–1304. [Google Scholar] [CrossRef]
- Bouhala, L.; Koutsawa, Y.; Makradi, A.; Belouettar, S. An Advanced Numerical Method for Predicting Effective Elastic Properties of Heterogeneous Composite Materials. Compos. Struct. 2014, 117, 114–123. [Google Scholar] [CrossRef]
- Yu, W. A Unified Theory for Constitutive Modeling of Composites. J. Mech. Mater. Struct. 2016, 11, 379–411. [Google Scholar] [CrossRef]
- Yu, W. Simplified Formulation of Mechanics of Structure Genome. AIAA J. 2019, 57, 4201–4209. [Google Scholar] [CrossRef]
- Yu, W. An Introduction to Micromechanics. Appl. Mech. Mater. 2016, 828, 3–24. [Google Scholar] [CrossRef]
- Mouman, S.; Koutsawa, Y.; Binsfeld, L.; Kirkayak, L.; Yang, J.; Giunta, G. Mechanical Homogenisation of TPMS Architectures: A Comparison Between Finite Element and Mechanics of Structure Genome Approaches. Materials 2025, 18, 5357. [Google Scholar] [CrossRef] [PubMed]
- Koutsawa, Y.; Tiem, S.; Yu, W.; Addiego, F.; Giunta, G. A Micromechanics Approach for Effective Elastic Properties of Nano-Composites with Energetic Surfaces/Interfaces. Compos. Struct. 2017, 159, 278–287. [Google Scholar] [CrossRef]
- Koutsawa, Y.; Karatrantos, A.V.; Yu, W.; Ruch, D. A Micromechanics Approach for the Effective Thermal Conductivity of Composite Materials with General Linear Imperfect Interfaces. Compos. Struct. 2018, 200, 747–756. [Google Scholar] [CrossRef]
- Omairey, S.L.; Dunning, P.D.; Sriramula, S. Development of an ABAQUS Plugin Tool for Periodic RVE Homogenisation. Eng. With Comput. 2019, 35, 567–577. [Google Scholar] [CrossRef]
- Barbero, E.J. Finite Element Analysis of Composite Materials Using Abaqus, 2nd ed.; CRC Press: Boca Raton, FL, USA, 2023. [Google Scholar]
- Catchpole-Smith, S.; Sélo, R.R.J.; Davis, A.W.; Ashcroft, I.A.; Tuck, C.J.; Clare, A. Thermal Conductivity of TPMS Lattice Structures Manufactured via Laser Powder Bed Fusion. Addit. Manuf. 2019, 30, 100846. [Google Scholar] [CrossRef]
- Fan, Z.; Gao, R.; Liu, S. Thermal Conductivity Enhancement and Thermal Saturation Elimination Designs of Battery Thermal Management System for Phase Change Materials Based on Triply Periodic Minimal Surface. Energy 2022, 259, 125091. [Google Scholar] [CrossRef]
- Zhou, Z.; Chen, L.; Wang, W.; Xing, B.; Tian, J.; Zhao, Z. Effective Thermal Conductivity and Heat Transfer Characteristics of a Series of Ceramic Triply Periodic Minimal Surface Lattice Structure. Adv. Eng. Mater. 2023, 25, 2300359. [Google Scholar] [CrossRef]
- Bragin, D.M.; Popov, A.I.; Eremin, A.V. The Thermal Conductivity Properties of Porous Materials Based on TPMS. Int. J. Heat Mass Transf. 2024, 231, 125863. [Google Scholar] [CrossRef]
- Abueidda, D.W.; Abu Al-Rub, R.K.; Dalaq, A.S.; Lee, D.W.; Khan, K.A.; Jasiuk, I. Effective Conductivities and Elastic Moduli of Novel Foams with Triply Periodic Minimal Surfaces. Mech. Mater. 2016, 95, 102–115. [Google Scholar] [CrossRef]
- Mirabolghasemi, A.; Akbarzadeh, A.H.; Rodrigue, D.; Therriault, D. Thermal Conductivity of Architected Cellular Metamaterials. Acta Mater. 2019, 174, 61–80. [Google Scholar] [CrossRef]
- Chawla, K.; Kiran, R. Numerical Predictions for the Effect of Negative Poisson’s Ratio on Thermoelastic Properties of Triply Periodic Minimal Surface-Based Composites. Results Mater. 2022, 14, 100273. [Google Scholar] [CrossRef]
- Dassault Systèmes SIMULIA. Micromechanics Plugin for Abaqus/CAE User Manual Dassault Systèmes. 2024.
- Marchais, K.; Chemisky, Y.; d’Esparbès, R.; Guevara Garban, M.R.; Legerstee, Y. 3mah/microgen: v1.3.2. Zenodo 2025. [Google Scholar] [CrossRef]
- Geuzaine, C.; Remacle, J.F. Gmsh: A 3-D Finite Element Mesh Generator with Built-in Pre- and Post-Processing Facilities. Int. J. Numer. Methods Eng. 2009, 79, 1309–1331. [Google Scholar] [CrossRef]
- Schöberl, J. NETGEN – An Advancing Front 2D/3D-Mesh Generator Based on Abstract Rules. Comput. Vis. Sci. 1997, 1, 41–52. [Google Scholar] [CrossRef]
- COMSOL. Micromechanical Model of a Triply-Periodic-Minimal-Surface-Based Composite. In COMSOL Multiphysics 6.3, Application Library path: Structural_Mechanics_Module/Material_Models/micromechanical_ model_of_a_tpms_composite; COMSOL AB: Stockholm, Sweden, 2024; Available online: https://www.comsol.com.
- Awenlimobor, A.E.; Smith, D.E. Numerical Evaluation of the Effective Thermo-Mechanical Properties of a Large-Scale Additively Manufactured Short Fiber-Reinforced Polymer Composite. Fibers 2025, 13, 147. [Google Scholar] [CrossRef]
- Renard, Y.; Poulios, K. GetFEM: Automated FE Modeling of Multiphysics Problems Based on a Generic Weak Form Language. ACM Trans. Math. Softw. 2021, 47, 4:1–4:31. [Google Scholar] [CrossRef]
- Amestoy, P.R.; Duff, I.S.; Koster, J.; L’Excellent, J.Y. A Fully Asynchronous Multifrontal Solver Using Distributed Dynamic Scheduling. SIAM J. Matrix Anal. Appl. 2001, 23, 15–41. [Google Scholar] [CrossRef]
- Amestoy, P.R.; Buttari, A.; L’Excellent, J.Y.; Mary, T. Performance and Scalability of the Block Low-Rank Multifrontal Factorization on Multicore Architectures. ACM Trans. Math. Softw. 2019, 45, 2:1–2:26. [Google Scholar] [CrossRef]
- Berg, I. muParser: Fast Math Parser Library. GitHub repository Open-source C++ mathematical expression parser. 2024. Available online: https://github.com/beltoforion/muparser.
- Tao, F.; Lyu, X.; Liu, X.; Yu, W. Multiscale Analysis of Multilayer Printed Circuit Board Using Mechanics of Structure Genome. Mech. Adv. Mater. Struct. 2021, 28, 774–783. [Google Scholar] [CrossRef]
- Liu, X.; Peng, B.; Yu, W. Multiscale Modeling of the Effective Thermal Conductivity of 2D Woven Composites by Mechanics of Structure Genome and Neural Networks. Int. J. Heat Mass Transf. 2021, 179, 121673. [Google Scholar] [CrossRef]
Figure 1.
Solid TPMS network of the four topologies investigated, at relative density : gyroid, diamond (Schwarz D), PMY, and F-RD. Surfaces are extracted from the level-set functions of Eqs. (1)–() using a marching-cubes isosurface algorithm; colors match those used consistently for each topology in Section 3.
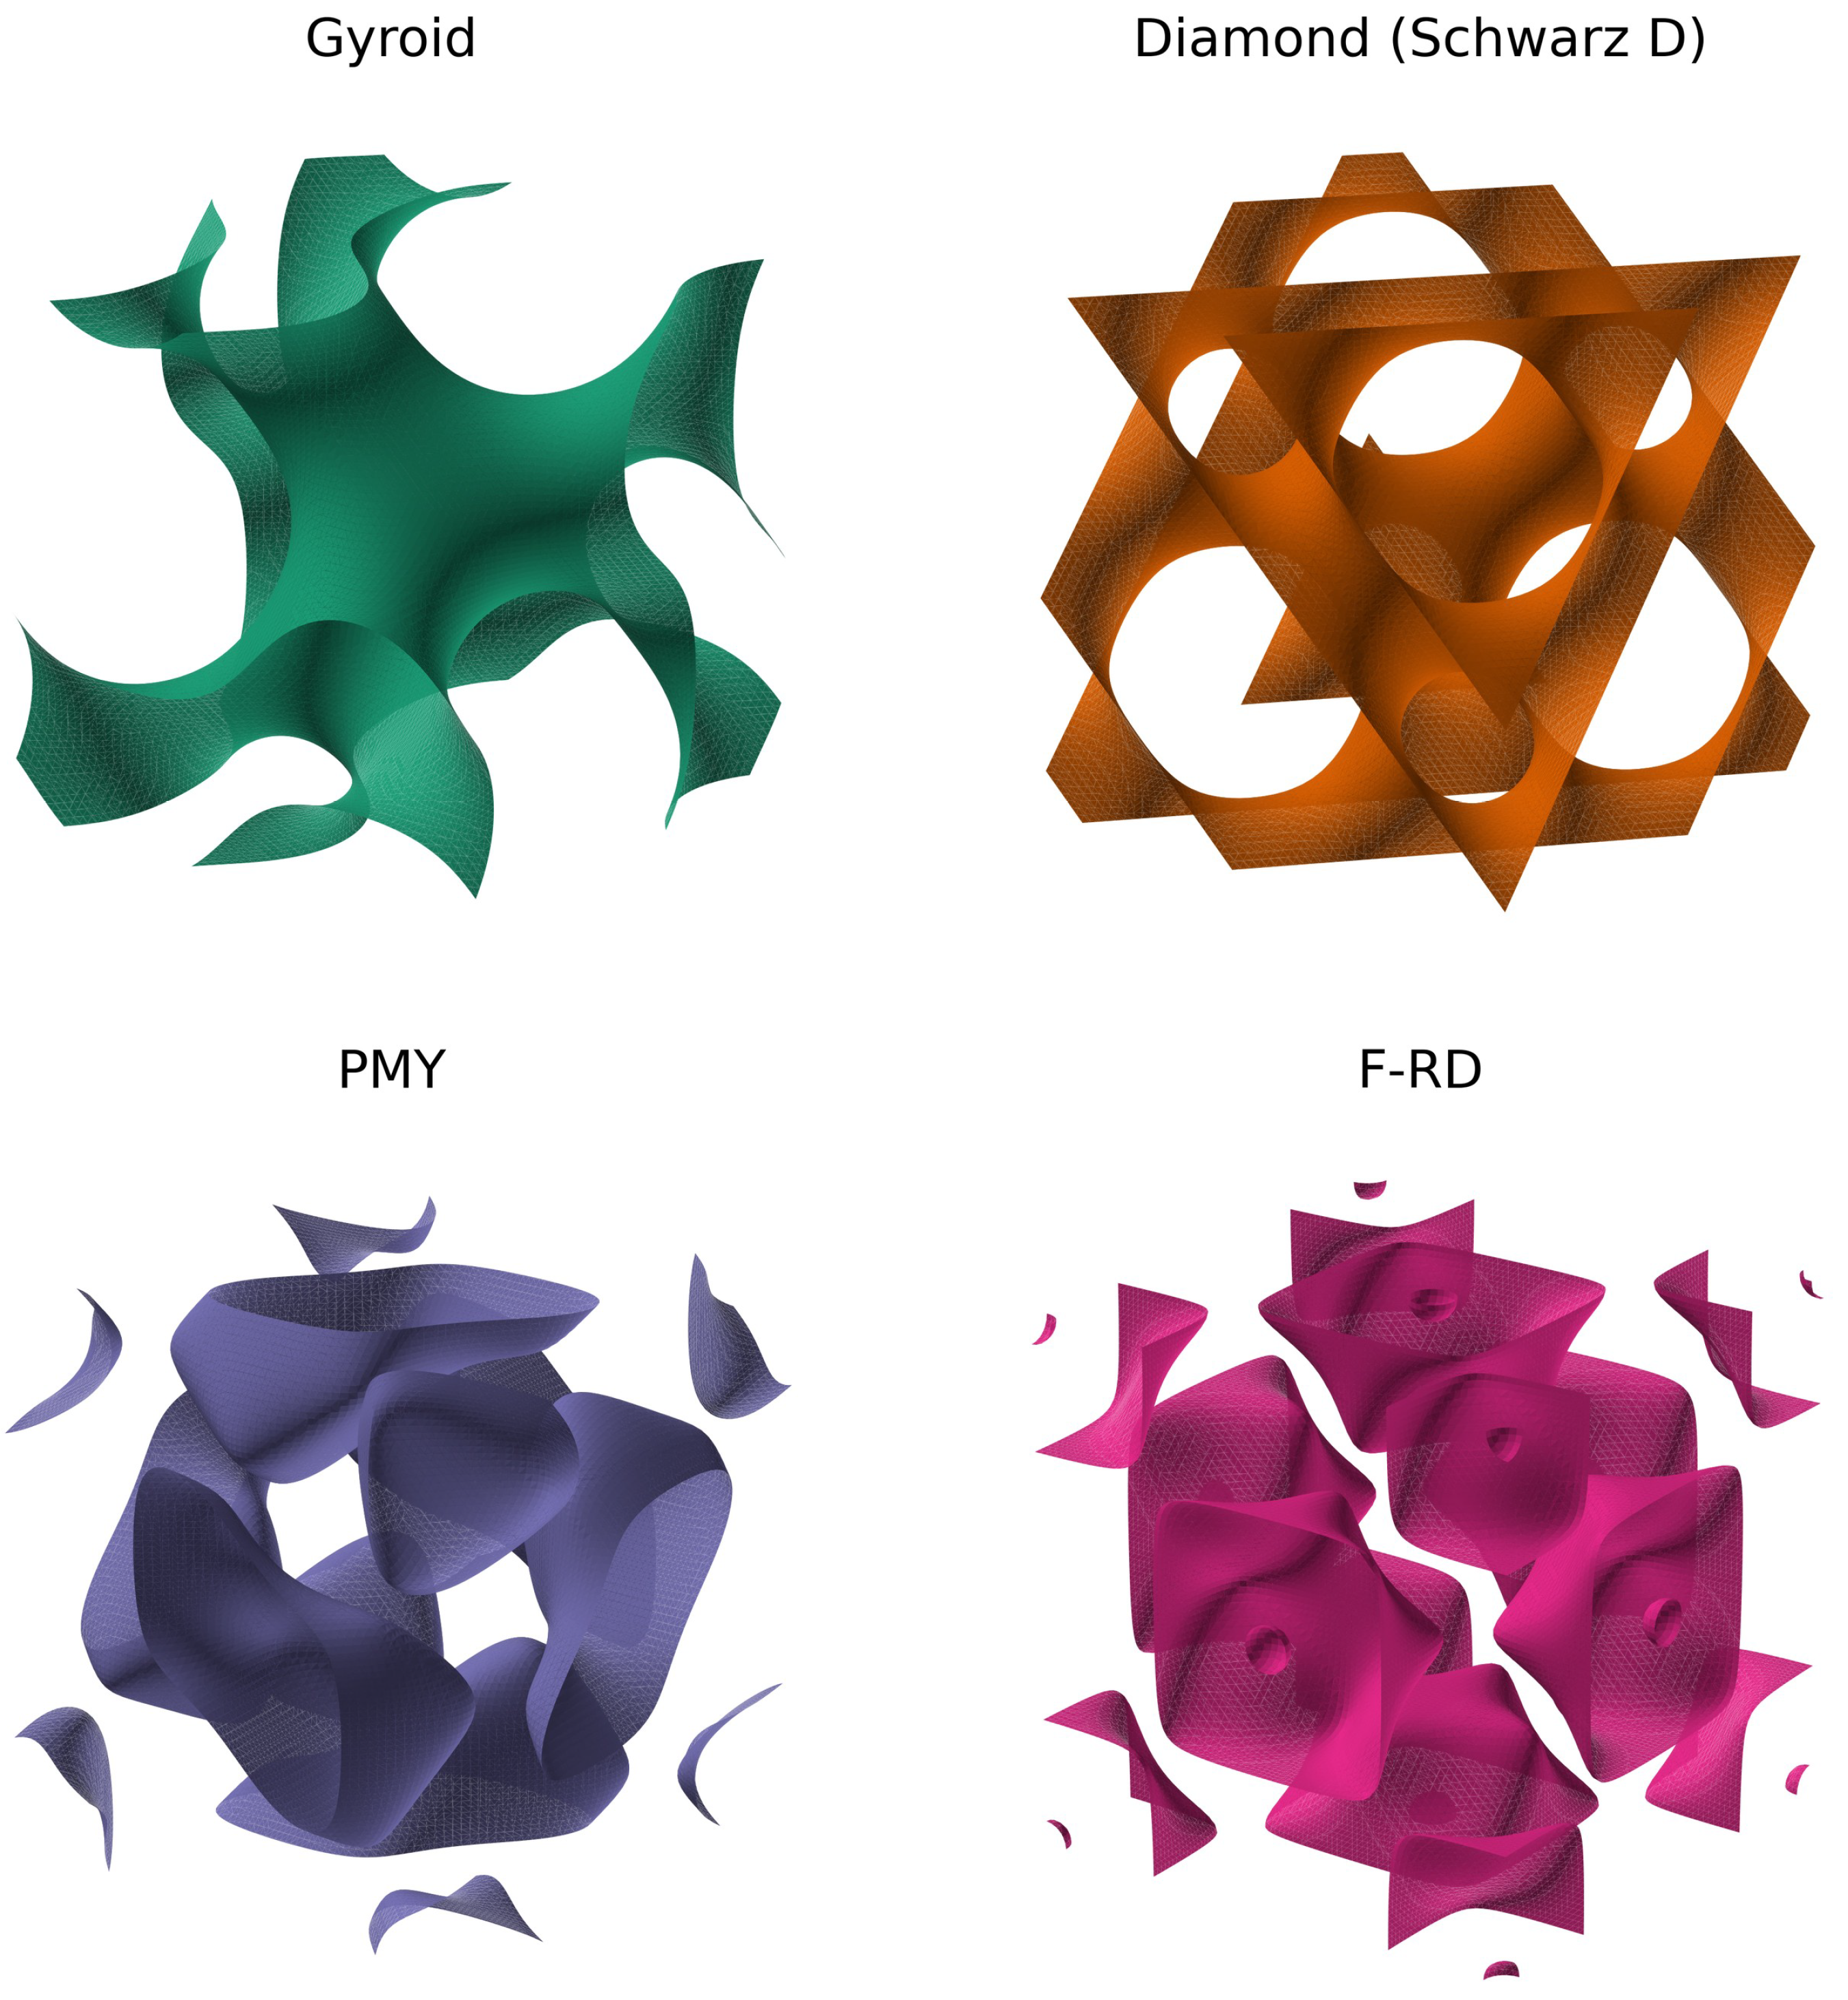
Figure 2.
Conforming, periodic two-phase tetrahedral mesh of the four TPMS-based IPC topologies at relative density , generated with Gmsh (Section 2.1): (a) gyroid, (b) diamond, (c) PMY, (d) F-RD. The TPMS phase (orange) and matrix phase (green) share a conforming interface; this is the identical mesh used by both the FE (Section 2.3) and MSG (Section 2.4) homogenization analyses.
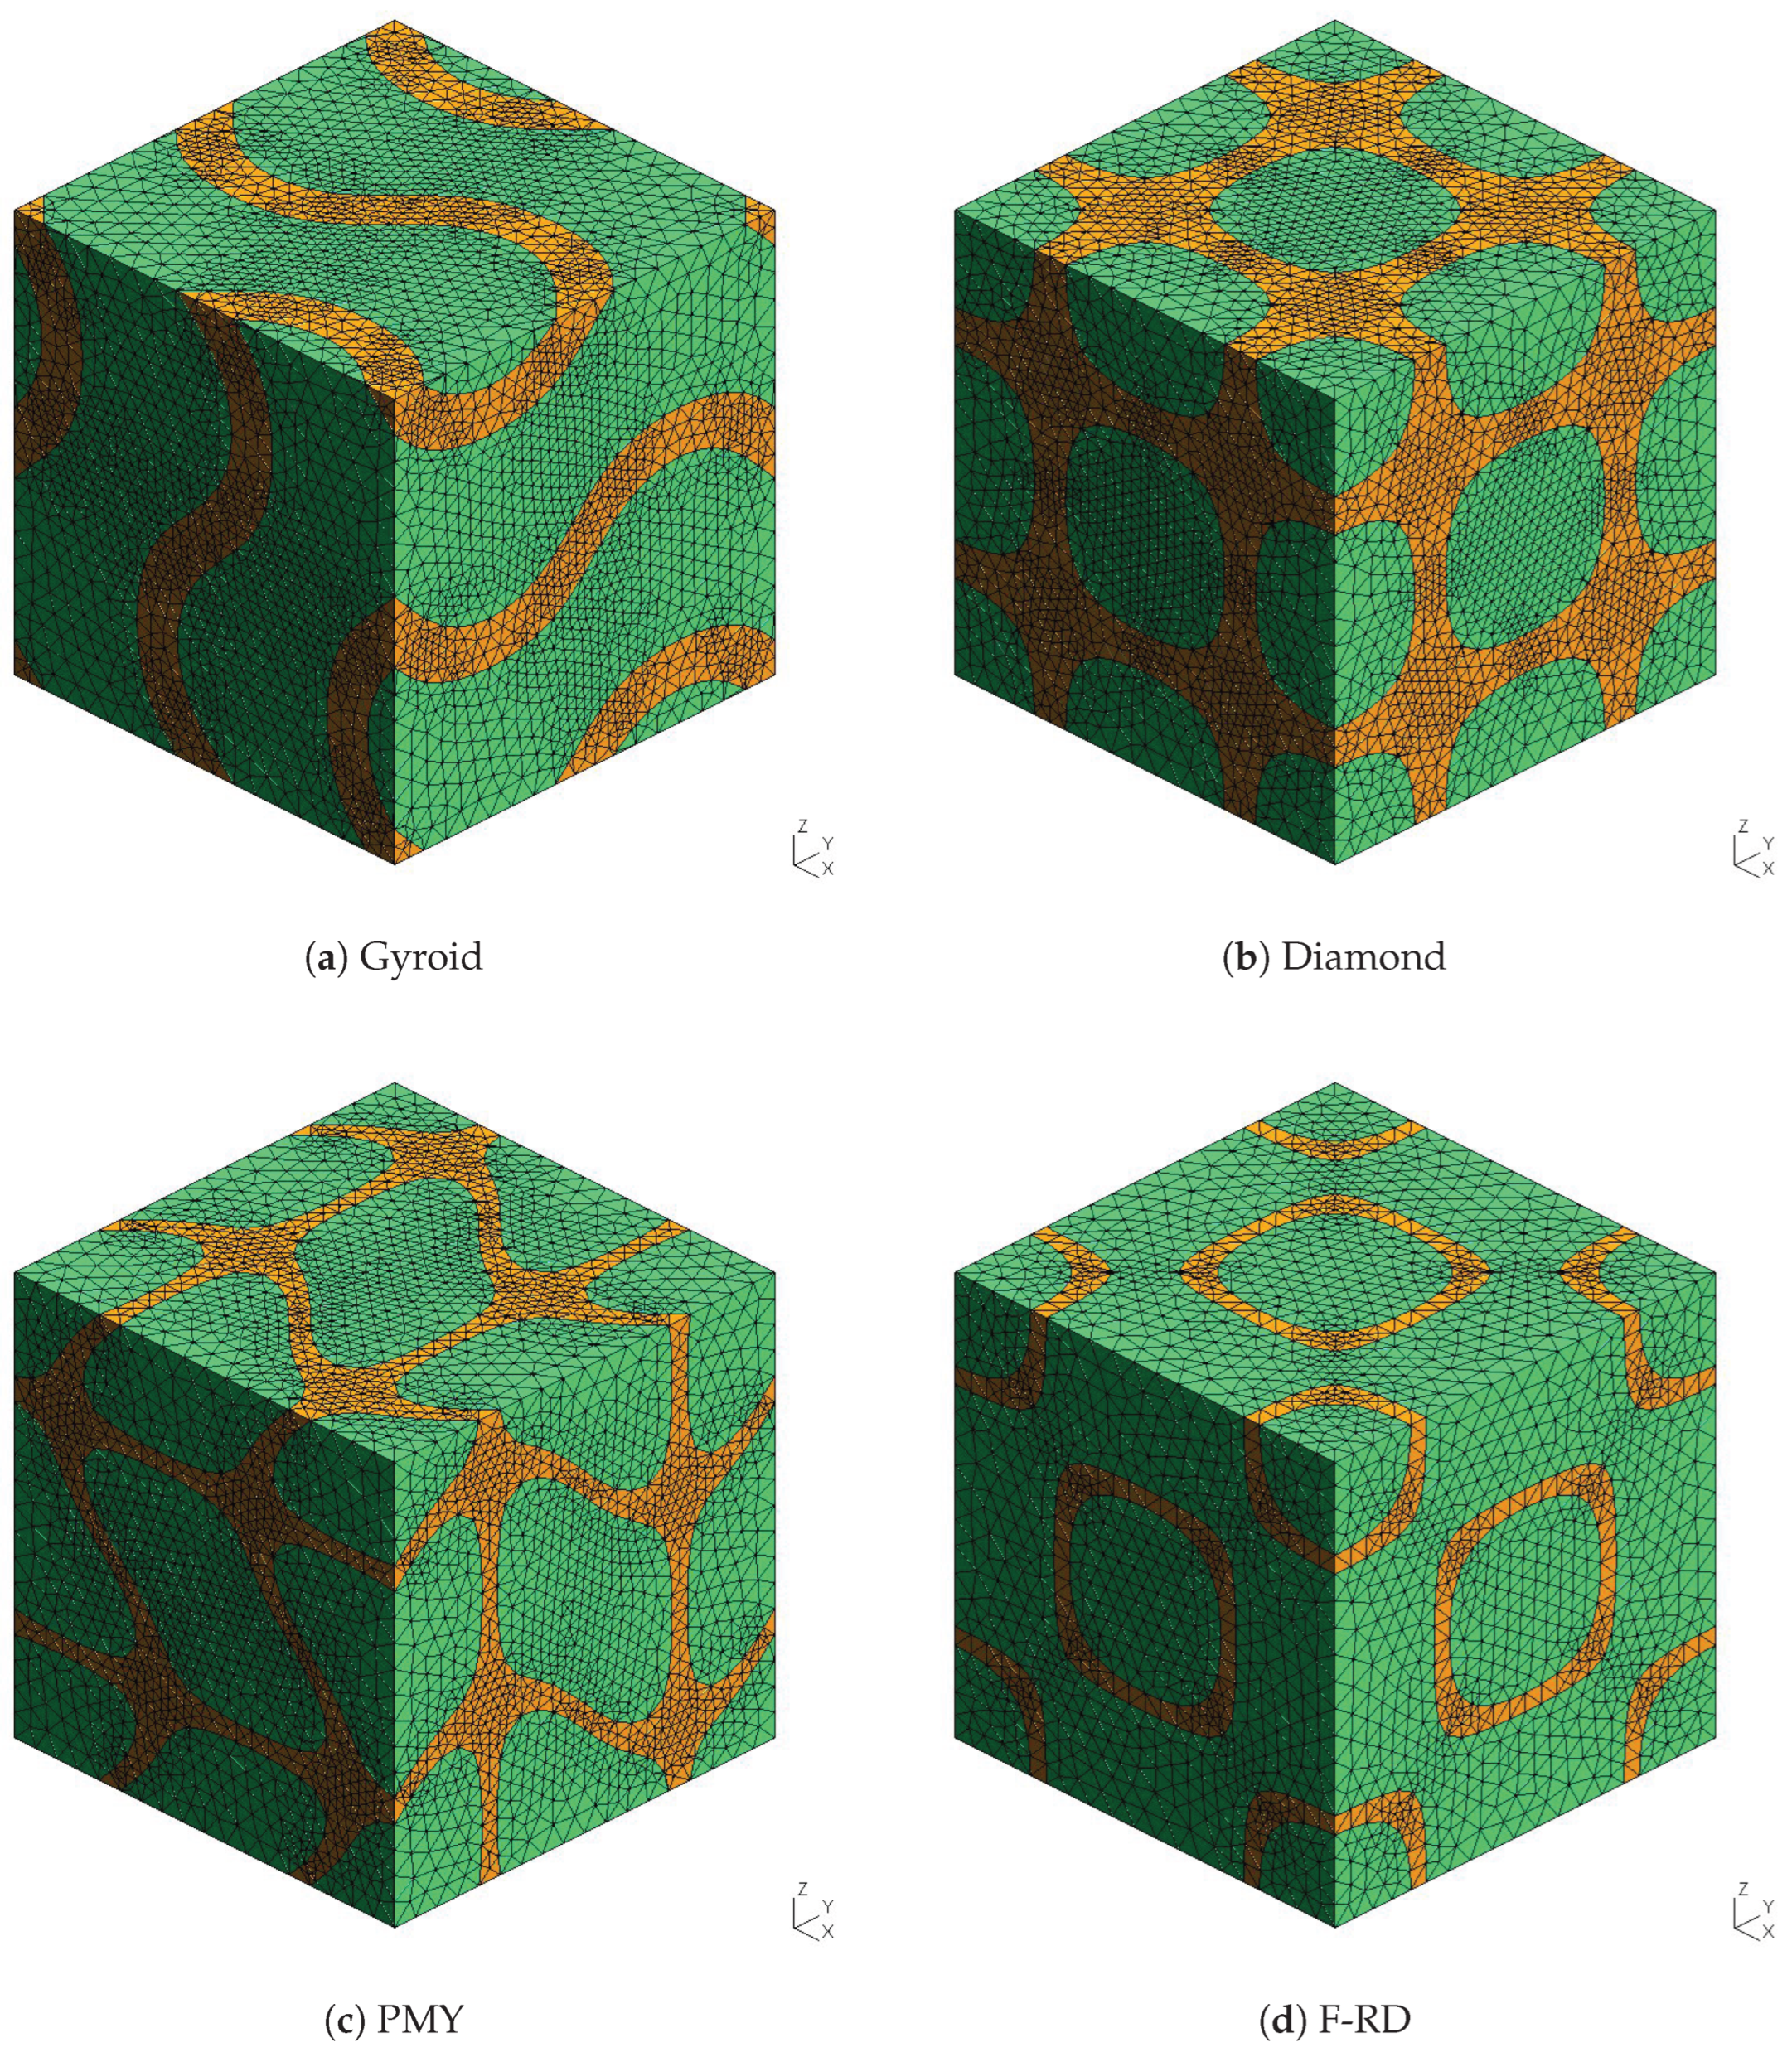
Figure 3.
Effective elastic properties of the four TPMS-based IPC topologies as a function of relative density : (a) Young’s modulus , (b) shear modulus , (c) Poisson’s ratio .
Figure 3.
Effective elastic properties of the four TPMS-based IPC topologies as a function of relative density : (a) Young’s modulus , (b) shear modulus , (c) Poisson’s ratio .
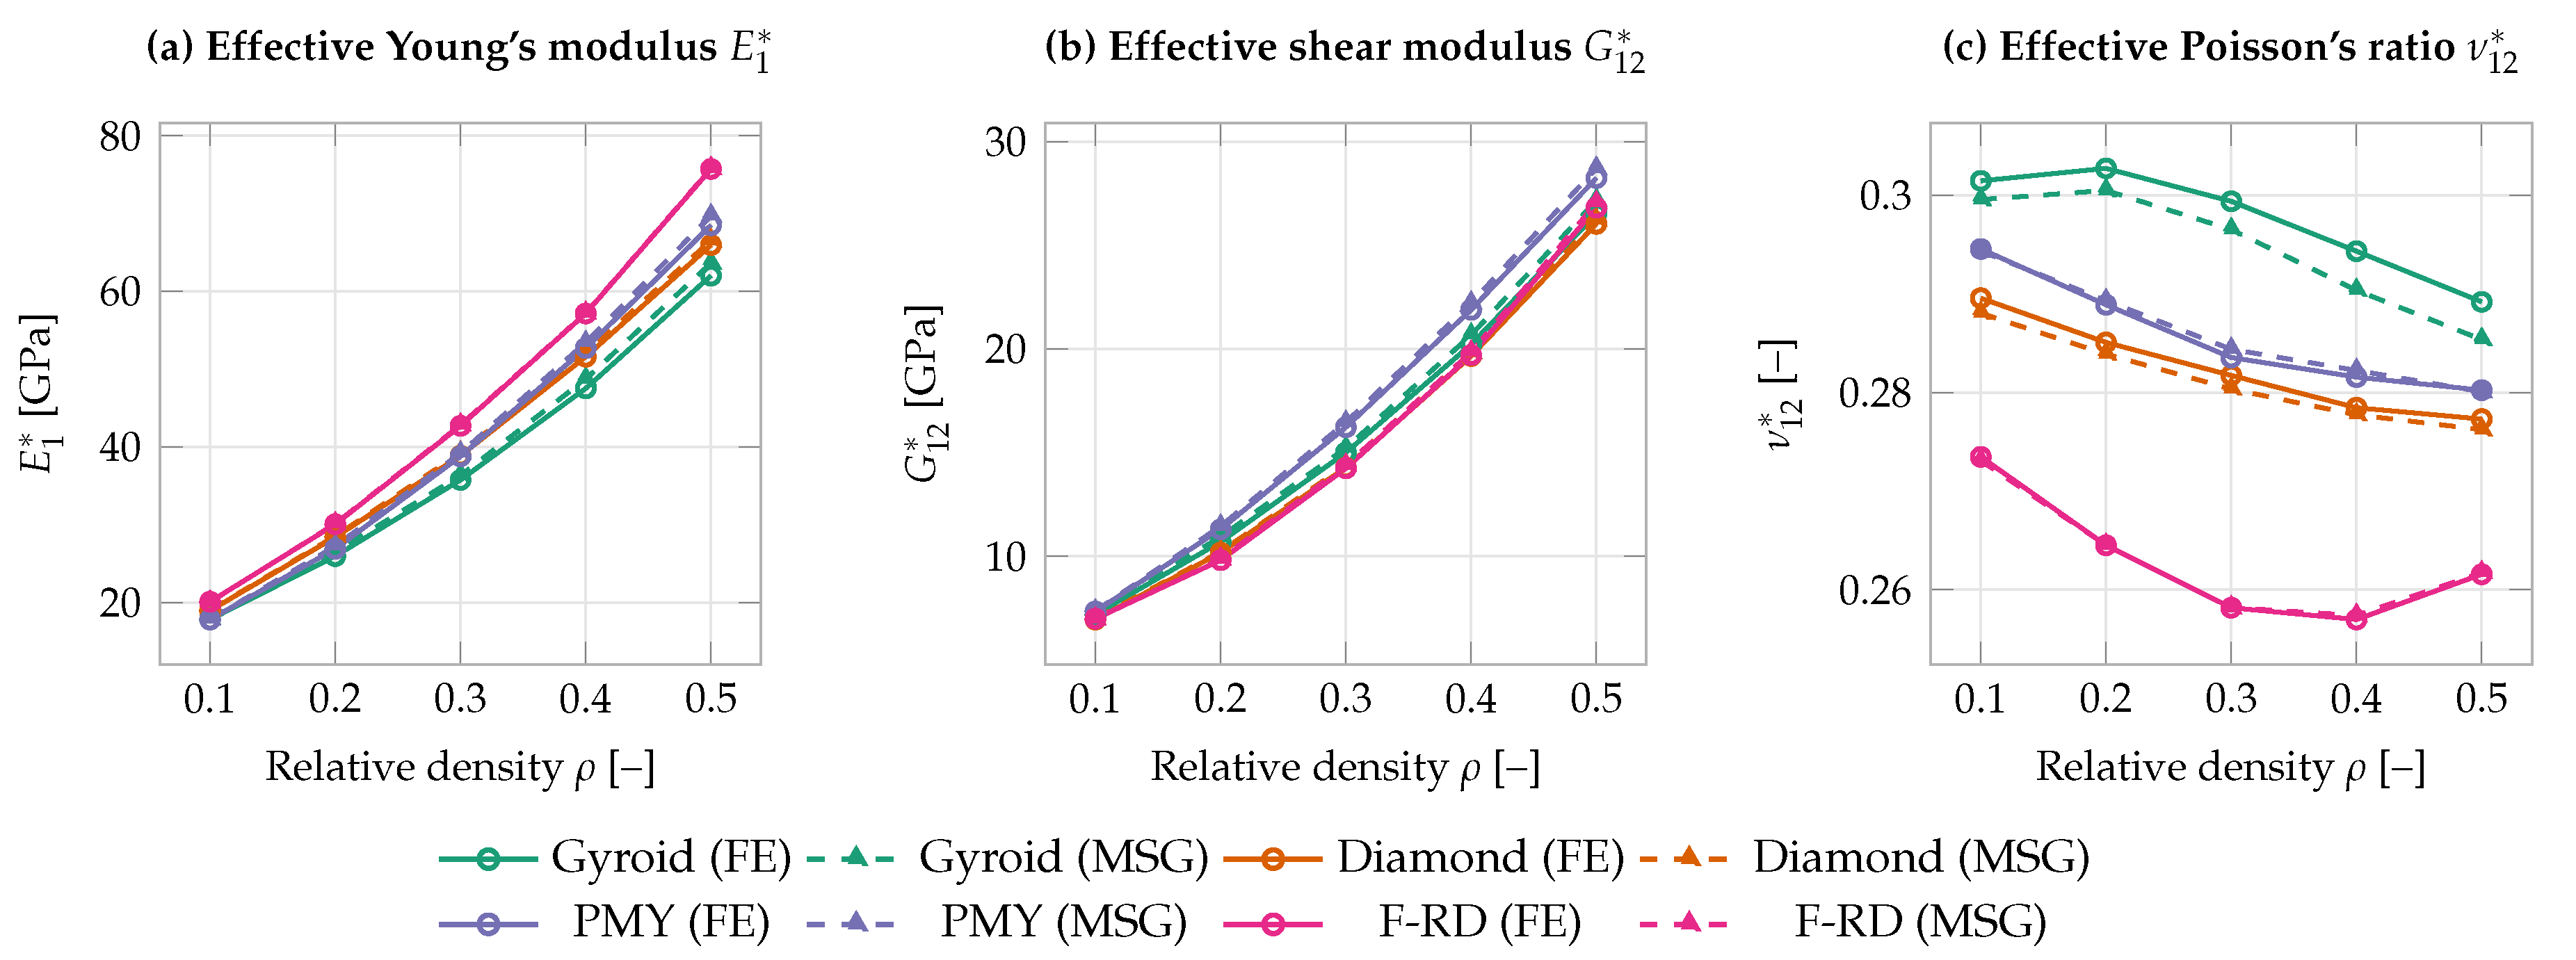
Figure 4.
Effective axial coefficient of thermal expansion of the four TPMS-based IPC topologies as a function of relative density .
Figure 4.
Effective axial coefficient of thermal expansion of the four TPMS-based IPC topologies as a function of relative density .
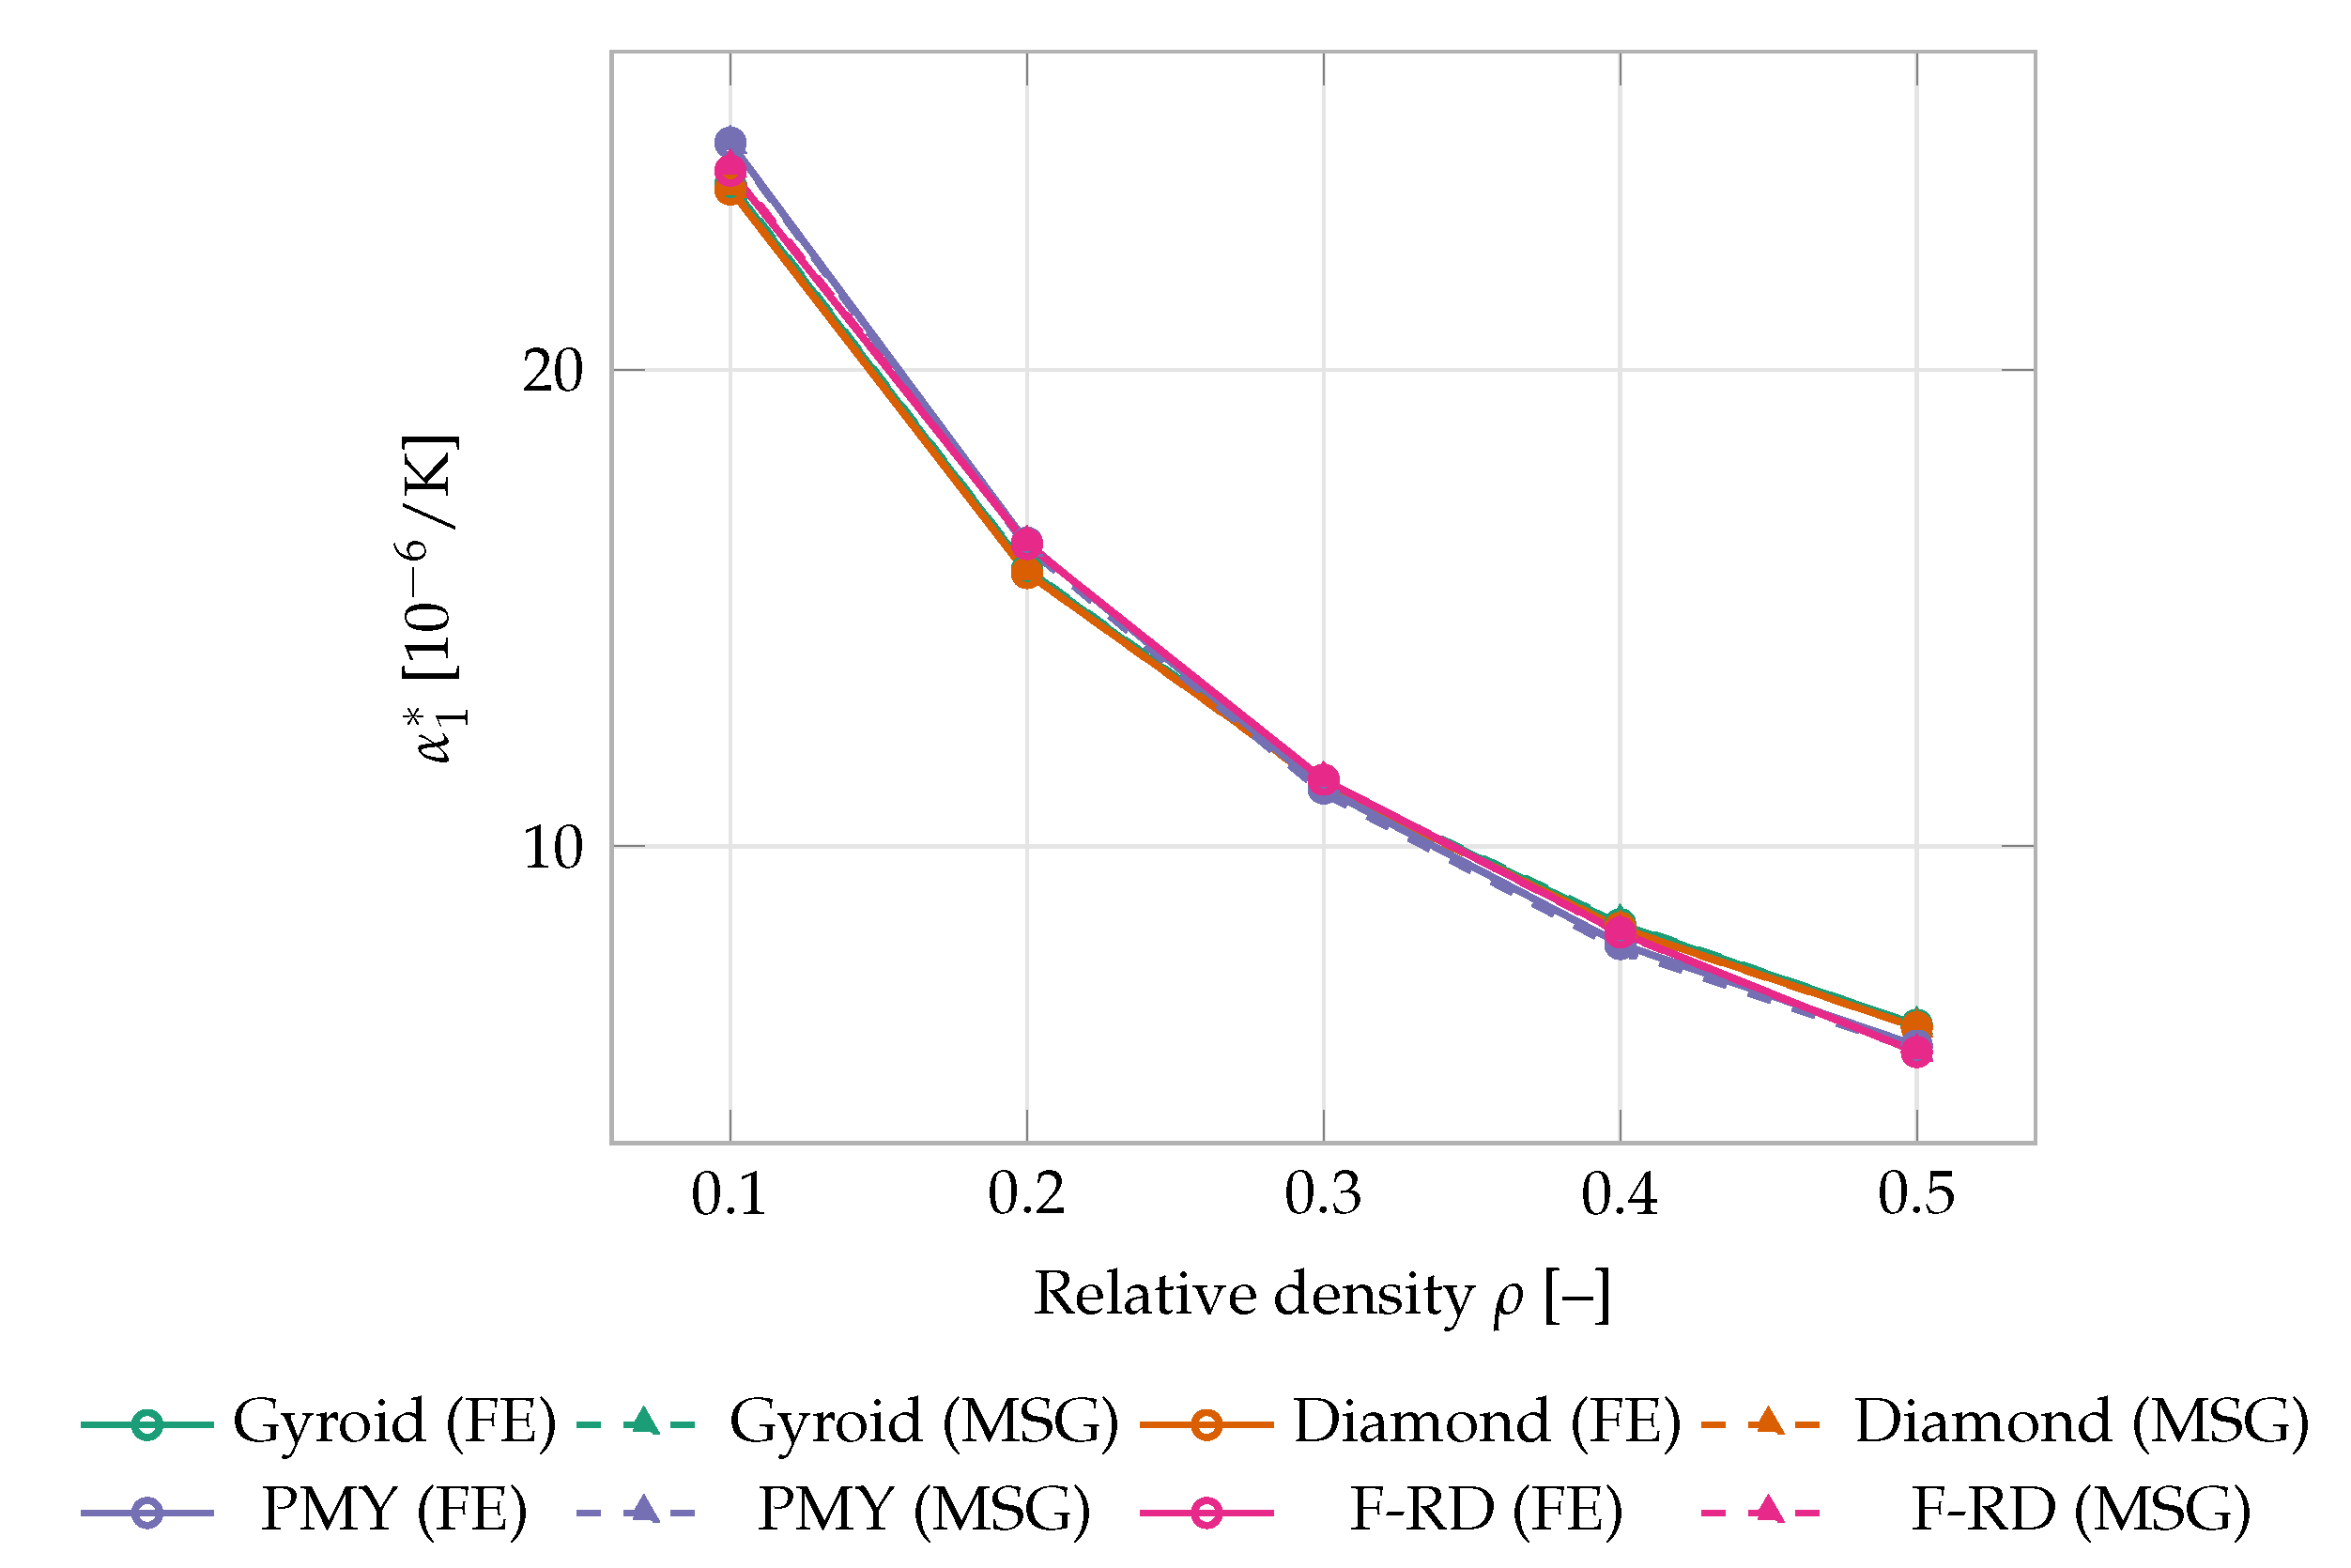
Figure 5.
Effective axial thermal conductivity of the four TPMS-based IPC topologies as a function of relative density .
Figure 5.
Effective axial thermal conductivity of the four TPMS-based IPC topologies as a function of relative density .
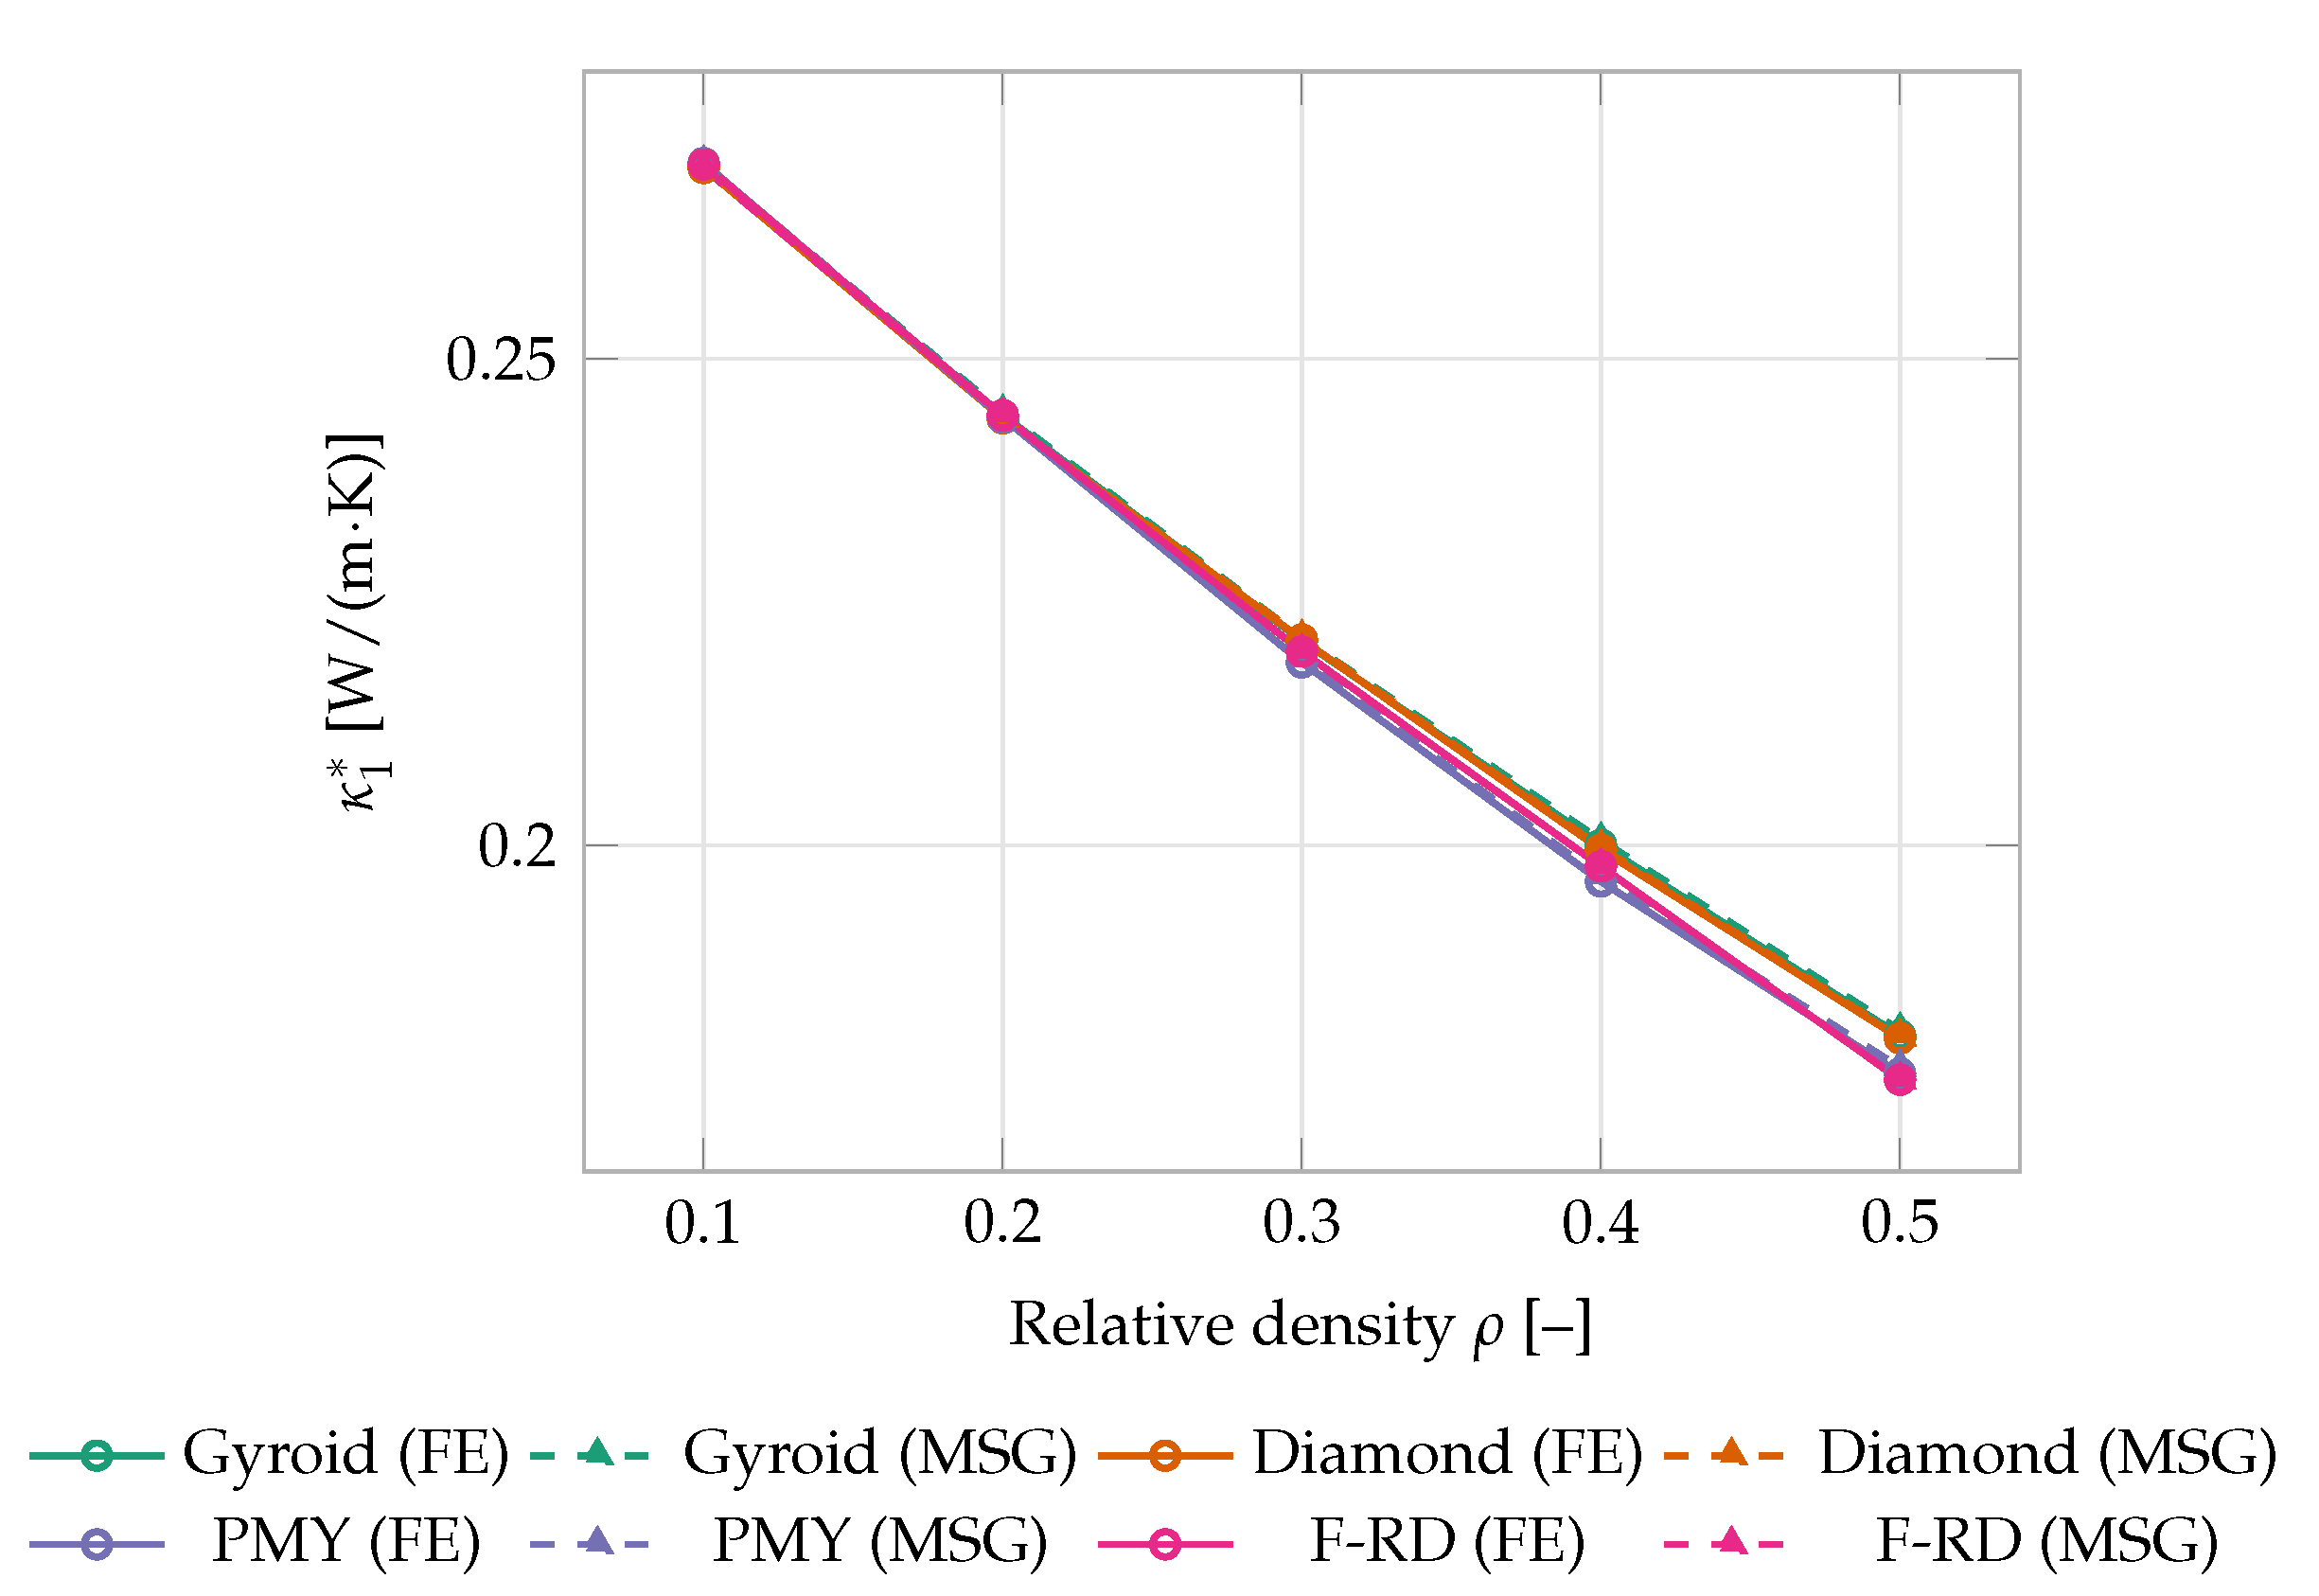
Figure 6.
Parity plots comparing FE- and MSG-predicted effective properties across all four topologies and five relative densities: (a) Young’s modulus , (b) CTE , (c) thermal conductivity . The dashed line indicates perfect agreement ().
Figure 6.
Parity plots comparing FE- and MSG-predicted effective properties across all four topologies and five relative densities: (a) Young’s modulus , (b) CTE , (c) thermal conductivity . The dashed line indicates perfect agreement ().
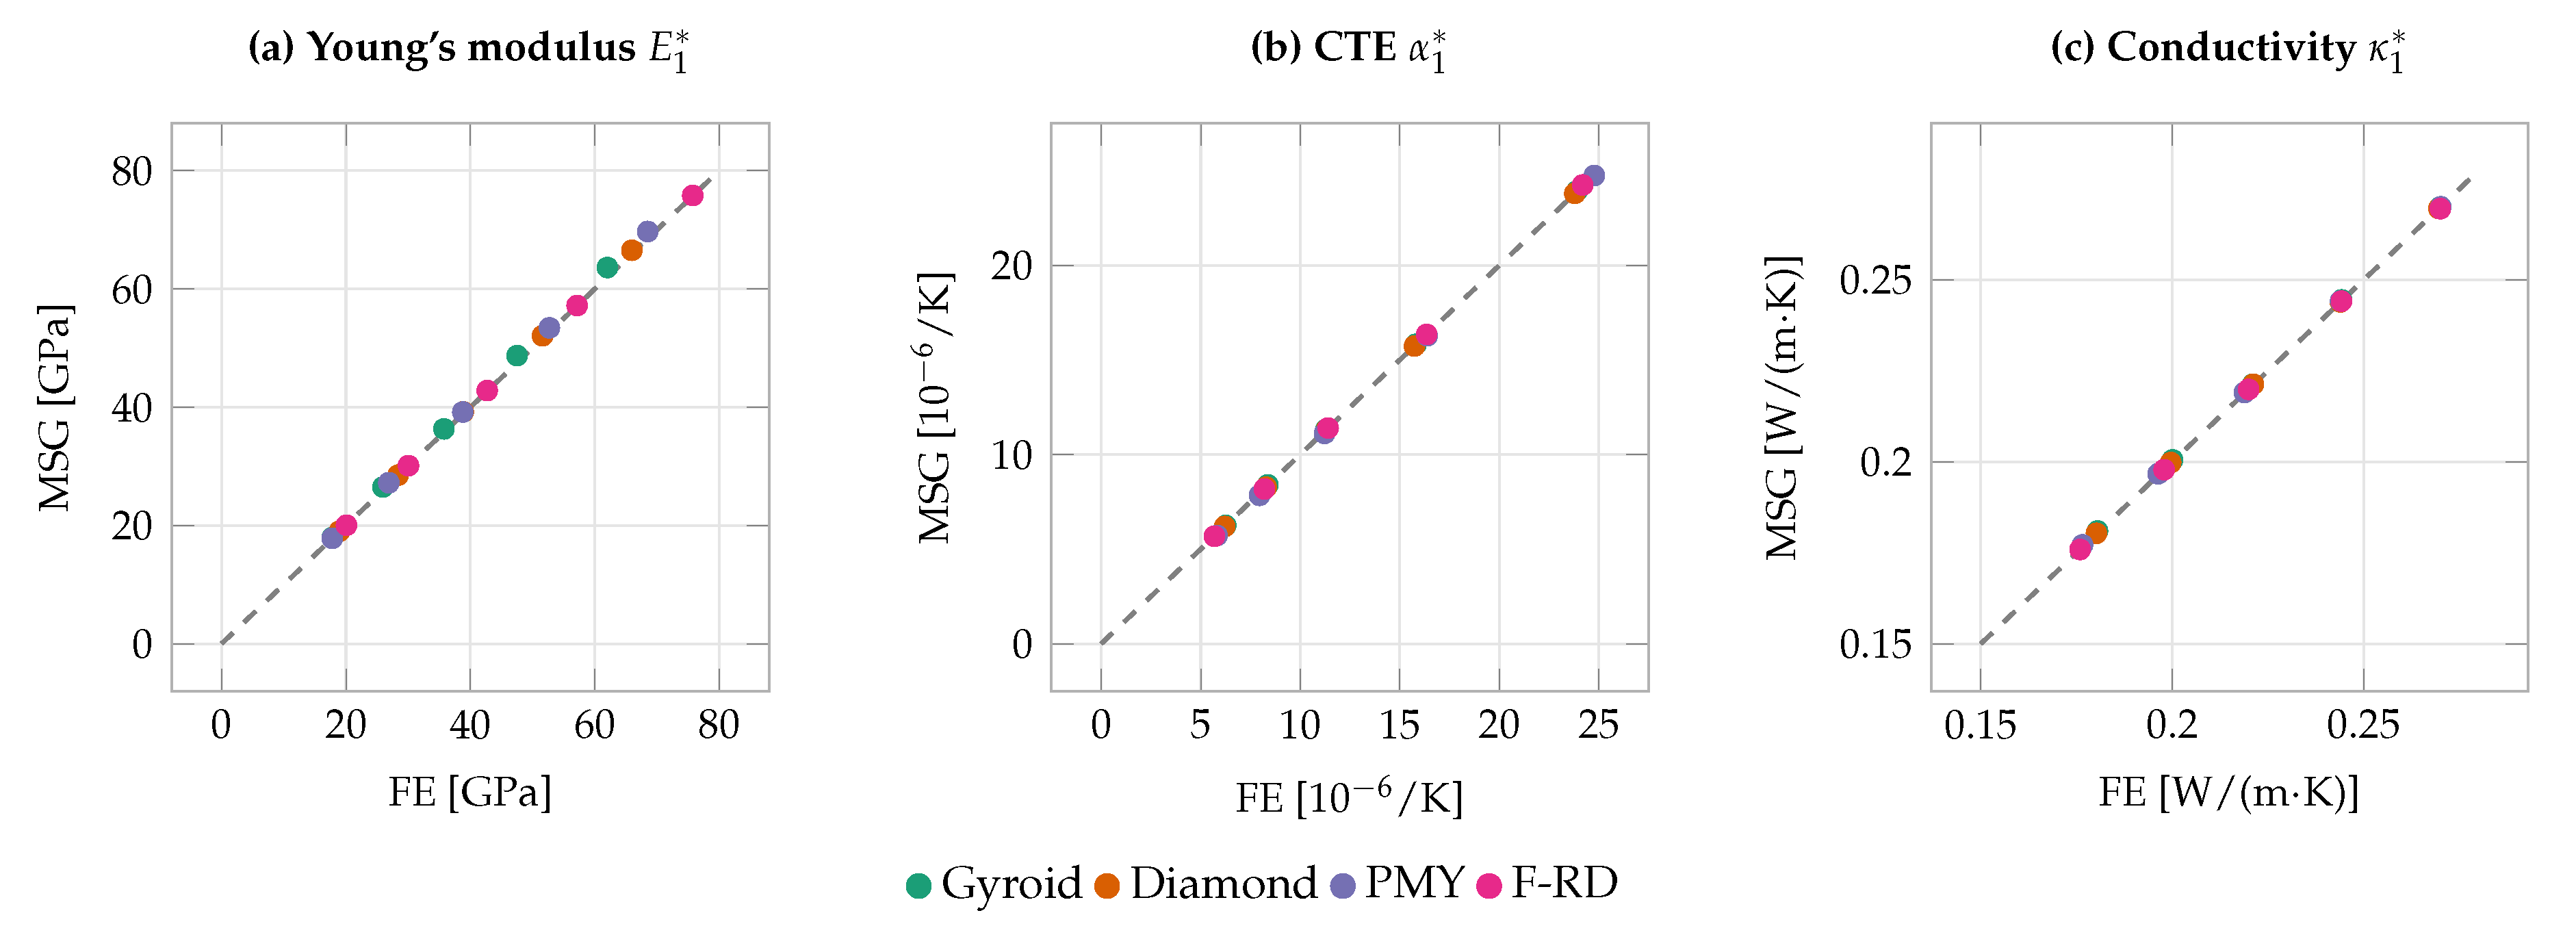

Table 1.
Constituent phase properties used in the numerical models, after [38,43] (elastic properties and CTEs) and representative values assigned for this study (thermal conductivity and specific heat, Section 2.2).
Table 1.
Constituent phase properties used in the numerical models, after [38,43] (elastic properties and CTEs) and representative values assigned for this study (thermal conductivity and specific heat, Section 2.2).
| Phase | E [GPa] | [–] | [ 1/K] | [W/(m·K)] | c [J/(kg·K)] |
|---|---|---|---|---|---|
| Matrix phase | 10 | 0.30 | 0.30 | 1650 | |
| TPMS phase | 200 | 0.30 | 0.10 | 1650 |
Table 2.
Mesh convergence study for the gyroid TPMS-based IPC at relative density (FE analysis).
| No. of Elements | [GPa] | [/K] | [W/(m·K)] | |
|---|---|---|---|---|
| 10.0 | 75,839 | 17.797 | 23.891 | 0.270 |
| 7.0 | 80,020 | 17.797 | 23.891 | 0.270 |
| 6.01 | 94,314 | 17.796 | 23.892 | 0.270 |
| 5.0 | 151,667 | 17.793 | 23.895 | 0.270 |
| 4.5 | 198,182 | 17.791 | 23.897 | 0.270 |
| 4.0 | 320,970 | 17.790 | 23.898 | 0.270 |
| 3.0 | 465,576 | 17.788 | 23.899 | 0.270 |
1 Mesh density adopted for the RUCs analyzed in this study.
Table 3.
Mesh convergence study for the gyroid TPMS-based IPC at relative density (FE analysis).
| No. of Elements | [GPa] | [/K] | [W/(m·K)] | |
|---|---|---|---|---|
| 10.0 | 72,358 | 62.064 | 6.253 | 0.180 |
| 7.0 | 75,204 | 62.055 | 6.253 | 0.180 |
| 6.01 | 88,095 | 62.020 | 6.255 | 0.180 |
| 5.0 | 163,975 | 61.974 | 6.257 | 0.180 |
| 4.5 | 227,672 | 61.958 | 6.257 | 0.180 |
| 4.0 | 364,217 | 61.943 | 6.258 | 0.180 |
| 3.0 | 452,675 | 61.938 | 6.259 | 0.180 |
1 Mesh density adopted for the RUCs analyzed in this study.
Table 4.
Validation of the FE and MSG frameworks against literature results for single-phase TPMS lattices.
Table 4.
Validation of the FE and MSG frameworks against literature results for single-phase TPMS lattices.
| Topology | Source | [GPa] (% Error)1 | [GPa] | [–] | |
|---|---|---|---|---|---|
| Gyroid | Refai et al. [16] | 0.1 | 3.496 (–) | 1.415 | 0.341 |
| This study, FE | 0.1 | 3.561 () | 1.435 | 0.341 | |
| This study, MSG | 0.1 | 3.544 () | 1.428 | 0.340 | |
| Diamond | Zhang et al. [18], FEM | 0.3 | 26.79 (–) | – | – |
| Zhang et al. [18], EXP 1 | 0.3 | 25.65 (–) | – | – | |
| Zhang et al. [18], EXP 2 | 0.3 | 26.79 (–) | – | – | |
| This study, FE | 0.3 | 26.81 () | 8.750 | 0.271 | |
| This study, MSG | 0.3 | 26.79 () | 8.745 | 0.271 |
1 Relative to the corresponding FEM literature value (Zhang et al. EXP 2 coincides with their FEM prediction to the precision reported); the FE prediction deviates from Zhang et al.’s EXP 1 measurement by .
Table 5.
Effective elastic properties predicted by FE and MSG for the four TPMS-based IPC topologies, underlying Figure 3.
Table 5.
Effective elastic properties predicted by FE and MSG for the four TPMS-based IPC topologies, underlying Figure 3.
| Topology | [–] | [GPa] | [GPa] | [–] | |||
|---|---|---|---|---|---|---|---|
| FE | MSG | FE | MSG | FE | MSG | ||
| Gyroid | 0.1 | 17.80 | 17.97 | 7.18 | 7.25 | 0.301 | 0.300 |
| 0.2 | 25.95 | 26.50 | 10.69 | 10.94 | 0.303 | 0.300 | |
| 0.3 | 35.75 | 36.32 | 15.00 | 15.22 | 0.299 | 0.297 | |
| 0.4 | 47.51 | 48.72 | 20.22 | 20.68 | 0.294 | 0.290 | |
| 0.5 | 62.02 | 63.62 | 26.52 | 27.18 | 0.289 | 0.285 | |
| Diamond | 0.1 | 18.94 | 19.00 | 6.94 | 6.98 | 0.290 | 0.288 |
| 0.2 | 28.40 | 28.52 | 10.16 | 10.21 | 0.285 | 0.284 | |
| 0.3 | 38.86 | 39.22 | 14.27 | 14.39 | 0.282 | 0.280 | |
| 0.4 | 51.60 | 52.07 | 19.66 | 19.82 | 0.278 | 0.278 | |
| 0.5 | 65.96 | 66.53 | 26.05 | 26.23 | 0.277 | 0.276 | |
| PMY | 0.1 | 17.80 | 17.82 | 7.32 | 7.35 | 0.295 | 0.294 |
| 0.2 | 26.89 | 27.22 | 11.30 | 11.44 | 0.289 | 0.289 | |
| 0.3 | 38.78 | 39.19 | 16.23 | 16.46 | 0.284 | 0.284 | |
| 0.4 | 52.70 | 53.42 | 21.89 | 22.22 | 0.282 | 0.282 | |
| 0.5 | 68.50 | 69.71 | 28.26 | 28.73 | 0.280 | 0.280 | |
| F-RD | 0.1 | 20.08 | 20.04 | 6.98 | 6.96 | 0.273 | 0.273 |
| 0.2 | 30.05 | 30.11 | 9.80 | 9.85 | 0.265 | 0.265 | |
| 0.3 | 42.70 | 42.81 | 14.24 | 14.38 | 0.258 | 0.258 | |
| 0.4 | 57.15 | 57.20 | 19.71 | 19.85 | 0.257 | 0.257 | |
| 0.5 | 75.74 | 75.81 | 26.83 | 27.06 | 0.262 | 0.262 | |
Table 6.
Effective axial coefficient of thermal expansion predicted by FE and MSG for the four TPMS-based IPC topologies, underlying Figure 4.
Table 6.
Effective axial coefficient of thermal expansion predicted by FE and MSG for the four TPMS-based IPC topologies, underlying Figure 4.
| Topology | [–] | FE [/K] | MSG [/K] |
|---|---|---|---|
| Gyroid | 0.1 | 23.892 | 23.928 |
| 0.2 | 15.811 | 15.827 | |
| 0.3 | 11.286 | 11.316 | |
| 0.4 | 8.369 | 8.398 | |
| 0.5 | 6.255 | 6.255 | |
| Diamond | 0.1 | 23.787 | 23.802 |
| 0.2 | 15.736 | 15.733 | |
| 0.3 | 11.297 | 11.279 | |
| 0.4 | 8.289 | 8.274 | |
| 0.5 | 6.203 | 6.197 | |
| PMY | 0.1 | 24.769 | 24.746 |
| 0.2 | 16.373 | 16.278 | |
| 0.3 | 11.216 | 11.116 | |
| 0.4 | 7.952 | 7.840 | |
| 0.5 | 5.820 | 5.721 | |
| F-RD | 0.1 | 24.181 | 24.246 |
| 0.2 | 16.345 | 16.345 | |
| 0.3 | 11.401 | 11.398 | |
| 0.4 | 8.194 | 8.179 | |
| 0.5 | 5.684 | 5.682 |
Table 7.
Effective axial thermal conductivity predicted by FE and MSG for the four TPMS-based IPC topologies, underlying Figure 5.
Table 7.
Effective axial thermal conductivity predicted by FE and MSG for the four TPMS-based IPC topologies, underlying Figure 5.
| Topology | [–] | FE [W/(m·K)] | MSG [W/(m·K)] |
|---|---|---|---|
| Gyroid | 0.1 | 0.26990 | 0.26995 |
| 0.2 | 0.24421 | 0.24449 | |
| 0.3 | 0.22103 | 0.22132 | |
| 0.4 | 0.20007 | 0.20052 | |
| 0.5 | 0.18045 | 0.18098 | |
| Diamond | 0.1 | 0.26962 | 0.26960 |
| 0.2 | 0.24389 | 0.24393 | |
| 0.3 | 0.22115 | 0.22133 | |
| 0.4 | 0.19957 | 0.19978 | |
| 0.5 | 0.18017 | 0.18034 | |
| PMY | 0.1 | 0.27013 | 0.27007 |
| 0.2 | 0.24395 | 0.24420 | |
| 0.3 | 0.21881 | 0.21903 | |
| 0.4 | 0.19629 | 0.19671 | |
| 0.5 | 0.17654 | 0.17717 | |
| F-RD | 0.1 | 0.26999 | 0.26956 |
| 0.2 | 0.24418 | 0.24415 | |
| 0.3 | 0.21992 | 0.21990 | |
| 0.4 | 0.19785 | 0.19782 | |
| 0.5 | 0.17591 | 0.17590 |
Table 8.
Maximum relative error between MSG and FE predictions over –0.5, by topology.
| Topology | [%] | [%] | [%] | [%] | [%] |
|---|---|---|---|---|---|
| Gyroid | 2.58 | 2.47 | 1.35 | 0.35 | 0.29 |
| Diamond | 0.93 | 0.81 | 0.53 | 0.18 | 0.10 |
| PMY | 1.77 | 1.66 | 0.29 | 1.70 | 0.35 |
| F-RD | 0.25 | 0.97 | 0.16 | 0.27 | 0.16 |
Maximum absolute value of over the five relative densities –0.5 investigated for each topology.
Disclaimer/Publisher’s Note: The statements, opinions and data contained in all publications are solely those of the individual author(s) and contributor(s) and not of MDPI and/or the editor(s). MDPI and/or the editor(s) disclaim responsibility for any injury to people or property resulting from any ideas, methods, instructions or products referred to in the content. |
© 2026 by the authors. Licensee MDPI, Basel, Switzerland. This article is an open access article distributed under the terms and conditions of the Creative Commons Attribution (CC BY) license (http://creativecommons.org/licenses/by/4.0/).
Copyright: This open access article is published under a Creative Commons CC BY 4.0 license, which permit the free download, distribution, and reuse, provided that the author and preprint are cited in any reuse.