

Submitted:
08 October 2026
Posted:
10 October 2026
You are already at the latest version
Abstract
Wetlands are important for water control, carbon storage, biodiversity and climate resilience, but they are difficult to map because their edges are often gradual and mixed with forest, shrubland or upland. The main problem is that many wetland maps use government polygon inventories as if every 10 m pixel inside or outside a polygon were perfectly correct. In practice, pixels near polygon boundaries can be uncertain, and this can affect both model training and accuracy assessment. It should be noted that another practical problem is data preparation: conventional wetland mapping often needs long satellite time series, cloud masking and many processing steps before a model can be trained. In this study, we address these two problems by using a boundary aware 10 m wetland mapping workflow for the 2024 GeoNB LiDAR covered part of New Brunswick, Canada. We used 64 AlphaEarth satellite embedding bands as the main predictor group, together with LiDAR terrain variables and Sentinel 2 spectral bands. We also removed a 20 m zone around wetland polygon edges from training and testing so that uncertain boundary pixels did not control the results. Two models were tested: an ExtraTrees classifier and an Attention U Net segmentation model. The ExtraTrees model reached a wetland F1 score of 75.17% and an overall accuracy of 96.51%. The Attention U Net model reached a wetland F1 score of 75.78% and an overall accuracy of 96.92%. These scores should be read within the evaluation setup used for each model, since the ExtraTrees metrics were computed on the full mapped domain and the Attention U Net metrics were computed on the held out test area. AlphaEarth variables appeared in 19 of the 20 most important ExtraTrees predictors, although these latent variables should not be read as direct physical measurements. The AlphaEarth only Attention U Net result was also close to the LiDAR only result. Both final maps were conservative in area: ExtraTrees mapped 6.75% wetland and Attention U Net mapped 6.38%, compared with the 7.29% buffered reference. On the basis of these results, AlphaEarth embeddings appear to carry useful wetland information while reducing the need for long satellite image collection, cloud masking and compositing. The study also shows that removing uncertain polygon edge pixels gives a clearer and more defensible way to evaluate wetland maps made from government inventory data.
Keywords:
AlphaEarth embeddings
; Satellite embeddings
; Wetland mapping
; LiDAR
; Sentinel-2
; Boundary uncertainty
; Attention U-Net
; ExtraTrees
1. Introduction
In this connection, wetlands matter for hydrology, biodiversity, carbon storage, flood buffering and climate resilience, yet they remain hard to map at high spatial resolution. Their bound-aries are gradual and fragmented, and in forested low-relief landscapes wetlands look spectrally and structurally similar to upland forest, shrubland and saturated terrain. Field in-ventories are expensive, so remote sensing carries most of the load. Sentinel-2 has been widely used because its visible, near-infrared, red-edge and shortwave-infrared bands track vegeta-tion condition and moisture (Kaplan and Avdan, 2017), multi-temporal Sentinel-2 supports wetland vegetation-community mapping (Villa et al., 2021), and Sentinel-1 + Sentinel-2 time series add radar backscatter and inundation dynamics (Slagter et al., 2020, Mohseni et al., 2023, Wang et al., 2023, Hu et al., 2021). Single-source mapping has its limits, however, because wetlands are controlled by both surface hydrology and veget-ation structure. These multi-sensor workflows are also time-consuming to operate: long optical and radar time series must be gathered, cloud-screened, composited and co-registered be-fore any classifier is trained (Liu et al., 2023), and scaling deep models over such Sentinel-2 stacks is itself computationally heavy (Papoutsis et al., 2023). Even cloud-based Google Earth Engine pipelines remain constrained by processing and memory limits for large areas (Sultan et al., 2025), so the cost of build-ing and updating high-resolution wetland maps is dominated by data preparation rather than by classification.
It is pertinent to mention that multi-source fusion is there-fore the dominant direction. For southern New Brunswick, LaRocque et al. combined Landsat 8 OLI, Sentinel-1, ALOS-
1 PALSAR and light detection and ranging (LiDAR) data (LaRocque et al., 2020b); earlier provincial work used Landsat-5 TM, ALOS-PALSAR and Radarsat-2 with Random Forest (LaRocque et al., 2020a, LaRocque et al., 2014). These ef-forts show that optical + radar + LiDAR fusion improves wet-land classification in the province, but they do not test newer latent geospatial embedding features and they do not explicitly handle polygon-boundary uncertainty in the rasterised labels.
It should be noted that LiDAR has been especially useful be-cause it captures terrain, drainage position and canopy struc-ture. Topographic metrics derived from LiDAR digital eleva-tion models (DEMs) improve forested wetland mapping (Lang and McCarty, 2009), and fine-scale airborne laser-scanning metrics can classify wetland-related habitats (Koma et al., 2021, Maxa and Bolstad, 2009). Even so, LiDAR alone struggles to separate flat upland forest, forested wetlands and shrub wet-lands that share similar elevation and canopy-height profiles. Optical imagery adds complementary moisture and vegetation cues. In Alberta, multi-temporal Sentinel-1/2 with LiDAR-derived topographic wetness improved wetland mapping in the Grassland Natural Region (Onojeghuo and Onojeghuo, 2021), integrating Sentinel-1/2 with Global Ecosystem Dynam-ics Investigation (GEDI) structure data further improves clas-sification (Jafarzadeh et al., 2024), combining high-resolution multispectral imagery with LiDAR raises coastal-wetland clas-sification accuracy (Anokye and Hashemi-Beni, 2025), and cloud-based Random Forest workflows on Google Earth Engine have mapped coastal wetland and mangrove change at regional scale (Nguyen et al., 2024). Such methods also underpin global operational land-cover products at 30 m (Liu and Zhang, 2024).
In the same way, recent work pushes towards deep learning and feature-level fusion. Bakkestuen et al. used U-Net on Sentinel-2 plus LiDAR for large-scale wetland delineation in South Nor-way (Bakkestuen et al., 2023). Martins et al. built a deep net-work for open-water wetlands from WorldView-3 plus airborne LiDAR (Martins et al., 2020), and Guo et al. proposed a multi-source feature-embedding and interaction-fusion network for coastal wetlands using hyperspectral and LiDAR data (Guo et al., 2024). Rapinel and Hubert-Moy combined LiDAR with multispectral imagery for wetland habitat mapping (Rapinel et al., 2015), and Wu and Lane integrated LiDAR with multi-temporal aerial imagery to track wetland inundation dynam-ics on Google Earth Engine (Wu et al., 2019, Seyed Mousavi and Akhoondzadeh, 2023). U-Net and deep neural networks can learn spatial patch structure, neighbourhood context and boundary patterns rather than treating each pixel independently, which is advantageous for wetland mapping where wetlands oc-cur as patches, corridors and landscape-context-dependent fea-tures. These workflows demonstrate the value of richer feature spaces, but typically need specialised data, complex architec-tures or heavy preprocessing.
Satellite-derived latent geospatial embeddings offer another direction that removes much of this preprocessing burden. AlphaEarth Foundations distils a full year of multi-sensor ob-servations, including optical, radar, thermal and contextual cues, into a single compact, analysis-ready representation of each pixel. It delivers 64 precomputed latent dimensions at 10 m, so users need not gather, clean, composite or co-register raw image time series (Brown et al., 2025, Google and Google DeepMind, 2025). The steps that make Sentinel-2 and other multi-sensor pipelines time-consuming (Liu et al., 2023, Pa-poutsis et al., 2023, Sultan et al., 2025) are performed once, upstream, inside a globally trained model, and a downstream mapping task reduces to reading an off-the-shelf embedding stack. These representations behave as semantically mean-ingful feature spaces well suited to geospatial learning (Dalei et al., 2025), and Ryan et al. reported that AlphaEarth em-beddings can match traditional multi-sensor wetland-vegetation workflows while producing cleaner maps with minimal prepro-cessing (Ryan et al., 2025). That work addressed wetland ve-getation classification. It did not test the value of embeddings as the principal predictor, combined with LiDAR derivatives and Sentinel-2 bands, for boundary-aware wetland/non-wetland prediction at provincial scale, nor did it evaluate AlphaEarth embeddings within a deep-learning segmentation framework.
It may be noted here that a second persistent problem is reference-label uncertainty. Government wetland inventories are distributed as polygons, but converting polygon edges into a 10 m raster produces mixed-class boundary pixels, especially where wetlands grade into upland forest, shrub or saturated ter-rain. If those edge pixels are treated as exact ground truth, both training and validation become biased: a prediction near a mapped edge can be counted as a false positive or false negat-ive even where the ground is ecologically transitional. Previous work has reported persistent wetland/upland confusion for for-ested, small or transitional wetlands (Maxa and Bolstad, 2009, Lang and McCarty, 2009, Koma et al., 2021), and large-area probabilistic mapping has stressed the need for probability out-puts rather than hard class labels alone (Hird et al., 2017, Souza et al., 2025). Explicitly modelling label and prediction uncer-tainty is increasingly recognised as important for reliable seg-mentation (Landgraf et al., 2024).
Despite the progress made by previous studies, three major gaps remain. First, few studies have evaluated the combined use of airborne LiDAR derivatives, Sentinel-2 multispectral bands and AlphaEarth satellite-derived latent embeddings for 10 m wet-land segmentation, and the comparative contribution of each predictor group within both tree-based and deep-learning clas-sifiers has not been quantified in a boundary-aware framework. Second, most wetland mapping workflows rely on government polygon inventories as reference data but convert them dir-ectly into raster labels, treating every labelled pixel as exact ground truth during both training and evaluation. At 10 m res-olution, pixels along polygon edges frequently contain mixed wetland and non-wetland conditions or represent ecologically transitional zones; treating such pixels as unambiguous ground truth introduces bias into both model training and accuracy re-porting. Third, many wetland mapping studies emphasise over-all accuracy without fully evaluating wetland-specific metrics or the proportion of the landscape classified as wetland. Be-cause wetlands occupy a small fraction of most landscapes, a model can achieve high overall accuracy simply by correctly classifying the dominant non-wetland class while still system-atically overestimating or underestimating wetland extent. A map realism check, comparing predicted and reference wetland area proportions, is therefore a necessary complement to pixel-level accuracy metrics because operational maps are used for area-based decisions.
On the basis of these gaps, this study develops an embedding-centred, boundary-aware 10 m wetland prediction framework for the 2024 LiDAR-covered portion of New Brunswick. The contributions are: (1) an embedding-centred predictor design in which precomputed AlphaEarth dimensions act as the principal feature source, augmented by LiDAR derivatives and Sentinel-2 bands, co-registered at 10 m on the EPSG:2953 grid and avoiding bespoke multi-sensor time-series engineering; (2) a 20 m boundary-uncertainty exclusion zone that removes am-biguous edge pixels from both training and evaluation while keeping core wetland and confident non-wetland pixels; (3) an ExtraTrees ensemble classifier with predictor-importance analysis demonstrating the dominance of AlphaEarth embed-dings; (4) an Attention U-Net segmentation model with a con-trolled predictor-group ablation experiment comparing LiDAR-only, Sentinel-2-only, AlphaEarth-only and full-fusion config-urations; and (5) a direct comparison of both classifiers under identical boundary-aware labels and evaluation protocols, with joint evaluation of pixel-level accuracy and mapped-area real-ism. The resulting framework is evaluated against the GeoNB wetland inventory, and its accuracy, map realism and predictor importance are reported in Section 3.
2. Materials and Methods
2.1. Study Area
For the purposes of the present study, the study area is the por-tion of New Brunswick, Canada where 2024 airborne LiDAR coverage from GeoNB is available (Government of New Brun-swick, 2024a). Restricting the analysis to the LiDAR footprint avoided treating missing-LiDAR regions as valid non-wetland samples. The province contains forested, shrub, open, riparian and peatland wetlands as well as low-relief saturated terrain and surrounding mixed forest, so wetland and non-wetland areas are often gradual and partially obscured by canopy. The modelling domain was created by intersecting the 2024 LiDAR valid-area mask with the rasterised GeoNB Wetlands layer. The original 10 m reference grid contained 166,380,000 pixels, of which 97,232,930 had valid LiDAR coverage (Figure 1). Within that valid area the original rasterised reference contained approxim-ately 11.77% wetland and 88.23% non-wetland pixels before boundary-uncertainty treatment (Figure 2).
2.2. Data Sources
It is pertinent to mention that four geospatial datasets were used: 2024 airborne LiDAR point-cloud data from GeoNB (Government of New Brunswick, 2024a), 2024 Sentinel-2 multispectral imagery (European Space Agency, 2024), 2024 AlphaEarth satellite-derived latent geospatial embeddings (Brown et al., 2025, Google and Google DeepMind, 2025) and the GeoNB Wetlands reference layer (Government of New Brunswick, 2024b) (Table 1). The LiDAR data carry the stand-ard classification categories (ground, low/medium/high vegeta-tion, buildings, model key points, noise), from which 10 m ras-ter predictors of elevation, canopy structure, intensity, hydro-logical position and curvature were generated. The Sentinel-2 predictor stack used 12 bands as a complement to the LiDAR-derived variables. The AlphaEarth stack provided 64 analysis-ready latent dimensions (A00–A63). Each dimension com-presses a full year of multi-sensor satellite observations into a single 10 m embedding and summarises spatial, spectral and landscape-context information that would otherwise require ex-tensive multi-temporal image acquisition and feature engineer-ing. Because the embeddings are distributed as a ready-to-use annual product, they were ingested directly, with no com-positing, cloud-masking or temporal-statistics computation re-quired. The GeoNB Wetlands polygon dataset was rasterised to the 10 m LiDAR-aligned grid, with wetland set to 1 and non-wetland to 0 before boundary-uncertainty processing.
2.3. LiDAR Derivative Generation
In this relation, LiDAR tiles were processed in ArcGIS Pro (Esri Inc., 2024) using ArcPy and Spatial Analyst. All deriv-atives were produced at 10 m in EPSG:2953 (NAD83(CSRS) / New Brunswick Stereographic). The bare-earth DEM was gen-erated from class 2 ground returns using average elevation bin-ning and served as the master grid. The canopy height model (CHM) was the difference between a 10 m digital surface model (DSM, from first and single returns with maximum binning) and the DEM, with negative values set to zero. A 10 m intensity raster used average binning across all returns. Tile-level rasters were mosaicked using last-overlap (DEM), maximum (CHM) and average (intensity) rules.
Terrain curvature was computed from the DEM. The topo-graphic wetness index (TWI) used filled-DEM flow direction and flow accumulation combined with slope, as in Equation (1):
TWI = ln FA + 1 ,
tan(β) + 0.001
where FA is flow accumulation and β is slope in radians; the constant 0.001 prevents division by zero on very flat ground. TWI is a physically grounded predictor for wetland occur-rence because it captures the tendency for flow to accumulate in poorly drained, low-gradient terrain, the landscape position most commonly occupied by wetlands. The final LiDAR pre-dictor stack contains five 10 m rasters: elevation, TWI, canopy height, intensity and curvature.
2.4. Raster Alignment and Preprocessing
It should be noted that all predictors and reference rasters were co-registered to the LiDAR-derived DEM master grid in EPSG:2953. Continuous predictors (elevation, TWI, canopy height, intensity, curvature, Sentinel-2 bands, AlphaEarth di-mensions) used bilinear resampling; categorical rasters (wet-land reference mask, LiDAR valid-area mask, buffered labels) used nearest-neighbour resampling. This guarantees that each training sample represents the same ground location across all predictor groups and the label. A one- or two-pixel shift near a wetland boundary can otherwise change the apparent class of a 10 m pixel.
A valid-area mask flagged the 97,232,930 pixels with com-plete LiDAR coverage; only these pixels entered sampling and evaluation. For the ExtraTrees model, outlier clipping was applied to the LiDAR-derived predictors using percent-ile bounds, because extreme intensity or curvature values can dominate tree-based splits. For the Attention U-Net, isolated artefacts in LiDAR predictors were additionally repaired us-ing local neighbourhood median values calculated from non-outlier neighbouring pixels, to preserve local spatial structure rather than simply truncating values. Final cleaned ranges were: elevation 247.52–523.69 m, TWI 3.82–13.60, canopy height 0.00–27.13 m, intensity 33,192.73–61,536.71 (raw re-turn units), curvature −2.44–2.41. The canopy-height min-imum was left at 0 m because open, shrub and non-forested saturated wetlands legitimately carry little canopy. Sentinel-2 and AlphaEarth tiles extended beyond the LiDAR-covered study area; all training, validation, prediction and evaluation were constrained to pixels with valid LiDAR coverage.
2.5. Boundary-Uncertainty Treatment
As is often the case with polygon inventories, polygon-to-raster conversion produces uncertain wetland-edge pixels. A 20 m ex-clusion zone (two 10 m pixels) was created around each raster-ised wetland boundary. Pixels inside that zone were assigned class 255 and excluded from sampling, training, threshold se-lection, accuracy assessment and final map evaluation. The res-ulting boundary-aware reference carries three classes: 1 (core wetland), 0 (confident non-wetland) and 255 (uncertain bound-ary). Before the exclusion, 96,854,976 pixels had a com-plete predictor stack across all sources (slightly fewer than the 97,232,930 LiDAR-valid pixels, as cells lacking full Sentinel-2 or AlphaEarth coverage were dropped), comprising 11,395,605 wetland and 85,459,371 non-wetland pixels (11.77% wetland). After the exclusion, 85,299,502 pixels remained, comprising 6,216,473 core wetland and 79,083,029 confident non-wetland pixels (7.29% wetland), and 11,555,474 boundary pixels were removed (Table 2, Figure 3).
2.6. Sampling and Spatial Split
Needless to say, two complementary sampling strategies were used, one tailored to each classifier. For the ExtraTrees en-semble, a class-prevalence-aware pixel sampling strategy was adopted because the core-wetland share was only 7.29%. An earlier balanced 50:50 experiment gave high sample-based ac-curacy but severely overpredicted wetlands across the full area, confirming that balanced sampling distorts map-level outputs in this landscape. The selection of a realistic class ratio for training follows from the observation that balanced sampling overrepresents wetlands by a factor of roughly four to six relat-ive to their true landscape prevalence, which causes the model to assign elevated wetland probabilities to non-wetland terrain features in the full map. The final ExtraTrees training sample drew approximately 40,000 core wetland and 460,000 confident non-wetland pixels from the buffered reference (about 8% wet-land), preserving a realistic class imbalance. Samples were par-titioned using spatial block-based validation, in which contigu-ous blocks, rather than individual pixels, are assigned wholly to training or validation, to reduce spatial autocorrelation between training and evaluation sets.
For the Attention U-Net, training samples were extracted as 128×128 pixel patches from the aligned raster stack. Each full-fusion patch contained 81 input channels: five LiDAR-derived predictors, 12 Sentinel-2 bands and 64 AlphaEarth embedding dimensions. Each patch was accompanied by a corresponding label raster and a valid-pixel mask. Patches were accepted only when a sufficient proportion of pixels contained valid LiDAR coverage and valid boundary-aware labels. Training, valida-tion and test sets were separated spatially using row-based split-ting, which reduces the risk of evaluating the model on pixels spatially adjacent to training samples. Patch-based sampling without a spatial split can allow a model to memorise the neigh-bourhood structure of specific locations rather than generalising across the landscape, which is particularly problematic at 10 m resolution where adjacent patches share geographically similar terrain and vegetation conditions.
2.7. ExtraTrees Classifier
In this connection, wetland prediction with the ExtraTrees ap-proach used an Extremely Randomised Trees ensemble (Geurts et al., 2006) implemented in scikit-learn (Pedregosa et al., 2011), on top of NumPy (Harris et al., 2020) and Rasterio (Gil-lies et al., 2013–) for I/O, with Matplotlib (Hunter, 2007) for figures. ExtraTrees was chosen for its ability to handle nonlin-ear relationships, mixed predictor types and high-dimensional feature spaces without normality or linearity assumptions, in line with the strong performance of tree-based ensembles for remote-sensing land-cover classification (Sharma et al., 2025, Du et al., 2015). The ensemble used 500 trees with the de-fault scikit-learn settings (Gini splitting, square-root feature sampling per split, no depth limit) and a fixed random seed for reproducibility. Because ExtraTrees uses fully random rather than optimised split thresholds at each node, the resulting en-semble is generally less prone to overfitting on individual pre-dictor values than standard Random Forests, which is advant-ageous in a high-dimensional predictor space such as the 81-channel fusion stack. Wetland was the positive class. Three stages were compared: (i) a LiDAR-only baseline using the five LiDAR predictors; (ii) full LiDAR + Sentinel-2 + AlphaEarth fusion using the original hard rasterised labels; and (iii) the same fusion model trained and evaluated on the 20 m boundary-aware labels. The end-to-end ExtraTrees workflow is shown in Figure 4.
2.8. Attention U-Net Model Development
It may be argued that wetland segmentation was additionally performed using Attention U-Net, a convolutional semantic segmentation architecture that extends the standard encoder–decoder U-Net with soft spatial attention gates (Aburaed et al., 2023). Attention U-Net was selected because wetland mapping is a spatial segmentation problem: wetlands occur as patches, corridors, margins and landscape-context-dependent features rather than as independent pixels. Unlike the pixel-wise Ex-traTrees classifier, which treats each pixel independently based on its local predictor values, the Attention U-Net processes spatial patches and implicitly encodes neighbourhood relation-ships, spatial gradients and contextual information across tens to hundreds of metres. This is relevant for wetland mapping be-cause wetland patches, edges and corridors carry characteristic spatial signatures, such as elongated riparian forms, clustered peatland complexes and gradual ecotonal fringes, that pixel-wise classifiers cannot capture without explicit spatial feature engineering.
The attention gate mechanism applies soft spatial weights to the encoder-to-decoder skip connections, allowing the network to selectively emphasise feature responses from wetland-likely regions while suppressing irrelevant background features. This is particularly valuable in the high-dimensional predictor stack used here, where 64 latent embedding dimensions are present alongside terrain and spectral inputs, and the attention mechan-ism can allocate representational capacity to the most wetland-discriminative spatial patterns without manual feature selection.
Four configurations were trained in a controlled ablation ex-periment: (i) LiDAR-only: five LiDAR-derived predictors (5 channels); (ii) Sentinel-2-only: 12 spectral bands (12 chan-nels); (iii) AlphaEarth-only: 64 embedding dimensions (64 channels); (iv) full fusion: LiDAR + Sentinel-2 + AlphaEarth (81 channels). All four configurations used the same patch locations, training/validation/test spatial split, boundary-aware labels and evaluation metrics, making observed performance differences attributable to predictor-group contribution rather than sampling differences. The model was trained using a combined masked binary cross-entropy and Dice loss. Bin-ary cross-entropy alone tends to be dominated by the majority non-wetland class, which can suppress gradient signals related to wetland pixels; the Dice loss component directly optimises the overlap between predicted and reference wetland masks, providing a complementary objective that is more sensitive to wetland recall. Pixels labelled 255 (uncertain boundary) were masked and ignored during loss computation. Wetland was the positive class. Model outputs were continuous wetland prob-ability maps; binary wetland classification maps were derived through threshold optimisation (Section 2.9). The Attention U-Net workflow is shown in Figure 5.
cross-entropy and Dice loss while ignoring boundary-uncertain pixels (class 255). Threshold optimisation produces the final probability and binary wetland maps.
2.9. Threshold Optimisation and Accuracy Assessment
On the basis of the validation design, because the default prob-ability cutoff of 0.50 is not appropriate for a minority class, probability thresholds were optimised separately for each clas-sifier. For the ExtraTrees models, thresholds from 0.10 to
0.75 in steps of 0.05 were tested on the validation split, each scored on wetland precision, recall, F1-score, IoU, overall ac-curacy and predicted wetland proportion. For the hard-label ExtraTrees fusion model, 0.30 gave the best balance, producing a predicted wetland proportion of 12.66% against the 11.77% original reference. For the boundary-aware ExtraTrees fusion model the optimum was 0.35. On the validation split, this threshold gave 79.39% precision, 70.45% recall, 74.65% F1-score and 59.56% IoU, with a 7.04% predicted wetland propor-tion against the 7.29% buffered reference (Figure 6).
For the Attention U-Net models, thresholds from 0.20 to 0.80 were tested on the validation split. The full-fusion Attention U-Net selected a threshold of 0.80, which is notably higher than the ExtraTrees optimum and reflects a fundamental dif-ference in the probability distributions produced by the two model architectures. Tree-based ensemble classifiers typically produce probability estimates spread across a wide range, in-cluding moderate values for uncertain pixels. Deep neural net-works trained with binary cross-entropy and Dice loss tend to produce more polarised outputs, concentrating high wetland probability only in pixels where the model is highly confid-ent. In the validation sweep, the stricter threshold of 0.80 gave the best F1/IoU balance for the full-fusion network, because it removed many moderate-probability false positives while re-taining enough high-confidence wetland pixels to keep the pre-dicted extent close to the buffered reference.
boundary-aware fusion model (optimum near 0.35), the configuration adopted for the final ExtraTrees map.
Accuracy used confusion-matrix metrics with wetland as the positive class, defined in Equation (3):
P = T P , R = T P ,
F1 = 2 P R , IoU = TP .
P+R TP +FP +FN
3. Results
3.1. Boundary-Aware Reference-Label Availability
It may be noted here that the 20 m boundary exclusion sub-stantially changed the available reference labels and the ap-parent wetland prevalence (Table 2). Before exclusion, wet-lands represented 11.77% of the valid LiDAR-covered refer-ence area; after exclusion the retained core-wetland proportion was 7.29%. A total of 11,555,474 pixels were assigned to the uncertain boundary class and removed. Of these, 5,179,132 pixels were originally labelled as wetland (the wetland edge pixels just inside polygon boundaries) and 6,376,342 were ori-ginally labelled as non-wetland (the upland pixels immediately adjacent to polygon edges). The reduction in wetland percent-age from 11.77% to 7.29% reflects the high spatial density of wetland boundaries in the GeoNB inventory, which contains many small, fragmented patches and linear riparian corridors that are disproportionately affected by a two-pixel buffer. These boundary-aware labels were used for all subsequent sampling, training, threshold optimisation and accuracy assessment.
3.2. Effect of Multi-Source Fusion (ExtraTrees)
In spite of this limitation, the LiDAR-only ExtraTrees baseline reached a wetland F1-score of 0.425 and an IoU of 0.270 at threshold 0.25 (Table 3), so terrain and canopy variables on their own captured useful but limited wetland information. The hard-label LiDAR + Sentinel-2 + AlphaEarth fusion model reached 0.920 overall accuracy, 0.648 precision, 0.698 recall,
0.672 F1-score and 0.506 IoU at threshold 0.30, with 12.66% predicted wetland against an 11.77% reference share. Under the boundary-aware labels, the same fusion model scored 0.965 overall accuracy, 0.781 precision, 0.724 recall, 0.752 F1-score and 0.602 IoU at threshold 0.35 (Figure 7). Together, predictor fusion and boundary-uncertainty treatment produced the most reliable and spatially realistic ExtraTrees wetland prediction.
Reporting precision, recall and F1-score, rather than overall accuracy alone, follows recommended practice for evaluating sampled remote-sensing classifications (Rangongo et al., 2024). Because non-wetland pixels dominated the landscape, overall accuracy alone was not interpreted as the primary performance indicator. Map-level realism was additionally checked by com-paring the predicted wetland proportion with the buffered refer-ence proportion.
TP +FP TP +FN
F1 = 2 P R, IoU = T P .
P+R TP +FP +FN
3.3. Final Map Production
It may be noted here that the boundary-aware fusion model for each classifier was applied to the full valid 2024 LiDAR-covered domain, producing a continuous 10 m wetland prob-ability raster and, after thresholding, a binary wetland classi-fication raster. Pixels outside the LiDAR footprint or inside the 20 m boundary zone were assigned NoData in the evalu-ation step. Both probability and binary products were produced for each classifier, giving users the option to apply alternative thresholds according to their application-specific requirements.
LiDAR + Sentinel-2 + AlphaEarth fusion (hard labels) and the same fusion under 20 m boundary-aware labels, for overall accuracy, wetland precision, recall, F1-score and IoU. Wetland-specific metrics rise sharply once the embeddings are added and again under boundary-aware evaluation.
3.4. Effect of Boundary-Uncertainty Treatment
The hard-label ExtraTrees fusion model achieved a 0.672 F1-score and a 0.506 IoU; on the boundary-aware reference the same model scored 0.752 and 0.602. These values are not dir-ectly comparable because the evaluation domain itself changed when the 20 m boundary zone was removed. The point is not that every wetland edge was mapped more accurately, but that the model is assessed more defensibly when the most ambigu-ous pixels are set aside. The boundary-aware evaluation focuses on the model’s ability to correctly classify pixels that are con-fidently labelled as either core wetland or definite non-wetland, which represents a cleaner test of classifier performance. Map-level realism also held: the predicted wetland proportion under the boundary-aware evaluation was 6.75% against the 7.29% buffered reference, a difference of −4,548.9 ha.

Table 3.
Accuracy and mapped-area comparison across the three ExtraTrees modelling stages, each at its optimised threshold (Thr.). Metrics are overall accuracy (Acc.), wetland precision (P), recall (R), F1-score and IoU; ground-truth (GT) and predicted (Pred) wetland percentages and the wetland area difference (∆ ha) summarise map realism. “Fusion” denotes the.
| LiDAR + Sentinel-2 + AlphaEarth predictor stack. | |||||||||
| Model | Labels | Thr. | Acc. | P | R | F1 | IoU | GT/Pred % | ∆ ha |
| LiDAR-only | Hard | 0.25 | 0.863 | 0.420 | 0.431 | 0.425 | 0.270 | 11.77 / 12.07 | +2,987.7 |
| Fusion | Hard | 0.30 | 0.920 | 0.648 | 0.698 | 0.672 | 0.506 | 11.77 / 12.66 | +8,689.7 |
| Fusion | 20 m buffered | 0.35 | 0.965 | 0.781 | 0.724 | 0.752 | 0.602 | 7.29 / 6.75 | −4,548.9 |
3.5. ExtraTrees Final Accuracy and Map
On the basis of the threshold search, the final boundary-aware ExtraTrees model used threshold 0.35 and was evaluated on 85,299,502 pixels (Table 4). The confusion matrix gives TP = 4,502,056, TN = 77,823,497, FP = 1,259,532 and FN =
1,714,417. Overall accuracy is 96.51%, wetland precision 78.14%, recall 72.42%, F1-score 75.17% and IoU 60.22%. The predicted wetland area is 57,615.88 ha against a buffered refer-ence area of 62,164.73 ha, a difference of −4,548.85 ha (6.75% vs 7.29% reference). The model maintains relatively low com-mission while detecting most core wetland pixels, indicating that the embedding-dominated predictor stack drove spatially realistic classification. The probability and binary products are shown in Figure 8.
Table 4.
Summary of the boundary-aware ExtraTrees fusion model at threshold 0.35, with its confusion-matrix counts, wetland-specific accuracy metrics and.
Table 4.
Summary of the boundary-aware ExtraTrees fusion model at threshold 0.35, with its confusion-matrix counts, wetland-specific accuracy metrics and.
| predicted-versus-reference wetland area | |
| Metric | Value |
| Selected model | ExtraTrees ensemble |
| Predictors | LiDAR + S2 + AlphaEarth |
| Selected threshold | 0.35 |
| Valid evaluated pixels | 85,299,502 |
| Buffered ref. wetland % | 7.29 |
| Predicted wetland % | 6.75 |
| Buffered ref. area (ha) | 62,164.73 Predicted wetland area (ha) 57,615.88 Area |
| difference (ha) | −4,548.85 |
| Overall accuracy | 96.51% |
| Wetland precision | 78.14% |
| Wetland recall | 72.42% |
| Wetland F1-score | 75.17% |
| Wetland IoU | 60.22% |
| TP / TN | 4,502,056 / 77,823,497 |
| FP / FN | 1,259,532 / 1,714,417 |
3.6. Predictor Importance: Dominance of AlphaEarth Embeddings
It is in this context that feature importance in the final Ex-traTrees model was concentrated in the AlphaEarth embeddings
LiDAR + Sentinel-2 + AlphaEarth model, in EPSG:2953 coordinates. Left: continuous wetland probability (colour bar 0–1). Right: binary wetland classification (wetland in green) after thresholding at 0.35. Pixels outside the LiDAR footprint are shown as NoData.
(Figure 9). The five highest-ranked predictors were all embed-ding dimensions (A22, A08, A03, A04 and A17), and embed-dings accounted for 19 of the top 20 positions; LiDAR intensity was the only non-embedding predictor to appear (rank 20), and no Sentinel-2 band reached the top 20. Although the LiDAR and Sentinel-2 layers remained useful, the embeddings sup-plied most of the model’s discriminative power. These dimen-sions are latent features and should not be read as individual physical variables; their collective importance indicates that the embeddings already encode much of the multi-sensor and con-textual landscape information that wetland discrimination re-quires. Impurity-based importance tends to favour numerous continuous features such as the 64 embedding dimensions, so the ranking reflects relative influence within this model rather than a controlled measure of marginal accuracy gain per pre-dictor group. For context, the LiDAR-only model ranked TWI, canopy height, intensity and curvature as its main contributors, consistent with the role of hydrological position and canopy structure in wetland occurrence.
3.7. Attention U-Net Ablation Performance
The ablation experiment demonstrated that the full multi-source fusion model produced the strongest wetland segmentation across all evaluated metrics (Table 5, Figure 10). The Sentinel-2-only configuration had the weakest performance, achieving 58.14% F1-score and 40.98% IoU, confirming that spectral re-flectance alone was insufficient for reliable wetland detection in this forested and topographically complex landscape where canopy cover and spectral similarity between wetland and up-land vegetation limit class separability. The LiDAR-only con-figuration achieved 70.22% F1-score and 54.10% IoU, a sub-stantial improvement that reflects the strong physical controls of terrain, drainage and canopy structure on wetland occur-rence. The AlphaEarth-only configuration performed simil-arly to the LiDAR-only model, achieving 69.68% F1-score and non-embedding feature to enter the list (rank 20), and no Sentinel-2 band reaches the top 20.53.45% IoU, which indicates that the latent embedding dimen-sions encode landscape information closely related to, though not identical to, the terrain and canopy structure captured by LiDAR. The full LiDAR–Sentinel-2–AlphaEarth fusion model achieved the strongest result with 96.92% accuracy, 84.19% precision, 68.90% recall, 75.78% F1-score and 61.01% IoU, confirming that the three predictor groups contribute comple-mentary information that is not fully captured by any single source.
3.8. Attention U-Net Threshold Sensitivity
Threshold testing showed that all Attention U-Net configura-tions were sensitive to the chosen probability cutoff, and that the correct threshold differed substantially from both the con-ventional 0.50 default and the ExtraTrees optimum of 0.35. The full-fusion model maintained the highest IoU across the tested range and peaked near the selected validation threshold of 0.80. The LiDAR-only and AlphaEarth-only configurations produced intermediate performance, while the Sentinel-2-only config-uration remained consistently lower at all thresholds tested. The precision–recall analysis showed that the full-fusion model achieved the best overall trade-off between wetland omission and commission errors, maintaining higher precision at com-parable recall levels relative to all single-source configurations (Figure 11). The threshold sensitivity curves for the Attention U-Net showed steeper IoU-versus-threshold relationships than those observed for ExtraTrees, consistent with the more po-larised probability distribution produced by the deep-learning model.
multi-source fusion model achieves the highest performance on both metrics, while the Sentinel-2-only configuration is consistently the weakest. LiDAR-only and AlphaEarth-only models perform similarly, each substantially below the full-fusion level.
Figure 10.
Attention U-Net ablation performance across the four predictor configurations for F1-score and IoU. The full.
Figure 10.
Attention U-Net ablation performance across the four predictor configurations for F1-score and IoU. The full.
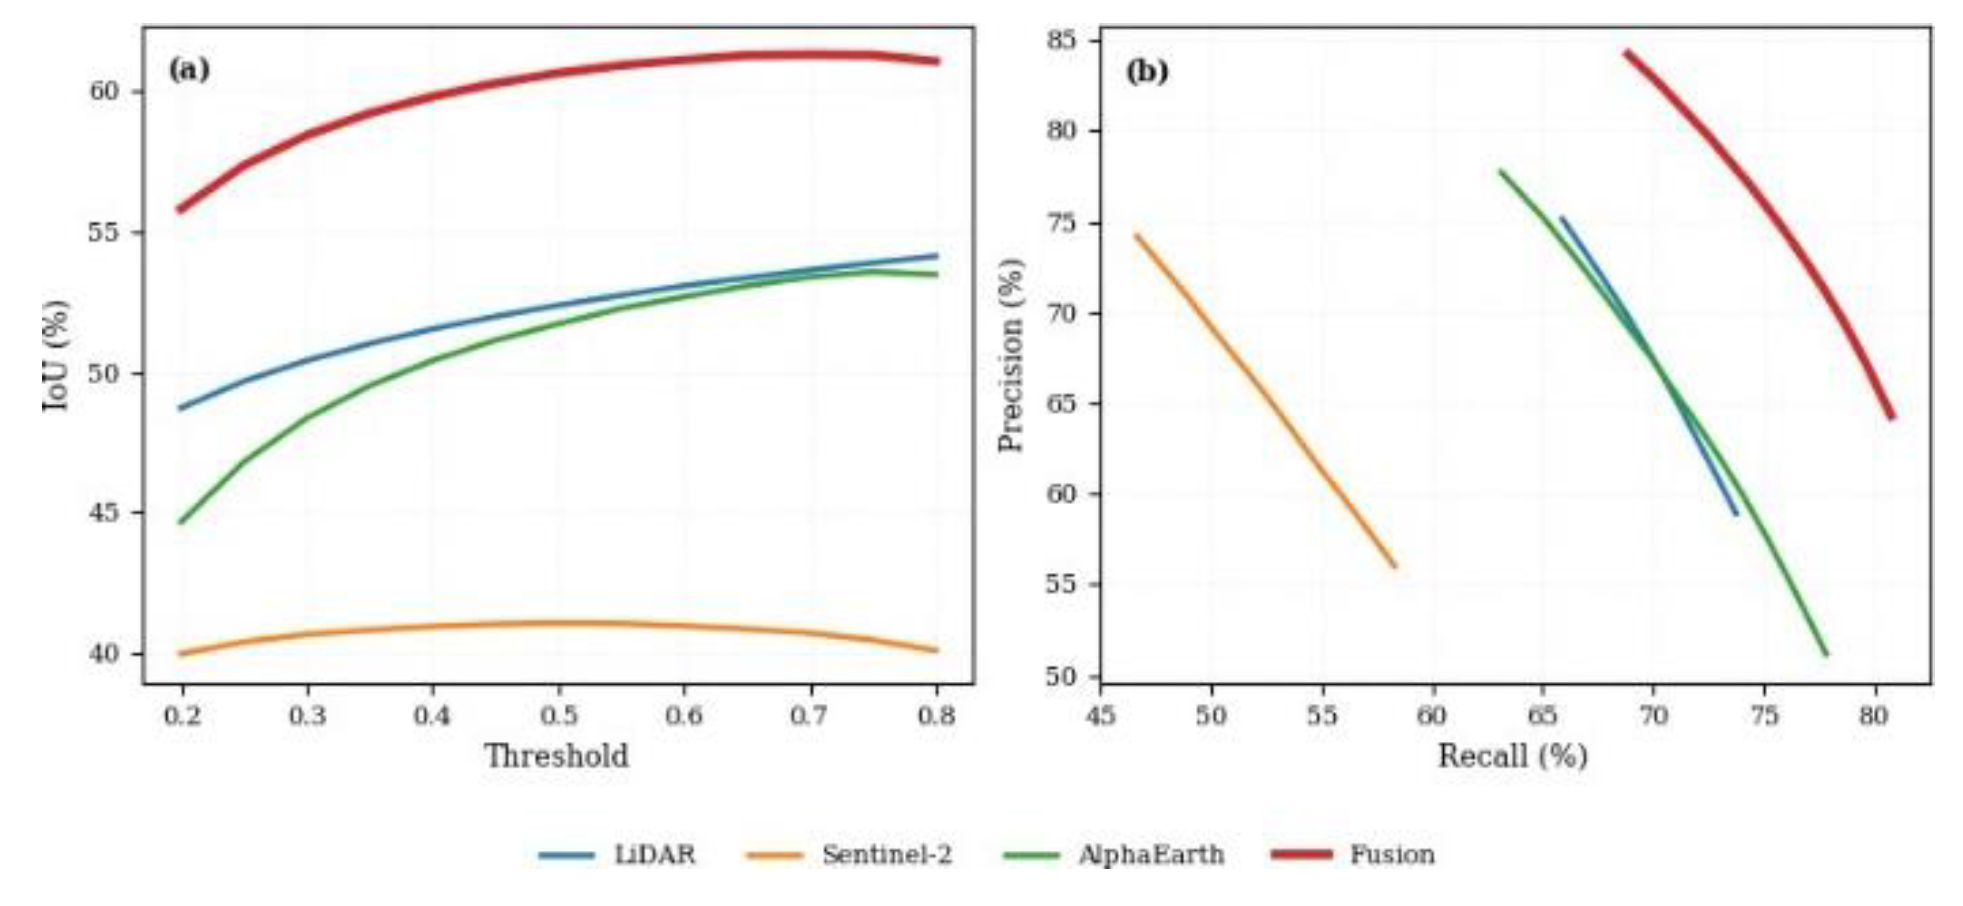
Figure 11. Threshold sensitivity and precision–recall trade-off of the four Attention U-Net predictor configurations. The.
full-fusion model consistently achieves the highest IoU across thresholds and exhibits the strongest precision–recall balance.
3.9. Attention U-Net Final Accuracy and Map
The final selected Attention U-Net model was the boundary-aware full-fusion configuration at threshold 0.80. On the test set, the model correctly classified 5,310,694 non-wetland pixels and 277,980 wetland pixels, with 52,197 false-positive and 125,469 false-negative wetland pixels (Table 6). The model achieved 96.92% accuracy, 84.19% wetland precision, 68.90% recall, 75.78% F1-score and 61.01% IoU. The model was there-fore conservative: it reduced false wetland predictions but missed some true wetland pixels, with a false-negative rate con-siderably higher than the false-positive rate.
When applied to the full valid 2024 LiDAR-covered area, the Attention U-Net predicted 5,444,230 wetland pixels (79,855,272 non-wetland) from 85,299,502 valid evaluated pixels, corresponding to a predicted wetland proportion of 6.38% and a predicted wetland area of 54,442.30 ha (Table 7). This is slightly conservative relative to the 7.29% buffered ref-erence proportion, consistent with the model’s high-precision, lower-recall behaviour at threshold 0.80. The final probability and binary maps are shown in Figure 12.
3.10. Comparison of ExtraTrees and Attention U-Net
The Attention U-Net full-fusion model slightly outperformed the ExtraTrees fusion model in both F1-score and IoU (Table 8).
Figure 12.
Final 10 m Attention U-Net wetland products for the 2024 LiDAR-covered study area generated by the.
Figure 12.
Final 10 m Attention U-Net wetland products for the 2024 LiDAR-covered study area generated by the.
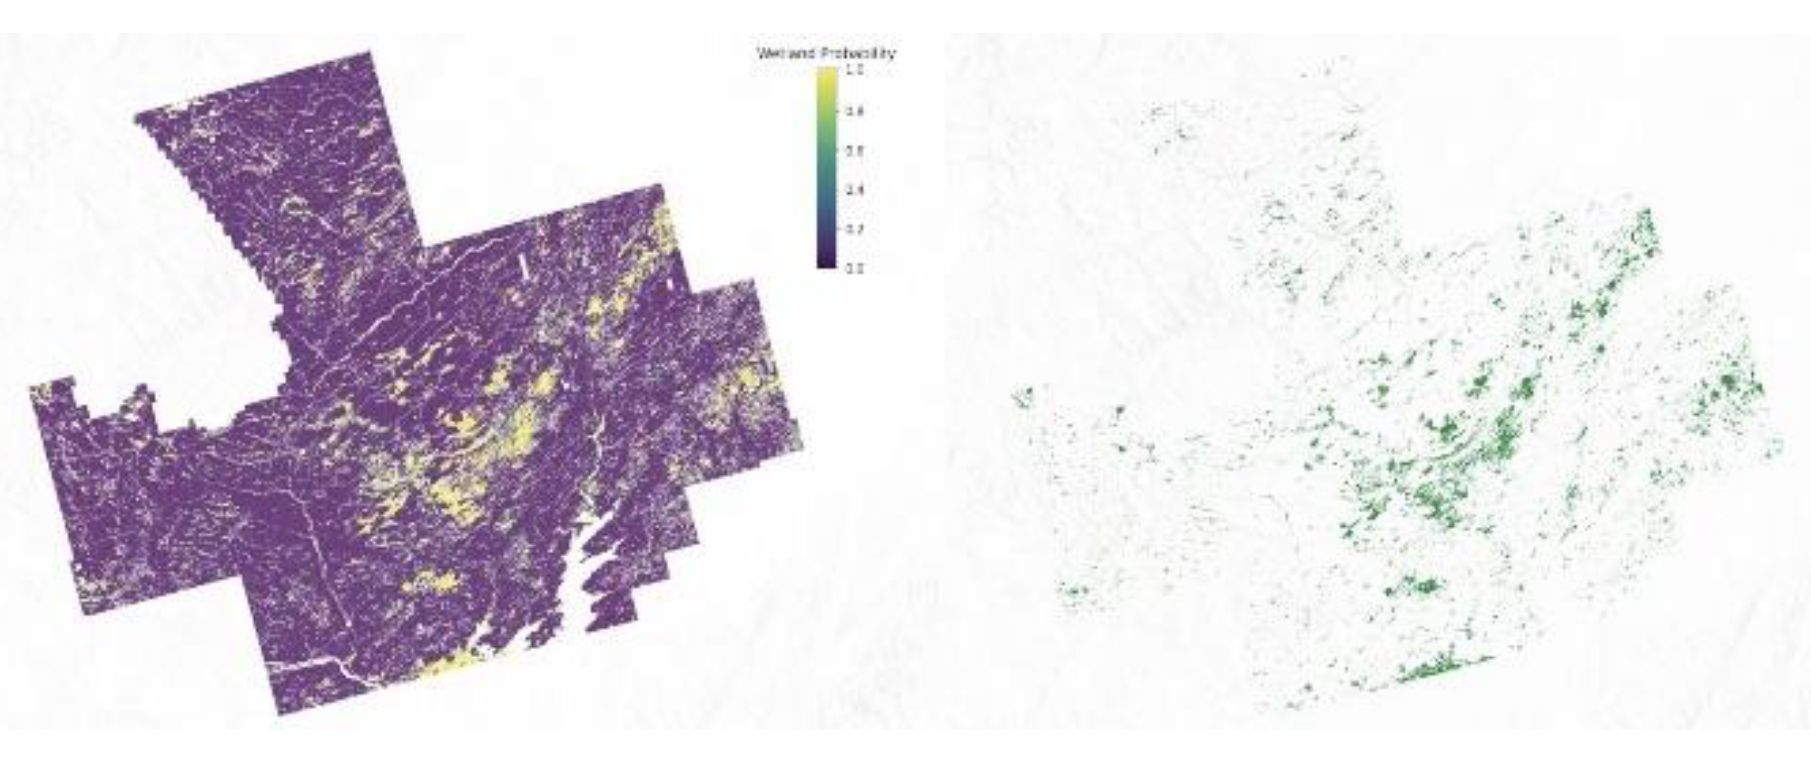
boundary-aware full-fusion model. Left: Continuous wetland probability map (0–1). Right: Binary wetland classification obtained using the optimal threshold of 0.80, with predicted wetland areas shown in green. Areas outside the LiDAR footprint are displayed as NoData.
ExtraTrees achieved 75.17% F1-score and 60.22% IoU evalu-ated on the full 85.3 M-pixel domain, while Attention U-Net achieved 75.78% F1-score and 61.01% IoU on its test set (ap-proximately 5.8 M pixels). Direct metric comparison should be interpreted with care because the evaluation domains dif-fer in size; full-raster wetland area statistics, derived from ap-plying each model to the complete valid domain, are more directly comparable. Both classifiers produced conservative full-raster maps relative to the 7.29% buffered reference: Ex-traTrees predicted 6.75% (57,615.88 ha) and Attention U-Net predicted 6.38% (54,442.30 ha). The Attention U-Net achieved higher wetland precision (84.19% vs 78.14%) but lower recall (68.90% vs 72.42%), indicating a more conservative detection behaviour that generates fewer false positives at the cost of missing more true wetland pixels.
3. Discussion
3.1. Advancing Previous Wetland Mapping Work
It may be argued that this study advances the body of previ-ous New Brunswick and Canadian wetland mapping research in several ways. Earlier provincial studies combined Landsat, ALOS-PALSAR, Radarsat-2 and LiDAR with Random Forest and demonstrated the value of multi-source fusion (LaRocque et al., 2020b, LaRocque et al., 2020a, LaRocque et al., 2014). The present work extends this line of enquiry in three specific directions. First, it introduces 64-dimensional AlphaEarth lat-ent geospatial embeddings as the dominant predictor group in a provincial wetland segmentation framework, combined with LiDAR derivatives and Sentinel-2 bands, and shows that this precomputed embedding stack replaces the multi-temporal im-age acquisition and feature engineering that conventional op-tical and radar workflows require. Second, it explicitly treats polygon-boundary uncertainty rather than assuming rasterised government wetland polygons are exact pixel-level labels, en-abling a more defensible accuracy assessment that previous New Brunswick and Canadian wetland mapping studies have not applied. Third, it uses a controlled ablation experiment with an Attention U-Net to directly quantify the contribution of each predictor group, and provides a direct comparison of tree-based and deep-learning classifiers under identical boundary-aware evaluation conditions. The combined evidence demonstrates that wetland mapping benefits from complementary physical, spectral and latent geospatial information, and that the pre-processing burden of conventional multi-sensor workflows can be substantially reduced by incorporating AlphaEarth embed-dings.
3.2. Multi-Source Fusion
Needless to say, the LiDAR-only ExtraTrees baseline (F1 = 0.425, IoU = 0.270) shows that terrain, hydrology and can-opy structure carry useful but incomplete information. Adding Sentinel-2 spectral bands and AlphaEarth embeddings raised ExtraTrees F1 to 0.672 under hard labels and 0.752 un-der boundary-aware labels. The Attention U-Net ablation confirmed and independently corroborated this finding: the LiDAR-only (70.22% F1, 54.10% IoU) and AlphaEarth-only (69.68% F1, 53.45% IoU) configurations both improved sub-stantially in the full-fusion configuration (75.78% F1, 61.01% IoU). Across both classifiers, multi-source fusion consist-ently improved wetland segmentation relative to single-source baselines, in line with the broader literature (LaRocque et al., 2020b, Onojeghuo and Onojeghuo, 2021, Rapinel et al., 2015, Wu et al., 2019, Jafarzadeh et al., 2024, Slagter et al., 2020, Hird et al., 2017, Anokye and Hashemi-Beni, 2025, Liu et al., 2023). The Sentinel-2-only Attention U-Net configuration (58.14% F1, 40.98% IoU) was the weakest single-source result, suggest-ing that spectral information alone was insufficient to discrim-inate wetland and upland in this forested, low-relief landscape where canopy phenology and spectral similarity between veget-ation types reduce class separability.
3.3.. Role of LiDAR Derivatives
It is pertinent to mention that TWI was particularly important in the LiDAR-only ExtraTrees model, which is expected be-cause wetlands tend to occupy low-gradient, poorly drained, flow-accumulating terrain. Curvature captured local concav-ity and convexity, while canopy height helped separate open and shrub wetlands from forested uplands. These findings echo earlier work showing that LiDAR-derived topographic metrics substantially improve forested wetland mapping (Lang and Mc-Carty, 2009, Maxa and Bolstad, 2009) and that high-resolution LiDAR improves wetland classification in northern landscapes (Koma et al., 2021). LiDAR-derived TWI and slope position have been identified as key predictors for separating forested wetland from upland in Canadian boreal settings (Lang and McCarty, 2009), and the present results support this finding in the Acadian mixed-forest context of New Brunswick. The At-tention U-Net LiDAR-only configuration (70.22% F1) substan-tially outperformed the Sentinel-2-only model (58.14% F1), confirming that LiDAR-derived structural and topographic in-formation is the strongest single predictor group for wetland discrimination in this landscape. The near-equal performance of LiDAR-only and AlphaEarth-only Attention U-Net configur-ations suggests that the embeddings and terrain predictors en-code overlapping but not identical information about wetland occurrence, which explains why combining all three predictor groups produced the largest performance gain.
3.4. AlphaEarth Embeddings as the Leading Predictor
In this connection, a main finding of this study is the extent to which AlphaEarth embeddings dominated the ExtraTrees pre-dictor importance (Figure 9): the embeddings occupied 19 of the top 20 ranked predictors, ahead of all Sentinel-2 and nearly all LiDAR predictors. In the Attention U-Net ablation, the AlphaEarth-only configuration (69.68% F1, 53.45% IoU) per-formed comparably to the LiDAR-only configuration (70.22% F1, 54.10% IoU), indicating that the latent dimensions encode landscape context relevant to wetland occurrence even without explicit terrain or spectral inputs. Because individual AlphaE-arth dimensions are latent features generated by a globally trained multi-sensor model, they cannot be interpreted as direct physical variables such as moisture index or topographic posi-tion. Their value lies in their collective ability to encode spa-tial context, seasonal dynamics, land cover heterogeneity and multi-sensor spectral variation that the globally trained embed-ding model has already distilled from a full year of multi-sensor observations. The 64 dimensions therefore act as a compressed representation of the landscape information that conventional wetland workflows would derive separately from optical time series, radar backscatter stacks and terrain analysis. The fu-sion model improved over the AlphaEarth-only configuration in both classifiers, confirming that embeddings are comple-mentary to LiDAR and Sentinel-2 rather than substituting for them. LiDAR provides physical terrain and canopy structure that the embedding model may not encode at the same spatial resolution or specificity, and Sentinel-2 contributes current-year spectral moisture and vegetation signals at known wavelengths. This supports the conclusion that geospatial foundation model embeddings enhance environmental mapping most when com-bined with physically interpretable predictors, rather than repla-cing the full predictor stack. These results build on (Ryan et al.,
2025) and extend the evidence to boundary-aware wetland/non-wetland prediction and to a deep-learning segmentation frame-work.
3.5. Boundary-Uncertainty Treatment
It should be noted that a central methodological contribution is the explicit exclusion of ambiguous wetland-edge pixels from both training and evaluation. Treating rasterised poly-gon edges as exact ground truth penalises ecologically reason-able predictions wherever the underlying boundary is gradual. The 20 m exclusion produces a more conservative reference set and a more defensible evaluation for both the ExtraTrees and Attention U-Net models. The reduction of wetland per-centage from 11.77% to 7.29% after the 20 m exclusion re-flects the high spatial density of wetland boundaries in the GeoNB inventory, which contains many small, fragmented patches and linear riparian corridors that are disproportionately affected by a two-pixel buffer. Of the 11,555,474 boundary pixels removed, 5,179,132 were originally labelled as wetland and 6,376,342 as non-wetland, so the exclusion affected both classes. The boundary-aware evaluation should be interpreted carefully: metric gains do not mean every wetland edge was mapped more accurately. Rather, they indicate that the mod-els perform more reliably on pixels that are less likely to be ecologically ambiguous, and that conventional accuracy assess-ment penalises predictions near uncertain polygon boundaries in ways that the boundary-aware design avoids. This provides a sounder basis for inter-study comparison and for communic-ating map reliability to operational users.
3.6. Conservative Behaviour of Attention U-Net
As is often the case with minority-class segmentation, the high-precision, lower-recall profile of the Attention U-Net warrants specific discussion. The selection of a probability threshold of 0.80 for the final binary map means that wetland was pre-dicted only at pixels where the network assigned a probabil-ity of at least 0.80, reflecting a conservative decision boundary. This behaviour arises from the polarised probability distribu-tion of the trained network, in which high wetland probabilities are concentrated in the most unambiguous wetland pixels, per-manently saturated terrain with characteristic canopy structure, low elevation and high TWI, while transitional and seasonally variable wetland pixels receive intermediate probabilities that fall below the selected threshold. The practical consequence is that the Attention U-Net map prioritises precision: 84.19% of predicted wetland pixels were confirmed as wetland, while ap-proximately 28.58% of true wetland pixels were missed. This conservative behaviour may be desirable in applications where false wetland identification carries regulatory or financial con-sequences, or where predicted wetland pixels will be prioritised for field verification with limited survey resources. However, where the objective is to identify the full extent of potential wetland habitat for conservation screening or hydrological con-nectivity analysis, a lower threshold, for example 0.60 or 0.50, can be applied to the continuous probability product to recover missed wetland pixels at the cost of a higher commission rate. The availability of the continuous probability raster alongside the binary product therefore provides operational flexibility that a fixed-threshold map alone does not offer.
3.7. Attention U-Net versus ExtraTrees
In the same way, the Attention U-Net slightly outperformed Ex-traTrees in F1-score (75.78% vs 75.17%) and IoU (61.01% vs 60.22%). The primary advantage of the deep-learning model was higher wetland precision (84.19% vs 78.14%), which re-duced commission errors in the full-raster map. ExtraTrees achieved higher recall (72.42% vs 68.90%) and a predicted wet-land extent somewhat closer to the buffered reference. The modest performance gap raises the question of when spatial deep learning offers a clear advantage over tree-based pixel classifiers. ExtraTrees benefits from interpretability through feature importance rankings, does not require spatial patch sampling or GPU hardware, and can be retrained at low compu-tational cost. Attention U-Net benefits from the capacity to en-code spatial neighbourhood structure, wetland patch geometry and contextual gradients across the 128 × 128 pixel field, allow-ing the model to distinguish wetland patches by shape and sur-rounding landscape context rather than by local predictor val-ues alone. This spatial advantage may become more apparent in heterogeneous landscapes with complex wetland configur-ations, larger training datasets with higher patch diversity, or when multi-season inputs are available to capture seasonal in-undation dynamics. The current modest gap between the two classifiers is scientifically informative: it shows that spatial and contextual information encoded in the 128-pixel neighbourhood does provide measurable improvement over pixel-wise classi-fication, but that the magnitude is limited under the current training configuration. Both approaches are viable for opera-tional wetland mapping from public geospatial data, with the choice between them depending on priorities: interpretability and computational simplicity for ExtraTrees, spatial coherence and potential scalability for Attention U-Net.
3.8. Threshold Choice and Area Realism
It may be noted here that a fixed 0.50 cutoff would have produced misleading maps for both classifiers on a minority wetland class. The ExtraTrees threshold of 0.35 delivered a 6.75% predicted share against the 7.29% reference; the Atten-tion U-Net threshold of 0.80 (reflecting the network’s conser-vative probability distribution) delivered 6.38%. Both maps slightly underestimate total wetland extent, with area deficits of 4,548.85 ha and 7,722.43 ha relative to the buffered refer-ence for ExtraTrees and Attention U-Net, respectively. In con-trast, the LiDAR-only ExtraTrees baseline overestimated by
+2,987.7 ha, confirming that terrain-only models tend to flag too many low-lying areas as wetland in the absence of spectral and embedding predictors to distinguish saturated upland ter-rain from true wetland. Map realism matters because mapped wetland area feeds into regulatory planning, hydrological mod-elling and environmental reporting. A model that underpredicts wetlands risks missing ecologically important areas from con-servation inventories, while one that overpredicts creates man-agement burden through false designations. Both probabil-ity products are available for threshold adjustment: a lower threshold increases recall for applications where wetland omis-sion is the primary concern.
3.9. Operational Implications
For the purposes of operational use, the workflow uses only public GeoNB LiDAR, GeoNB Wetlands, Copernicus Sentinel-2 and Google AlphaEarth data, processed on Google Earth En-gine (Gorelick et al., 2017) and standard Python tooling includ-ing scikit-learn, NumPy, Rasterio and PyTorch. From an oper-ational perspective, the key advantage of the proposed frame-work over conventional Sentinel-2 workflows is the elimination of multi-temporal image acquisition, cloud-masking, compos-iting and temporal-statistics computation from the user-facing pipeline. In a typical multi-temporal workflow, these prepro-cessing steps account for the majority of development time, require cloud computing infrastructure and must be repeated when the mapping area or time period changes. By repla-cing the multi-temporal Sentinel-2 stack with the precomputed AlphaEarth embeddings as the principal predictor, this bur-den is reduced to a single download and alignment step. The Sentinel-2 bands serve as a lightweight spectral complement rather than the primary information source. Both probability and binary products are produced for each classifier: the prob-ability maps support uncertainty-aware interpretation and flex-ible threshold selection, while the binary maps support direct spatial use in GIS workflows. Both products are reproducible from public datasets and are transferable to other regions where AlphaEarth embeddings, LiDAR, Sentinel-2 imagery and gov-ernment wetland inventories are available.
3.10. Limitations
Several limitations should be noted. First, the study domain was limited to the 2024 LiDAR-covered portion of New Brunswick, which represents only a subset of the province; provincial trans-fer and performance on the uncovered areas were not tested. Second, the reference layer is a mapped polygon inventory de-rived from aerial photo interpretation and field surveys, not an independent pixel-level ground-truth dataset; the 20 m exclu-sion reduces but does not eliminate polygon-derived label er-ror. Third, both classifiers were trained on a single year (2024) of predictor data, and seasonal variability in inundation extent, canopy phenology and soil moisture was not explicitly repres-ented; the annual AlphaEarth embeddings may not fully capture short-term hydrological dynamics. Fourth, AlphaEarth embed-ding dimensions are latent and cannot be interpreted as indi-vidual physical variables, which limits process understanding. Fifth, the ExtraTrees impurity-based importance tends to favour numerous continuous features such as the 64 embedding dimen-sions, so the ranking reflects relative influence within this model rather than a controlled measure of marginal accuracy gain. Sixth, for the Attention U-Net, the test-set evaluation domain (≈5.8 M pixels) differs from the full ExtraTrees evaluation do-main (85.3 M pixels), which limits direct metric comparison. Finally, neither classifier explicitly models spatial patch struc-ture at scales beyond the immediate neighbourhood, ExtraTrees treats each pixel independently, and Attention U-Net is limited to the 128 × 128 pixel patch context, so large-scale landscape pattern and long-range spatial dependencies are not captured.
3.11. Future Work
Useful next steps include: extending the workflow to addi-tional LiDAR-covered regions and other Canadian provinces for transfer testing and ecoregional generalisation; using in-dependent field-survey data or high-resolution manually inter-preted validation polygons for boundary-accuracy assessment rather than pixel-based inventory comparison; comparing addi-tional deep-learning architectures, including larger Attention U-Net variants, transformer-based segmentation models and hy-brid CNN–transformer designs, on the same aligned predictor stack; adding multi-season Sentinel-2 composites, Sentinel-1 radar time series or multi-year AlphaEarth embeddings to cap-ture seasonal inundation and vegetation variability that annual products may not fully represent; testing probabilistic ensemble approaches that combine ExtraTrees and Attention U-Net prob-ability maps to exploit the complementary recall and precision profiles of the two classifiers; and using the probability outputs as field-prioritisation tools for identifying uncertain or poten-tially unmapped wetlands.
4. Conclusions
On the basis of the results, a boundary-aware 10 m wet-land mapping framework was developed for the 2024 GeoNB LiDAR-covered portion of New Brunswick, fusing LiDAR-derived terrain and canopy structure with Sentinel-2 multis-pectral bands and 64-dimensional AlphaEarth latent geospa-tial embeddings, on top of a 20 m exclusion zone that removes ambiguous wetland-edge pixels from training and evaluation. Two classifiers were developed and directly compared under identical boundary-aware labels and evaluation protocols: an ExtraTrees ensemble and an Attention U-Net segmentation model. The Attention U-Net was further tested in a predictor-group ablation experiment across LiDAR-only, Sentinel-2-only, AlphaEarth-only and full-fusion configurations.
The LiDAR-only ExtraTrees baseline gave moderate wetland discrimination (F1 = 0.425, IoU = 0.270), establishing the contribution of terrain, hydrological position and canopy structure as a baseline. The full ExtraTrees fusion model reached F1 = 0.672 and IoU = 0.506 under hard labels, and F1 = 0.752 and IoU = 0.602 under boundary-aware labels, with 96.51% overall accuracy and a predicted wetland share of 6.75% against a buffered reference of 7.29%. The Attention U-Net ablation independently confirmed the value of multi-source fusion: Sentinel-2-only (58.14% F1), LiDAR-only (70.22% F1) and AlphaEarth-only (69.68% F1) configurations all un-derperformed the full-fusion model, which achieved 96.92% accuracy, 84.19% precision, 68.90% recall, 75.78% F1-score
and 61.01% IoU, mapping 54,442.30 ha (6.38%) of wetland.
Feature importance in the ExtraTrees model was dominated by the AlphaEarth dimensions, which accounted for 19 of the 20 most important predictors, ahead of all Sentinel-2 and nearly all LiDAR predictors. The comparable performance of the AlphaEarth-only and LiDAR-only Attention U-Net configur-ations further confirms that precomputed embeddings encode landscape-relevant information sufficient to approach terrain-based discrimination, and that combining all three predictor groups yields complementary gains. The Attention U-Net slightly outperformed ExtraTrees in F1-score and IoU but was more conservative, achieving higher precision at the cost of lower recall; the overall performance difference was modest, indicating that both tree-based and deep-learning classifiers can effectively use the AlphaEarth embedding stack.
These results demonstrate that precomputed satellite embed-dings can serve as the principal predictor for high-resolution wetland mapping, that a 20 m boundary-uncertainty exclusion zone provides a more defensible evaluation framework for polygon-derived reference data, and that both ExtraTrees and Attention U-Net classifiers can produce accurate, spatially real-istic wetland maps from public geospatial data without the multi-temporal image acquisition and preprocessing burden of conventional Sentinel-2 workflows.
Acknowledgments
The authors thank GeoNB (Government of New Brunswick) for the 2024 LiDAR and Wetlands datasets, the European Space Agency for Sentinel-2 imagery, and Google and Google DeepMind for the AlphaEarth Foundations Satellite Embed-ding dataset.
References
- Aburaed, N., Al-Saad, M., Alkhatib, M. Q., Zitouni, M. S., Almansoori, S., Al-Ahmad, H., 2023. Semantic Segmenta-tion of Remote Sensing Imagery Using an Enhanced Encoder-Decoder Architecture. ISPRS Annals of the Photogrammetry, Remote Sensing and Spatial Information Sciences, X-1/W1-2023, 1015–1020. [CrossRef]
- Anokye, M., Hashemi-Beni, L., 2025. Evaluating Coastal Wet-land Mapping Accuracy with High-Resolution Multi-Spectral Imagery and LiDAR Remote Sensing Data. ISPRS Annals of the Photogrammetry, Remote Sensing and Spatial Information Sciences, X-G-2025, 109–116. [CrossRef]
- Bakkestuen, V., Venter, Z., Ganerod, A. J., Framstad, E., 2023. Delineation of Wetland Areas in South Norway from Sentinel-2 Imagery and LiDAR Using TensorFlow, U-Net, and Google Earth Engine. Remote Sensing, 15(5), 1203. [CrossRef]
- Brown, C. F., Kazmierski, M. R., Pasquarella, V. J., Rucklidge,.
- W. J., Samsikova, M., Zhang, C., Shelhamer, E., Lahera, E., Wiles, O., Ilyushchenko, S., Gorelick, N., Zhang, L. L., Alj, S., Schechter, E., Askay, S., Guinan, O., Moore, R., Boukouv-alas, A., Kohli, P., 2025. AlphaEarth Foundations: An embed-ding field model for accurate and efficient global mapping from sparse label data. arXiv:2507.22291, . [CrossRef]
- Dalei, D. K., Shrivastava, S., Panigrahi, N., 2025. Geographic Places to Semantic Spaces: Analysis of Geospatial Embed-dings. ISPRS Annals of the Photogrammetry, Remote Sensing and Spatial Information Sciences, X-5/W2-2025, 131–135. [CrossRef]
- Du, P., Samat, A., Waske, B., Liu, S., Li, Z., 2015. Ran-dom Forest and Rotation Forest for Fully Polarized SAR Image Classification Using Polarimetric and Spatial Features. ISPRS Journal of Photogrammetry and Remote Sensing, 105, 38–53. [CrossRef]
- Esri Inc., 2024. ArcGIS Pro. Esri, Redlands, CA, USA, https:.
- //www.esri.com/en-us/arcgis/products/arcgis-pro.
- European Space Agency, 2024. Sentinel-2 mission / Coperni-cus Sentinel-2 multispectral imagery. Copernicus Programme, https://sentinel.esa.int/web/sentinel/missions/sentinel-2.
- Geurts, P., Ernst, D., Wehenkel, L., 2006. Extremely Random-ized Trees. Machine Learning, 63(1), 3–42.
- Gillies, S. et al., 2013–. Rasterio: Geospatial raster I/O for Python programmers. Mapbox, https://github.com/ rasterio/rasterio.
- Google, Google DeepMind, 2025. AlphaEarth Foundations satellite embedding dataset / Google Satellite Embedding V1 Annual. Google Earth Engine Data Catalog, https:.
- //developers.google.com/earth-engine/datasets/catalog/GOOGLE_SATELLITE_EMBEDDING_V1_ANNUAL.
- Gorelick, N., Hancher, M., Dixon, M., Ilyushchenko, S., Thau, D., Moore, R., 2017. Google Earth Engine: Planetary-Scale Geospatial Analysis for Everyone. Remote Sensing of Environ-ment, 202, 18–27. [CrossRef]
- Government of New Brunswick, 2024a. LiDAR data / Donne´es LiDAR. GeoNB, New Brunswick Open Data. https:// geonb.snb.ca/li/index.html.
- Government of New Brunswick, 2024b. Wetlands / Terres hu-mides. GeoNB, New Brunswick Open Data, https://geonb. snb.ca/.
- Guo, F., Meng, Q., Li, Z., Ren, H., Wang, J., 2024. Multi-source Feature Embedding and Interaction Fusion Network for Coastal Wetland Classification with Hyperspectral and LiDAR Data. IEEE Transactions on Geoscience and Remote Sensing, 62, 1–17. [CrossRef]
- Harris, C. R., Millman, K. J., van der Walt, S. J., Gommers, R., Virtanen, P., Cournapeau, D., Wieser, E., Taylor, J., Berg, S., Smith, N. J., Kern, R., Picus, M., Hoyer, S., van Kerkwijk,.
- M. H., Brett, M., Haldane, A., del R´ıo, J. F., Wiebe, M., Peterson, P., Ge´rard-Marchant, P., Sheppard, K., Reddy, T., Weckesser, W., Abbasi, H., Gohlke, C., Oliphant, T. E., 2020. Array Programming with NumPy. Nature, 585, 357–362.
- Hird, J. N., DeLancey, E. R., McDermid, G. J., Kariyeva, J., 2017. Google Earth Engine, Open-Access Satellite Data, and Machine Learning in Support of Large-Area Probabilistic Wet-land Mapping. Remote Sensing, 9(12), 1315. [CrossRef]
- Hu, Y., Tian, B., Yuan, L., Li, X., Huang, Y., Shi, R., Jiang, X., Wang, L., Sun, C., 2021. Mapping Coastal Salt Marshes in China Using Time Series of Sentinel-1 SAR. ISPRS Journal of Photogrammetry and Remote Sensing, 173, 122–134. [CrossRef]
- Hunter, J. D., 2007. Matplotlib: A 2D Graphics Environment. [CrossRef]
- Computing in Science and Engineering, 9(3), 90–95.
- Jafarzadeh, H., Mahdianpari, M., Gill, E. W., Brisco, B., Mo-hammadimanesh, F., 2024. Enhancing Wetland Mapping: In-tegrating Sentinel-1/2, GEDI Data, and Google Earth Engine. Sensors, 24(5), 1417. [CrossRef]
- Kaplan, G., Avdan, U., 2017. Mapping and Monitoring Wet-lands Using Sentinel-2 Satellite Imagery. ISPRS Annals of the Photogrammetry, Remote Sensing and Spatial Information Sci-ences, IV-4/W4, 271–277. [CrossRef]
- Koma, Z., Seijmonsbergen, A. C., Grootes, M. W., Nattino, F., Groot, J., Sierdsema, H., Foppen, R. P. B., Kissling, W. D., 2021. Classifying Wetland-Related Land Cover Types and Hab-itats Using Fine-Scale LiDAR Metrics Derived from Country-Wide Airborne Laser Scanning. Remote Sensing in Ecology and Conservation, 7(4), 576–593.
- Landgraf, S., Hillemann, M., Wursthorn, K., Ulrich, M., 2024. Uncertainty-Aware Cross-Entropy for Semantic Segmentation. ISPRS Annals of the Photogrammetry, Remote Sensing and Spatial Information Sciences, X-2-2024, 129–136. [CrossRef]
- Lang, M. W., McCarty, G. W., 2009. Lidar Intensity for Im-proved Detection of Inundation Below the Forest Canopy. Wet-lands, 29(4), 1166–1178. [CrossRef]
- LaRocque, A., Leblon, B., Harris, J., Jiao, X., Armour, B., 2014. Use of Radarsat-2 and ALOS-PALSAR SAR images for wetland mapping in New Brunswick. IEEE International Geoscience and Remote Sensing Symposium (IGARSS), 1226–1229.
- LaRocque, A., Leblon, B., Woodward, R., Bourgeau-Chavez, L., 2020a. Wetland Mapping in New Brunswick, Canada with Landsat5-TM, ALOS-PALSAR, and Radarsat-2 Imagery. IS-PRS Annals of the Photogrammetry, Remote Sensing and Spa-tial Information Sciences, V-3-2020, 301–308. [CrossRef]
- LaRocque, A., Phiri, C., Leblon, B., Pirotti, F., Connor, K., Hanson, A., 2020b. Wetland Mapping with Landsat 8 OLI, Sentinel-1, ALOS-1 PALSAR, and LiDAR Data in Southern New Brunswick, Canada. Remote Sensing, 12(13), 2095. [CrossRef]
- Liu, L., Zhang, X., 2024. Algorithm, Progresses, Datasets and Validation of GLC FCS30D: The First Global 30 m Land-Cover Dynamic Product with Fine Classification System from 1985 to 2022. ISPRS Annals of the Photogrammetry, Remote Sensing and Spatial Information Sciences, X-2-2024, 137–143. [CrossRef]
- Liu, Y., Xiao, X., Li, J., Wang, X., Chen, B., Sun, C., Wang, J., Tian, P., Zhang, H., 2023. Tracking Changes in Coastal Land Cover in the Yellow Sea, East Asia, Using Sentinel-1 and Sentinel-2 Time-Series Images and Google Earth Engine. ISPRS Journal of Photogrammetry and Remote Sensing, 196, 429–444. [CrossRef]
- Martins, V. S., Kaleita, A. L., Gelder, B. K., da Silveira, H. L. F., Abe, C. A., 2020. Deep Neural Network for Complex Open-Water Wetland Mapping Using High-Resolution WorldView-3 and Airborne LiDAR Data. International Journal of Applied Earth Observation and Geoinformation, 93, 102215. [CrossRef]
- Maxa, M., Bolstad, P., 2009. Mapping Northern Wetlands with High Resolution Satellite Images and LiDAR. Wetlands, 29(1), 248–260. [CrossRef]
- Mohseni, F., Amani, M., Mohammadpour, P., Kakooei, M., Jin, S., Moghimi, A., 2023. Wetland Mapping in Great Lakes Us-ing Sentinel-1/2 Time-Series Imagery and DEM Data in Google Earth Engine. Remote Sensing, 15(14), 3495. [CrossRef]
- Nguyen, M. H., Nguyen, N. T., Ryadi, G. Y. I., Nguyen,.
- M. V., Duong, T. L., Lin, C.-H., Nguyen, T. B., 2024. Google Earth Engine-Based Mangrove Mapping and Change Detec-tion for Sustainable Development in Tien Yen District, Quang Ninh Province, Vietnam. ISPRS Annals of the Photogrammetry, Remote Sensing and Spatial Information Sciences, X-5-2024, 119–125. [CrossRef]
- Onojeghuo, A. O., Onojeghuo, A. R., 2021. Wetland Mapping with Multi-Temporal Sentinel-1 and -2 Imagery (2017–2020) and LiDAR Data in the Grassland Natural Region of Alberta. GIScience and Remote Sensing, 58(7), 1102–1124.
- Papoutsis, I., Bountos, N. I., Zavras, A., Michail, D., Tryfono-poulos, C., 2023. Benchmarking and Scaling of Deep Learning Models for Land Cover Image Classification. ISPRS Journal of Photogrammetry and Remote Sensing, 195, 250–268. [CrossRef]
- Pedregosa, F., Varoquaux, G., Gramfort, A., Michel, V., Thirion, B., Grisel, O., Blondel, M., Prettenhofer, P., Weiss, R., Dubourg, V., Vanderplas, J., Passos, A., Cournapeau, D., Brucher, M., Perrot, M., Duchesnay, E., 2011. Scikit-Learn: Machine Learning in Python. Journal of Machine Learning Re-search, 12, 2825–2830.
- Rangongo, T., Fabris-Rotelli, I., Thiede, R., 2024. Assessing Classification Performance for Sampled Remote Sensing Data. ISPRS Annals of the Photogrammetry, Remote Sensing and Spatial Information Sciences, X-4-2024, 279–286. [CrossRef]
- Rapinel, S., Hubert-Moy, L., Cle´ment, B., 2015. Combined Use of LiDAR Data and Multispectral Earth Observation Imagery for Wetland Habitat Mapping. International Journal of Applied Earth Observation and Geoinformation, 37, 56–64.
- Ryan, S., Powell, M., Mahdianpari, M., Brisco, B., Moham-madimanesh, F., 2025. Streamlining Wetland Vegetation Map-ping with AlphaEarth Embeddings: Comparable Accuracy to Traditional Methods with Cleaner Maps and Minimal Prepro-cessing. Remote Sensing, 17(18), 3081.
- Seyed Mousavi, S. M., Akhoondzadeh, M., 2023. A Quick Seasonal Detection and Assessment of International Shadegan Wetland Water Body Extent Using Google Earth Engine Cloud Platform. ISPRS Annals of the Photogrammetry, Remote Sens-ing and Spatial Information Sciences, X-4/W1-2022, 699–706. [CrossRef]
- Sharma, R., Pritipadmaja, Ahmad, Z., Garg, R. D., 2025. Im-proving Land Cover Mapping in Riverine Environments with Machine Learning and Spectral Indices. ISPRS Annals of the Photogrammetry, Remote Sensing and Spatial Information Sci-ences, X-G-2025, 813–820.
- Slagter, B., Tsendbazar, N.-E., Vollrath, A., Reiche, J., 2020. Mapping Wetland Characteristics Using Temporally Dense Sentinel-1 and Sentinel-2 Data: A Case Study in the St. Lucia Wetlands, South Africa. International Journal of Applied Earth Observation and Geoinformation, 86, 102009. [CrossRef]
- Souza, C. M., Ferreira, B. G., Diniz, C. G., Souza-Filho, P.
- W. M., Tymus, J. R. C., Lobo, F. L., 2025. Enhanced Amazon Wetland Map with Multi-Source Remote Sensing Data. Remote Sensing, 17(2), 229.
- Sultan, M., Saleous, N., Issa, S., Dahy, B., Sami, M., 2025. Op-timizing Land Use Classification Using Google Earth Engine: A Comparative Analysis of Machine Learning Algorithms. IS-PRS Annals of the Photogrammetry, Remote Sensing and Spa-tial Information Sciences, X-G-2025, 863–869. [CrossRef]
- Villa, P., Giardino, C., Mantovani, S., Tapete, D., Vecoli, A., Braga, F., 2021. Mapping Coastal and Wetland Vegetation Communities Using Multi-Temporal Sentinel-2 Data. The In-ternational Archives of the Photogrammetry, Remote Sensing and Spatial Information Sciences, XLIII-B3-2021, 639–644. [CrossRef]
- Wang, M., Mao, D., Wang, Y., Xiao, X., Xiang, H., Feng, K., Luo, L., Jia, M., Song, K., Wang, Z., 2023. Wetland Mapping in East Asia by Two-Stage Object-Based Random Forest and Hierarchical Decision Tree Algorithms on Sentinel-1/2 Images. Remote Sensing of Environment, 297, 113793. [CrossRef]
- Wu, Q., Lane, C. R., Li, X., Zhao, K., Zhou, Y., Clinton, N., DeVries, B., Golden, H. E., Lang, M. W., 2019. Integrating LiDAR Data and Multi-Temporal Aerial Imagery to Map Wet-land Inundation Dynamics Using Google Earth Engine. Remote Sensing of Environment, 228, 1–13. [CrossRef]
Figure 1.
Location of the study area. Left: regional setting of New Brunswick within North America. Right: the 2024 GeoNB airborne-LiDAR-covered modelling domain (speckled extent) shown against the provincial boundary and principal localities. Analysis was confined to this LiDAR footprint to avoid treating areas without LiDAR as valid non-wetland samples.
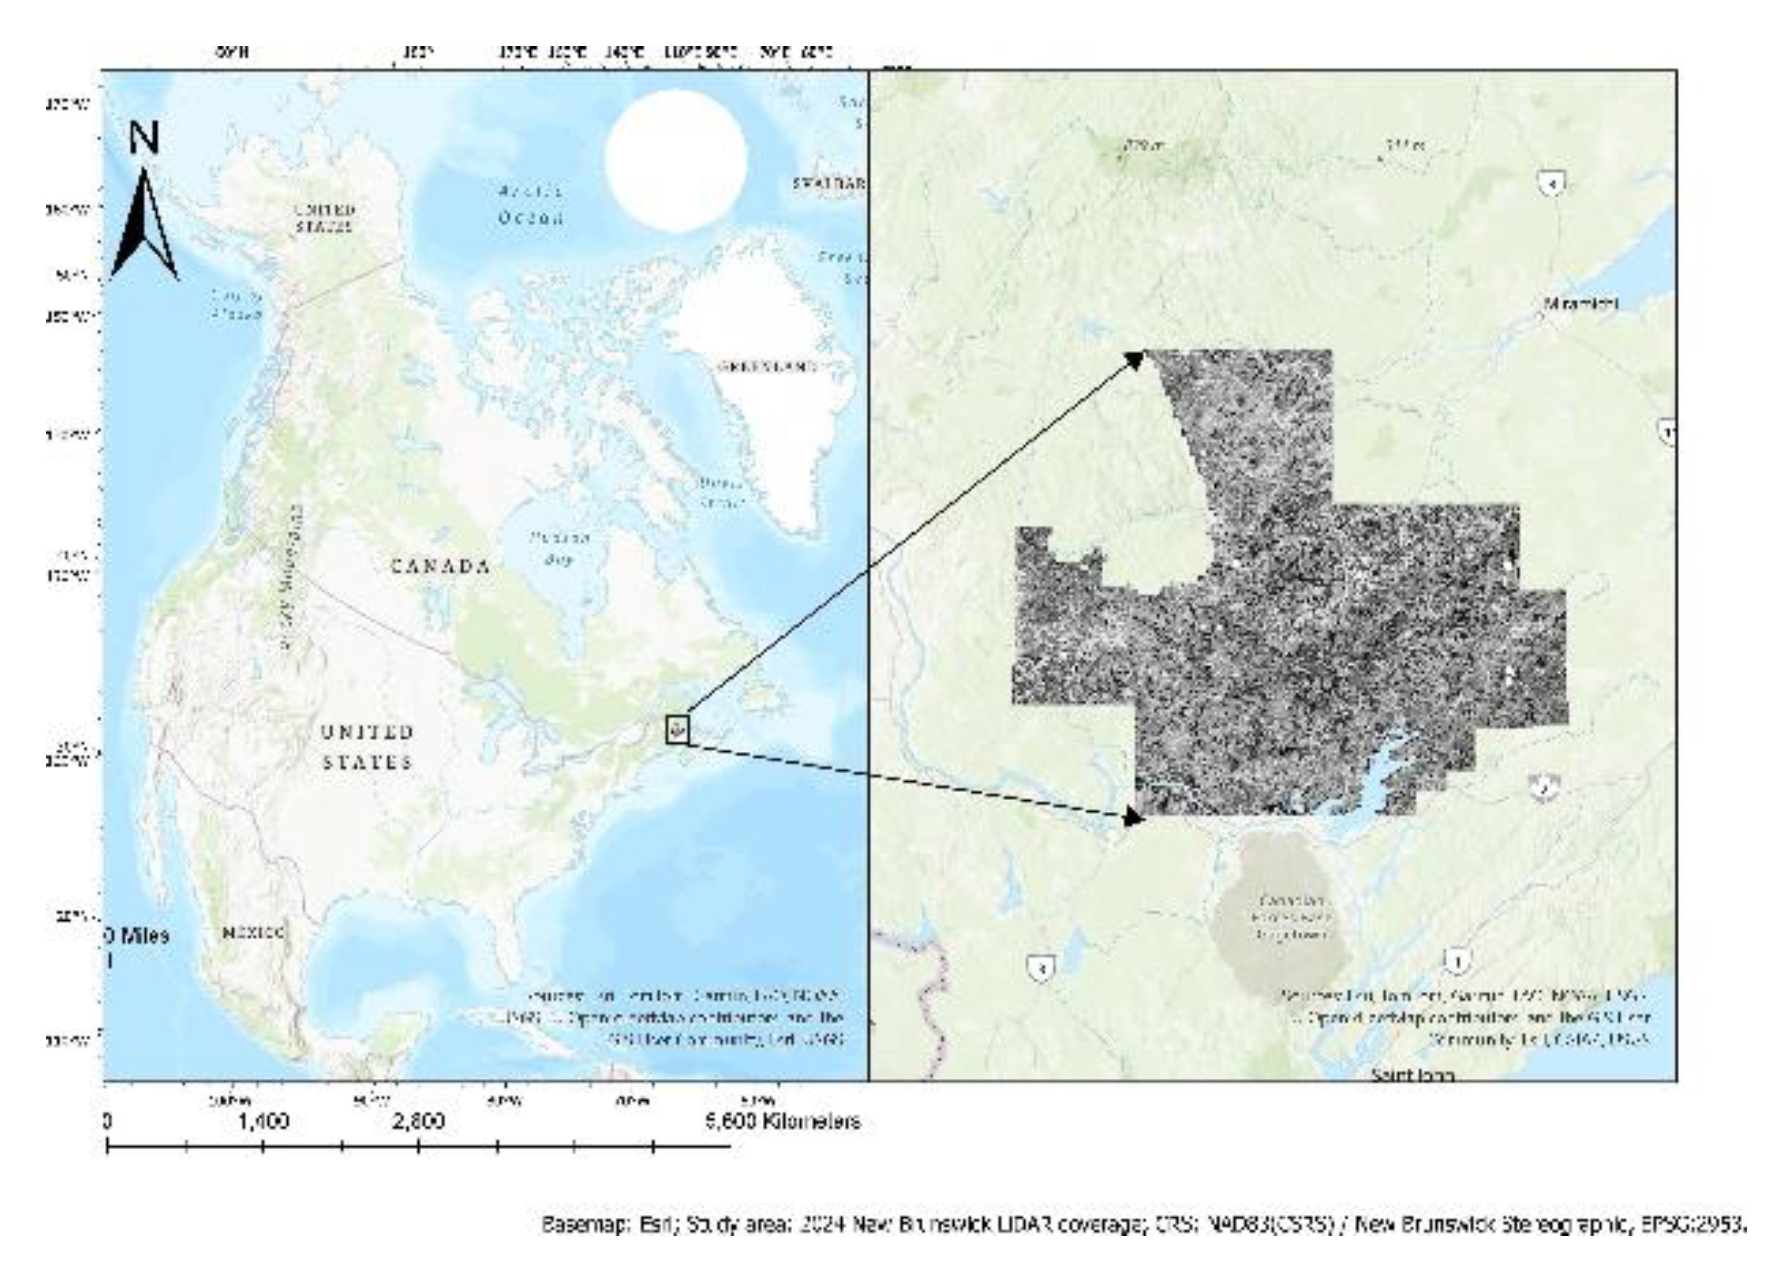
Figure 2.
Spatial framework of the study, in EPSG:2953 coordinates (Easting/Northing, m). Left: the valid LiDAR study footprint (97,232,930 valid pixels) defining where predictors are complete. Right: the corresponding GeoNB wetland reference distribution (wetland in green) used to derive training and evaluation labels within that footprint.
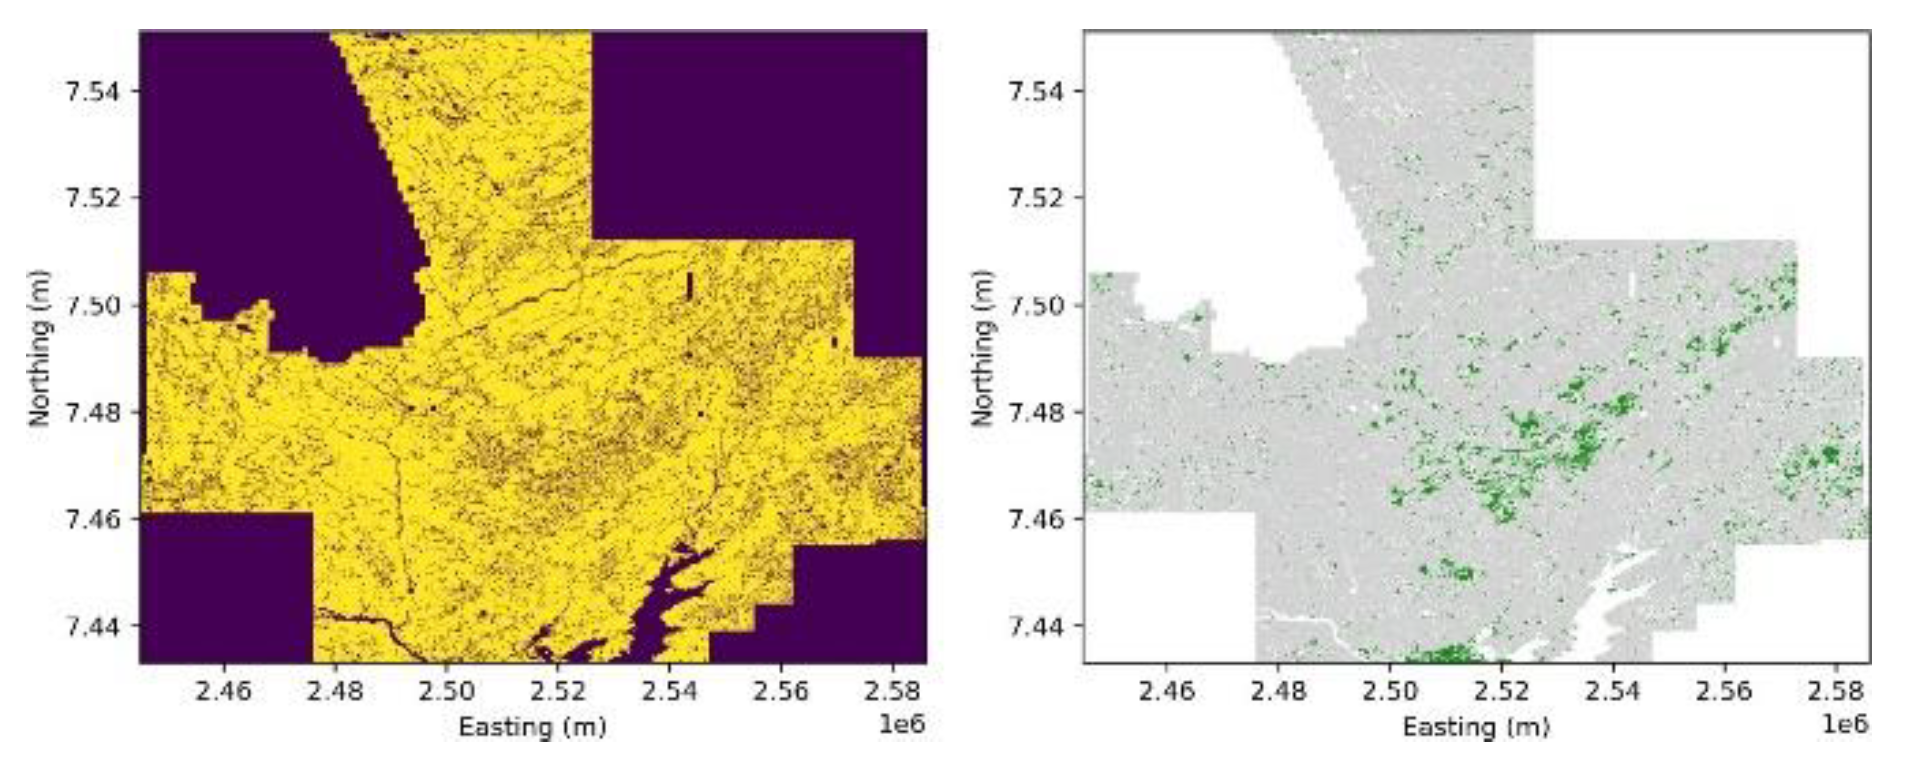
Figure 3.
Boundary-uncertainty treatment of the rasterised GeoNB wetland labels. Left: original hard labels obtained by direct polygon-to-raster conversion. Centre: the 20 m (two-pixel) uncertainty zone flagged around every wetland edge. Right: the resulting buffered reference used in training and evaluation, retaining only core wetland and confident non-wetland pixels while the uncertain edge pixels are excluded.
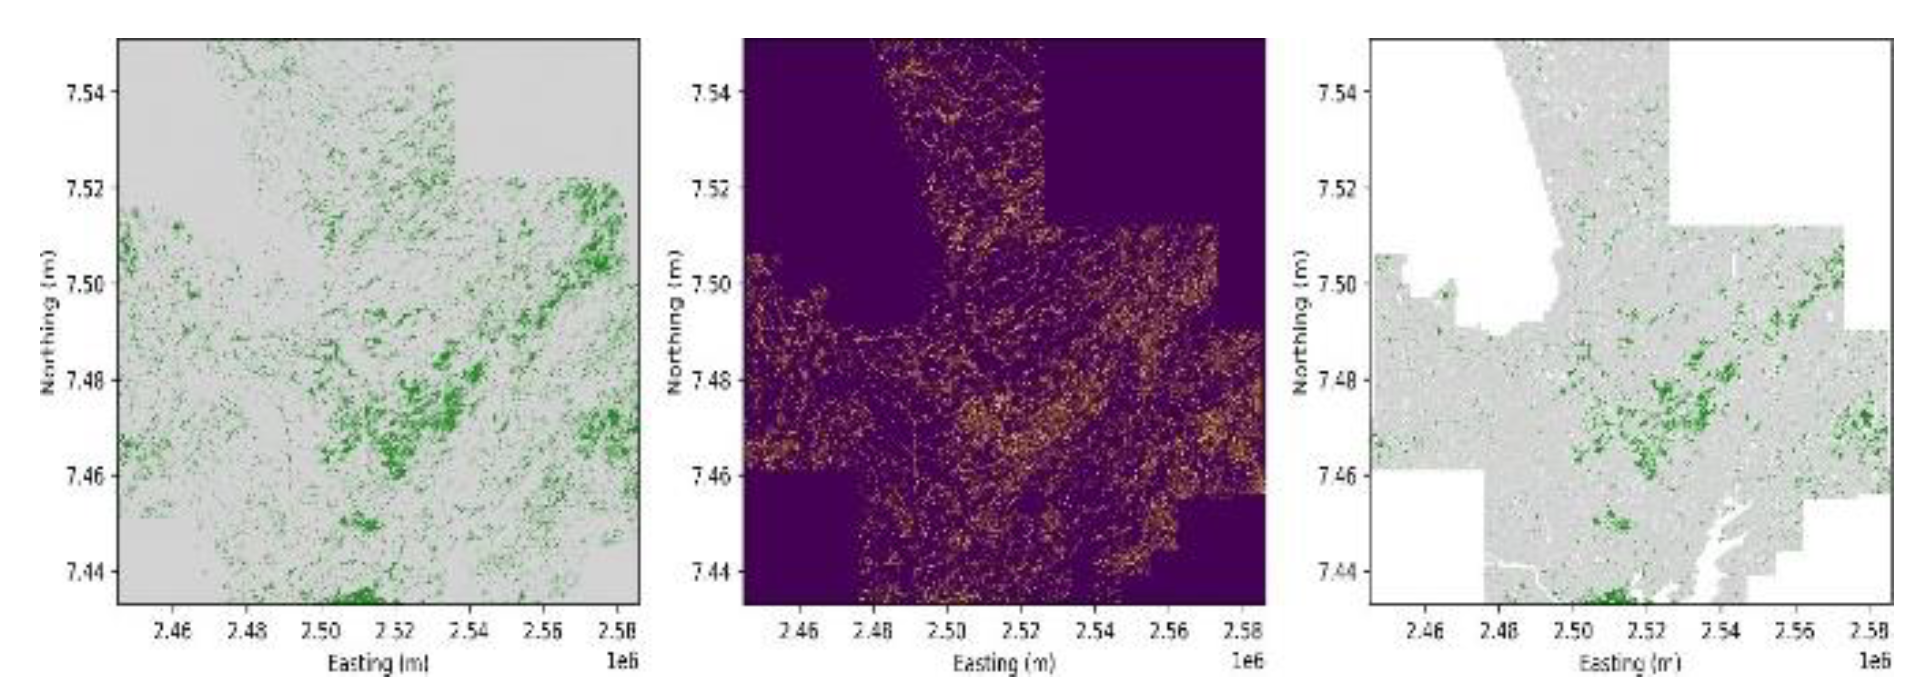
Figure 4.
End-to-end ExtraTrees workflow for 10 m wetland prediction. Five LiDAR derivatives, 12 Sentinel-2 bands and 64 precomputed AlphaEarth embedding dimensions are .co-registered and preprocessed, sampled at a realistic class ratio under a spatial block split, and classified with an ExtraTrees ensemble. Boundary-aware buffering and threshold optimisation yield the final wetland probability and binary maps.
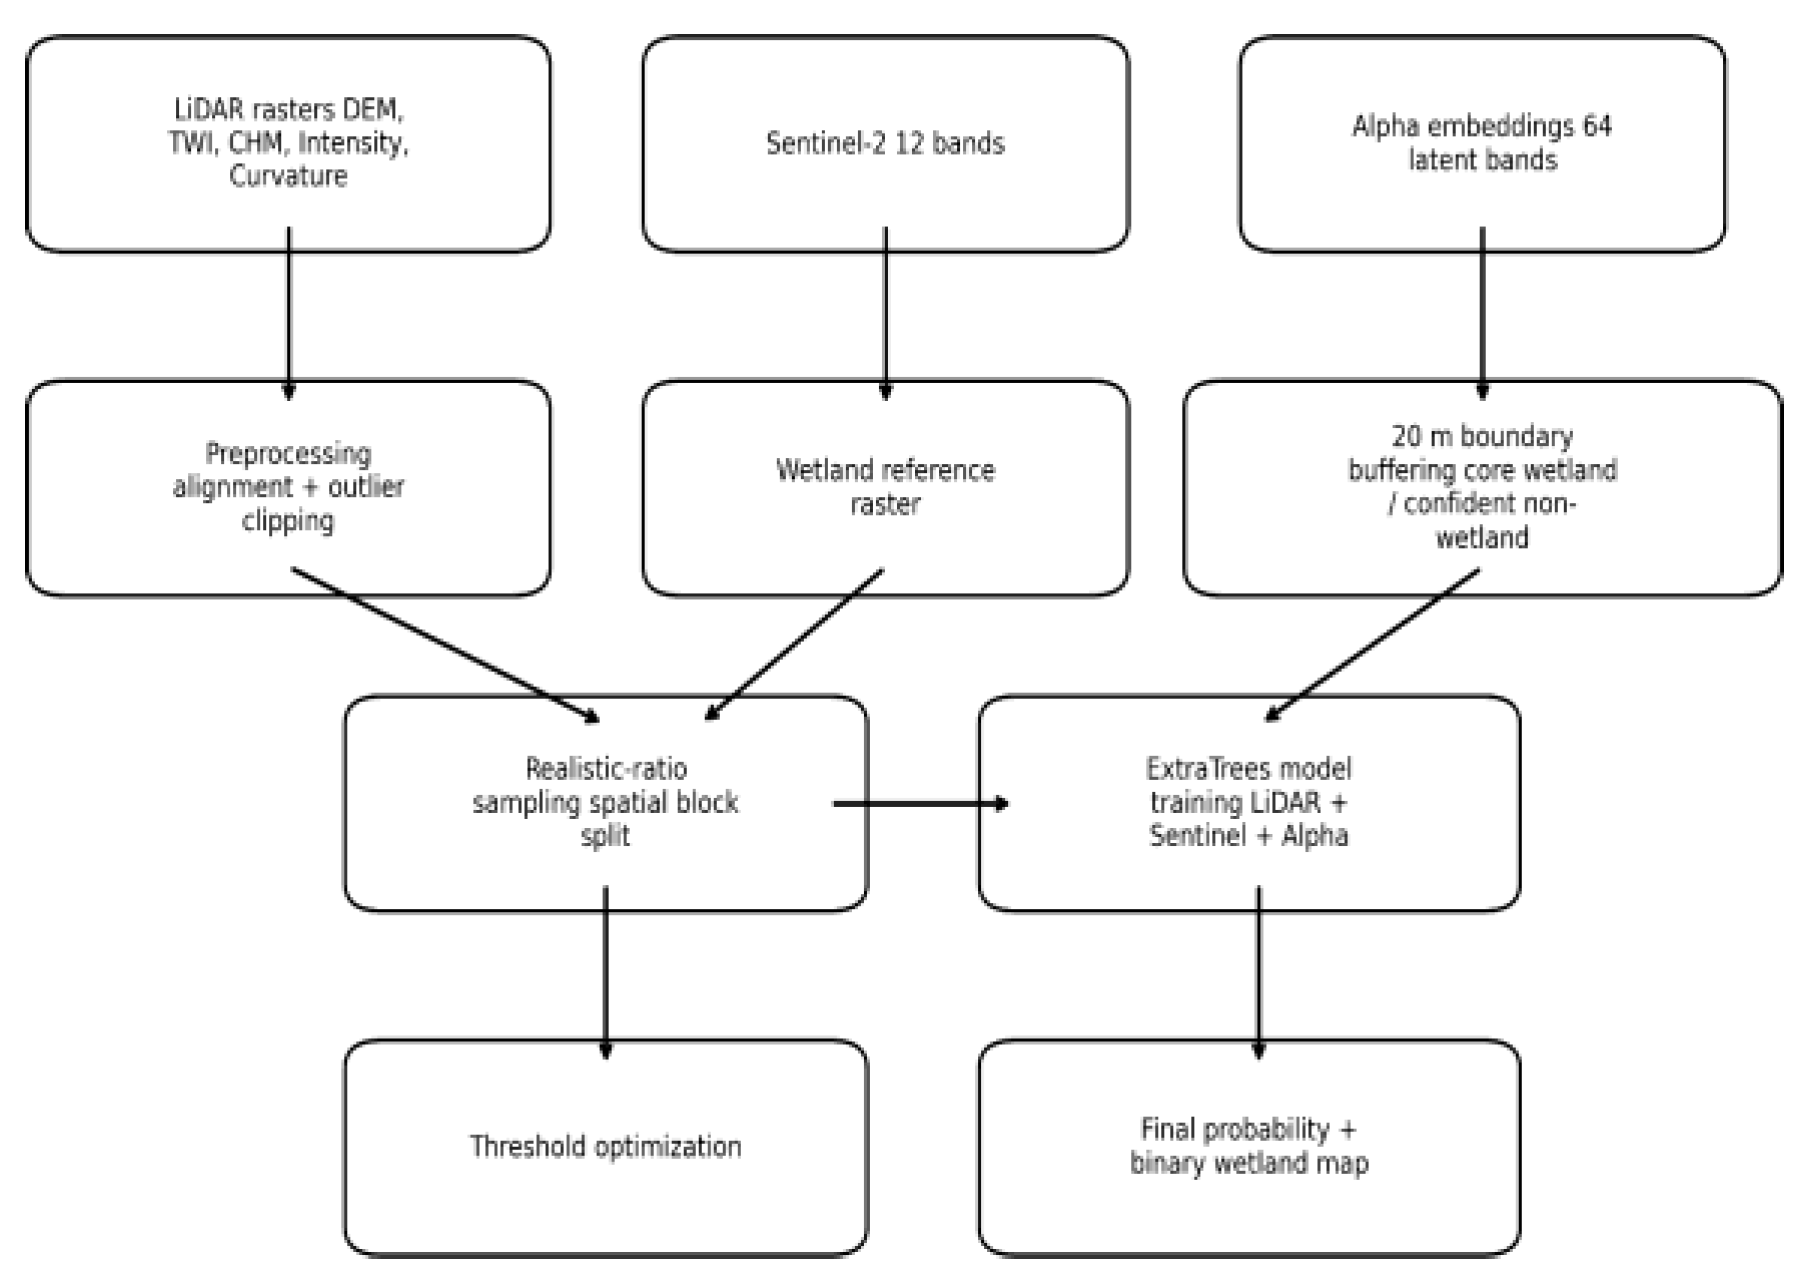
Figure 5.
Boundary-aware Attention U-Net workflow for 10 m wetland mapping. LiDAR derivatives (5), Sentinel-2 bands (12) and AlphaEarth embeddings (64) are combined into 81-channel 128 × 128 patches and spatially split into training, validation and test sets. The network is trained with masked binary.
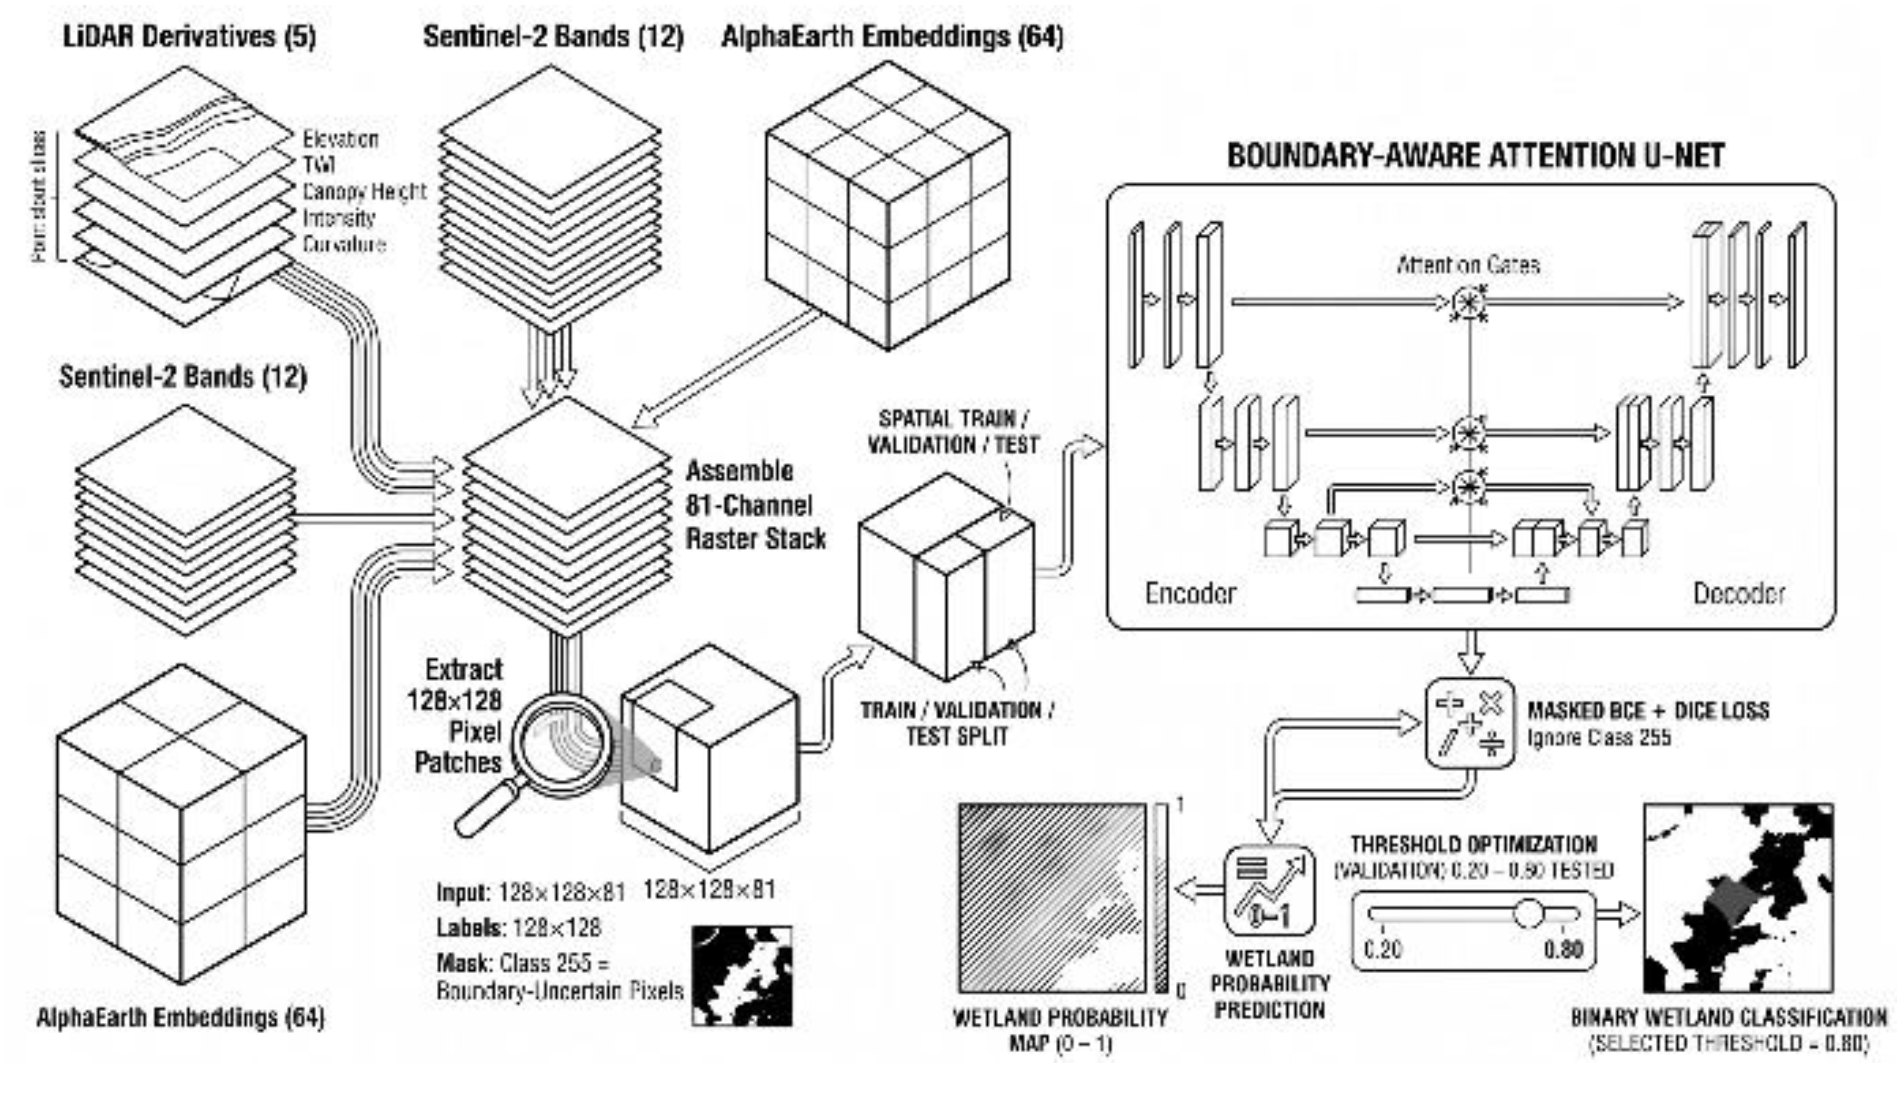
Figure 6.
Probability-threshold optimisation for the ExtraTrees LiDAR + Sentinel-2 + AlphaEarth model. Wetland F1-score and IoU (left axis, solid) and predicted wetland percentage (right axis, dashed) are plotted against the decision threshold. Left: hard-label fusion model (optimum near 0.30). Right:.
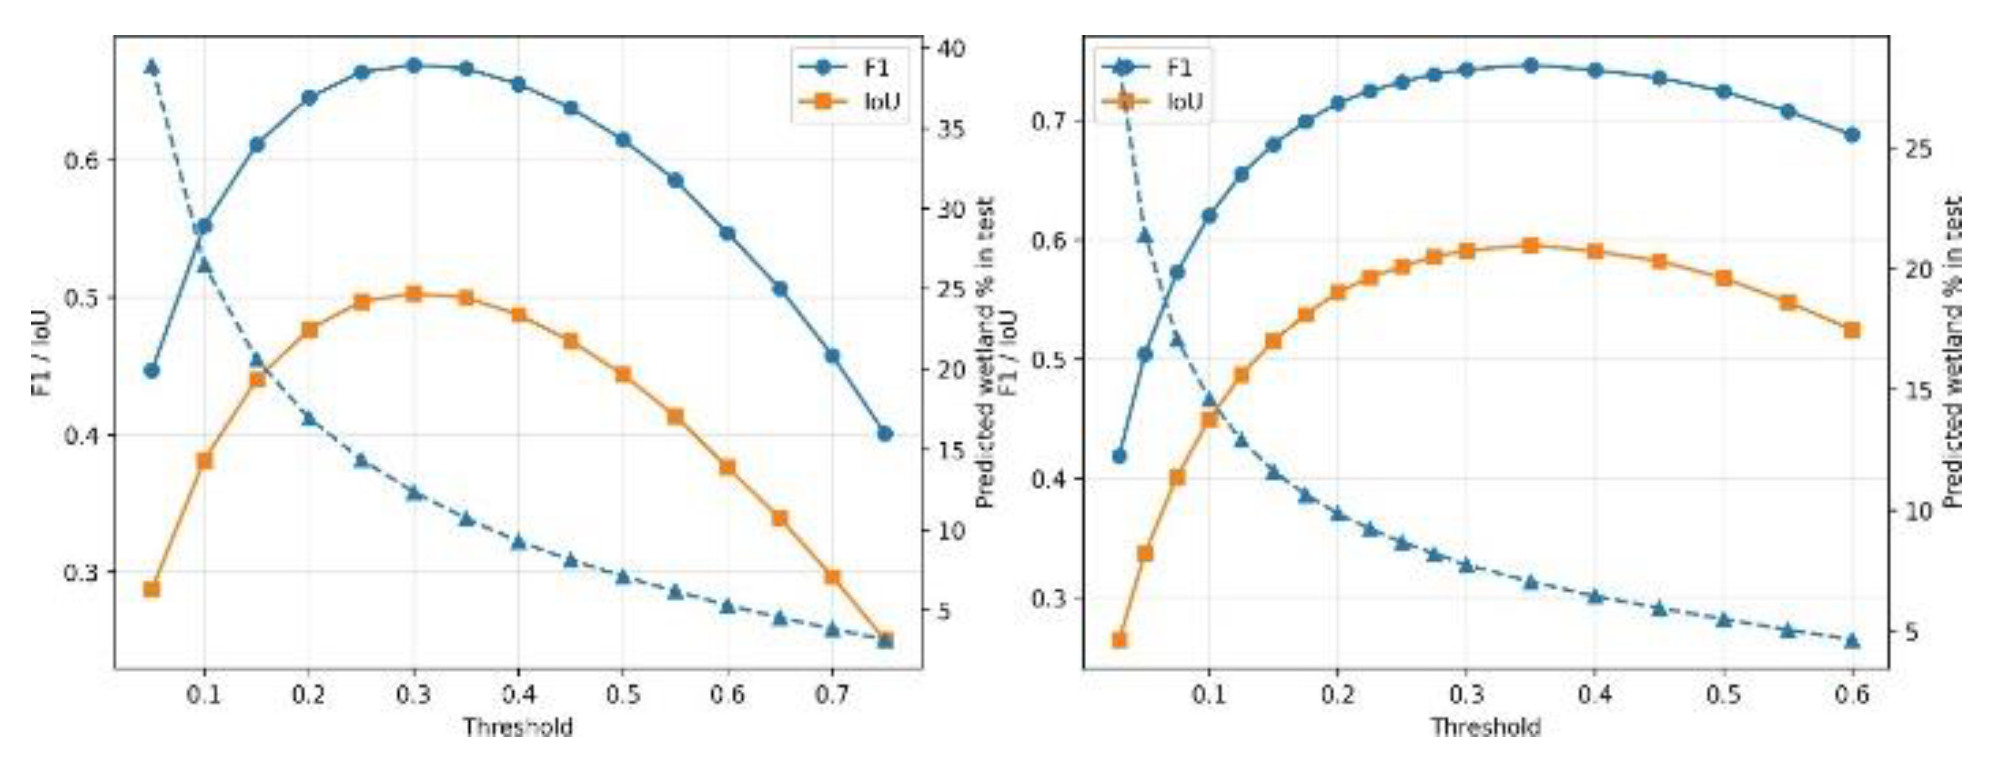
Figure 7.
Comparative performance of the three ExtraTrees modelling configurations, LiDAR-only (hard labels),.
Figure 7.
Comparative performance of the three ExtraTrees modelling configurations, LiDAR-only (hard labels),.
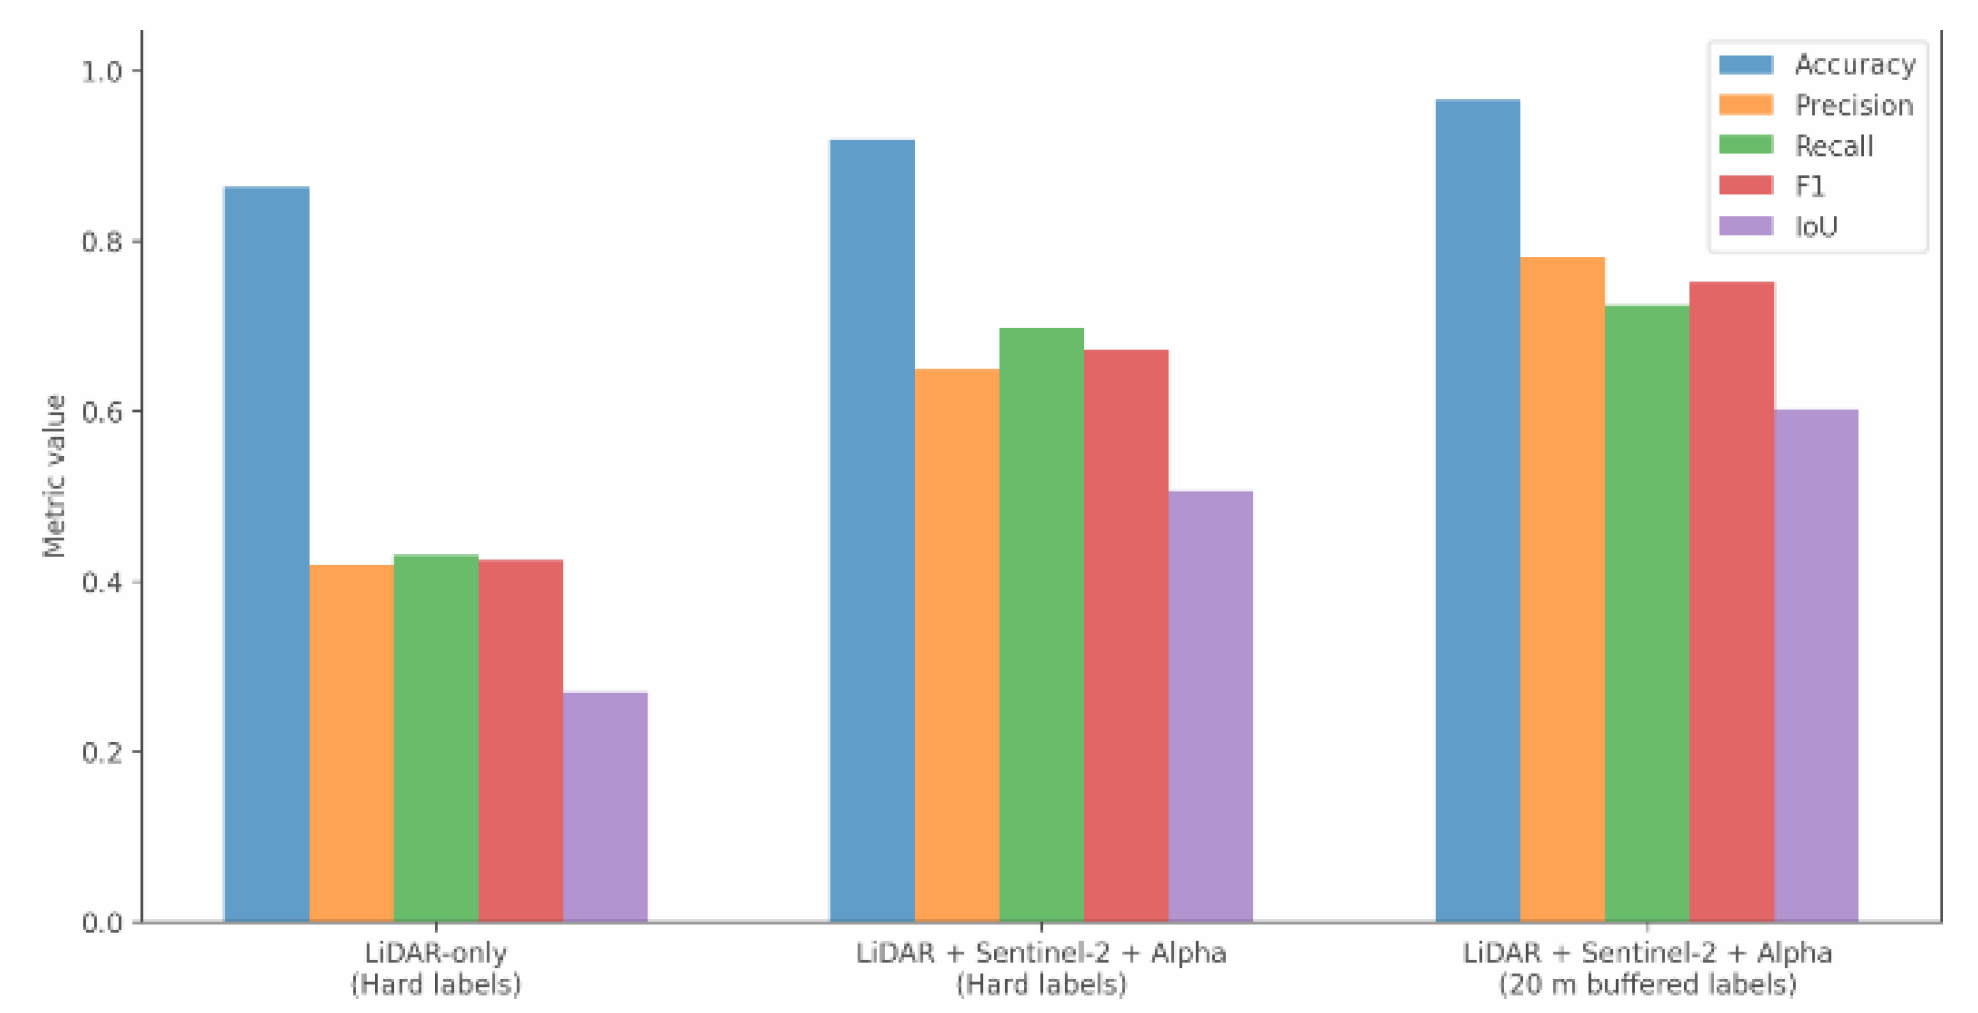
Figure 8.
Final 10 m ExtraTrees wetland products for the 2024 LiDAR-covered study area from the boundary-aware.
Figure 8.
Final 10 m ExtraTrees wetland products for the 2024 LiDAR-covered study area from the boundary-aware.
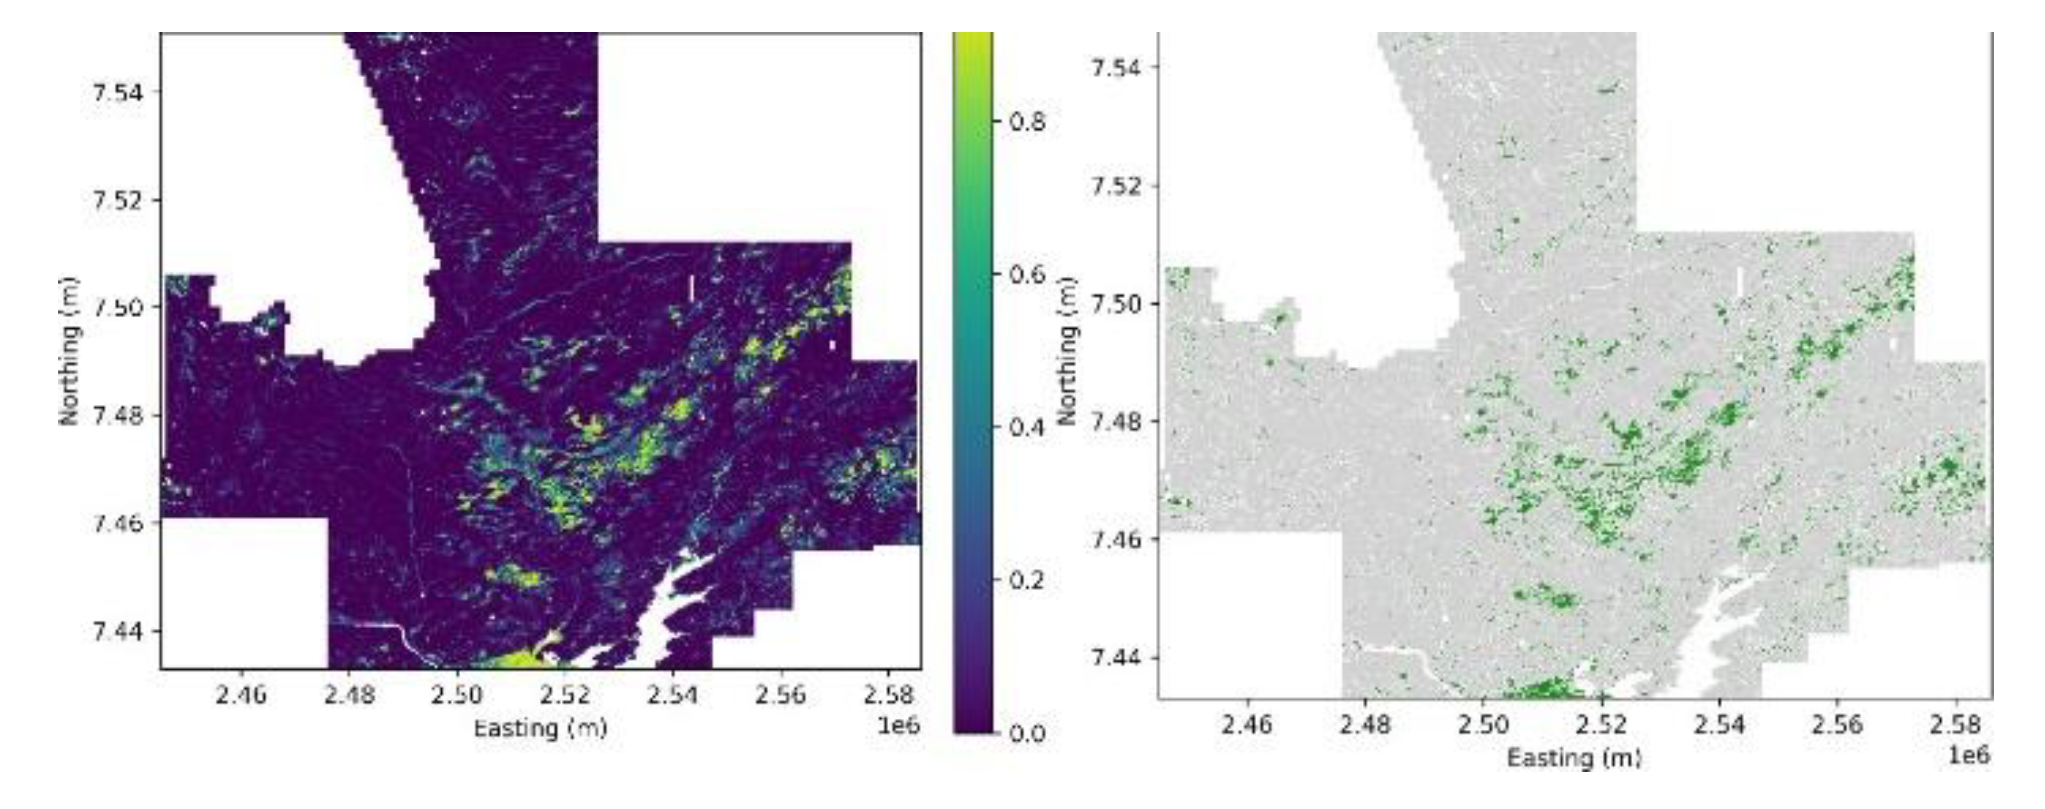
Figure 9.
Top 20 predictor importances of the boundary-aware ExtraTrees fusion model. AlphaEarth embedding dimensions (prefix Alpha A) occupy 19 of the 20 highest-ranked predictors, led by A22 and A08; LiDAR intensity is the only.
Figure 9.
Top 20 predictor importances of the boundary-aware ExtraTrees fusion model. AlphaEarth embedding dimensions (prefix Alpha A) occupy 19 of the 20 highest-ranked predictors, led by A22 and A08; LiDAR intensity is the only.
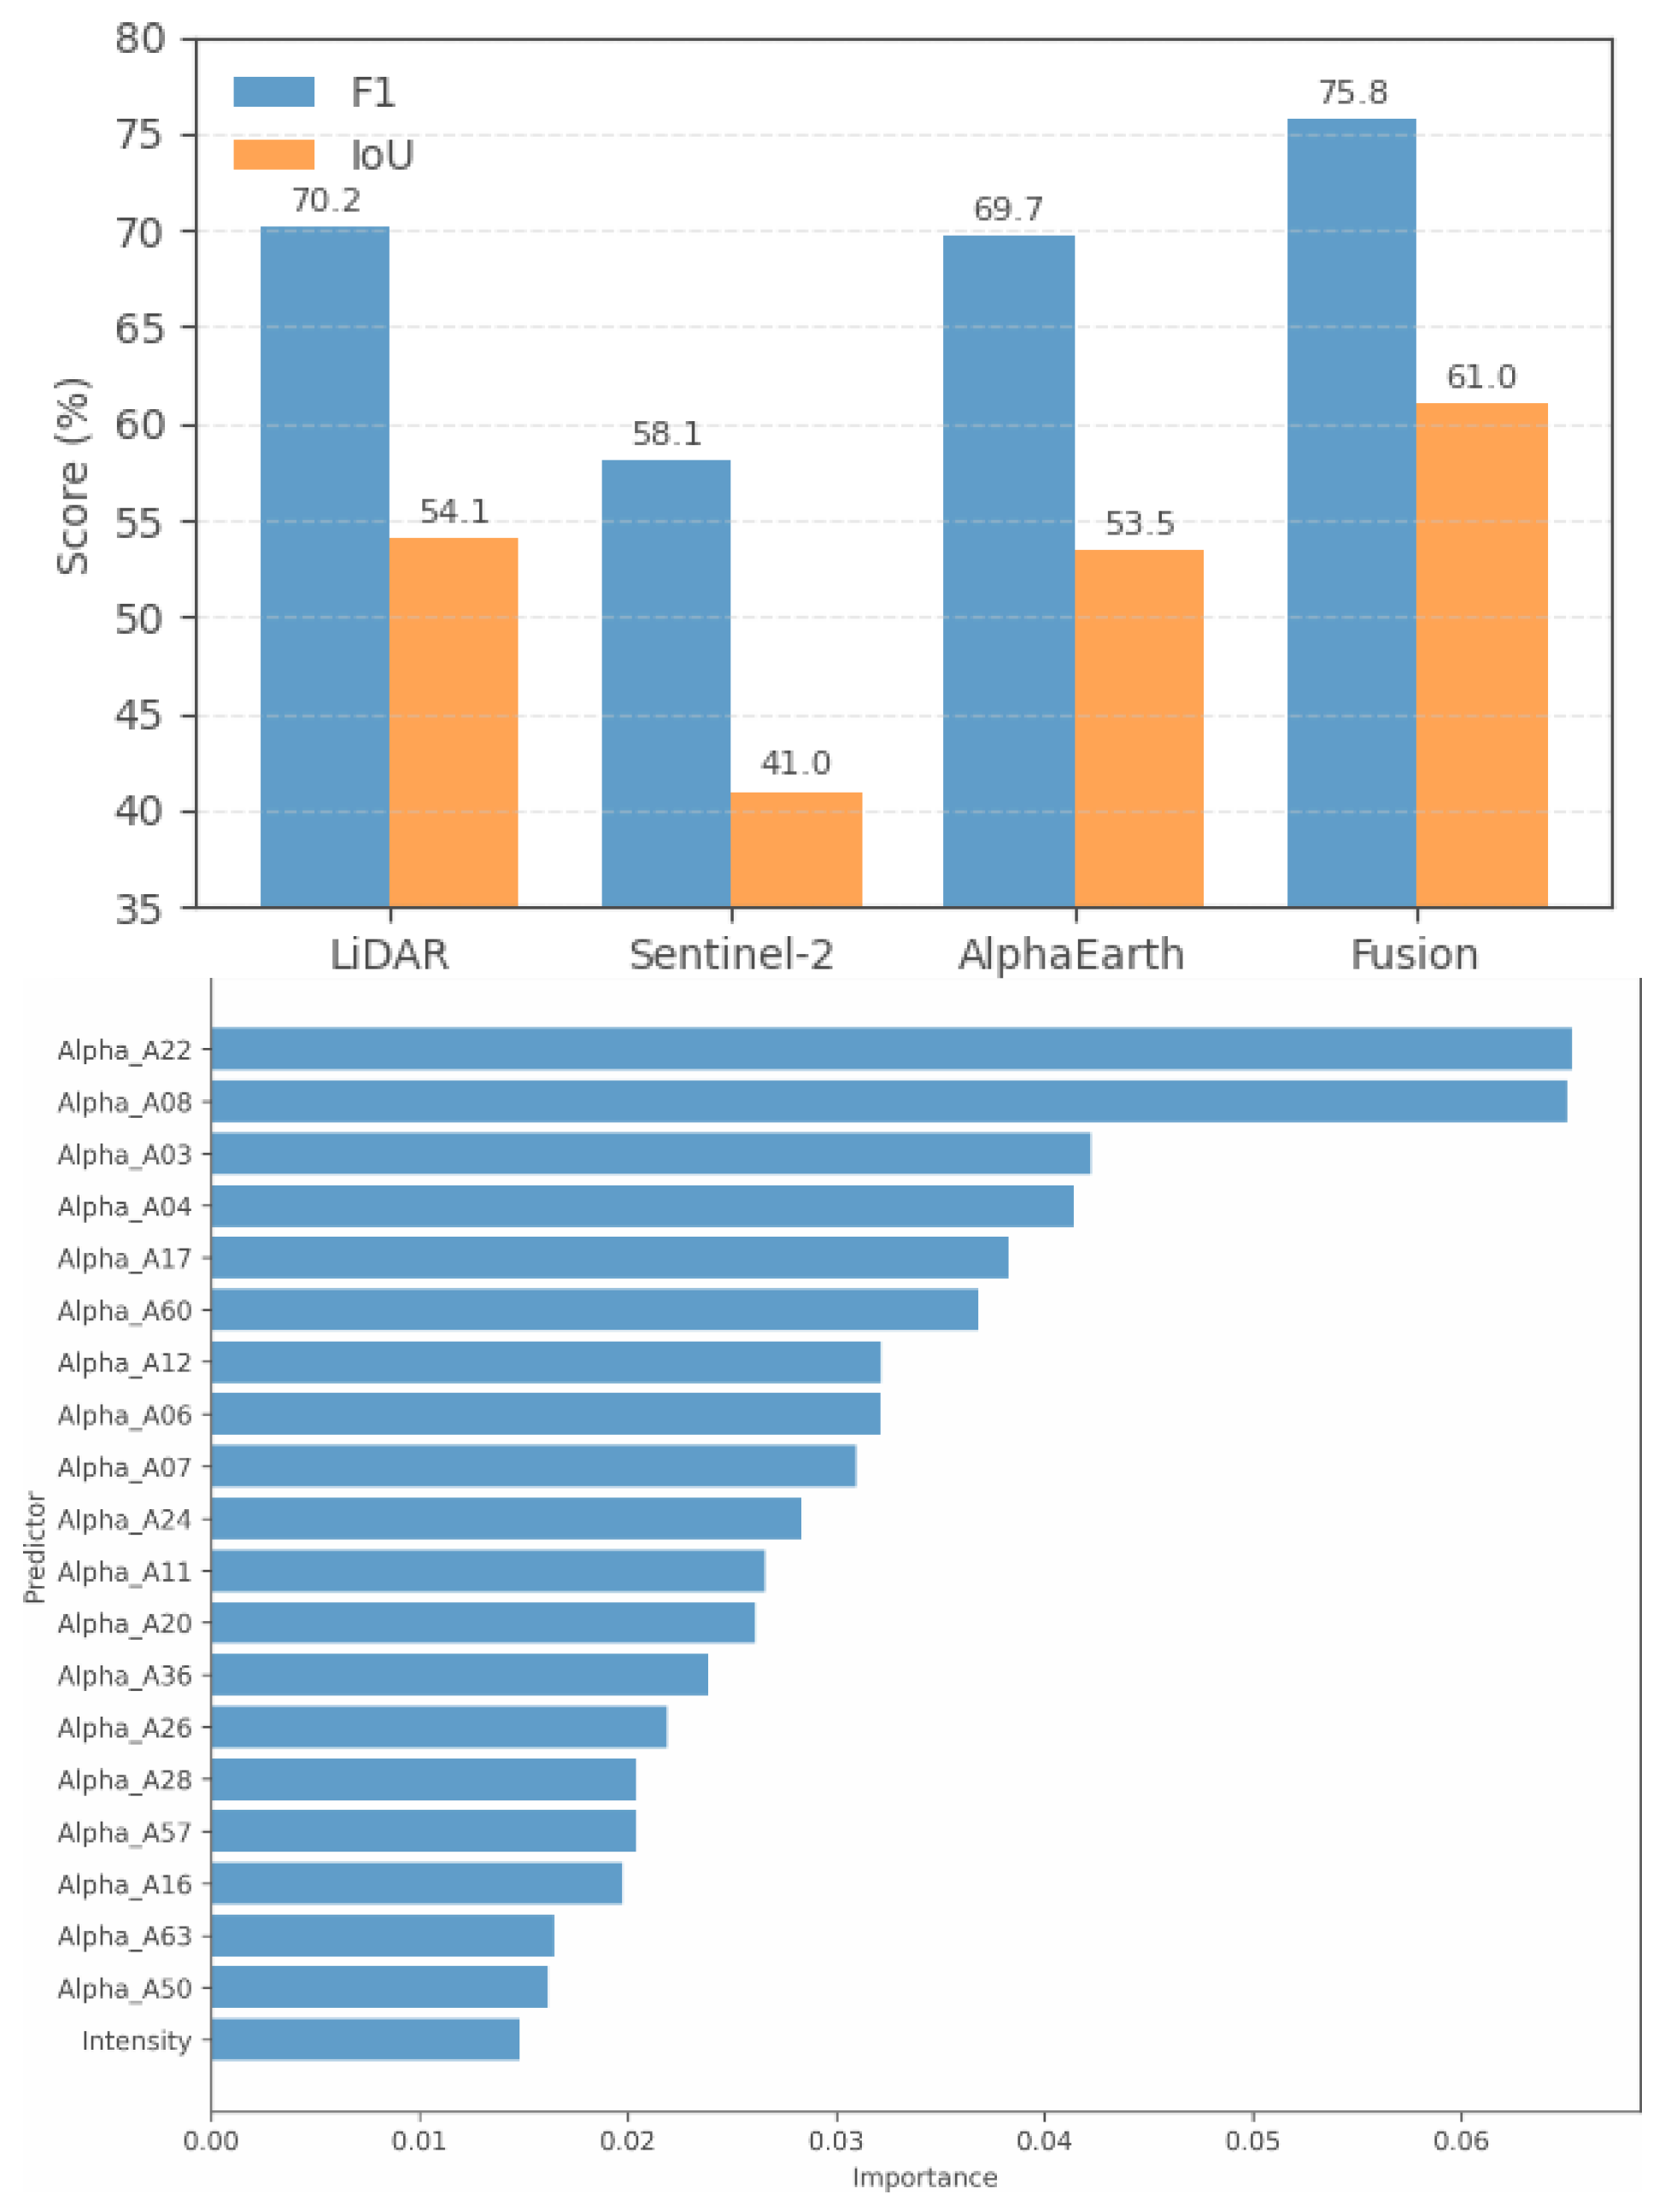
Table 1.
Geospatial datasets used for 10 m wetland prediction in this study. All input features and reference labels reflect a 2024 temporal baseline.
Table 1.
Geospatial datasets used for 10 m wetland prediction in this study. All input features and reference labels reflect a 2024 temporal baseline.
| Dataset | Res. | Role in study |
|---|---|---|
| GeoNB LiDAR | 10 m | Elevation, TWI, CHM, intensity, |
| curvature predictors | ||
| Sentinel-2 | 10 m | 12 multispectral band predictors |
| AlphaEarth embeddings | 10 m | 64 latent geospatial dimensions |
| GeoNB Wetlands layer | 10 m | Wetland/non-wetland reference labels |
Table 2.
Effect of the 20 m boundary-uncertainty exclusion on reference-label availability. Percentages are computed within the valid LiDAR-covered area only.
Table 2.
Effect of the 20 m boundary-uncertainty exclusion on reference-label availability. Percentages are computed within the valid LiDAR-covered area only.
| Class | Before exclusion | After exclusion |
|---|---|---|
| Total valid pixels | 96,854,976 | 85,299,502 |
| Core wetland | 11,395,605 (11.77%) | 6,216,473 (7.29%) |
| Confident non-wetland | 85,459,371 (88.23%) | 79,083,029 (92.71%) |
| Uncertain boundary | 0 (0.00%) | 11,555,474 (12.93%) |
Table 5.
Attention U-Net ablation results across four predictor configurations under boundary-aware labels and the same spatial split. Full accuracy metrics are reported for all configurations.
Table 5.
Attention U-Net ablation results across four predictor configurations under boundary-aware labels and the same spatial split. Full accuracy metrics are reported for all configurations.
| Configuration | Channels | Acc. | P | R | F1 | IoU |
|---|---|---|---|---|---|---|
| LiDAR-only | 5 | 96.08% | 75.14% | 65.90% | 70.22% | 54.10% |
| Sentinel-2-only | 12 | 94.89% | 68.02% | 50.77% | 58.14% | 40.98% |
| AlphaEarth-only | 64 | 96.15% | 77.10% | 63.14% | 69.68% | 53.45% |
| Full fusion | 81 | 96.92% | 84.19% | 68.90% | 75.78% | 61.01% |
Table 6.
Test-set confusion matrix and accuracy metrics for the boundary-aware Attention U-Net full-fusion model at threshold 0.80.
Table 6.
Test-set confusion matrix and accuracy metrics for the boundary-aware Attention U-Net full-fusion model at threshold 0.80.
| Metric | Value |
|---|---|
| Model | Attention U-Net |
| Predictors | LiDAR + S2 + AlphaEarth |
| Selected threshold | 0.80 |
| Overall accuracy | 96.92% |
| Wetland precision | 84.19% |
| Wetland recall | 68.90% |
| Wetland F1-score | 75.78% |
| Wetland IoU | 61.01% |
| TP / TN | 277,980 / 5,310,694 |
| FP / FN | 52,197 / 125,469 |
Table 7.
Full-raster prediction summary for the boundary-aware Attention U-Net fusion model at threshold 0.80.
Table 7.
Full-raster prediction summary for the boundary-aware Attention U-Net fusion model at threshold 0.80.
| Metric | Value |
|---|---|
| Valid evaluated pixels | 85,299,502 |
| Buffered ref. wetland % | 7.29 |
| Predicted wetland % | 6.38 |
| Predicted wetland area (ha) | 54,442.30 |
| Predicted wetland pixels | 5,444,230 |
| Predicted non-wetland pixels | 79,855,272 |
Table 8.
Direct comparison of ExtraTrees and Attention U-Net full-fusion models under boundary-aware labels at their respective optimised thresholds. ExtraTrees accuracy metrics are from the full 85.3 M-pixel evaluation domain; Attention U-Net accuracy metrics are from the test set (≈5.8 M pixels). Full-raster wetland proportion and area are reported for both.
| Model | Thr. | Acc. | P | R | F1 | IoU | Pred % | Pred area (ha) |
|---|---|---|---|---|---|---|---|---|
| ExtraTrees | 0.35 | 96.51% | 78.14% | 72.42% | 75.17% | 60.22% | 6.75 | 57,615.88 |
| Attention U-Net | 0.80 | 96.92% | 84.19% | 68.90% | 75.78% | 61.01% | 6.38 | 54,442.30 |
| Buffered reference | – | – | – | – | – | – | 7.29 | 62,164.73 |
Disclaimer/Publisher’s Note: The statements, opinions and data contained in all publications are solely those of the individual author(s) and contributor(s) and not of MDPI and/or the editor(s). MDPI and/or the editor(s) disclaim responsibility for any injury to people or property resulting from any ideas, methods, instructions or products referred to in the content. |
© 2026 by the authors. Licensee MDPI, Basel, Switzerland. This article is an open access article distributed under the terms and conditions of the Creative Commons Attribution (CC BY) license.
Copyright: This open access article is published under a Creative Commons CC BY 4.0 license, which permit the free download, distribution, and reuse, provided that the author and preprint are cited in any reuse.