

Submitted:
08 October 2026
Posted:
10 October 2026
You are already at the latest version
Abstract
Objectives: Diffuse idiopathic skeletal hyperostosis (DISH) is associated with cardiometabolic abnormalities, but its circulating immune-cell profile remains poorly characterized. We examined associations of circulating immune-cell subsets and soluble inflammatory markers with prevalent DISH.
Method: This cross-sectional study analysed existing radiographic, clinical, and laboratory data from 526 participants in the Iwaki Health Promotion Project. Associations with prevalent DISH were examined using Firth penalized logistic regression adjusted for age, sex, and visceral fat area, with false-discovery-rate correction across the immune-cell and inflammatory-marker panel. Additional exploratory analyses evaluated relative and absolute CD16+CD56+ NK-cell measures, cardiometabolic adjustment, and radiographic phenotypes.
Results: Forty-one participants had DISH and 31 had early-phase DISH (EDISH). CD16+CD56+ NK-cell proportion was positively associated with DISH (OR 2.60 per 10-percentage-point increase, 95% CI 1.81–3.73), whereas CD16−CD56− proportion was inversely associated (OR 0.41, 95% CI 0.29–0.58). Both associations remained significant after multiple-testing correction. CD4+CD8− helper T-cell proportion showed a nominal inverse association that did not survive correction. Absolute CD16+CD56+ NK-cell count was associated with DISH when modelled separately, but only the proportion remained statistically significant when both measures were included. Median proportions were 11%, 16%, and 18% in participants with neither DISH nor EDISH, EDISH, and definite DISH, respectively. No association with ossification burden was detected among participants with DISH.
Conclusions: DISH was associated with differences in circulating immune-cell proportions, most notably a higher CD16+CD56+ NK-cell proportion. These findings warrant independent confirmation and longitudinal investigation but do not establish a causal role for NK cells in spinal ossification.
Keywords:
diffuse idiopathic skeletal hyperostosis
; natural killer cells
; innate immunity
; flow cytometry
; cardiometabolic abnormalities
Introduction
Diffuse idiopathic skeletal hyperostosis (DISH) is a systemic hyperostotic disorder characterized by flowing anterolateral spinal ossification and bridging of adjacent vertebral segments [1,2]. Although spinal ankylosis and its associated fracture risk are well recognized [3], the systemic factors accompanying DISH remain incompletely understood. DISH has been associated with metabolic syndrome, particularly central obesity and elevated blood pressure [4,5], and with cardiovascular morbidity [6]. Insulin resistance has also been associated with DISH, although this association attenuated after adjustment for metabolic syndrome components [7]. Together, these findings place DISH within a broader cardiometabolic context rather than an exclusively structural skeletal disorder.
The relationship between metabolic dysfunction and immunity provides a rationale for examining immune-cell profiles in DISH. Experimental studies of obesity have linked changes in adaptive and innate immune-cell populations to metabolic inflammation and impaired insulin sensitivity [8,9]. In DISH, observations of low-grade inflammation [10,11], altered Dickkopf-1 concentrations [12], and altered adiponectin levels [13] have likewise prompted interest in the systemic processes accompanying ossification. Whether these metabolic and soluble-marker findings are accompanied by differences in circulating immune-cell subsets, however, remains unclear.
Circulating lymphocyte subsets provide a cellular perspective complementary to soluble inflammatory markers. Their proportions and absolute counts describe related but distinct features of the circulating immune-cell profile. Because proportions depend on the reference population, a higher proportion may reflect a higher count of the measured subset, lower counts of other populations, or both [14,15]. Evaluation of both measures may therefore aid interpretation of associations between immune-cell composition and DISH.
We therefore examined associations of circulating NK-, T-, and B-cell subsets and soluble inflammatory markers with prevalent DISH in a community-based cohort. Complementary analyses assessed relative and absolute cellular measures, the influence of cardiometabolic adjustment, and associations with radiographic phenotype and ossification burden.
Methods
Study Design and Participants
This cross-sectional study used existing participant-level data from the Iwaki Health Promotion Project, a community-based health-examination programme in Hirosaki, Japan [16]. Radiographic, clinical, anthropometric, biochemical, and immune-cell data were obtained from the project database. No additional examinations or laboratory measurements were undertaken for the present analysis.
Participants aged ≥20 years who provided written informed consent and underwent the relevant health examination were eligible. The present analysis required interpretable whole-spine radiographs, available immune-cell measurements, and complete data for covariates included in the primary model. Radiographic, clinical, and laboratory data were reviewed for completeness and data quality before statistical analysis.
Participants with conditions that precluded reliable radiographic classification of DISH, including ankylosing spondylitis and relevant postoperative spinal conditions, were excluded. Participants were not excluded on the basis of immune-cell measurements, metabolic characteristics, or statistical outlier status.
The study was approved by the Ethics Committee of Hirosaki University Graduate School of Medicine and conducted in accordance with the Declaration of Helsinki. Written informed consent was obtained from all participants.
Radiographic Assessment
Lateral whole-spine radiographs were independently evaluated by two orthopedic physicians blinded to metabolic and immune-cell measurements. Disagreements were resolved by consultation with a third physician and, when necessary, consensus discussion. Inter-reader reliability was assessed using Cohen’s κ for DISH classification and a two-way random-effects, absolute-agreement, single-measure intraclass correlation coefficient for the ossification burden score (OBS); positive and negative agreement were additionally summarized for DISH classification, and Bland–Altman analysis assessed agreement in OBS.
DISH was defined according to established radiographic criteria requiring flowing anterolateral ossification or bridging across at least four contiguous vertebral bodies without radiographic findings indicating ankylosing spondylitis. EDISH was classified according to Kuperus et al. [17]. In the primary binary analysis, participants with EDISH were included in the non-definite-DISH comparator group and retained separately for radiographic-spectrum analyses. Anterior spinal ossification at each available intervertebral level was graded from 0 to 3 (0, no definite ossification; 1, nonbridging newly formed bone; 2, near-complete bridging; 3, complete bridging) [17,18]. Segmental scores were summed to obtain OBS. OBS analyses were restricted to participants with definite DISH and considered exploratory.
Clinical and Metabolic Measurements
Clinical and metabolic variables included body mass index (BMI), waist circumference, visceral fat area (VFA), systolic and diastolic blood pressure (SBP and DBP), fasting glucose, fasting insulin, triglycerides (TG), and high-density lipoprotein cholesterol (HDL-C). HOMA-IR was calculated as fasting insulin (µU/mL) × fasting glucose (mmol/L)/22.5, and the triglyceride-glucose (TyG) index as ln[fasting TG (mg/dL) × fasting glucose (mg/dL)/2]. Information on diabetes, dyslipidemia, hypertension, glucose-lowering therapy, lipid-lowering therapy, antihypertensive treatment, smoking history, and alcohol use was obtained from the project’s clinical and questionnaire records. Metabolic variables were grouped into glycemic, lipid, adiposity, hemodynamic, diagnosed-condition, and medication domains for sensitivity analyses.
Inflammatory Markers and Immune-Cell Variables
Inflammatory markers comprised C-reactive protein (CRP), high-sensitivity CRP (hs-CRP), interleukin-6 (IL-6), tumour necrosis factor-α (TNF-α), and complement component C3. CRP, hs-CRP, IL-6, and TNF-α were natural-log transformed for regression analyses because of their right-skewed distributions; C3 was analysed on its original scale.
Immune-cell variables were analysed according to the classifications provided in the Iwaki database. These included CD16/CD56-defined NK-cell populations (CD16+CD56+, CD16−CD56+, CD16+CD56−, and CD16−CD56−), CD4+CD8+ double-positive T cells, CD4−CD8+ cytotoxic T cells, CD4+CD8− helper T cells, and CD3−CD19+ B cells. Relative proportions and absolute counts were available.
Statistical Analysis
All tests were two-sided. Continuous variables were summarized as mean±SD or median [interquartile range], as appropriate, and categorical variables as number and percentage. Between-group comparisons used Student’s t test, Wilcoxon rank-sum test, χ² test, or Fisher exact test as appropriate. Analyses were performed using R version 4.4.3 (R Foundation for Statistical Computing, Vienna, Austria).
Primary Analysis
The primary outcome was prevalent DISH. Associations with the available immune-cell proportions were examined using Firth penalized logistic regression, with estimates expressed per 10-percentage-point increase. The principal adjustment set comprised age, sex, and VFA. Given the limited number of DISH events, more extensive covariate adjustment was reserved for sensitivity analyses. BMI and waist circumference were evaluated as alternative adiposity measures rather than included simultaneously with VFA.
Additional post-hoc exploratory analyses characterized the CD16+CD56+ NK-cell association using absolute counts, quartiles, and restricted cubic splines. Absolute counts were modelled per 100 cells/µL. Effect estimates were reported as odds ratios (ORs) with 95% confidence intervals (CIs).
Dose-response was evaluated using quartiles and restricted cubic splines with three knots placed at the 10th, 50th, and 90th percentiles of the CD16+CD56+ NK-cell proportion distribution (6%, 12%, and 23%, respectively), with the median value (12%) as the reference. Departure from linearity was assessed using a Wald test of the nonlinear spline term.
Relative Versus Absolute Immune-Cell Representation
Three age-, sex-, and VFA-adjusted Firth models evaluated (1) absolute CD16+CD56+ NK-cell count alone, (2) relative CD16+CD56+ NK-cell proportion alone, and (3) absolute count and relative proportion simultaneously. Corresponding maximum-likelihood logistic models were fitted to compare Akaike information criterion (AIC) and area under the receiver operating characteristic curve (AUC) across the base, count, proportion, and count-plus-proportion models, while Firth regression was retained for coefficient estimation and inference.
An exploratory log-ratio analysis contrasted the CD16+CD56+ proportion with the geometric mean of the other three CD16/CD56-defined proportions [14,15]. A balance contrasting CD16+CD56+ NK cells with the geometric mean of the remaining three CD16/CD56 NK-cell populations was calculated as √(3/4) × ln[CD16+CD56+ / geometric mean of the other three components]. A 0.5-percentage-point pseudo-count was added to each component before log transformation; pseudo-counts of 0.25 and 1.0 were examined in sensitivity analyses. The balance was standardized and analyzed using Firth regression adjusted for age, sex, and VFA.
Multiple Testing and Inflammatory-Marker Analyses
Soluble inflammatory markers were evaluated using the same age-, sex-, and VFA-adjusted framework. Benjamini–Hochberg false-discovery-rate correction was applied jointly to the eight immune-cell proportions and five soluble inflammatory markers, including the CD16+CD56+ NK-cell association. Follow-up analyses of CD16+CD56+ NK cells were considered exploratory. Sensitivity analysis excluded participants with elevated inflammatory activity, defined as CRP >1.0 mg/dL or hs-CRP >0.3 mg/dL.
Cardiometabolic Adjustment
Potential cardiometabolic confounding was evaluated across glycemic (glucose, insulin), lipid [ln(TG), HDL-C], adiposity, hemodynamic (SBP, DBP), diagnosed metabolic-condition, and medication domains. Domain-specific models included age, sex, and the corresponding variables. VFA represented adiposity in the primary model, while BMI and waist circumference were evaluated in separate alternative-adiposity models.
A comprehensive model included age, sex, VFA, fasting glucose, fasting insulin, ln(TG), HDL-C, SBP, and DBP. Additional Firth sensitivity models further incorporated diabetes, dyslipidemia, hypertension, and glucose-lowering, lipid-lowering, and antihypertensive medications. Given the 41 definite-DISH events, estimates from these highly parameterized models were interpreted as sensitivity estimates. Change in the CD16+CD56+ coefficient relative to the age- and sex-adjusted model was summarized descriptively on the log-OR scale as 100×(βreference−βadjusted)/βreference.
A complementary metabolic-dysregulation score was constructed by equally weighting z-standardized glucose, ln(TG), reverse-coded HDL-C, VFA, and SBP and re-standardizing the composite to mean 0 and SD 1. Clinical metabolic burden was evaluated by comparing participants with none versus at least one diagnosed metabolic condition (diabetes, dyslipidemia, or hypertension), and interaction between clinical metabolic status and CD16+CD56+ proportion was examined. Exploratory comparisons of model fit and apparent discrimination used AIC, AUC, and likelihood-ratio testing for the comprehensive metabolic model with and without CD16+CD56+ proportion.
Radiographic Phenotype Analyses
CD16+CD56+ proportions were compared across the mutually exclusive none, EDISH, and definite-DISH categories. Age-, sex-, and VFA-adjusted ordinal logistic regression was used to evaluate the ordered none–EDISH–DISH radiographic phenotype. The proportional-odds assumption was assessed by comparing regression coefficients across cumulative logits using a global Wald test; the common OR was reported when this assumption was not violated. Separate Firth logistic models compared EDISH with none and DISH with none. Among participants with DISH, Spearman rank correlation was used to evaluate the association between CD16+CD56+ proportion and OBS.
Robustness and Model Diagnostics
Robustness analyses included replacement of VFA with BMI or waist circumference; exclusion of EDISH from the binary comparator group; exclusion of participants with elevated inflammatory activity; 1,000 nonparametric bootstrap repetitions; sequential exclusion of observations with the highest influence statistics; and exploratory interaction analyses by age and sex. Bootstrap analyses resampled participants with replacement and refitted the primary model in each replicate.
Variance inflation factors were examined for multicollinearity. Calibration was assessed using the Hosmer-Lemeshow statistic from the corresponding maximum-likelihood logistic model. Missing values were not imputed, and analysis-specific complete cases were used.
Results
Study Population
The available study dataset comprised 536 participants. After exclusion of two participants with ankylosing spondylitis, four with a history of spinal surgery, and four with invalid VFA values, 526 participants remained: 454 with neither DISH nor EDISH, 31 with EDISH, and 41 with definite DISH. The binary analysis compared 41 participants with DISH with 485 without definite DISH (Supplementary Figure S1).
Mean age was 62.08±10.65 years and did not differ significantly between groups. Participants with DISH had higher BMI, waist circumference, VFA, SBP, fasting glucose, TG, TyG, and HOMA-IR (Table 1). Median VFA was 84.0 [72.7–103.4] versus 66.8 [52.3–87.3] cm² (P=1.09×10⁻⁴), median SBP was 139.0 [130.5–147.0] versus 123.0 [111.0–136.0] mmHg (P=5.59×10⁻⁸), and hypertension was present in 53.7% versus 20.6% (P=9.64×10⁻⁶), respectively. Inter-reader agreement for DISH classification was excellent (521/526 concordant; κ=0.932, 95% CI 0.872–0.991), as was OBS reliability (ICC=0.997, 95% CI 0.996–0.998) (Supplementary Table S1).
Associations of Immune-Cell Subsets and Inflammatory Markers with DISH
CD16+CD56+ NK-cell proportion was positively associated with DISH (OR 2.60 per 10-percentage-point increase, 95% CI 1.81–3.73), whereas CD16−CD56− proportion was inversely associated (OR 0.41, 95% CI 0.29–0.58). Both associations remained significant after BH-FDR correction. CD4+CD8− helper T-cell proportion showed a nominal inverse association (OR 0.58, 95% CI 0.38–0.89; P=0.0128) that did not survive correction. None of the other immune-cell proportions or soluble inflammatory markers met the FDR threshold of 0.05 (Figure 2; Supplementary Table S2).
Association of CD16+CD56+ Proportion with DISH
Median CD16+CD56+ NK-cell proportion was 18% [12–24%] in participants with DISH and 12% [8–16%] in those without definite DISH (P=4.15×10⁻⁶) (Figure 1A). In the age-, sex-, and VFA-adjusted Firth model, each 10-percentage-point increase was associated with higher odds of DISH (OR 2.60, 95% CI 1.81–3.73; P=2.14×10⁻⁷) (Table 2).
A graded association was observed across quartiles. Compared with the lowest quartile, the highest quartile had an OR of 8.39 (95% CI 2.62–26.86; P=3.37×10⁻⁴), and the OR per increasing quartile was 1.92 (95% CI 1.40–2.64; P=5.80×10⁻⁵). Restricted cubic spline analysis showed no evidence of nonlinearity (P=0.576) (Figure 1B; Table 2).
Median absolute CD16+CD56+ count was 276 [165–423] versus 182 [129–273] cells/µL in participants with and without DISH, respectively (P=5.26×10⁻⁴). When modeled separately, each 100-cells/µL increase was associated with DISH (OR 1.41, 95% CI 1.20–1.66; P=2.87×10⁻⁵). Absolute count and relative proportion were strongly correlated (Spearman ρ=0.835). In the mutually adjusted model, absolute count was not associated with DISH (OR 0.97, 95% CI 0.72–1.30; P=0.816), whereas relative proportion remained associated (OR 2.77 per 10 percentage points, 95% CI 1.47–5.23; P=0.00167) (Table 2; Figure 1C). AIC/AUC values were 283.8/0.693 for the base model, 268.5/0.730 with absolute count, 258.3/0.767 with relative proportion, and 260.2/0.768 with both measures (Table 2).
The standardized compositional log-ratio balance was associated with DISH (OR 1.94 per SD, 95% CI 1.38–2.74; P=1.38×10⁻⁴), with similar estimates using alternative pseudo-counts of 0.25 and 1.0 percentage point (Supplementary Table S3).
Association Across Cardiometabolic Characteristics
In exploratory cardiometabolic sensitivity analyses, the CD16+CD56+ NK-cell estimates remained positive across the alternative adjustment sets (Table 3; Supplementary Figure S2). ORs were 2.46 (95% CI 1.72–3.53; P=7.9×10⁻⁷) after glycemic adjustment, 2.42 (95% CI 1.68–3.49; P=2.01×10⁻⁶) after lipid adjustment, and 2.02 (95% CI 1.40–2.91; P=1.78×10⁻⁴) after hemodynamic adjustment. Alternative BMI and waist-circumference models yielded ORs of 2.44 and 2.47, respectively.
In the comprehensive measured-metabolic model, the OR remained 2.00 (95% CI 1.36–2.94; P=3.91×10⁻⁴). Additional adjustment for diabetes, dyslipidemia, and hypertension yielded an OR of 1.87 (95% CI 1.27–2.75; P=0.00160), and further adjustment for related medications yielded 1.86 (95% CI 1.26–2.75; P=0.00173). Adjustment for the metabolic-dysregulation score yielded an OR of 2.36 (95% CI 1.65–3.36) (Table 3; Supplementary Figure S2).
Among participants without diagnosed diabetes, dyslipidemia, or hypertension, the OR was 3.14 (95% CI 1.71–5.79), compared with 1.85 (95% CI 1.16–2.96) among those with at least one condition; the interaction was not significant (P=0.126). Adding CD16+CD56+ proportion to the comprehensive model reduced AIC from 265.2 to 253.5 and increased AUC from 0.818 to 0.836 (likelihood-ratio P=2.11×10⁻⁴) (Table 3). Among metabolic correlates, SBP showed the strongest association with CD16+CD56+ proportion (+2.14 percentage points per 1 SD; BH-FDR=2.51×10⁻⁹); DBP, TyG, and ln(TG) were also positively associated after BH-FDR correction, whereas glucose, HOMA-IR, HDL-C, VFA, and fasting insulin were not (Supplementary Table S4).
CD16+CD56+ Composition Across Radiographic Phenotypes
Median CD16+CD56+ NK-cell proportions were 11% [8–15.75%], 16% [12.5–21%], and 18% [12–24%] in participants with neither DISH nor EDISH, EDISH, and definite DISH, respectively (P=2.79×10⁻⁸) (Figure 3; Supplementary Table S5). Each 10-percentage-point increase was associated with EDISH versus none (OR 2.16, 95% CI 1.40–3.35) and definite DISH versus none (OR 2.86, 95% CI 1.96–4.17). The proportional-odds assumption was not violated (global P=0.250), and the corresponding common OR for a higher radiographic category was 2.58 (95% CI 1.90–3.50; P=1.04×10⁻⁹). Among participants with definite DISH, neither relative proportion (ρ=0.196, P=0.220) nor absolute count (ρ=0.256, P=0.106) was associated with OBS (Supplementary Table S5).
Robustness and Model Diagnostics
The primary association remained stable across alternative adiposity adjustment, exclusion of EDISH, inflammatory-marker exclusion, bootstrap resampling, and influence analyses. Across 1,000 bootstrap samples, the median OR was 2.65 with a percentile 95% interval of 1.87–3.95, and sequential exclusion of the 10 highest-influence observations yielded ORs of 2.47–2.84 (Supplementary Figure S3; Supplementary Table S4). The conventional primary model had AUC 0.767 and Hosmer–Lemeshow P=0.585. The maximum VIF was 1.01 in the primary model and 3.31 and 3.29 for absolute count and relative proportion, respectively, in the mutually adjusted model. Age and sex interactions were not significant (Supplementary Table S4).
Discussion
In this community-based cross-sectional study, DISH was associated with differences in circulating immune-cell proportions. CD16+CD56+ NK-cell proportion was positively associated and CD16−CD56− proportion was inversely associated with DISH after adjustment for age, sex, and VFA and correction for multiple testing. CD4+CD8− helper T-cell proportion showed a nominal inverse association that did not survive correction. Further analyses demonstrated associations with both the relative proportion and absolute count of CD16+CD56+ NK cells when evaluated separately, whereas only the proportion remained statistically significant in the mutually adjusted model. The proportion also differed across radiographic categories, but no association with ossification burden was detected among participants with definite DISH.
Previous studies have linked DISH to metabolic syndrome, cardiovascular morbidity, and insulin resistance [4,5,6,7], while studies of inflammatory and bone-regulatory mediators have suggested that its systemic phenotype extends beyond conventional metabolic abnormalities [10,11,12,13]. The present analysis adds a cellular perspective to these observations. None of the soluble inflammatory markers examined met the multiple-testing threshold, and exclusion of participants with elevated CRP or hs-CRP yielded a similar CD16+CD56+ NK-cell estimate. This pattern suggests that the observed cellular association was not restricted to participants with elevated circulating inflammatory markers. It does not, however, establish that cellular changes are biologically more important than soluble inflammation or that peripheral blood findings reflect local immune activity at sites of ossification.
Interpretation of the relative and absolute measures requires consideration of their mathematical dependence. CD16+CD56+ NK-cell proportion and count were strongly correlated, and the mutually adjusted model estimated the association of each measure conditional on the other. The log-ratio analysis provided a complementary relative contrast within the recorded CD16/CD56 profile [14,15], but neither analysis identifies the biological process underlying the association. Differences in cell production, survival, trafficking, margination, or the abundance of other circulating populations remain possible explanations. The inverse CD16−CD56− association may partly reflect the interdependence of the proportions and should not be interpreted as evidence of a protective cellular mechanism. Similarly, the nominal CD4+CD8− helper T-cell association provides an additional exploratory observation rather than evidence of an independent protective effect.
NK cells are responsive to their metabolic environment. Experimental studies have linked NK-cell activity to adipose inflammation and insulin resistance, and obesity-related metabolic changes can alter NK-cell function [9,19,20]. Circulating NK-cell measures have also been associated with blood pressure in population-based research [21]. These observations provide a plausible context for the present association, given the cardiometabolic characteristics of DISH. However, NK-cell phenotype and function vary with maturation and tissue distribution [22,23,24], and the available measurements did not assess activation, cytotoxicity, cytokine production, or tissue localization. A higher circulating CD16+CD56+ NK-cell proportion therefore cannot be interpreted as evidence of increased NK-cell activity or direct participation in pathological ossification.
Shared cardiometabolic determinants remain an important explanation for the association. CD16+CD56+ NK-cell estimates remained positive across the domain-specific and expanded adjustment sets, with the largest reduction among the domain-specific models observed after hemodynamic adjustment. Changes in logistic regression coefficients do not quantify mediation or the proportion of an association explained by additional covariates. Moreover, the limited number of DISH events constrains interpretation of the expanded models despite Firth penalization; the age-, sex-, and VFA-adjusted analysis remains the principal basis for inference. Subgroup estimates were imprecise, and the interaction with diagnosed metabolic conditions was not significant. The lower AIC and modestly higher apparent AUC after adding NK-cell proportion describe exploratory within-sample model comparisons, not established diagnostic or predictive utility.
CD16+CD56+ NK-cell proportions differed across the radiographic categories, with the lowest median in participants with neither DISH nor EDISH and the highest in those with definite DISH. Although EDISH criteria and longitudinal imaging studies provide a framework for studying early radiographic changes [17,25], the present comparisons involved different individuals examined at a single time point and do not demonstrate progression from EDISH to DISH. No association with OBS was detected among participants with established DISH. The small case sample limits interpretation of this null result, but the findings do not establish NK-cell proportion as a marker of ossification burden.
Strengths include the community-based setting, integrated clinical and radiographic data, high inter-reader reliability, evaluation of multiple immune-cell and inflammatory measures, and complementary analyses of relative and absolute NK-cell measures. Firth regression and sensitivity analyses addressed several sources of statistical instability. Several limitations should be acknowledged. The cross-sectional design precludes temporal and causal inference. Only 41 participants had definite DISH, limiting precision and increasing the risk of overfitting in highly adjusted and subgroup analyses. The exploratory examination of multiple markers and further characterization within the same dataset require independent confirmation. Immune-cell measurements were obtained at a single examination and did not capture activation, functional capacity, or tissue localization. Residual confounding remains possible from smoking, physical activity, recent infection, chronic viral exposure, and immune-modifying medications not accounted for in the principal analysis. Cytomegalovirus is particularly relevant because it can produce persistent changes in the NK-cell repertoire [26]; exclusion based on CRP or hs-CRP does not address this source of variation. Complete-case selection may also limit representativeness. Finally, the findings derive from a single Japanese community cohort and may not generalize to other populations
Conclusion
DISH was associated with a higher circulating CD16+CD56+ NK-cell proportion and a lower CD16−CD56− proportion after adjustment for age, sex, and VFA and correction for multiple testing. The CD4+CD8− helper T-cell association was nominal and did not survive correction. These findings extend the characterization of DISH from cardiometabolic abnormalities to circulating immune-cell profiles, but do not establish a cellular mechanism or longitudinal progression. Independent and longitudinal studies are needed to clarify their biological significance.
Supplementary Materials
The following supporting information can be downloaded at the website of this paper posted on Preprints.org.
Author Contributions
Yu Li: Conceptualization; Methodology; Formal analysis; Data curation; Validation; Investigation; Software; Visualization; Writing—original draft. Gentaro Kumagai: Data curation; Investigation; Validation; Writing—review & editing. Sunao Tanaka: Data curation; Validation; Resources; Writing—review & editing. Kairo Wada: Data curation; Validation. Takaaki Nakano: Data curation. Sho Kaneko: Data curation. Kazushige Koyama: Data curation. Yasuyuki Ishibashi: Data curation; Supervision. Koichi Murashita: Data curation; Resources. Kanichiro Wada: Conceptualization; Data curation; Writing—review & editing; Supervision; Project administration.
Funding
This work was supported by the Japan Science and Technology Agency (JST) [Grant Nos. JPMJCE1302, JPMJCA2201, and JPMJPF2210].
Competing interests
The authors declare that they have no competing interests.
Ethics approval
The study was approved by the Ethics Committee of Hirosaki University Graduate School of Medicine (2022-007H) and was conducted in accordance with the ethical standards of the Declaration of Helsinki and its later amendments.
Consent to participate
Written informed consent was obtained from all participants before participation in the Iwaki Health Promotion Project.
Competing interests
The authors declare that they have no relevant financial or non-financial interests to disclose.
Data availability
The datasets analyzed during the current study are not publicly available because they contain participant-level information subject to privacy protections and restrictions under the ethical approval and informed consent governing the Iwaki Health Promotion Project. Data may be available from the corresponding author upon reasonable request and with appropriate permission from the relevant ethics committee and the Iwaki Health Promotion Project.
Additional Model-Comparison Row
| Model | AIC | AUC |
| Age + sex + VFA only | 283.8 | 0.693 |
| + Absolute CD16+CD56+ count | 268.5 | 0.730 |
| + CD16+CD56+ proportion | 258.3 | 0.767 |
| + Absolute count + proportion | 260.2 | 0.768 |
Odds ratios were estimated using Firth penalized logistic regression adjusted for age, sex, and VFA. †AIC and AUC were obtained from the corresponding conventional maximum-likelihood logistic regression models because Firth regression was used for coefficient estimation and inference. Relative proportion was modeled per 10-percentage-point increase and absolute count per 100 cells/μL. Quartiles were defined from the cohort distribution of CD16+CD56+ proportion. The compositional balance contrasted CD16+CD56+ with the geometric mean of the remaining three CD16/CD56-defined components and was standardized before modeling. The restricted cubic spline used three knots at the 10th, 50th, and 90th percentiles of the CD16+CD56+ NK-cell proportion distribution (6%, 12%, and 23%, respectively), with 12% as the reference; departure from linearity was assessed using a Wald test of the nonlinear spline term. AUC, area under the receiver operating characteristic curve; CI, confidence interval; OR, odds ratio.
References
- Kuperus, J.S.; Mohamed Hoesein, F.A.A.; de Jong, P.A.; Verlaan, J.J. Diffuse idiopathic skeletal hyperostosis: Etiology and clinical relevance. Best Pract. Res. Clin. Rheumatol. 2020, 34(3), 101527. [Google Scholar] [CrossRef] [PubMed]
- Resnick, D.; Niwayama, G. Radiographic and pathologic features of spinal involvement in diffuse idiopathic skeletal hyperostosis (DISH). Radiology 1976, 119(3), 559–68. [Google Scholar] [CrossRef] [PubMed]
- Westerveld, L.A.; Verlaan, J.J.; Oner, F.C. Spinal fractures in patients with ankylosing spinal disorders: a systematic review of the literature on treatment, neurological status and complications. Eur. Spine J. 2009, 18(2), 145–56. [Google Scholar] [CrossRef] [PubMed]
- Mader, R.; Novofestovski, I.; Adawi, M.; Lavi, I. Metabolic syndrome and cardiovascular risk in patients with diffuse idiopathic skeletal hyperostosis. Semin Arthritis Rheum. 2009, 38(5), 361–365. [Google Scholar] [CrossRef] [PubMed]
- Okada, E.; Ishihara, S.; Azuma, K.; Michikawa, T.; Suzuki, S.; Tsuji, O.; et al. Metabolic Syndrome is a Predisposing Factor for Diffuse Idiopathic Skeletal Hyperostosis. Neurospine 2021, 18(1), 109–116. [Google Scholar] [CrossRef] [PubMed]
- Glick, K.; Novofastovski, I.; Schwartz, N.; Mader, R. Cardiovascular disease in diffuse idiopathic skeletal hyperostosis (DISH): from theory to reality-a 10-year follow-up study. Arthritis Res. Ther. 2020, 22(1), 190. [Google Scholar] [CrossRef] [PubMed]
- Li, Y.; Wada, K.; Wada, K.; Nakano, T.; Kumagai, G.; Kaneko, S.; Koyama, K.; Tanaka, S.; Ishibashi, Y. Exploring the association between insulin resistance and diffuse idiopathic skeletal hyperostosis: a cross-sectional observational study. Spine J. 2026, 26(5), 942–956. [Google Scholar] [CrossRef] [PubMed]
- Winer, S.; Chan, Y.; Paltser, G.; Truong, D.; Tsui, H.; Bahrami, J.; Dorfman, R.; Wang, Y.; Zielenski, J.; Mastronardi, F.; Maezawa, Y.; Drucker, D.J.; Engleman, E.; Winer, D.; Dosch, H.M. Normalization of obesity-associated insulin resistance through immunotherapy. Nat. Med. 2009, 15(8), 921–9. [Google Scholar] [CrossRef] [PubMed]
- Wensveen, F.M.; Jelenčić, V.; Valentić, S.; Šestan, M.; Wensveen, T.T.; Theurich, S.; et al. NK cells link obesity-induced adipose stress to inflammation and insulin resistance. Nat. Immunol. 2015, 16(4), 376–385. [Google Scholar] [CrossRef] [PubMed]
- Mader, R.; Pappone, N.; Baraliakos, X.; Eshed, I.; Sarzi-Puttini, P.; Atzeni, F.; et al. Diffuse Idiopathic Skeletal Hyperostosis (DISH) and a Possible Inflammatory Component. Curr. Rheumatol. Rep. 2021, 23(1), 6. [Google Scholar] [CrossRef] [PubMed]
- Pariente, E.; Pini, S.F.; Olmos, J.M.; Fierro, P.; Landeras, R.; Ramos, C.; et al. Early stages of diffuse idiopathic skeletal hyperostosis (DISH) and chronic inflammation: the Camargo Cohort Study. Clin. Rheumatol. 2023, 42(7), 1931–1942. [Google Scholar] [CrossRef] [PubMed]
- Senolt, L.; Hulejova, H.; Krystufkova, O.; Forejtova, S.; Andres Cerezo, L.; Gatterova, J.; et al. Low circulating Dickkopf-1 and its link with severity of spinal involvement in diffuse idiopathic skeletal hyperostosis. Ann. Rheum. Dis. 2012, 71(1), 71–74. [Google Scholar] [CrossRef] [PubMed]
- Mader, R.; Novofastovski, I.; Schwartz, N.; Rosner, E. Serum adiponectin levels in patients with diffuse idiopathic skeletal hyperostosis (DISH). Clin. Rheumatol. 2018, 37(10), 2839–2845. [Google Scholar] [CrossRef] [PubMed]
- Yoo, J.; Sun, Z.; Greenacre, M.; Ma, Q.; Chung, D.; Kim, Y.M. A guideline for the statistical analysis of compositional data in immunology. Commun. Stat. Appl. Methods 2022, 29(4), 453–469. [Google Scholar] [CrossRef] [PubMed]
- Mert, M.C.; Filzmoser, P.; Endel, G.; Wilbacher, I. Compositional data analysis in epidemiology. Stat. Methods Med. Res. 2018, 27(6), 1878–1891. [Google Scholar] [CrossRef] [PubMed]
- Nakaji, S.; Ihara, K.; Sawada, K.; Parodi, S.; Umeda, T.; Takahashi, I.; Murashita, K.; Kurauchi, S.; Tokuda, I. Social innovation for life expectancy extension utilizing a platform-centered system used in the Iwaki health promotion project: A protocol paper. SAGE Open Med. 2021, 9, 20503121211002606. [Google Scholar] [CrossRef] [PubMed]
- Kuperus, J.S.; Oudkerk, S.F.; Foppen, W.; Mohamed Hoesein, F.A.; Gielis, W.P.; Waalwijk, J.; et al. Criteria for Early-Phase Diffuse Idiopathic Skeletal Hyperostosis: Development and Validation. Radiology 2019, 291(2), 420–426. [Google Scholar] [CrossRef] [PubMed]
- Mata, S.; Chhem, R.K.; Fortin, P.R.; Joseph, L.; Esdaile, J.M. Comprehensive radiographic evaluation of diffuse idiopathic skeletal hyperostosis: development and interrater reliability of a scoring system. Semin Arthritis Rheum. 1998, 28(2), 88–96. [Google Scholar] [CrossRef] [PubMed]
- O’Brien, K.L.; Finlay, D.K. Immunometabolism and natural killer cell responses. Nat. Rev. Immunol. 2019, 19(5), 282–290. [Google Scholar] [CrossRef] [PubMed]
- Michelet, X.; Dyck, L.; Hogan, A.; Loftus, R.M.; Duquette, D.; Wei, K.; et al. Metabolic reprogramming of natural killer cells in obesity limits antitumor responses. Nat. Immunol. 2018, 19(12), 1330–1340. [Google Scholar] [CrossRef] [PubMed]
- Delaney, J.A.C.; Olson, N.C.; Sitlani, C.M.; Fohner, A.E.; Huber, S.A.; Landay, A.L.; et al. Natural killer cells, gamma delta T cells and classical monocytes are associated with systolic blood pressure in the Multi-Ethnic Study of Atherosclerosis (MESA). BMC Cardiovasc Disord. 2021, 21(1), 45. [Google Scholar] [CrossRef] [PubMed]
- Freud, A.G.; Mundy-Bosse, B.L.; Yu, J.; Caligiuri, M.A. The Broad Spectrum of Human Natural Killer Cell Diversity. Immunity 2017, 47(5), 820–833. [Google Scholar] [CrossRef] [PubMed]
- Dogra, P.; Rancan, C.; Ma, W.; Toth, M.; Senda, T.; Carpenter, D.J.; et al. Tissue Determinants of Human NK Cell Development, Function, and Residence. Cell 2020, 180(4), 749–763.e13. [Google Scholar] [CrossRef] [PubMed]
- Ran, G.H.; Lin, Y.Q.; Tian, L.; Zhang, T.; Yan, D.M.; Yu, J.H.; Deng, Y.C. Natural killer cell homing and trafficking in tissues and tumors: from biology to application. Signal Transduct. Target Ther. 2022, 7(1), 205. [Google Scholar] [CrossRef] [PubMed]
- Fournier, D.E.; Battie, M.C.; Séguin, C.A. Spatiotemporal changes in imaging features associated with diffuse idiopathic skeletal hyperostosis (DISH). RMD Open 2024, 10(2), e004074. [Google Scholar] [CrossRef] [PubMed]
- Béziat, V.; Liu, L.L.; Malmberg, J.A.; Ivarsson, M.A.; Sohlberg, E.; Björklund, A.T.; Retière, C.; Sverremark-Ekström, E.; Traherne, J.; Ljungman, P.; Schaffer, M.; Price, D.A.; Trowsdale, J.; Michaëlsson, J.; Ljunggren, H.G.; Malmberg, K.J. NK cell responses to cytomegalovirus infection lead to stable imprints in the human KIR repertoire and involve activating KIRs. Blood 2013, 121(14), 2678–88. [Google Scholar] [CrossRef] [PubMed]
Figure 2.
Associations of circulating immune-cell subsets and soluble inflammatory markers with DISH. Points and horizontal intervals represent ORs and 95% CIs from Firth penalized logistic regression adjusted for age, sex, and VFA. Immune-cell proportions were modelled per 10-percentage-point increase. CRP, hs-CRP, IL-6, and TNF-α were natural-log transformed and modelled per 1-log-unit increase; C3 was modelled per 10-mg/dL increase. BH-FDR correction was applied jointly to all 13 markers, including CD16+CD56+ NK cells. Filled and open markers indicate BH-FDR values below and at or above 0.05, respectively. The horizontal axis is logarithmic, and all confidence intervals are displayed in full. †BH-FDR values were recalculated from the rounded P values reported in the manuscript.
Figure 2.
Associations of circulating immune-cell subsets and soluble inflammatory markers with DISH. Points and horizontal intervals represent ORs and 95% CIs from Firth penalized logistic regression adjusted for age, sex, and VFA. Immune-cell proportions were modelled per 10-percentage-point increase. CRP, hs-CRP, IL-6, and TNF-α were natural-log transformed and modelled per 1-log-unit increase; C3 was modelled per 10-mg/dL increase. BH-FDR correction was applied jointly to all 13 markers, including CD16+CD56+ NK cells. Filled and open markers indicate BH-FDR values below and at or above 0.05, respectively. The horizontal axis is logarithmic, and all confidence intervals are displayed in full. †BH-FDR values were recalculated from the rounded P values reported in the manuscript.
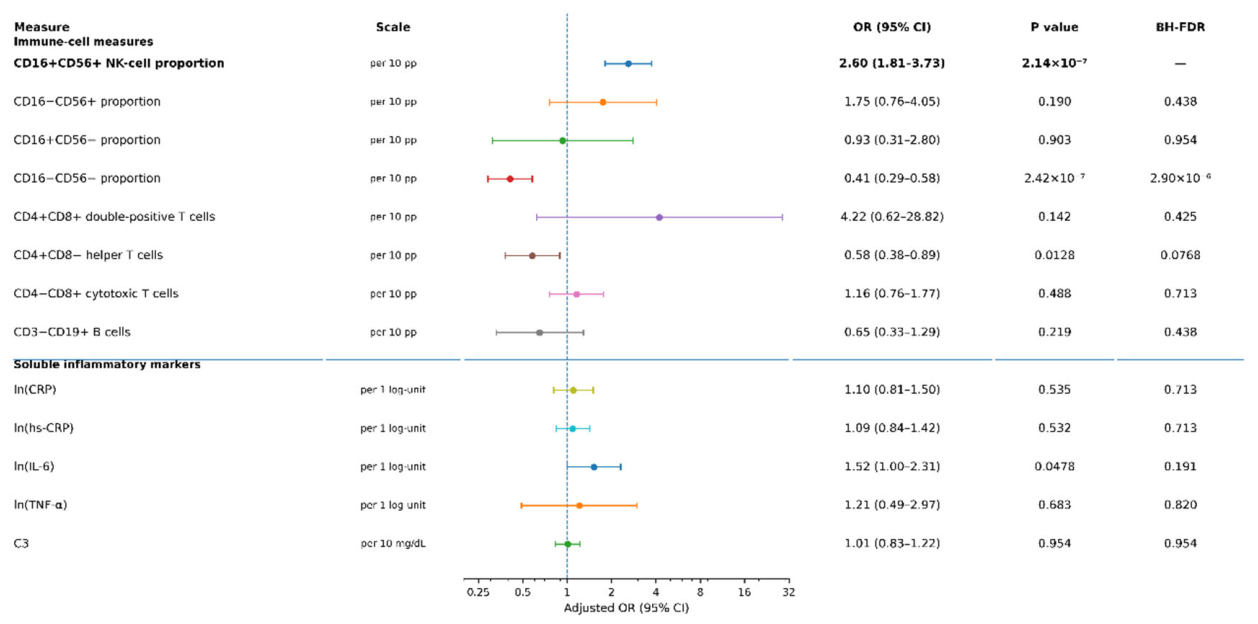
Figure 1.
Exploratory characterization of the association between circulating CD16+CD56+ NK cells and DISH. (A) CD16+CD56+ NK-cell proportions in participants with and without definite DISH. Violin plots display the distributions, with box plots indicating medians and interquartile ranges and jittered points representing individual observations. (B) Restricted cubic spline association estimated using Firth penalized logistic regression adjusted for age, sex, and VFA. The solid line indicates the adjusted OR and the shaded area the pointwise 95% CI. Knots were placed at 6%, 12%, and 23%, with 12% as the reference. The displayed P value tests departure from linearity. (C) Relationship between CD16+CD56+ NK-cell proportion and absolute count, with a fitted linear trend and Spearman correlation coefficient. These complementary analyses characterize associations within the same dataset and do not establish cellular expansion or redistribution.
Figure 1.
Exploratory characterization of the association between circulating CD16+CD56+ NK cells and DISH. (A) CD16+CD56+ NK-cell proportions in participants with and without definite DISH. Violin plots display the distributions, with box plots indicating medians and interquartile ranges and jittered points representing individual observations. (B) Restricted cubic spline association estimated using Firth penalized logistic regression adjusted for age, sex, and VFA. The solid line indicates the adjusted OR and the shaded area the pointwise 95% CI. Knots were placed at 6%, 12%, and 23%, with 12% as the reference. The displayed P value tests departure from linearity. (C) Relationship between CD16+CD56+ NK-cell proportion and absolute count, with a fitted linear trend and Spearman correlation coefficient. These complementary analyses characterize associations within the same dataset and do not establish cellular expansion or redistribution.
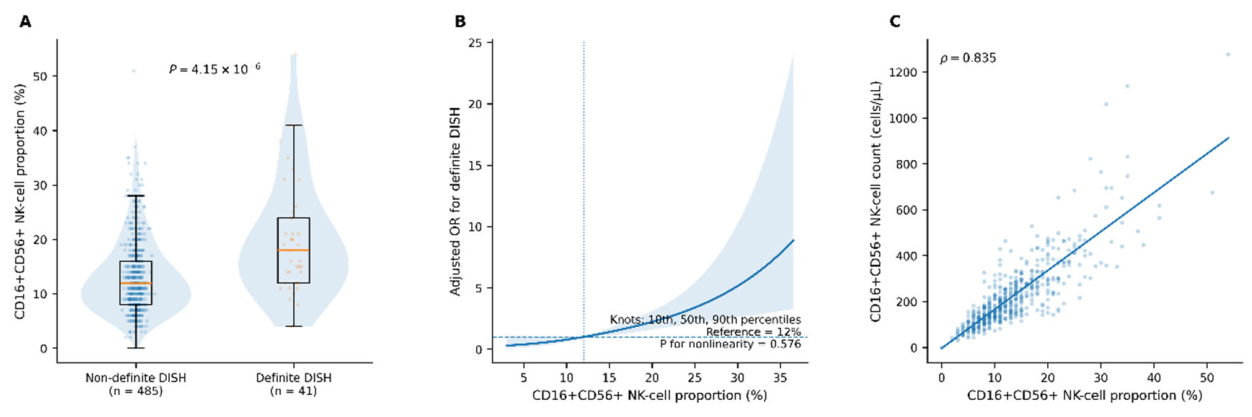
Figure 3.
CD16+CD56+ NK-cell proportions across cross-sectional radiographic categories. Box plots show medians and interquartile ranges, with jittered points representing individual observations. “None” denotes participants with neither DISH nor EDISH. Overall differences were evaluated using the Kruskal–Wallis test. The displayed common OR and 95% CI were obtained from ordinal logistic regression adjusted for age, sex, and VFA. The categories comprise different participants assessed at a single examination and do not represent observed longitudinal progression.
Figure 3.
CD16+CD56+ NK-cell proportions across cross-sectional radiographic categories. Box plots show medians and interquartile ranges, with jittered points representing individual observations. “None” denotes participants with neither DISH nor EDISH. Overall differences were evaluated using the Kruskal–Wallis test. The displayed common OR and 95% CI were obtained from ordinal logistic regression adjusted for age, sex, and VFA. The categories comprise different participants assessed at a single examination and do not represent observed longitudinal progression.
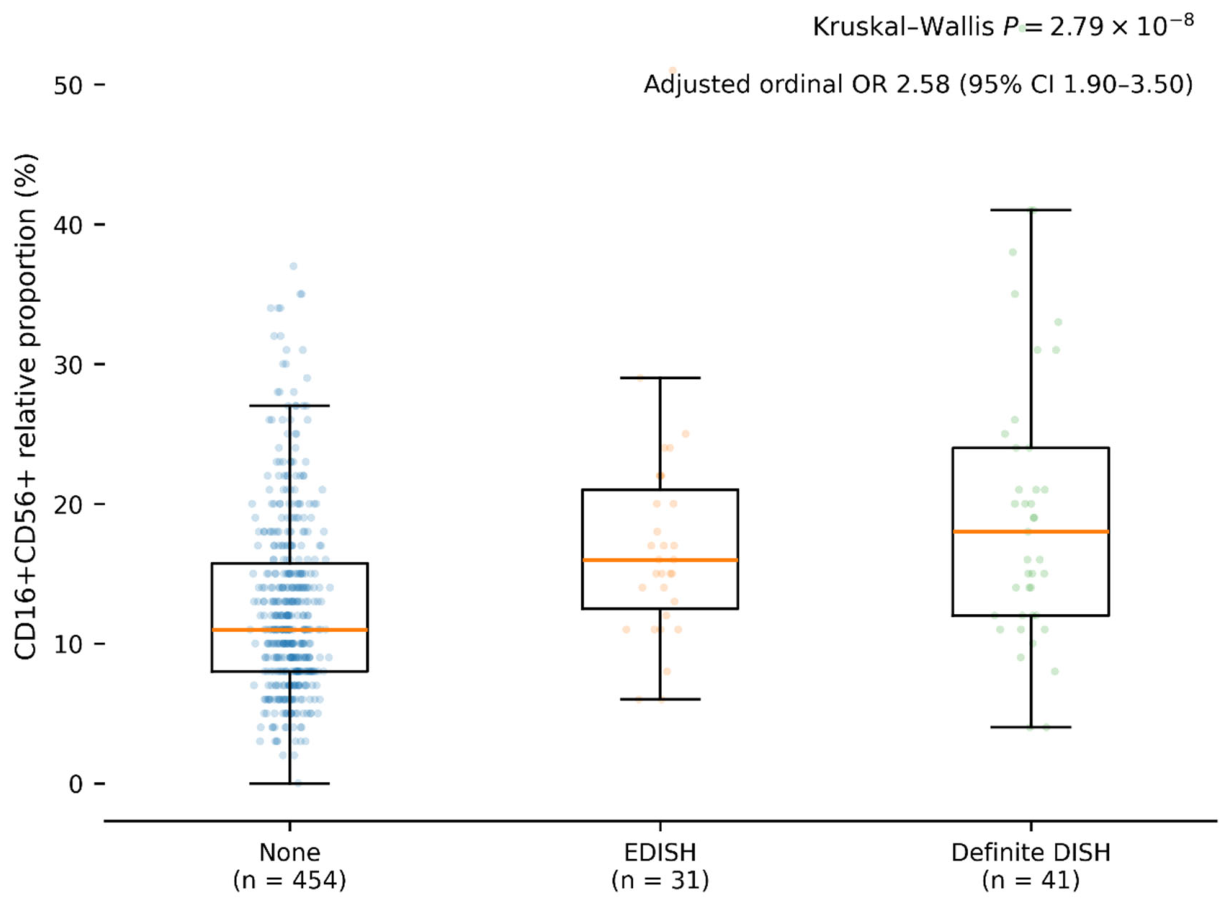

Table 1.
Characteristics of participants according to definite DISH status.
| Characteristic | Overall (n=526) | Non-DISH (n=485) | DISH (n=41) | P value |
|---|---|---|---|---|
| Demographic and lifestyle characteristics | ||||
| Age, years | 62.08±10.65 | 62.21±10.62 | 60.49±11.00 | 0.469 |
| Female sex, n (%) | 318 (60.5) | 288 (59.4) | 30 (73.2) | 0.097 |
| Smoking history, n (%) | 253 (48.1) | 234 (48.2) | 19 (46.3) | 0.872 |
| Current alcohol use, n (%) | 269 (51.1) | 246 (50.7) | 23 (56.1) | 0.521 |
| Anthropometric and hemodynamic characteristics | ||||
| BMI, kg/m² | 22.6 [20.5–24.9] | 22.4 [20.3–24.7] | 24.6 [22.9–26.4] | 7.36×10⁻⁶ |
| Waist circumference, cm | 80.3 [74.8–87.2] | 79.8 [74.4–86.4] | 87.5 [78.8–91.6] | 1.47×10⁻⁴ |
| VFA, cm² | 68.8 [52.7–90.6] | 66.8 [52.3–87.3] | 84.0 [72.7–103.4] | 1.09×10⁻⁴ |
| SBP, mmHg | 124.2 [112.5–137.5] | 123.0 [111.0–136.0] | 139.0 [130.5–147.0] | 5.59×10⁻⁸ |
| DBP, mmHg | 79.5 [72.0–87.0] | 79.0 [71.5–87.0] | 85.0 [79.5–87.0] | 0.0042 |
| Metabolic characteristics | ||||
| Fasting glucose, mg/dL | 96 [90–102] | 95 [90–101] | 104 [96–117] | 1.32×10⁻⁵ |
| Fasting insulin, μU/mL | 4.4 [3.1–6.1] | 4.2 [3.1–6.0] | 5.5 [3.7–6.7] | 0.023 |
| TG, mg/dL | 80 [58–123] | 78 [57–122] | 104 [85–136] | 0.0011 |
| HDL-C, mg/dL | 67 [55–79.8] | 67 [56–80] | 65 [54–73] | 0.446 |
| TyG index | 8.28 [7.89–8.72] | 8.24 [7.88–8.70] | 8.57 [8.38–9.04] | 1.65×10⁻⁴ |
| HOMA-IR | 1.04 [0.73–1.52] | 1.03 [0.72–1.46] | 1.52 [0.90–1.91] | 0.0026 |
| Diabetes, n (%) | 33 (6.3) | 31 (6.4) | 2 (4.9) | 1.000 |
| Dyslipidemia, n (%) | 92 (17.5) | 82 (16.9) | 10 (24.4) | 0.282 |
| Hypertension, n (%) | 122 (23.2) | 100 (20.6) | 22 (53.7) | 9.64×10⁻⁶ |
| Selected immune-cell measures | ||||
| CD16+CD56+ proportion, % | 12 [8–17] | 12 [8–16] | 18 [12–24] | 4.15×10⁻⁶ |
| CD16+CD56+ count, cells/μL | 185 [132–280] | 182 [129–273] | 276 [165–423] | 5.26×10⁻⁴ |
Values are mean±SD, median [interquartile range], or n (%), as appropriate. P values were obtained using Student’s t test or the Wilcoxon rank-sum test for continuous variables and the χ² test or Fisher exact test for categorical variables, as appropriate. Smoking history included current and former smoking. EDISH participants were included in the non-definite-DISH group for the primary binary comparison. BMI, body mass index; DBP, diastolic blood pressure; DISH, diffuse idiopathic skeletal hyperostosis; EDISH, early-phase DISH; HDL-C, high-density lipoprotein cholesterol; HOMA-IR, Homeostatic Model Assessment for Insulin Resistance; SBP, systolic blood pressure; TG, triglycerides; TyG, triglyceride-glucose index; VFA, visceral fat area.
Table 2.
Associations of relative and absolute CD16+CD56+ NK-cell measures with definite DISH.
| Analysis | Exposure specification | OR (95% CI) | P value | AIC | AUC |
|---|---|---|---|---|---|
| Relative-proportion analysis | Per 10-percentage-point increase | 2.60 (1.81–3.73) | 2.14×10⁻⁷ | 258.3 | 0.767 |
| Quartile analysis | Q1 | Reference | — | — | — |
| Q2 vs Q1 | 2.94 (0.84–10.24) | 0.091 | — | — | |
| Q3 vs Q1 | 3.13 (0.88–11.16) | 0.078 | — | — | |
| Q4 vs Q1 | 8.39 (2.62–26.86) | 3.37×10⁻⁴ | — | — | |
| Per increasing quartile | 1.92 (1.40–2.64) | 5.80×10⁻⁵ | — | — | |
| Restricted cubic spline | Departure from linearity | — | 0.576 | — | — |
| Absolute-count analysis | Per 100 cells/μL | 1.41 (1.20–1.66) | 2.87×10⁻⁵ | 268.5 | 0.730 |
| Mutually adjusted model | Absolute count, per 100 cells/μL | 0.97 (0.72–1.30) | 0.816 | 260.2 | 0.768 |
| Relative proportion, per 10 percentage points | 2.77 (1.47–5.23) | 0.00167 | — | — | |
| Compositional log-ratio analysis | Balance, per 1 SD | 1.94 (1.38–2.74) | 1.38×10⁻⁴ | — | — |
Table 3.
Exploratory cardiometabolic sensitivity analyses of the association between CD16+CD56+ NK-cell proportion and DISH.
Table 3.
Exploratory cardiometabolic sensitivity analyses of the association between CD16+CD56+ NK-cell proportion and DISH.
| Model | Adjustment variables | OR per 10-percentage-point increase (95% CI) | P value | Log-OR attenuation, %* |
|---|---|---|---|---|
| Demographic model | Age, sex | 2.53 (1.77–3.62) | 3.53×10⁻⁷ | Reference |
| Primary model | Age, sex, VFA | 2.60 (1.81–3.73) | 2.14×10⁻⁷ | −2.8 |
| Glycemic domain | Age, sex, fasting glucose, fasting insulin | 2.46 (1.72–3.52) | 7.9×10⁻⁷ | 3.0 |
| Lipid domain | Age, sex, ln(TG), HDL-C | 2.42 (1.68–3.49) | 2.01×10⁻⁶ | 4.6 |
| Hemodynamic domain | Age, sex, SBP, DBP | 2.02 (1.40–2.91) | 1.78×10⁻⁴ | 24.5 |
| Alternative adiposity | Age, sex, BMI | 2.44 (1.70–3.49) | 1.10×10⁻⁶ | 4.0 |
| Alternative adiposity | Age, sex, waist circumference | 2.47 (1.73–3.53) | 6.34×10⁻⁷ | 2.4 |
| Comprehensive measured metabolic model | Age, sex, VFA, glucose, insulin, ln(TG), HDL-C, SBP, DBP | 2.00 (1.36–2.94) | 3.91×10⁻⁴ | 25.4 |
| + Clinical metabolic diagnoses | Above + diabetes, dyslipidemia, hypertension | 1.87 (1.27–2.75) | 0.00160 | 32.6 |
| + Metabolic treatment | Above + glucose-lowering, lipid-lowering, antihypertensive medication | 1.86 (1.26–2.75) | 0.00173 | 33.2 |
| Metabolic-dysregulation score | Age, sex + composite metabolic score | 2.36 (1.65–3.36) | 2.15×10⁻⁶ | — |
| Additional Panel B. Clinical metabolic burden | ||||
| Clinical metabolic status | n | DISH, n | OR (95% CI) | P value |
| No diagnosed diabetes, dyslipidemia, or hypertension | 353 | 13 | 3.14 (1.71–5.79) | 2.41×10⁻⁴ |
| ≥1 diagnosed metabolic condition | 172 | 28 | 1.85 (1.16–2.96) | 0.0098 |
| Interaction | — | — | — | 0.126 |
| Additional Panel C. Incremental model information | ||||
| Model | AIC | AUC | Likelihood-ratio P value | |
| Comprehensive metabolic model | 265.2 | 0.818 | Reference | |
| Comprehensive metabolic model + CD16+CD56+ proportion | 253.5 | 0.836 | 2.11×10⁻⁴ | |
Firth penalized logistic regression was used for OR estimation. *Attenuation was calculated relative to the age- and sex-adjusted model on the log-OR scale as 100×(βreference−βadjusted)/βreference. Negative attenuation indicates a slightly larger coefficient after adjustment. The metabolic-dysregulation score was constructed by equally weighting z-standardized fasting glucose, ln(TG), reverse-coded HDL-C, VFA, and SBP and subsequently re-standardizing the composite to a mean of 0 and an SD of 1. Higher scores indicate greater metabolic dysregulation. One participant with an indeterminate clinical metabolic-disease entry was excluded from the clinical-burden stratification. AIC and AUC for incremental modeling were obtained from conventional logistic regression.
Disclaimer/Publisher’s Note: The statements, opinions and data contained in all publications are solely those of the individual author(s) and contributor(s) and not of MDPI and/or the editor(s). MDPI and/or the editor(s) disclaim responsibility for any injury to people or property resulting from any ideas, methods, instructions or products referred to in the content. |
© 2026 by the authors. Licensee MDPI, Basel, Switzerland. This article is an open access article distributed under the terms and conditions of the Creative Commons Attribution (CC BY) license (http://creativecommons.org/licenses/by/4.0/).
Copyright: This open access article is published under a Creative Commons CC BY 4.0 license, which permit the free download, distribution, and reuse, provided that the author and preprint are cited in any reuse.