

Submitted:
08 October 2026
Posted:
10 October 2026
You are already at the latest version
Abstract
Many industrial vision questions are binary ("is this suitcase damaged?") and must be answered on premises, with a confidence that can be trusted and an option to defer to a human. We study how far small open vision-language models (VLMs) get on such questions and what it takes to make them reliable. First, a pre-registered benchmark of 12 open VLMs (0.8B-12B parameters; 1,807 yes/no items in four question families; test split analysed once) on an NVIDIA Jetson AGX Orin finds flat discrimination among the Qwen-based models of 2B parameters and above (pooled test AUROC 0.930-0.940), no gain from models post-trained for decisions over their own base models, and calibration that varies far more across models than ranking does: raw expected calibration error ranges from 0.014 to 0.122, and one shared Platt step brings every model to 0.013-0.037. Qwen3-VL-2B is the fastest model (0.45 s per image, 4.4 GB), and no model was significantly better than it in any tested comparison. Second, we attach per-task heads, L2-regularised logistic regressions on the frozen model's last-layer hidden state, and abstain below a confidence threshold set by the application. On test photos from sources unseen in training, a suitcase-damage head raises AUROC from 0.925 (calibrated model answer) to 0.962, paired 95% CI of the gain [+0.018, +0.058]; at a 0.90 threshold it answers 71.7% of the photos with 96.6% accuracy, against 61.1% for the calibrated answer. A baggage-presence head does not improve AUROC. Third, a case study runs the calibrated model on an 8 GB laptop: on 148 test photos it decides 49% automatically at 97.3% accuracy and leaves the rest to staff, at no API cost. Limitations: internet photos only, four question families, and a source confound in one damage test set.
Keywords:
vision-language models
; selective prediction
; calibration
; abstention
; visual inspection
; edge AI
; pre-registration
1. Introduction
Visual inspection tasks in operations often reduce to yes/no questions about a single photo: is there baggage in the frame, is the suitcase damaged, is a seal intact. Building a dedicated model for each such question means collecting a dataset and training a classifier every time. Commercial VLM APIs can answer the question directly, but each photo leaves the company and each call is billed; for many deployments neither is acceptable. A small open VLM on local hardware removes both problems. What remains open is whether its answers are good enough, and whether its confidence can be trusted enough to let it decide some cases alone and defer the rest to a person.
This paper answers both questions with a deliberately simple system and a strict evaluation discipline. A yes/no question is posed to the model, its probability of “yes” is read from the answer-letter logits, optionally calibrated or replaced by a small task head, and the system decides only when its confidence reaches a target accuracy that the application chooses. We make four contributions:
- 1.
- A pre-registered decision benchmark of 12 open VLMs, including four models post-trained specifically for decisions, on the same device, images, prompts and pixel limits. Protocol, hypotheses and decision rules were fixed before any model output on labelled data, and the test split was analysed once (Section 4 and Section 5).
- 2.
- A calibration-transfer test: does one calibration fitted on other question families give usable selective decisions on a family it has never seen? (Section 5).
- 3.
- 4.
- A deployment case study on suitcase damage with the calibrated model running on a laptop (Section 8).
Our claim is not methodological novelty but evidence: a frozen 2B model with calibration, and where needed a linear head, is a strong, cheap and measurable baseline for on-device binary visual decisions, and the newest decision-tuned models do not beat it.
2. Related Work
- Probing hidden states.
Linear classifiers on intermediate representations are a standard tool for reading what a network encodes (Alain and Bengio, 2017). In language models, hidden states carry information about whether the model’s own answer is correct or truthful (Azaria and Mitchell, 2023; Kadavath et al., 2022). For multimodal models, probes show that hidden states hold visual information that the generated answer does not use (Fu et al., 2025; Tao et al., 2024; Zhang et al., 2024). We use this as an engineering device: the representation at the answer position of a VLM, conditioned on a task question, is the input of a task head. A closely related design is the joint schema head of clef-flash (Cloudflare, 2026), which reads final hidden states of a decision-tuned model.
- Calibration and selective prediction.
Modern networks are often over-confident (Guo et al., 2017); Platt scaling (Platt, 1999) is a simple post-hoc fix. Selective classification trades coverage for risk (Geifman and El-Yaniv, 2017). For visual question answering, abstaining has been argued to be preferable to answering incorrectly (Dancette et al., 2023; Whitehead et al., 2022), while unnecessary abstention has its own cost (Srinivasan et al., 2024). We follow this framing: the application sets a threshold, and the system answers only above it.
- Small open VLMs and decision models.
We build on Qwen3-VL (Bai et al., 2025), a successor of Qwen2.5-VL (Bai et al., 2025), and compare it with Qwen3.5 (Qwen Team, 2026), Gemma 4 (Gemma Team, 2026) and two families post-trained for decisions, Intern-Decision (InternLM Team, 2026) and clef-flash (Cloudflare, 2026), which ship their own readouts and confidence scales.
3. Method
- Readout.
A yes/no question is posed as a two-option multiple-choice prompt (Appendix A). is the softmax over the two option-letter logits at the next-token position. To cancel the model’s preference for the first-listed letter, the question is asked twice, once with “A. yes / B. no” and once with “A. no / B. yes”, and the two probabilities of “yes” are averaged. With two options this swaps letter and list position together, so it cancels their combined bias, not each separately. We call this the raw readout (R0), and R0 followed by Platt scaling on its unclipped logit R1. Decision-tuned models are read with their released readout code instead (Section 4).
- Calibration arms.
Platt scaling is fitted on development data only, in three arms: raw (none); shared, fitted leave-family-out, i.e. for question family f on the development items of the other families; and per-family, fitted on f itself, an upper bound.
- Heads.
For a head we keep the final-layer hidden state of the last prompt token, i.e. the position whose next-token logits give the answer letter, in the pass that lists “A. yes” first (2,048 dimensions for Qwen3-VL-2B). The model is frozen; no gradient reaches it. A head is an L2-regularised logistic regression on standardised features with class-balanced weights , minimising with an unpenalised intercept. C is chosen by the class-weighted log loss of stratified 5-fold cross-validation on the training set over . If the expected calibration error (ECE; 10 equal-width bins on confidence) of the out-of-fold predictions at the chosen C exceeds 0.05, a Platt step is fitted on those out-of-fold logits. For the four heads of Section 7 the out-of-fold ECE was 0.006–0.019, so none was used. A head is stored as its weights, the feature mean and standard deviation, optional Platt parameters, the question, the layer and the exact model revision. Loading it for another revision, prompt format, image size or layer is refused.
- Abstention.
The decision is “yes” if , and its confidence is . The application passes a threshold t (e.g. 0.90), read as a target accuracy; the system abstains when the confidence is below t, and the photo goes to a human. This is a per-photo rule, not a guarantee on the accuracy of the answered set. The threshold is a request parameter, never a model input.
- Use of AI tools.
Claude Opus 5.5 (Anthropic) was used in three ways: to pre-label photos for the heads study under the double-rating and human-check procedure of Section 6; as a comparison model in one secondary test (Section 7); and to assist with analysis code and drafting of this manuscript. All numbers were checked against the generated experiment outputs, and the author takes full responsibility for the content.
- Shared pass and chaining.
With a task-specific prompt each head needs its own forward pass. In the shared variant two heads read the hidden state produced by one common question that names both tasks (“Is there any travel baggage in this photo, and is it damaged?”), so the two tasks cost one pass. Damage is only meaningful if baggage is present; the damage head is skipped only when the baggage head gives a confident no, and still answers when the baggage head abstains. This rule took its form after a stricter gate (run damage only on a confident yes) was seen to fail on the damage test set (Section 7), so chaining results are descriptive.
4. Benchmark: Setup
- Models.
Twelve public models: Qwen3.5 0.8B/2B/4B/9B (Qwen Team, 2026), Qwen3-VL-Instruct 2B/4B/8B (Bai et al., 2025), Gemma 4 12B (Gemma Team, 2026), and four models post-trained for decisions: Intern-Decision 0.8B/2B/4B (InternLM Team, 2026), each built on the Qwen3.5 model of the same size, and clef-flash 9B (Cloudflare, 2026), built on Qwen3.5-9B. Each decision model therefore has a same-base partner. The general models use the swap letter readout. Clef-flash uses its released joint schema head (); Intern-Decision uses its released symbol readout with the checkpoint temperature shipped by its authors. Both are used as documented, unchanged.
- Data.
Four question families, all from public sources, 1,807 items split by image into 898 development and 909 test items: F1 suitcase damage (Luggage Conditions (Roboflow Universe, 2025), internet photos; 120 development / 148 test; “Is this suitcase damaged?”); F2 attribute verification from GQA test-dev balanced (Hudson and Manning, 2019) (189 / 174; 360 distinct questions); F3 object presence from POPE adversarial (Li et al., 2023) (301 / 299; “Is there a {object} in the image?”); F4 luggage colour on Amazon Berkeley Objects product photos (Collins et al., 2022) (288 / 288; “Is this bag mainly {colour}?”).
- Equal treatment.
Every model received the same image file and preprocessing (EXIF transpose, RGB, long side downscaled to 640 pixels), the question verbatim, the same pixel budget (for Gemma 4, the largest image-token budget whose area fits in ), and no thinking mode. All models ran in bf16 with PyTorch on one Jetson AGX Orin 64 GB, batch size 1, one model in memory at a time, with deterministic algorithms. No model received prompt or setting search on labels. Every model passed a determinism gate (maximum change in between two runs: 0.0) and a label-free letter- or symbol-mass gate, and produced 0 error records.
- Protocol and statistics.
The protocol was committed before any model output on labelled items. The test split stayed sealed until a development-split interim had been reviewed and was then analysed once. One amendment was made after the interim and before unsealing, with the user’s approval: calibrators take the unclipped logit of , because the clipping in our original fitting code tied saturated items; the pre-registered variant is reported as a sensitivity analysis and does not change any primary comparison. Metrics: AUROC, ECE (10 equal-width bins on confidence), Brier score, the area under the risk–coverage curve (AURC), coverage and accuracy at , and accuracy at 0.5; latency and peak GPU memory are reported, not ranked. Nine primary comparisons (P1–P9, Table 2) were tested on three metrics each (AUROC, Brier, AURC; 27 tests) with a paired bootstrap by item (10,000 resamples, seed 42, stratified by family and label) and Holm correction. A difference is called “A better” or “B better” when the Holm-corrected test rejects and the CI excludes 0; “equivalent” when the uncorrected 95% CI lies within AUROC, Brier or AURC; otherwise “inconclusive”. Accuracy at 0.5 was compared with an exact McNemar test, Holm-corrected over the nine comparisons. All headline numbers were recomputed from the raw records by independent code before this report.
5. Benchmark: Results
- Discrimination is flat.
Every model of 2B parameters and above lies within 0.930–0.940 pooled test AUROC except Gemma 4 12B (0.920); the two 0.8B models reach 0.904 (Table 1). All nine primary comparisons are equivalent on AUROC (Table 2), and accuracy at 0.5 differs in none of them (smallest Holm-adjusted McNemar p 1.0). Within each family, the step from 0.8B to 2B is the only clear scaling effect; above 2B the CIs overlap. Development and test agree closely: no model moves by more than 0.009 AUROC between splits.

Table 1.
Benchmark, pooled test split (909 items), native readout. AUROC of the raw readout; ECE on confidence before and after the shared (leave-family-out) Platt calibration; coverage at threshold 0.90 after shared calibration; median latency per image and peak GPU memory on the Jetson.
Table 1.
Benchmark, pooled test split (909 items), native readout. AUROC of the raw readout; ECE on confidence before and after the shared (leave-family-out) Platt calibration; coverage at threshold 0.90 after shared calibration; median latency per image and peak GPU memory on the Jetson.
| Model | AUROC | ECE raw | ECE shared | Cov@0.90 shared | s / image | GPU GB |
|---|---|---|---|---|---|---|
| Qwen3.5-0.8B | 0.904 | 0.022 | 0.035 | 42% | 1.13 | 1.8 |
| Qwen3.5-2B | 0.930 | 0.050 | 0.032 | 57% | 1.25 | 4.5 |
| Qwen3.5-4B | 0.937 | 0.057 | 0.015 | 59% | 1.70 | 9.4 |
| Qwen3.5-9B | 0.940 | 0.050 | 0.013 | 56% | 1.89 | 19.2 |
| Intern-Decision-0.8B | 0.904 | 0.062 | 0.037 | 47% | 1.02 | 1.9 |
| Intern-Decision-2B | 0.931 | 0.025 | 0.028 | 62% | 1.24 | 4.7 |
| Intern-Decision-4B | 0.936 | 0.014 | 0.019 | 61% | 1.53 | 9.5 |
| clef-flash 9B | 0.934 | 0.081 | 0.015 | 56% | 1.72 | 19.2 |
| Qwen3-VL-2B | 0.935 | 0.099 | 0.018 | 58% | 0.45 | 4.4 |
| Qwen3-VL-4B | 0.938 | 0.112 | 0.017 | 60% | 0.62 | 9.2 |
| Qwen3-VL-8B | 0.934 | 0.106 | 0.015 | 64% | 0.95 | 17.9 |
| Gemma 4 12B | 0.920 | 0.122 | 0.022 | 49% | 0.80 | 24.1 |
Table 2.
Primary comparisons, native readout, raw calibration, pooled test split, Holm over 27 tests. P1–P4: decision post-training against the same base; P5–P6: model generation; P7: size; P8–P9: against Qwen3-VL-2B. Lower Brier and AURC are better, so a positive difference favours B. Holm-adjusted p for the “B better” cells: 0.016, 0.024 (P1), 0.016 (P3), 0.028, 0.048 (P4), 0.005 (P9).
Table 2.
Primary comparisons, native readout, raw calibration, pooled test split, Holm over 27 tests. P1–P4: decision post-training against the same base; P5–P6: model generation; P7: size; P8–P9: against Qwen3-VL-2B. Lower Brier and AURC are better, so a positive difference favours B. Holm-adjusted p for the “B better” cells: 0.016, 0.024 (P1), 0.016 (P3), 0.028, 0.048 (P4), 0.005 (P9).
| A vs B | AUROC A−B | Brier A−B | AURC A−B | |
|---|---|---|---|---|
| P1 | ID-0.8B vs Q35-0.8B | 0.000 equiv. | +0.011 B better | +0.020 B better |
| P2 | ID-2B vs Q35-2B | +0.001 equiv. | −0.006 inconcl. | +0.007 inconcl. |
| P3 | ID-4B vs Q35-4B | −0.001 equiv. | +0.001 equiv. | +0.009 B better |
| P4 | Clef-9B vs Q35-9B | −0.006 equiv. | +0.016 B better | +0.028 B better |
| P5 | Q35-2B vs Q3VL-2B | −0.005 equiv. | −0.009 inconcl. | −0.003 inconcl. |
| P6 | Q35-4B vs Q3VL-4B | −0.001 equiv. | −0.014 inconcl. | +0.005 inconcl. |
| P7 | Q35-9B vs Q35-2B | +0.010 equiv. | −0.007 inconcl. | +0.003 inconcl. |
| P8 | ID-2B vs Q3VL-2B | −0.004 equiv. | −0.014 inconcl. | +0.004 inconcl. |
| P9 | Clef-9B vs Q3VL-2B | −0.001 equiv. | +0.000 inconcl. | +0.028 B better |
- Decision post-training does not help over its own base.
No decision model is better than its same-base Qwen3.5 on any metric. Where there is a verdict it goes the other way: Intern-Decision-0.8B has a worse Brier score and AURC than Qwen3.5-0.8B, Intern-Decision-4B a worse AURC than Qwen3.5-4B, and clef-flash a worse Brier score and AURC than Qwen3.5-9B. With an equal readout for both models of a pair (both swapped, or both single-pass; 24 tests, one Holm family) no decision model differs from its partner, and after one shared calibration every primary difference becomes equivalent (15 of 27) or inconclusive (12 of 27). The decision models’ disadvantage is therefore in their shipped confidence scale, not in their ranking. For clef-flash, reading its own backbone with our letter readout instead of its decision head gives an equivalent AUROC and Brier score.
- Calibration matters more than the model.
Raw ECE ranges from 0.014 (Intern-Decision-4B) to 0.122 (Gemma 4 12B); the saturated models, whose sits near 0 or 1 for most items, are worst (Qwen3-VL 0.099–0.112, Gemma 4 0.122). One shared Platt calibration, fitted without the target family, brings every model to 0.013–0.037.
- Calibration transfer to an unseen family is partial.
We pre-registered a usability bar per family: at , coverage of at least 50% with accuracy of at least 88% on the covered items; an arm passes if it meets the bar in at least three of four families. With one shared calibration only Intern-Decision-2B and Qwen3-VL-8B pass (three of four). Object presence (F3) and luggage colour (F4) pass for nearly every model; GQA attribute questions (F2) fail for every model with shared calibration (coverage 12–45%); suitcase damage (F1) passes only for Intern-Decision-2B, clef-flash and Qwen3-VL-8B, each at 50–59% coverage, at the edge of the bar (Table 3). Where the shared arm fails, it fails on coverage, not on accuracy: accuracy on covered items is at least 90.6% in every family except F2 for the two 0.8B models. In other words, one shared calibration keeps decisions safe on an unseen question family, but for some families the model is too rarely confident to be useful.
- A few labels from the target family: the one large effect.
For each model and family we trained a logistic head on the hidden state (Section 3) using n labelled development items of that family (20 stratified draws) and scored it on the whole test split of the family. On F1 (suitcase damage), at , the head reaches 0.92–0.98 AUROC against 0.79–0.92 for a Platt calibration of the model’s own answer fitted on the same items, for every model (gain to ; every draw positive), and coverage at 0.90 rises from 18–60% (shared arm) to 65–82%. For Qwen3-VL-2B the head reaches 0.962 against 0.897. On F2–F4 the head adds nothing (within / AUROC of Platt), and adds nothing over . F1 development and test share no source image, and a perceptual hash finds one near-duplicate pair among , so the gain is not explained by duplicates. Section 6 and Section 7 test whether it survives unseen photo sources and more training data.
- Robustness to paraphrase.
Each item was also asked with one paraphrased question written before any model output. Decisions at 0.5 flip on 0.7–21.6% of items per model and family (highest: the 0.8B models on F1 and F2), and AUROC changes by to ; the CI excludes 0 in 4 of 48 model–family cells, all with the paraphrase lower.
- Cost.
Qwen3-VL-2B is the fastest model on the Jetson (0.45 s per image median for the two-pass readout, 4.4 GB); the 9B models take about 1.9 s and 19 GB (Table 1). Qwen3.5 is slower than Qwen3-VL at the same size on this software stack (1.25 vs. 0.45 s at 2B).
- Choice of the base model.
A pre-registered rule kept the incumbent Qwen3-VL-2B unless a challenger of at most 4B had a significantly lower pooled AURC after shared calibration. None did (closest: Qwen3-VL-4B, , CI ). It is also the fastest model and Apache-2.0 licensed, so the heads below use it.
6. Plug-In Heads: Data and Test Design
- Definitions.
Labels follow written definitions fixed before collection. Baggage present: at least one recognisable piece of travel baggage is visible, even if small. This covers suitcases, trunks, cabin and duffel bags and large travel backpacks, but not instrument or equipment cases, handbags or small everyday backpacks. Damaged: structural damage, i.e. a crack, dent or hole in the shell, a fabric tear, or a broken or missing wheel, handle, strap or zipper. Cosmetic wear such as scratches, dirt or stickers counts as intact. Damage photos show a single suitcase.
Table 4.
Data for the heads. Open Images splits are disjoint by image (Kuznetsova et al., 2020). Damage training sets: Roboflow Universe (2025) and Mendeley Data (2025). The damage test sources do not occur in training. Every test pool is de-duplicated against its training pool with a 256-bit perceptual hash (Hamming distance ).
Table 4.
Data for the heads. Open Images splits are disjoint by image (Kuznetsova et al., 2020). Damage training sets: Roboflow Universe (2025) and Mendeley Data (2025). The damage test sources do not occur in training. Every test pool is de-duplicated against its training pool with a 256-bit perceptual hash (Hamming distance ).
| Head | Training set | Decisive test set (used once) |
|---|---|---|
| Baggage present | 2,679 (856 yes), Open Images V7 train | 357 (107 yes), Open Images validation + test |
| Damaged | 776 (343 yes): Luggage Conditions, | 244 (148 yes): web-collected damaged + |
| Mendeley bag damage, 48 DataCluster | Wikimedia Commons intact photos |
- Labelling.
Open Images’ crowd-sourced positives contained many objects outside our definition, such as guitar cases and jewellery boxes. Every presence test photo was therefore rated twice, blind, by Claude Opus 5.5, with neutral file names and the definition in the prompt. A label was accepted without human review only when both ratings agreed with each other and with Open Images (264 of 357 photos). The other 93 (86 where both ratings disagreed with Open Images, 7 where the two ratings disagreed) were judged by a human; on the 86, the human sided with the Claude rating in 68. Presence training photos received one Claude rating and no human check. Damage training labels come from the source datasets’ annotations. All 96 intact damage-test photos, collected from Wikimedia Commons under open licences and kept only where two Claude ratings agreed, were checked by a human.
- Source confound.
A first damage test set drew all damaged photos from one web collection and all intact photos from a source that also supplied training images, so a model could separate sources instead of damage. We noticed this before scoring. The intact side was rebuilt from Wikimedia Commons, and the decisive set was defined as the web-collected damaged photos plus the Wikimedia intact photos. The source still coincides with the label in this set; Section 9 discusses what this does and does not affect.
- Arms and pass criteria.
We compare R0, R1 (Platt fitted on the head’s training set), H-task (head on the task-question pass; the pre-specified arm) and H-shared (head on the shared pass). Fixed before scoring, on the decisive test set: (1) gain over calibration: H-task AUROC above R1 with the paired 95% CI excluding 0 (for presence, which may sit near ceiling, alternatively AUROC with CI lower bound ); (2) usable coverage: coverage at threshold 0.90 of at least 60% with accuracy on covered photos of at least 88%. The shared pass passes if, for both heads, the CI of the H-shared minus H-task AUROC lies above and coverage at 0.90 is within 10 points. Metrics are AUROC, Brier score, AURC, ECE, and coverage and accuracy at thresholds 0.90 and 0.95, with 95% bootstrap CIs (10,000 resamples, stratified by label). The heads protocol was amended 13 times before test scoring was complete; Appendix B lists the amendments that changed the test sets, the definitions or the grid. AUROC, ECE, and coverage and accuracy at 0.90 for all arms, and the H-task minus R1 CI, were recomputed by an independent re-implementation that trains its own heads and calibrator. AUROC and the head arms match at the reported precision; R1 differs by at most 1.2 coverage points and 0.006 ECE because of a different Platt fit.
7. Plug-In Heads: Results
- Damage.
The head beats the calibrated readout: H-task minus R1 AUROC , 95% CI (criterion 1 passed). At threshold 0.90 it covers 71.7% of the photos with 96.6% accuracy (criterion 2 passed); R1 covers 61.1%. Figure 1 shows H-shared at or above R1 at every coverage level. Forced to answer every photo at threshold 0.5, H-task is 86.5% accurate (140 of 148 damaged, 71 of 96 intact) and H-shared 90.2% (136 and 84), against 84.0% for R1 and 80.3% for R0; these differences were not tested. On intact photos H-task is no better than R1 at this threshold (74.0% vs. 75.0%). Reweighted to a 5% damage prevalence, coverage and accuracy at 0.90 are 50.8% / 92.1% for H-task, 53.6% / 96.2% for H-shared and 45.2% / 95.3% for R1.
Figure 1.
Accuracy of the most confident answers as coverage grows (decisive test sets). The right end of each curve is the forced-decision accuracy. Curves come from the independent re-implementation; its R1 Platt fit differs slightly from Table 5.
Figure 1.
Accuracy of the most confident answers as coverage grows (decisive test sets). The right end of each curve is the forced-decision accuracy. Curves come from the independent re-implementation; its R1 Platt fit differs slightly from Table 5.
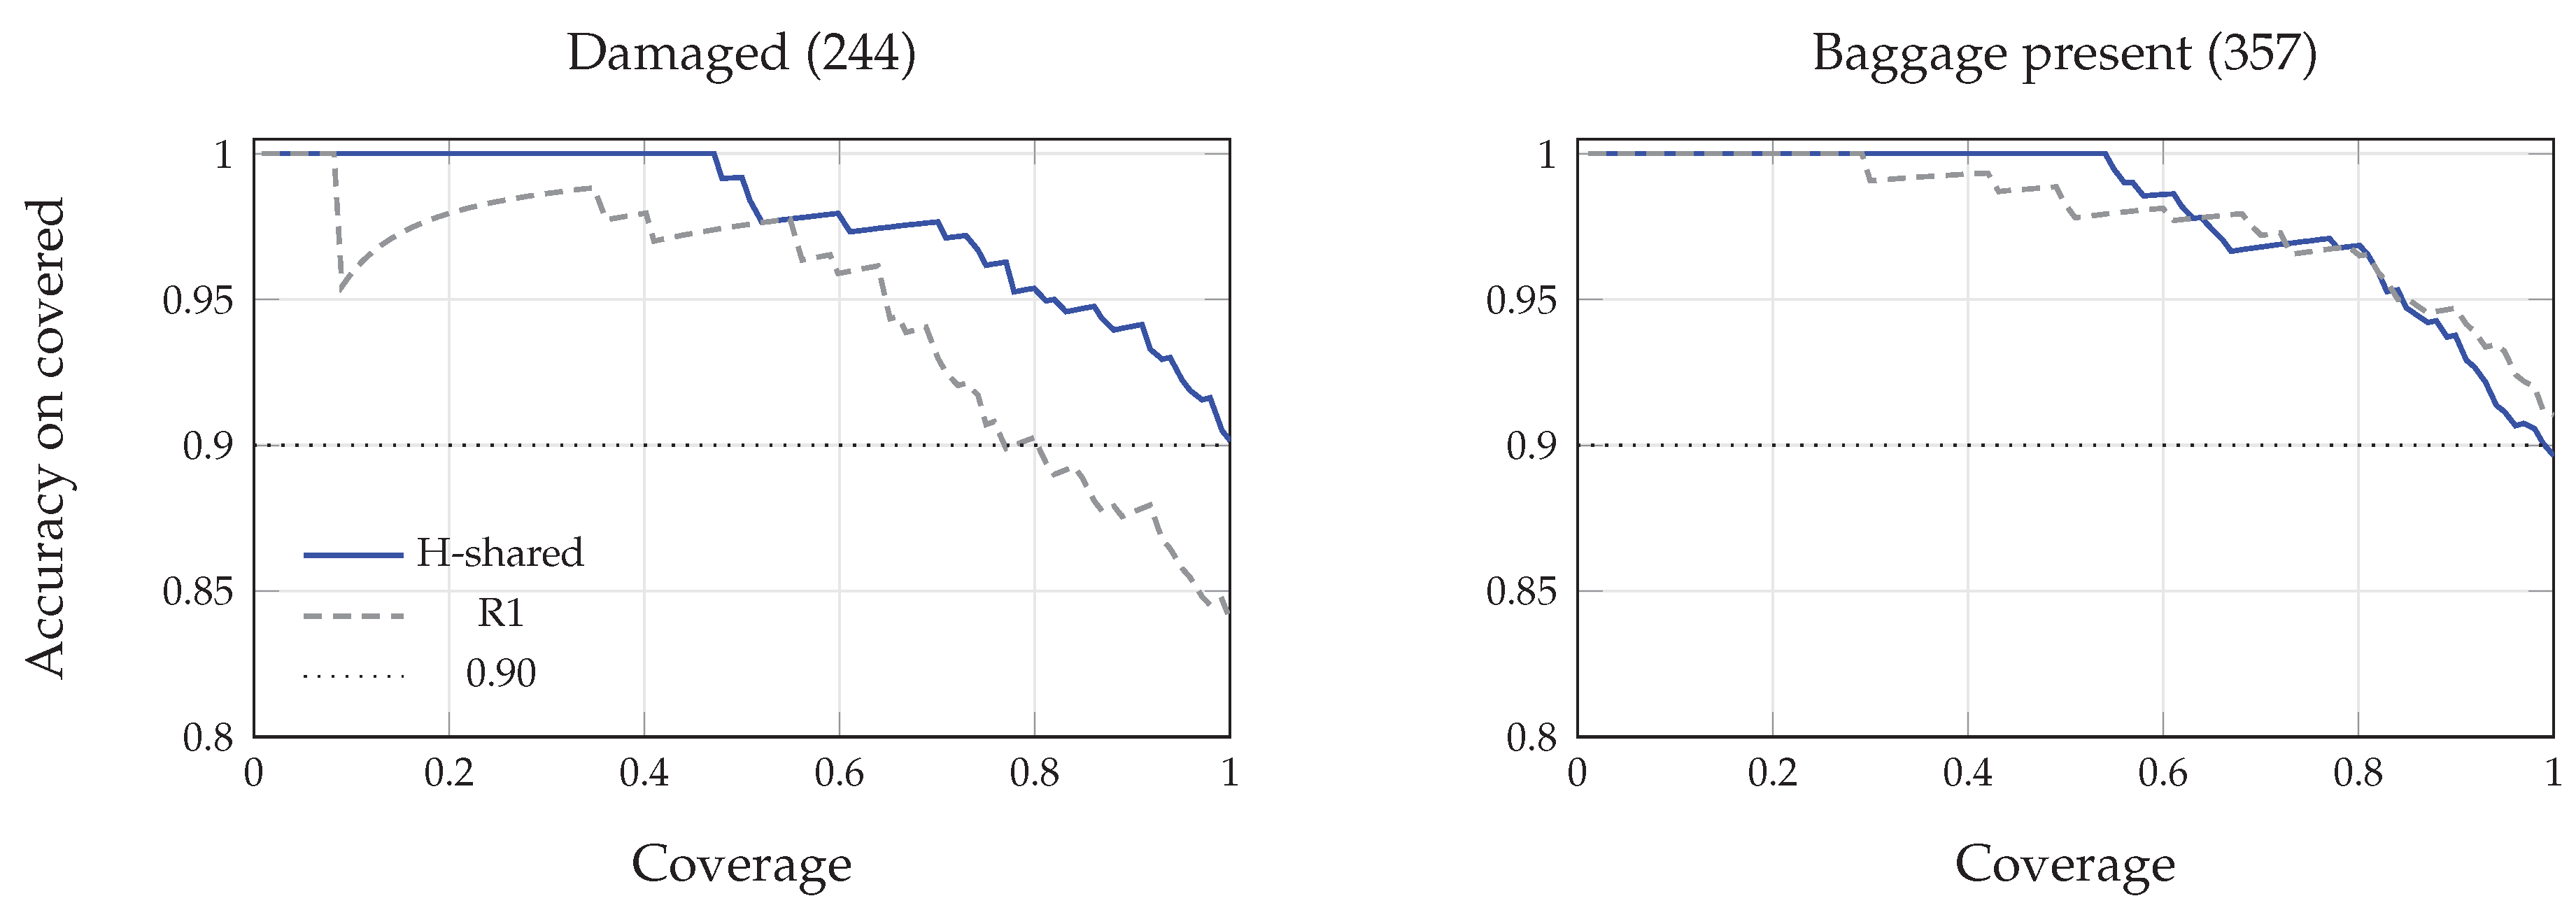
Table 5.
Heads on Qwen3-VL-2B, decisive test sets, scored once. Coverage and accuracy in percent. R0 is over-confident: it covers many photos but misses the target accuracy. R1 meets the target with lower coverage.
Table 5.
Heads on Qwen3-VL-2B, decisive test sets, scored once. Coverage and accuracy in percent. R0 is over-confident: it covers many photos but misses the target accuracy. R1 meets the target with lower coverage.
| Head | Arm | AUROC [95% CI] | Brier | AURC | ECE | Cov / Acc @0.90 | Cov / Acc @0.95 |
|---|---|---|---|---|---|---|---|
| Damaged | R0 | 0.925 [0.892, 0.955] | 0.155 | 0.065 | 0.126 | 79.5 / 86.6 | 72.1 / 89.2 |
| (244) | R1 | 0.925 [0.892, 0.955] | 0.112 | 0.052 | 0.052 | 61.1 / 96.0 | 53.3 / 97.7 |
| H-task | 0.962 [0.939, 0.981] | 0.088 | 0.028 | 0.051 | 71.7 / 96.6 | 62.7 / 97.4 | |
| H-shared | 0.963 [0.940, 0.983] | 0.073 | 0.022 | 0.021 | 70.1 / 97.7 | 60.7 / 97.3 | |
| Baggage | R0 | 0.960 [0.939, 0.979] | 0.208 | 0.089 | 0.197 | 88.0 / 79.3 | 81.8 / 80.8 |
| (357) | R1 | 0.960 [0.939, 0.979] | 0.069 | 0.022 | 0.018 | 65.0 / 97.8 | 54.3 / 97.9 |
| H-task | 0.963 [0.942, 0.981] | 0.071 | 0.023 | 0.029 | 75.4 / 96.3 | 65.0 / 97.0 | |
| H-shared | 0.969 [0.952, 0.984] | 0.074 | 0.020 | 0.025 | 74.5 / 97.0 | 63.6 / 97.8 |
- Baggage presence.
The readout is already strong (0.960) and the head’s AUROC gain is not significant (, CI ; criterion 1 failed). At threshold 0.90 the head covers 75.4% of the photos instead of 65.0% (criterion 2 passed; R1 also meets it), but AURC is the same (0.023 vs. 0.022). Between 65% and 100% coverage the two curves cross several times and stay within about one point (Figure 1); forced to answer every photo, R1 is 91.0% accurate against 90.5% for H-task and 89.6% for H-shared. We read this as: for presence the head adds no ranking ability. Its higher coverage at comes from a less conservative confidence scale (R1 answers at 97.8% accuracy, far above the target). The coverage difference was not a pre-specified test.
- Shared pass.
H-shared minus H-task AUROC is for damage and for presence, and the coverage gaps are under 2 points. The shared pass therefore passes the pre-set non-inferiority test (margin 0.02 AUROC). The coverage-difference CI for damage ( to points) does not exclude a loss of a few points.
- Learning curve.
Trained on random training subsets (20 draws per size), the damage head reaches the full-data AUROC with 300 photos (0.965 vs. 0.962); at 100 photos the mean is 0.949 and the draws range from 0.903 to 0.983. For presence the head adds nothing over the readout at any size.
- Secondary tests.
On an in-source damage test (the benchmark’s F1 test, 148 photos from a held-out split of one training source) the damage head reaches 0.987 AUROC against 0.897 for R1. On a held-out split of a second source (32 photos, only 3 intact) every arm reaches AUROC 1.000, which is uninformative. On the same 148 photos, Claude Opus 5.5, prompted with the damage definition, reached 89.9% accuracy and 0.944 AUROC. This is not a like-for-like comparison: the head saw training photos from the same source and Claude did not; Claude’s prompt carried the definition; the photos are public and may be in Claude’s training data; its probabilities are verbalised (29 distinct values); and this test set is the one whose benchmark result motivated the head study.
- Chaining.
On the decisive damage set at threshold 0.90, running damage unless baggage is a confident no gives 68.9% coverage at 97.6% accuracy, close to the damage head alone (70.1% / 97.7%). Gating on a confident yes instead drops coverage to 18.0% and answers only 5.4% of the damaged photos, because the presence head abstains on close-up damage photos, which are unlike its scene-level training data. On the 250 no-baggage presence test photos, the damage head still runs on 29.6% and gives a confident “damaged” on one (0.4%).
- Cost.
The heads need only one forward pass: with the shared prompt, one pass serves both heads in 0.22–0.24 s per image on the Jetson (median over the two decisive test sets; p95 0.24–0.27 s), against 0.45 s for the two-pass swapped readout, and a head adds one matrix-vector product (under 1 ms). Times cover preprocessing and the forward pass at batch size 1 in the 50 W power mode, not network or service overhead. At inference, no image leaves the device.
8. Case Study: Suitcase Damage on a Laptop
Before the benchmark, the same question (“Is this suitcase damaged?”) was answered by Qwen3-VL-2B quantised to 4 bits with MLX on an 8 GB Apple M2 laptop, as a proof of concept for a staff-facing tool. It used the swap readout at 640 pixels, a Platt calibrator and a decision threshold, all selected on the 120 F1 development photos. It was then evaluated once on the 148 F1 test photos (74 damaged, 74 intact), the same photos as the benchmark’s F1 test split. Its comparison was gpt-5-nano, a commercial API model, prompted for a three-way verdict (damaged / wear / intact) in which anything other than “damaged” counted as not damaged.
Calibration lowered ECE from 0.186 to 0.074 and Brier from 0.166 to 0.121 and raised accuracy from 77.0% to 82.4% (Table 6). With a confidence gate of 0.8 the tool decided 49% of the photos at 97.3% accuracy and left the rest to staff; at 0.9 it decided 34% with no error. Its accuracy did not differ significantly from either gpt-5-nano setting (exact McNemar and ), at zero API cost and with no photo leaving the laptop. This is a small test set with noisy internet labels, and its numbers are not comparable to Table 1: a different backend (4-bit MLX instead of bf16), and a threshold selected on development data. Its role here is to show the operating rule in use: the same model that is unremarkable in forced-choice accuracy becomes useful once it may abstain. The benchmark’s few-label head on the same photos (Section 5) and the damage head (Section 7) show where the next gain comes from.
9. Limitations
- Internet photos only. No test photo comes from an airport. Passing unseen-source tests shows transfer across internet sources, not performance at a check-in counter.
- Four question families. The benchmark covers damage, attributes, presence and colour. F2–F4 come from public benchmarks that may be in the models’ training data, and F1 labels are noisy.
- One device and stack. All benchmark runs used one Jetson with bf16 and one software stack; 27B-class models were out of scope.
- Source confound in the damage test. In the decisive damage set, all damaged photos are web-collected and all intact ones come from Wikimedia, so absolute numbers may partly reflect photographic style. The head-versus-readout comparison is paired on the same photos and is less exposed, but not immune, since the head could learn style cues that the readout ignores. A probe trained to tell the two sources apart within the test set separates them almost perfectly (AUROC 0.999); this shows the sources are distinguishable but cannot separate style from damage.
- Source and label in training. Training sources are unbalanced by label (Mendeley 252 of 279 damaged, Luggage Conditions 359 of 449 intact, DataCluster 47 of 48 intact), so the head may use source style as a damage cue. Its AUROC depends on which intact source it faces (0.992 against DataCluster intact photos, 0.962 against Wikimedia).
- Labels. Presence test labels were pre-labelled by a commercial VLM and checked by a human where ratings disagreed with each other or with Open Images. The 148 damaged test photos of the decisive set were collected and labelled by the author. The Wikimedia intact photos were kept only where two Claude ratings agreed, which may remove ambiguous cases. Residual label noise of a few percent is likely.
- Size. Per-family benchmark tests have 148–299 items and the decisive head test sets 244 and 357 photos; CIs are reported throughout.
- Two tasks, one model for the heads. The heads were trained only on Qwen3-VL-2B, and the shared prompt names both tasks. Whether one shared question serves more, unrelated tasks is untested.
- Data licences. Training images come from public dataset pages whose stated licences we could not verify per image; 48 are DataCluster images under CC BY-NC-ND. None is redistributed. The web-collected damaged test photos have no verified licence and are not redistributed. The Wikimedia Commons test photos are under CC0, CC BY or CC BY-SA, and their file list with licences can be released on request.
10. Conclusion
For binary visual decisions on an edge device, the choice among current small open VLMs matters less than how their confidence is used. Twelve models from 0.8B to 12B rank images almost equally well; models post-trained for decisions do not beat their own base models; and one shared calibration makes every model’s confidence trustworthy enough to abstain safely, though not always often enough to be useful on an unseen question family. Where the model’s own answer is weak, a linear head on its hidden state, trained on a few hundred labelled photos, adds measurable value on unseen sources; where the answer is already strong, it does not. Because two heads can read one forward pass, a second task costs no extra model compute. The next step is validation on operational airport photos.
Data Availability Statement
All images come from public datasets (Luggage Conditions, GQA, POPE/COCO, Amazon Berkeley Objects, Open Images, Mendeley bag damage), the DataCluster sample set (CC BY-NC-ND) and Wikimedia Commons, except the 148 web-collected damaged photos of the decisive damage test set. Images whose licence does not allow redistribution (DataCluster) or could not be verified (the web-collected photos) are not redistributed. Item lists, protocols, analysis code and the Wikimedia Commons file list with licences are available from the author on request.
Funding
This research received no external funding. It was carried out at Pinsoft.
Conflicts of Interest
The author is employed by Pinsoft, where this work was carried out. The author declares no other conflicts of interest.
Appendix A. Prompts
The user turn of the chat template holds the image, then the question, the options one per line and the instruction:
Is this suitcase damaged?
A. yes
B. no
Answer with the letter only.
The second pass lists “A. no” and “B. yes”. Head questions: presence, “Is there any travel baggage in this photo?”; damage, “Is this suitcase damaged?”; shared, “Is there any travel baggage in this photo, and is it damaged?”. Images are resized to at most 640 pixels on the long side.
Appendix B. Heads Protocol Amendments
| Amendment | Change (all before the test set concerned was scored, except where noted) |
| A1–A3 | Presence labels re-checked after crowd-label errors were found; the definition widened from suitcases to travel baggage; all presence photos re-rated under the final definition. |
| A4 | C grid extended to after training-set cross-validation chose the edge of the original grid . |
| A6–A7 | Damage training restricted to the sources’ own train/valid splits; stretched exports allowed in training. |
| A9, A11 | Damage test source confound found; intact side rebuilt from Wikimedia Commons; decisive set defined as web-collected damaged plus Wikimedia intact. |
| A10 | Presence test labels finalised (Section 6). |
| A12 | Chaining rule changed after the damage test set was scored (descriptive only). |
| A13 | Human check of the 96 Wikimedia labels after scoring; no label changed, nothing re-run. |
Appendix C. Settings
Head model revision Qwen/Qwen3-VL-2B-Instruct 89644892e4. Selected C: damage task arm 0.1, the other three heads 0.01. Bootstrap seed 42. Learning-curve sizes 100, 300, 1,000 (where available) and all, 20 draws each.
References
- Alain, Guillaume, and Yoshua Bengio. 2017. Understanding intermediate layers using linear classifier probes. In International Conference on Learning Representations (ICLR), Workshop Track. [Google Scholar]
- Azaria, Amos, and Tom Mitchell. 2023. The internal state of an LLM knows when it’s lying. In Findings of the Association for Computational Linguistics: EMNLP 2023. pp. 967–976. [Google Scholar] [CrossRef]
- Bai, Shuai, Yuxuan Cai, Ruizhe Chen, Keqin Chen, Xionghui Chen, Zesen Cheng, Lianghao Deng, Wei Ding, Chang Gao, Chunjiang Ge, Wenbin Ge, Zhifang Guo, Qidong Huang, Jie Huang, Fei Huang, Binyuan Hui, Shutong Jiang, Zhaohai Li, Mingsheng Li, Mei Li, Kaixin Li, Zicheng Lin, Junyang Lin, Xuejing Liu, Jiawei Liu, Chenglong Liu, Yang Liu, Dayiheng Liu, Shixuan Liu, Dunjie Lu, Ruilin Luo, Chenxu Lv, Rui Men, Lingchen Meng, Xuancheng Ren, Xingzhang Ren, Sibo Song, Yuchong Sun, Jun Tang, Jianhong Tu, Jianqiang Wan, Peng Wang, Pengfei Wang, Qiuyue Wang, Yuxuan Wang, Tianbao Xie, Yiheng Xu, Haiyang Xu, Jin Xu, Zhibo Yang, Mingkun Yang, Jianxin Yang, An Yang, Bowen Yu, Fei Zhang, Hang Zhang, Xi Zhang, Bo Zheng, Humen Zhong, Jingren Zhou, Fan Zhou, Jing Zhou, Yuanzhi Zhu, and Ke Zhu. 2025. Qwen3-VL technical report.
- Bai, Shuai, Keqin Chen, Xuejing Liu, Jialin Wang, Wenbin Ge, Sibo Song, Kai Dang, Peng Wang, Shijie Wang, Jun Tang, Humen Zhong, Yuanzhi Zhu, Mingkun Yang, Zhaohai Li, Jianqiang Wan, Pengfei Wang, Wei Ding, Zheren Fu, Yiheng Xu, Jiabo Ye, Xi Zhang, Tianbao Xie, Zesen Cheng, Hang Zhang, Zhibo Yang, Haiyang Xu, and Junyang Lin. 2025. Qwen2.5-VL technical report.
- Cloudflare. 2026. Clef-Flash. Hugging Face model card.
- Collins, Jasmine, Shubham Goel, Kenan Deng, Achleshwar Luthra, Leon Xu, Erhan Gundogdu, Xi Zhang, Tomas F. Yago Vicente, Thomas Dideriksen, Himanshu Arora, Matthieu Guillaumin, and Jitendra Malik. 2022. ABO: Dataset and benchmarks for real-world 3D object understanding. In Proceedings of the IEEE/CVF Conference on Computer Vision and Pattern Recognition (CVPR). [Google Scholar]
- Dancette, Corentin, Spencer Whitehead, Rishabh Maheshwary, Ramakrishna Vedantam, Stefan Scherer, Xinlei Chen, Matthieu Cord, and Marcus Rohrbach. 2023. Improving selective visual question answering by learning from your peers. In Proceedings of the IEEE/CVF Conference on Computer Vision and Pattern Recognition (CVPR). pp. 24049–24059. [Google Scholar] [CrossRef]
- Fu, Stephanie, Tyler Bonnen, Devin Guillory, and Trevor Darrell. 2025. Hidden in plain sight: VLMs overlook their visual representations.
- Geifman, Yonatan, and Ran El-Yaniv. 2017. Selective classification for deep neural networks. In Advances in Neural Information Processing Systems 30 (NIPS 2017). pp. 4878–4887. [Google Scholar]
- Gemma Team. 2026. Gemma 4 technical report.
- Guo, Chuan, Geoff Pleiss, Yu Sun, and Kilian Q. Weinberger. 2017. On calibration of modern neural networks. In Proceedings of the 34th International Conference on Machine Learning, Volume 70 of Proceedings of Machine Learning Research. pp. 1321–1330, PMLR. [Google Scholar]
- Hudson, Drew A., and Christopher D. Manning. 2019. GQA: A new dataset for real-world visual reasoning and compositional question answering. In Proceedings of the IEEE/CVF Conference on Computer Vision and Pattern Recognition (CVPR). [Google Scholar]
- InternLM Team. 2026. Intern-Decision: multimodal decisions with calibrated probabilities. Hugging Face model cards and GitHub repository.
- Kadavath, Saurav, Tom Conerly, Amanda Askell, Tom Henighan, Dawn Drain, Ethan Perez, Nicholas Schiefer, Zac Hatfield-Dodds, Nova DasSarma, Eli Tran-Johnson, Scott Johnston, Sheer El-Showk, Andy Jones, Nelson Elhage, Tristan Hume, Anna Chen, Yuntao Bai, Sam Bowman, Stanislav Fort, Deep Ganguli, Danny Hernandez, Josh Jacobson, Jackson Kernion, Shauna Kravec, Liane Lovitt, Kamal Ndousse, Catherine Olsson, Sam Ringer, Dario Amodei, Tom Brown, Jack Clark, Nicholas Joseph, Ben Mann, Sam McCandlish, Chris Olah, and Jared Kaplan. 2022. Language models (mostly) know what they know.
- Kuznetsova, Alina, Hassan Rom, Neil Alldrin, Jasper Uijlings, Ivan Krasin, Jordi Pont-Tuset, Shahab Kamali, Stefan Popov, Matteo Malloci, Alexander Kolesnikov, Tom Duerig, and Vittorio Ferrari. 2020. The open images dataset V4: Unified image classification, object detection, and visual relationship detection at scale. International Journal of Computer Vision 128: 1956–1981. [Google Scholar] [CrossRef]
- Li, Yifan, Yifan Du, Kun Zhou, Jinpeng Wang, Wayne Xin Zhao, and Ji-Rong Wen. 2023. Evaluating object hallucination in large vision-language models. In Proceedings of the 2023 Conference on Empirical Methods in Natural Language Processing (EMNLP). [Google Scholar]
- Mendeley Data. 2025. Bag damage detection dataset. Mendeley Data, dataset 9k3bf6ksnd, version 1.
- Platt, John C. 1999. Probabilistic outputs for support vector machines and comparisons to regularized likelihood methods. In Advances in Large Margin Classifiers. MIT Press: pp. 61–74. [Google Scholar]
- Qwen Team. 2026. Qwen3.5: Towards native multimodal agents. February.
- Roboflow Universe. 2025. Luggage Conditions dataset. Roboflow Universe.
- Srinivasan, Tejas, Jack Hessel, Tanmay Gupta, Bill Yuchen Lin, Yejin Choi, Jesse Thomason, and Khyathi Raghavi Chandu. 2024. Selective “selective prediction”: Reducing unnecessary abstention in vision-language reasoning. In Findings of the Association for Computational Linguistics: ACL 2024. pp. 12935–12948. [Google Scholar] [CrossRef]
- Tao, Mingxu, Quzhe Huang, Kun Xu, Liwei Chen, Yansong Feng, and Dongyan Zhao. 2024. Probing multimodal large language models for global and local semantic representations. In Proceedings of the 2024 Joint International Conference on Computational Linguistics, Language Resources and Evaluation (LREC-COLING 2024). pp. 13050–13056. [Google Scholar]
- Whitehead, Spencer, Suzanne Petryk, Vedaad Shakib, Joseph Gonzalez, Trevor Darrell, Anna Rohrbach, and Marcus Rohrbach. 2022. Reliable visual question answering: Abstain rather than answer incorrectly. In Computer Vision – ECCV 2022. Lecture Notes in Computer Science. Springer: pp. 148–166. [Google Scholar] [CrossRef]
- Zhang, Yuhui, Alyssa Unell, Xiaohan Wang, Dhruba Ghosh, Yuchang Su, Ludwig Schmidt, and Serena Yeung-Levy. 2024. Why are visually-grounded language models bad at image classification? In Advances in Neural Information Processing Systems (NeurIPS). [Google Scholar]
Table 3.
Calibration transfer: shared (leave-family-out) calibration on the test split, coverage / accuracy in percent at threshold 0.90. * = meets the bar (coverage ≥ 50%, accuracy ≥ 88%).
Table 3.
Calibration transfer: shared (leave-family-out) calibration on the test split, coverage / accuracy in percent at threshold 0.90. * = meets the bar (coverage ≥ 50%, accuracy ≥ 88%).
| Model | F1 damage | F2 attribute | F3 presence | F4 colour |
|---|---|---|---|---|
| Qwen3.5-0.8B | 18 / 96.2 | 17 / 83.3 | 69 / 93.7 * | 42 / 95.0 |
| Qwen3.5-2B | 42 / 91.9 | 18 / 93.8 | 67 / 96.5 * | 77 / 96.8 * |
| Qwen3.5-4B | 31 / 100.0 | 32 / 94.6 | 64 / 93.8 * | 83 / 96.2 * |
| Qwen3.5-9B | 41 / 96.7 | 18 / 93.8 | 53 / 98.7 * | 90 / 94.2 * |
| Intern-Decision-0.8B | 29 / 95.3 | 12 / 76.2 | 39 / 95.8 | 84 / 95.9 * |
| Intern-Decision-2B | 52 / 92.2 * | 22 / 94.9 | 70 / 94.3 * | 83 / 95.8 * |
| Intern-Decision-4B | 41 / 95.1 | 33 / 91.4 | 64 / 95.8 * | 85 / 95.5 * |
| clef-flash 9B | 59 / 93.2 * | 45 / 93.6 | 74 / 94.6 * | 42 / 100.0 |
| Qwen3-VL-2B | 34 / 100.0 | 17 / 96.7 | 80 / 92.9 * | 73 / 97.1 * |
| Qwen3-VL-4B | 47 / 95.7 | 20 / 94.3 | 62 / 97.3 * | 89 / 94.2 * |
| Qwen3-VL-8B | 50 / 93.2 * | 37 / 90.6 | 61 / 96.7 * | 91 / 95.0 * |
| Gemma 4 12B | 30 / 100.0 | 21 / 91.7 | 47 / 97.2 | 77 / 95.9 * |
Table 6.
Case study, 148 test photos, Qwen3-VL-2B (4-bit, MLX) on an 8 GB laptop. gpt-5-nano gives no probability, so it has no AUROC. Latency of the local model includes both passes of the swap readout.
Table 6.
Case study, 148 test photos, Qwen3-VL-2B (4-bit, MLX) on an 8 GB laptop. gpt-5-nano gives no probability, so it has no AUROC. Latency of the local model includes both passes of the swap readout.
| Setup | Accuracy | AUROC | s / image | API $ / 1000 images |
|---|---|---|---|---|
| Local model, raw (threshold 0.5) | 77.0% | 0.919 | 3.9 | 0.000 |
| Local model, calibrated | 82.4% | 0.919 | 3.9 | 0.000 |
| gpt-5-nano (minimal reasoning) | 81.1% | – | 1.3 | 0.054 |
| gpt-5-nano (medium reasoning) | 85.8% | – | 7.1 | 0.319 |
| Calibrated local model, decided automatically above a confidence gate: | ||||
| gate 0.8: 49% of photos (73/148), 97.3% accurate; gate 0.9: 34% (51/148), 100.0% accurate | ||||
Disclaimer/Publisher’s Note: The statements, opinions and data contained in all publications are solely those of the individual author(s) and contributor(s) and not of MDPI and/or the editor(s). MDPI and/or the editor(s) disclaim responsibility for any injury to people or property resulting from any ideas, methods, instructions or products referred to in the content. |
© 2026 by the author. Licensee MDPI, Basel, Switzerland. This article is an open access article distributed under the terms and conditions of the Creative Commons Attribution (CC BY) license.
Copyright: This open access article is published under a Creative Commons CC BY 4.0 license, which permit the free download, distribution, and reuse, provided that the author and preprint are cited in any reuse.