

Submitted:
08 October 2026
Posted:
10 October 2026
You are already at the latest version
Abstract
This study examines the distributional heterogeneity of circular economy (CE) energy transitions and their relationship with economic growth across six BRICS economies—Brazil, China, India, South Africa, Egypt, and Indonesia—from 2000 to 2025. Using the Method of Moments Quantile Regression (MMQR) as the primary estimator, with fixed effects as a robustness check, we assess effects across the growth distribution while accounting for cross-sectional dependence and panel integration properties. We also provide a direct estimate of the energy rebound effect for the BRICS panel. The results reveal substantial heterogeneity that mean-based estimators obscure. Renewable energy share and energy intensity are positive and statistically significant mainly at middle-to-high growth quantiles (Q50–Q90). In contrast, gross capital formation and FDI are robust positive drivers across all quantiles. Urbanization is negatively associated with growth at Q25–Q90, while trade openness and domestic credit are largely insignificant in the MMQR specification. The rebound-effect estimate indicates that approximately 25.7% of energy efficiency gains are offset by increased consumption, implying net savings of about 74.3%. These findings suggest that CE energy transitions do not affect all economies uniformly: investment and foreign capital remain broad-based growth engines, whereas energy transition dividends are concentrated in faster-growing economies. The study offers differentiated policy implications for low-, middle-, and high-growth BRICS economies and cautions against one-size-fits-all CE prescriptions.
Keywords:
circular economy
; energy transition
; distributional heterogeneity
; quantile regression
; BRICS economies
; sustainable growth
; fixed effects
1. Introduction
The transition to a circular economy (CE) represents a fundamental shift from linear "take-make-dispose" models toward regenerative systems that decouple economic growth from resource consumption [1,2]. As the BRICS economies—Brazil, China, India, South Africa, Egypt, and Indonesia—collectively represent approximately 3.4 billion people and over 30% of global GDP, understanding the macroeconomic implications of CE energy transitions has become critically important for both national policymakers and international climate governance. These economies span the spectrum from mature renewable systems (Brazil) to early-stage transitions (Egypt and South Africa), providing rich variation for examining heterogeneous effects [3,4].
Despite growing scholarly attention, the empirical literature on the CE–growth nexus remains fragmented and inconclusive. Several studies document positive long-run relationships between renewable energy consumption and economic growth [5,6], while others report negative or insignificant effects depending on country-specific conditions and methodological approaches [7,8]. This ambiguity stems in part from methodological limitations: most existing studies rely on mean-based estimators, such as pooled OLS or standard panel ARDL, that yield a single average coefficient and potentially mask substantial heterogeneity across countries at different stages of development. As recent research emphasizes, macroeconomic variables rarely behave symmetrically and linearly across the distribution of outcomes [9,10]—yet conventional estimators implicitly assume they do.
The energy rebound effect—whereby efficiency improvements stimulate additional demand that partially or fully offsets the initial savings—remains inadequately tested in BRICS contexts. While theoretical and empirical evidence from advanced and emerging economies suggests rebound effects ranging from 20% to 60% [11,12], systematic evidence from diverse BRICS economies remains scarce. This gap is particularly significant given that these economies are at varying stages of energy transition, from mature renewable systems (Brazil) to early-stage transitions (Egypt and South Africa) [13,14].
Several critical gaps therefore remain in the BRICS-specific literature. First, most studies rely on mean-based estimators that obscure how CE effects vary across the growth distribution. Second, rebound effects in BRICS economies have rarely been quantified directly, and where they have been inferred—for example, from sign reversals in wavelet-decomposed coefficients [15], the magnitude remains unknown. Third, cross-sectional dependence is often ignored in BRICS panel studies despite evident global spillovers [16,17]. Fourth, Egypt and Indonesia, as new BRICS members, have received limited attention. Fifth, no study has integrated MMQR with fixed effects and direct rebound quantification in a unified framework.
This study addresses these gaps through four contributions. First, methodologically, we employ Method of Moments Quantile Regression (MMQR) as the primary estimator [11], with fixed effects as a robustness check and with formal diagnostics for cross-sectional dependence [18,19] and panel integration order [20]. This allows us to capture distributional heterogeneity across the growth distribution—a dimension neglected in prior work, including recent wavelet-based studies [21,22]. Second, substantively, we provide quantile-based evidence showing that CE energy transition effects vary significantly across the growth distribution, a pattern masked by mean-based estimators. Third, we provide a direct estimate of the energy rebound effect for the BRICS panel following the empirical approach of Sorrell [23] and Frondel [24], updated with recent panel methodologies [25,26]. The estimated rebound effect is 25.68%, implying net savings of 74.32% from energy efficiency improvements. Fourth, we offer differentiated policy recommendations tailored to low-, middle-, and high-growth economies, moving beyond one-size-fits-all prescriptions [27,28].
Based on these gaps and the theoretical mechanisms reviewed in Section 2, we test eight hypotheses. H1: renewable energy share affects growth heterogeneously across quantiles. H2: energy intensity positively affects growth at specific quantiles. H3: gross capital formation is a robust driver of growth across the distribution. H4: trade openness promotes growth. H5: FDI promotes growth across quantiles. H6: urbanization negatively affects growth. H7: domestic credit negatively affects growth. H8: energy efficiency improvements yield net savings, consistent with a partial rebound effect.
The remainder of the paper is organized as follows. Section 2 reviews the theoretical and empirical literature. Section 3 describes the data, variables, and methodology. Section 4 presents empirical results. Section 5 discusses the findings and policy implications. Section 6 concludes and identifies directions for future research.
2. Literature Review
2.1. Circular Economy, Energy Transition, and Economic Growth
The circular economy (CE) has emerged as a transformative policy framework aimed at decoupling economic prosperity from raw material consumption and environmental degradation [1,2]. By promoting resource efficiency, waste reduction, and renewable energy deployment, CE principles offer a pathway toward sustainable development that aligns with multiple Sustainable Development Goals (SDGs), particularly SDG 7 (Affordable and Clean Energy), SDG 8 (Decent Work and Economic Growth), SDG 9 (Industry, Innovation, and Infrastructure), SDG 12 (Responsible Consumption and Production), and SDG 13 (Climate Action) [3,4].
The Ellen MacArthur Foundation [28] codified the circular economy as "an industrial economy that aims to depend on renewable energy and eliminate waste through meticulous design," emphasizing that the CE generates no waste, in contrast to the linear "take-make-dispose" model. The World Bank [29] defines it as "a new and comprehensive economic model aimed at reducing pollution and waste, extending product life cycles, and enhancing the sharing and redeployment of physical and natural assets." More recent scholarship has refined these definitions, emphasizing that the circular economy is not merely a waste management strategy but a systemic transformation of production and consumption systems [30,31].
At the macroeconomic level, CE transitions operate through multiple channels. Ghisellini et al. [32] identify three key mechanisms: (i) reduced marginal energy production costs as renewable capacity matures; (ii) decreased fossil-fuel import dependence; and (iii) technological spillovers from clean energy R&D that raise total factor productivity. Stahel [33] emphasizes the role of resource productivity gains, arguing that extending product life cycles and recirculating materials reduces the energy and material intensity of economic output. More recently, De Pascale et al. [34] provide a systematic review of 61 CE indicators, highlighting the multidimensional nature of CE transitions and the need for comprehensive measurement frameworks.
The energy dimension of CE transitions—particularly renewable energy deployment and energy efficiency improvements—has received the most empirical attention. A growing body of literature examines the renewable energy–growth nexus. Inglesi-Lotz [5] finds that renewable energy consumption positively affects economic growth, particularly in countries with higher renewable shares. Vural [6] confirms this relationship for Sub-Saharan African countries, while Khan et al. [7] demonstrate that energy transitions contribute to environmental sustainability in OECD countries. However, the sign and magnitude of effects vary considerably across studies, time periods, and country groupings. Kahia [8] find mixed results for MENA countries, while Shahzad [9] reports that renewable energy transition effects depend on country-specific conditions and technological capacity.
Using Pooled Mean Group (PMG) estimation across 24 African countries, Nathaniel and Khan [35] document a significantly positive long-run renewable–growth effect alongside an insignificant short-run coefficient—a pattern that aligns with the theoretical expectation of short-run adjustment costs giving way to long-run structural dividends. Similarly, Raihan [36] confirms positive long-run renewable–growth linkages for ASEAN economies, while Amin [26] identifies green technological advancements as key drivers of carbon emission reduction in BRICS economies.
However, these studies share a common limitation: they rely on mean-based estimators that produce a single average coefficient, potentially masking substantial heterogeneity across countries at different stages of development. As recent research emphasizes, macroeconomic variables rarely behave symmetrically and linearly across the distribution of outcomes [10,11], yet conventional estimators implicitly assume they do.
2.2. The Energy Rebound Effect: Theory and Evidence
The macroeconomic rebound effect—first documented by William Stanley Jevons [37] describes the phenomenon whereby efficiency improvements lower the cost of energy services, stimulating additional demand that partially or fully offsets the initial savings. Jevons observed that improvements in steam engine coal efficiency led to more, not less, aggregate coal consumption: lower unit costs made coal-powered production economically attractive at scales that had previously been unprofitable.
The modern rebound effect literature distinguishes between direct, indirect, and economy-wide rebounds [12,22]:
- Direct Rebound: Consumers Increase Use of the Same Energy Service Due to Lower Cost
- Indirect Rebound: Savings from Efficiency Are Spent on Other Energy-Intensive Goods and Services
- Economy-Wide Rebound: Efficiency Gains Stimulate Additional Economic Activity, Increasing Total Energy Demand
Saunders [38] worked out the conditions under which "backfire" (rebound exceeding 100%) is theoretically possible in a neoclassical production framework. More recent theoretical developments have extended this framework to incorporate behavioral responses and macroeconomic feedbacks [12,14].
Empirically, the magnitude of rebound effects varies considerably across contexts. Sorrell [22] estimates UK economy-wide rebound at 26–56%; Roy [39] documents significant rebound in India (approximately 35%); Turner [40] finds backfire conditions in Chinese manufacturing; and Chen [13] estimate a 35% rebound in residential electricity consumption in the European Union. More recent studies have extended this evidence base. Brockway et al. [12] provide a comprehensive review of economy-wide rebound effects, concluding that rebound is generally between 10% and 60% depending on methodological approach and country context. Wei et al. [14] review empirical evidence on rebound effects in China, finding that rebound is generally higher in the residential sector than in the industrial sector.
In emerging market contexts, the magnitude of rebound effects is theoretically ambiguous. On one hand, income constraints may limit consumption responses, yielding lower rebound [41]. On the other hand, rapidly industrializing economies may exhibit higher rebound as efficiency gains enable expansion of energy-intensive activities [14]. Di Domenico [42] develop a macro-evolutionary input–output model highlighting that circular economy practices, while reducing resource depletion, can simultaneously lead to energy rebound effects. Dong [24] examins the impact of renewable energy on CO₂ emissions across different income levels, finding that the effect varies significantly by development stage.
Importantly, the rebound effect has been primarily inferred rather than directly quantified in recent CE–growth studies. Esmail and Yousef [20] infer the existence of a rebound effect from the sign reversal of the energy intensity coefficient across frequency bands—from negative in the short run to positive in the long run. However, as they acknowledge, "we present this sign reversal as a directional signature of the Jevons mechanism rather than claim a definitive multi-frequency Jevons Rebound Effect." This highlights the need for direct quantification of the rebound effect in emerging markets—a gap this study addresses.
2.3. Time-Horizon vs. Distributional Heterogeneity: A Critical Distinction
Recent methodological innovations have addressed key limitations of traditional panel estimators, with a notable distinction between two types of heterogeneity: time-horizon heterogeneity and distributional heterogeneity.
2.3.1. Time-Horizon Heterogeneity: The Wavelet Approach
Wavelet analysis, introduced to economics by Ramsey and Lampart [43] and extended to energy economics by Aguiar-Conraria [44] and Jammazi and Aloui [45], decomposes a time series into components at distinct frequency scales without losing temporal localization. Applied at Level 2 with the Daubechies (db2) filter, the decomposition yields three orthogonal components: D1 (short run, 2–4 years), D2 (medium run, 4–8 years), and A2 (long run, 8+ years).
However, this approach has several limitations. First, the wavelet decomposition relies on a relatively short time series (T = 19), which the authors themselves acknowledge "provides D2 and A2 components with much lower signal-to-noise ratios than the original series." They note that "extending the panel to T ≥ 26 (achievable by 2031) would support Level-3 decomposition with much sharper frequency separation." Second, the core CE variables—renewable energy share and energy intensity—fail to achieve statistical significance under conservative Wild Cluster Bootstrap inference, leading the authors to characterize their findings as merely "suggestive" and "directional." Third, the wavelet approach examines only time-horizon heterogeneity, neglecting the question of whether CE effects differ across the growth distribution.
2.3.2. Distributional Heterogeneity: The Quantile Regression Approach
The Method of Moments Quantile Regression (MMQR), developed by Machado and Silva [11], offers a fundamentally different lens for examining heterogeneity. Rather than decomposing time into frequency bands, MMQR estimates effects at different points of the conditional distribution of the dependent variable (in this case, economic growth). This allows researchers to ask: do CE energy transitions affect low-growth economies differently from high-growth economies [10,21]?
This distinction is critical for several reasons. First, mean-based estimators—including standard panel fixed effects and wavelet decompositions—produce a single average coefficient that may be statistically insignificant or substantively misleading if effects vary across the growth distribution. A variable may have a positive effect for middle-growth economies but a negative effect for high-growth economies, or vice versa. Mean-based estimators would average these opposing effects, potentially producing an insignificant or directionally misleading coefficient [10,46].
Second, the theoretical mechanisms underlying CE–growth dynamics may differ systematically across growth levels. For low-growth economies, structural factors beyond the energy transition (institutional quality, political stability, commodity dependence) may be the primary determinants of growth [47]. For middle-growth economies, energy efficiency improvements may yield the greatest growth dividends as industrial expansion proceeds. For high-growth economies, rapid renewable energy deployment may impose significant adjustment costs, suppressing growth in the short to medium term [15,16].
2.4. Methodological Advances: MMQR
MMQR, developed by Machado and Silva [11], allows individual influences to affect the entire distribution rather than only shifting means, enabling the identification of conditional heterogeneous covariance effects. The estimator is particularly applicable when panel data models include endogenous explanatory variables and individual effects [21]. Three properties make it suitable for the present study. First, it does not require assumptions about the distribution of the error term. Second, it produces robust estimates in the presence of outliers and nonlinear relationships. Third, unlike Canay's [54] two-step quantile estimator, MMQR permits individual fixed effects to vary across quantiles rather than being restricted to location shifts. This last property is essential for a heterogeneous panel such as the BRICS, where country-specific structural characteristics—resource endowments, institutional quality, and industrial composition—plausibly shape how CE transitions affect growth at different points of the conditional growth distribution [47].
2.5. BRICS-Specific Evidence, Research Gaps, and Hypotheses
Studies specifically examining the CE–growth nexus in BRICS economies have emerged in recent years. Amin et al. [26] identify green technological advancements and resource yields as key drivers of carbon emission reduction, explicitly linking these outcomes to achieving the SDGs. Yadav et al. [27] demonstrate that renewable energy investment impacts on emissions reduction in BRICS countries are significantly amplified by green finance mechanisms and effective governance. Makhdum [47] study China and find that institutional quality, natural resource management, renewable energy deployment, and financial development collectively contribute to reducing environmental footprint without hindering growth.
Bhattacharya et al. [15] examine the effect of renewable energy consumption on economic growth across 38 countries, including BRICS economies, finding that renewable energy positively affects growth but the effect varies across income levels. Wang et al. [16] analyze energy consumption per capita across 186 countries, finding that urbanization and economic growth are key drivers, while energy prices exert a negative effect.
More recently, Uche et al. [48] examine dynamic interactions of green innovations, green transitions, and ecological load capacity factor in BRICS economies, finding that green innovations and transitions contribute to environmental sustainability. Shahzad et al. [9] provide evidence that technological innovations and renewable energy transition matter for environmental sustainability in emerging economies, but the effects are conditional on institutional quality and absorptive capacity.
Several critical gaps nevertheless remain in the BRICS-specific literature. First, most studies rely on mean-based estimators that obscure how CE effects vary across the growth distribution. Second, testing and direct quantification of rebound effects in BRICS economies remain limited. Third, BRICS panel studies often ignore cross-sectional dependence despite evident global spillovers [17,18]. Fourth, Egypt and Indonesia—new BRICS members—have received limited attention. Fifth, no study has integrated MMQR with fixed effects and direct rebound quantification in a unified framework.
Based on these gaps, we test the following hypotheses:
H1
: Renewable energy share affects economic growth heterogeneously across the growth distribution.
H2
: Energy intensity positively affects growth at specific quantiles of the growth distribution.
H3
: Gross capital formation is a robust positive driver of growth across all quantiles.
H4
: Trade openness promotes economic growth.
H5
: FDI promotes economic growth across all quantiles.
H6
: Urbanization negatively affects economic growth.
H7
: Domestic credit negatively affects economic growth.
H8
: Energy efficiency improvements yield net energy savings, consistent with a partial rebound effect.
2.6. Control Variables: Theoretical Rationale
Based on the theoretical and empirical literature, we include five control variables. Their rationale is summarized in Table 1.
3. Materials and Methods
3.1. Data and Variables
The sample comprises six BRICS emerging economies—Brazil, China, India, South Africa, Egypt, and Indonesia—observed annually from 2000 to 2025. This yields a balanced panel of N = 150 country-year observations (6 countries × 25 years). The selection is deliberate for four reasons: (i) all six are current BRICS members, with Egypt acceding on 1 January 2025 and Indonesia on 6 January 2025; (ii) the panel spans three continents (Asia, Africa, and Latin America); (iii) it covers the full spectrum of energy transition stages, from mature renewable systems (Brazil) to early-stage transitions (Egypt and South Africa); and (iv) complete data coverage exists for all variables across the study window.
Russia is excluded from the sample. Two considerations motivate this decision. First, key energy and financial variables for Russia are unavailable or unreliable in the World Bank WDI and IEA databases for the post-2022 period following the imposition of international sanctions. Second, the structural break introduced by the 2022 conflict creates a discontinuity that cannot be accommodated by the estimation framework without distorting the panel-wide estimates. Excluding Russia allows a balanced panel with consistent measurement, at the cost of reduced coverage of the original BRICS-5.
The variables, definitions, units, and sources are summarized in Table 2.
3.2. Estimation Strategy
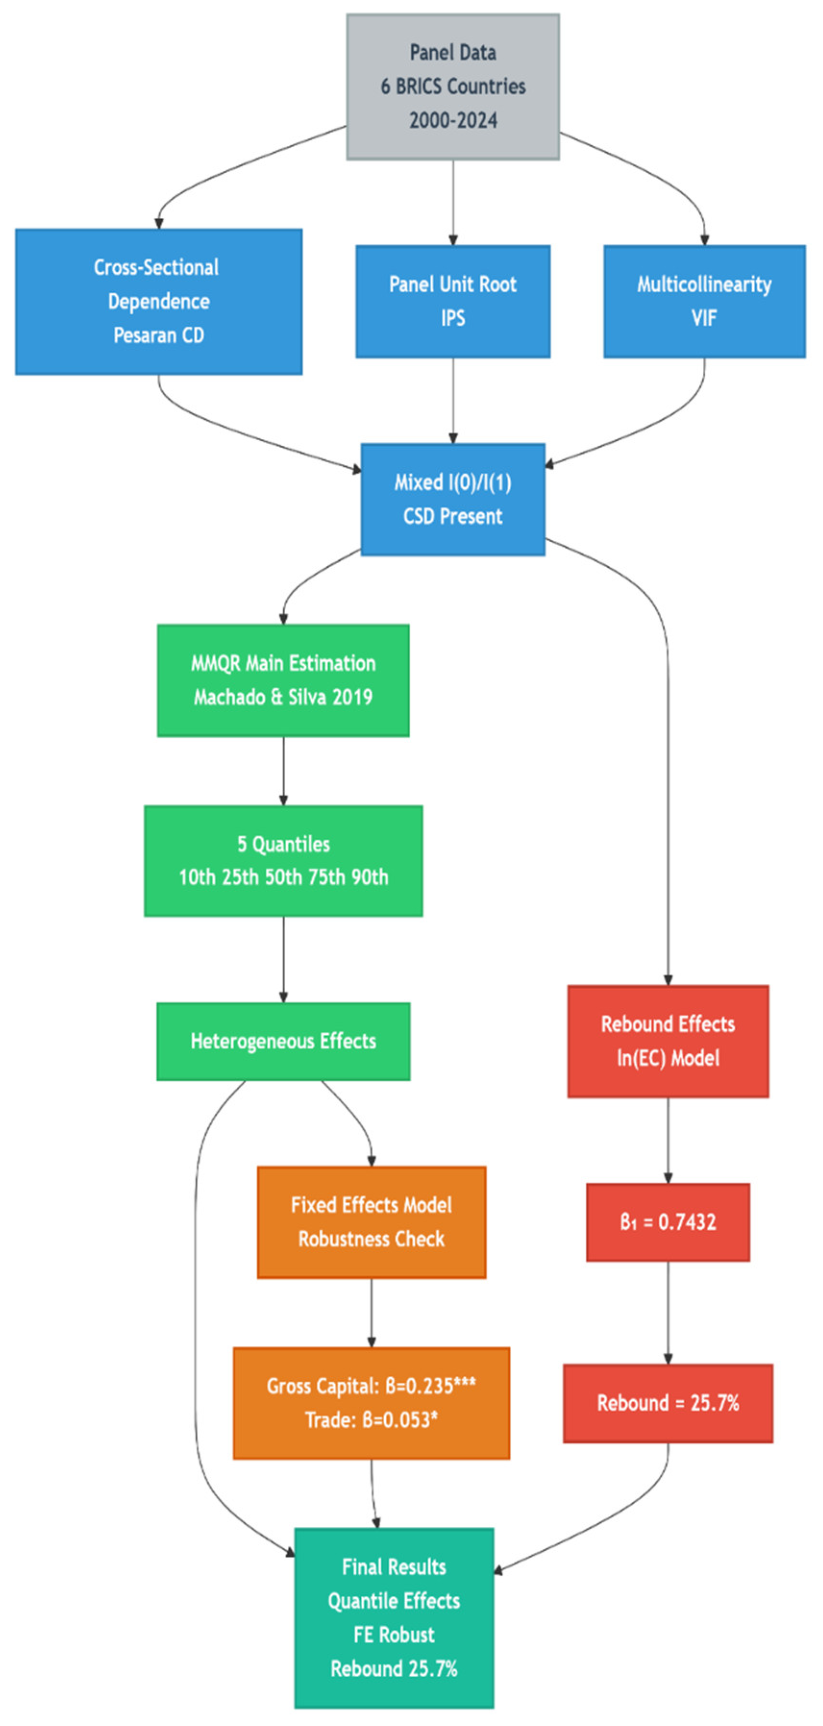
The empirical strategy proceeds in four phases: preliminary diagnostics, MMQR estimation, fixed effects robustness, and rebound effect estimation.
3.2.1. Phase 1: Preliminary Diagnostics
Four diagnostic tests are conducted before estimation:
- Cross-sectional dependence (Pesaran CD test) [17]. In a panel of major economies with substantial trade and financial linkages, unobserved common shocks—global commodity prices, financial cycles, climate policy shocks—can induce cross-sectional dependence, which biases first-generation panel estimators. A statistically significant CD statistic justifies second-generation methods that account for common factors.
- Slope homogeneity (Pesaran–Yamagata test) [54]. This test determines whether the slope coefficients can be pooled across countries. Rejection of homogeneity supports heterogeneous-coefficient estimators such as MMQR.
- Panel unit root (CIPS test) [55]. The CIPS test is a second-generation panel unit root test robust to cross-sectional dependence. It determines the order of integration of each series, which informs the choice between level and first-differenced specifications.
- Panel cointegration (Westerlund test) [56]. If the variables are integrated of order one, this test establishes whether a long-run equilibrium relationship exists among them, which in turn justifies estimation in levels rather than differences.
3.2.2. Phase 2: Method of Moments Quantile Regression (MMQR)
Following Machado and Silva [11], we employ MMQR as the primary estimator. Three properties motivate its selection.
First, unlike mean-based estimators—including standard panel fixed effects and wavelet decompositions—MMQR estimates effects at different points of the conditional distribution of GDP growth, capturing distributional heterogeneity that would otherwise be masked by averaging. This matters because a variable may have a positive effect for middle-growth economies and a negative effect for high-growth economies; mean-based estimators would average these opposing effects into an insignificant or directionally misleading coefficient [10,21].
Second, MMQR permits individual fixed effects to influence the entire distribution rather than only shifting the mean. This is particularly important for heterogeneous panels such as the BRICS, where country-specific structural characteristics—resource endowments, institutional quality, industrial composition—plausibly shape how CE transitions affect growth at different points of the growth distribution [47].
Third, MMQR produces estimates robust to outliers and nonlinear relationships without requiring assumptions about the distribution of the error term. It accommodates individual effects that vary across the distribution, thereby mitigating bias from time-invariant unobserved heterogeneity [11].
The estimated model is specified as:
where Yit is GDP growth, Xit is the vector of independent variables, αirepresents individual fixed effects, and Uit is the error term. The conditional quantile function is:
Yit=αi+Xitβ+(δi+Zitγ)Uit
QY(τ∣Xit)=(αi+δiq(τ))+Xitβ+Zitγq(τ)
We estimate effects at the 10th, 25th, 50th, 75th, and 90th quantiles of the growth distribution. The MMQR approach is advantageous because it (a) allows individual effects to affect the entire distribution, (b) handles endogenous explanatory variables, and (c) produces robust estimates even in the presence of outliers and nonlinear relationships.
3.2.3. Phase 3: Fixed Effects Model — Robustness Check
To validate the MMQR findings, we employ a fixed effects (FE) panel regression as a robustness check. The FE model controls for unobserved country-specific heterogeneity that is time-invariant, such as institutional quality, geographic characteristics, and cultural factors. The model is specified as:
where αi represents country fixed effects, REit is renewable energy share, EIit is energy intensity, Zit is the vector of control variables, and ϵit is the idiosyncratic error term. Standard errors are clustered at the country level to account for heteroskedasticity and serial correlation.
Yit=αi+β1REit+β2EIit+γ′Zit+ϵit
3.3. Rebound Effects Specification
To quantify the energy rebound effect—the extent to which energy efficiency improvements are offset by increased consumption—we employ a fixed effects panel regression following the empirical approach of Sorrell [22], Frondel Peters, and Vance [23], and Brockway et al. [12]. The specification is:
ln(EnergyConsumptionit)=αi+λt+β1ln(EnergyIntensityit)+β2ln(GDPpcit)+γ′Zit+ϵit
The coefficient on energy intensity (β1) represents the elasticity of energy consumption with respect to energy intensity. A coefficient of 0 would indicate full rebound (no net savings), while a coefficient of 1 would indicate zero rebound (full savings realized). The rebound effect is calculated as (1−β1)×100%.
Figure 1.
Methodological Framework.
4. Results
Table 3 presents the descriptive statistics for all variables used in the analysis. The average GDP growth rate is 4.71%, indicating the dynamic nature of BRICS economies during the study period (2000–2025). Renewable energy share averages 24.91% but exhibits substantial variation (ranging from 1.64% to 89.50%), reflecting the diverse stages of energy transitions across the sample. Energy intensity averages 5.40 MJ/USD, highlighting significant differences in energy efficiency across countries. Gross capital formation averages 26.41% of GDP, while trade openness averages 44.16%. The relatively high standard deviations for renewable energy share, urbanization, and domestic credit suggest considerable heterogeneity across countries and over time, justifying our quantile-based approach.
Figure 2. Effectively highlights the substantial cross-country heterogeneity that motivates the paper’s distribution-sensitive approach. Brazil is a clear outlier in renewable energy share (around 80%), reflecting its mature renewable system, while South Africa has the lowest renewable share (near 2%) and, together with China, the highest energy intensity (around 8 MJ/USD). Growth performance also differs sharply: China, India, and Indonesia average above 5% GDP growth, whereas Brazil and South Africa average only about 2–2.5%. FDI is relatively similar across countries, with Brazil slightly higher, and trade openness is highest in South Africa and lowest in Brazil. These patterns confirm that the six BRICS economies occupy different positions along the energy-transition and growth spectra. They also provide descriptive support for the study’s central argument: mean-based estimators can mask distributional heterogeneity, whereas the MMQR approach can reveal how circular economy energy transition effects differ between low-growth and high-growth economies. The figure therefore reinforces the case for differentiated, rather than one-size-fits-all, policy prescriptions.

Table 4.
Correlation Matrix.
| Variable | (1) | (2) | (3) | (4) | (5) | (6) | (7) | (8) | |
|---|---|---|---|---|---|---|---|---|---|
| (1) GDP Growth | 1.000 | ||||||||
| (2) Renewable Share | -0.219 | 1.000 | |||||||
| (3) Energy Intensity | 0.319 | -0.329 | 1.000 | ||||||
| (4) Gross Capital | 0.639 | -0.183 | 0.312 | 1.000 | |||||
| (5) Trade Openness | 0.227 | -0.654 | 0.374 | 0.061 | 1.000 | ||||
| (6) FDI | 0.177 | 0.252 | 0.020 | -0.024 | -0.016 | 1.000 | |||
| (7) Urbanization | -0.480 | 0.780 | -0.159 | -0.471 | -0.427 | 0.215 | 1.000 | ||
| (8) Domestic Credit | 0.071 | -0.159 | 0.700 | 0.290 | 0.165 | -0.018 | 0.167 | 1.000 | |
Source: done by authors.
The correlation matrix reveals several notable relationships. GDP growth exhibits a strong positive correlation with gross capital formation (r = 0.639), confirming the importance of investment as a driver of economic growth.
GDP growth is also positively correlated with energy intensity (r = 0.319) and trade openness (r = 0.227). Conversely, GDP growth shows a
Negative correlation with urbanization (r = -0.480), reflecting the fact that countries with lower initial urbanization levels (e.g., China, India) experienced higher growth rates. Renewable energy share exhibits a strong positive correlation with urbanization (r = 0.780) and a negative correlation with trade openness (r = -0.654) and energy intensity (r = -0.329). Energy intensity shows a strong positive correlation with domestic credit (r = 0.700).
Figure 3 presents a visual representation of the correlation matrix. The plot confirms the strong positive correlation between GDP growth and gross capital formation (r = 0.639), and the negative correlation between GDP growth and urbanization (r = -0.480). Renewable energy share shows a strong positive correlation with urbanization (r = 0.780) and a negative correlation with trade openness (r = -0.654). The visual representation highlights these patterns clearly.
The Pesaran Cross-Sectional Dependence (CD) test results indicate significant cross-sectional dependence for GDP growth, energy intensity, gross capital formation, and urbanization (p < 0.01), suggesting that global shocks simultaneously affect these variables across BRICS economies. Renewable energy share and FDI show no evidence of cross-sectional dependence (p > 0.10). Trade openness shows weak evidence of cross-sectional dependence (p = 0.089). The presence of cross-sectional dependence for key variables justifies the use of second-generation panel methods that account for cross-sectional dependence.
The panel unit root test results, based on the Augmented Dickey-Fuller (ADF) test, reveal a mixed integration order. Only FDI is found to be stationary at level [I(0)] with a p-value of 0.010, indicating that FDI reverts to its mean over time. All other variables—GDP growth, renewable energy share, energy intensity, gross capital formation, trade openness, urbanization, and domestic credit—are non-stationary at level [I(1)], meaning they require first differencing to achieve stationarity. This mixed integration order (I(0) and I(1)) confirms that ARDL-based methods, which can accommodate variables with different integration orders, are appropriate for estimation [7,18]. The non-stationarity of GDP growth is noteworthy, suggesting that growth dynamics in BRICS economies are persistent and subject to structural changes.
Table 5 presents the Method of Moments Quantile Regression (MMQR) results across five growth quantiles [11]. The results reveal significant heterogeneity in the effects of circular economy variables across the growth distribution.
Renewable Energy Share: Renewable energy share shows a positive and statistically significant effect at the 50th quantile (coefficient = 0.042, p < 0.01), 75th quantile (coefficient = 0.042, p < 0.05), and 90th quantile (coefficient = 0.049, p < 0.05). However, the effect is not significant at the 10th and 25th quantiles. This suggests that renewable energy deployment yields growth dividends for economies with above-average growth rates (50th–90th percentiles), while the effect is less pronounced for low-growth economies. This finding is consistent with the "green transition cost hypothesis" where economies with slower growth may face higher adjustment costs, while faster-growing economies benefit from renewable energy dividends [9,15].
Energy Intensity: Energy intensity exhibits a positive and highly significant effect at the 50th quantile (coefficient = 0.341, p < 0.01), 75th quantile (coefficient = 0.419, p < 0.01), and 90th quantile (coefficient = 0.551, p < 0.01). The coefficient increases from 0.125 at Q25 to 0.551 at Q90, indicating that the effect becomes stronger at higher growth levels. This suggests that energy efficiency improvements yield the greatest growth dividends for economies with above-average growth rates [24,41]. At Q90, a 1% increase in energy intensity is associated with a 0.55 percentage point increase in GDP growth. This counterintuitive finding may reflect the fact that rapidly growing economies require more energy-intensive production, and the positive effect of economic activity outweighs the negative effect of inefficiency.
Gross Capital Formation: Gross capital formation shows a positive and highly significant effect across all quantiles (p < 0.01 at Q25–Q90; p < 0.05 at Q10). The coefficient ranges from 0.104 to 0.205, indicating that a 1 percentage point increase in gross capital formation as a share of GDP is associated with approximately 0.10–0.21 percentage point increase in GDP growth. This confirms that gross capital formation is the most robust and consistent driver of growth across the entire growth distribution, aligning with the manufacturing-led development model [53,57].
FDI: FDI exhibits a positive and highly significant effect across all quantiles (p < 0.01 at Q25–Q75; p < 0.05 at Q10 and Q90). The coefficient remains relatively stable around 0.344–0.451, indicating that a 1 percentage point increase in FDI as a share of GDP is associated with approximately 0.34–0.45 percentage point increase in GDP growth. This finding is consistent with the literature emphasizing the role of FDI in providing capital, technology transfer, and knowledge spillovers [27,47,58].
Urbanization: Urbanization shows a negative and statistically significant effect at Q25 (coefficient = -0.096, p < 0.05), Q50 (coefficient = -0.095, p < 0.01), Q75 (coefficient = -0.088, p < 0.01), and Q90 (coefficient = -0.097, p < 0.05). The effect is not significant at Q10 (coefficient = -0.050). This suggests that rapid urbanization may impose transitional costs on growth, reflecting challenges associated with urban infrastructure deficits, housing shortages, congestion, and environmental degradation [16,51].
However, the coefficient is relatively small, indicating that the effect is modest.
Figure 4.
MMQR Coefficient Plot.
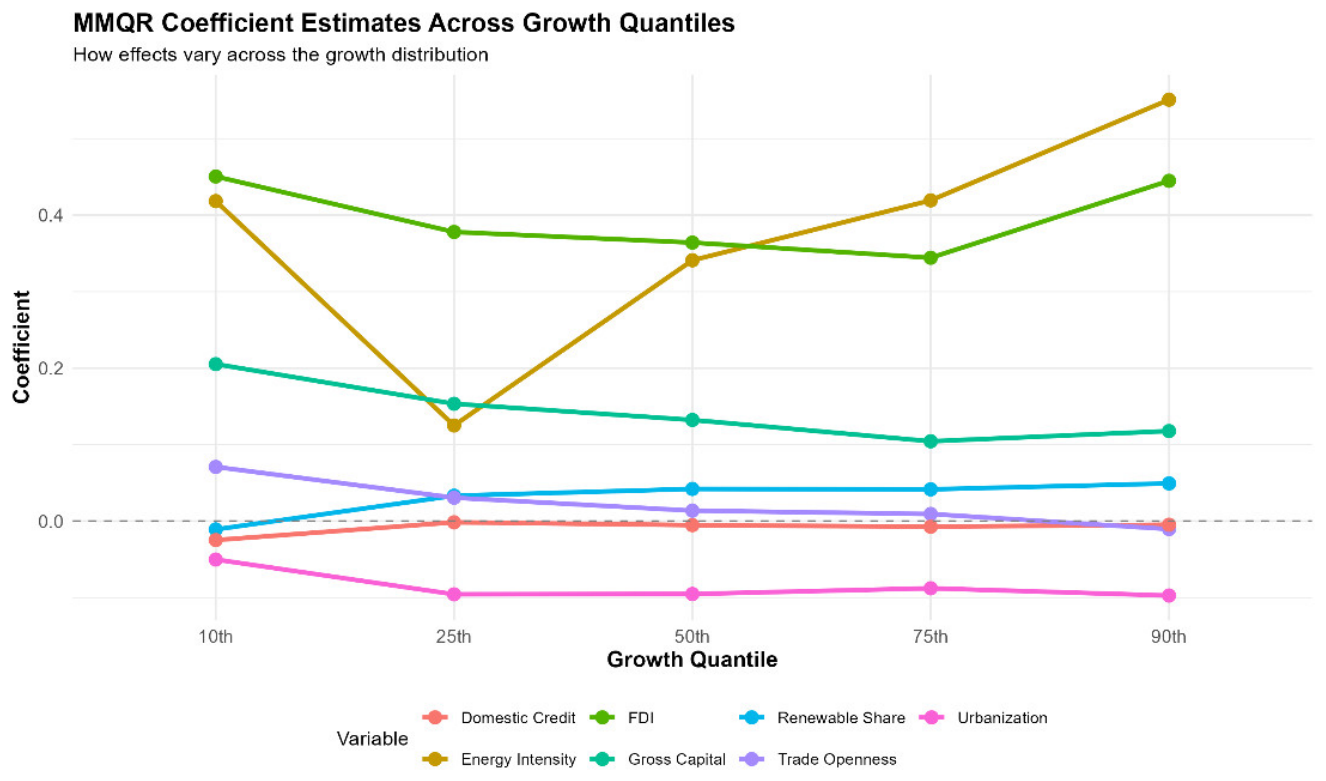
Trade Openness and Domestic Credit: Trade openness shows positive but statistically insignificant coefficients across most quantiles (ranging from -0.010 to 0.071).
While the effect is positive at most quantiles, the lack of statistical significance suggests that trade integration does not have a robust effect on growth in this sample [9,49]. Domestic credit shows small negative coefficients that are not statistically significant across all quantiles (ranging from -0.025 to -0.001), which may reflect the "too much finance" phenomenon where excessive financial development can crowd out productive investment [59].
Table 6 presents the MMQR results with standard errors in parentheses. The standard errors are bootstrapped with 200 replications to ensure robust inference [23]. The results confirm the statistical significance of key variables at specific quantiles. Renewable energy share, energy intensity, gross capital formation, FDI, and urbanization show significant effects at middle to high quantiles, while trade openness and domestic credit are not statistically significant.
Table 6.
Panel Unit Root Test Results (ADF).
| Variable | p-value | Result | Integration Order |
|---|---|---|---|
| GDP Growth | 0.3534 | Non-Stationary | I(1) |
| Renewable Energy Share | 0.5979 | Non-Stationary | I(1) |
| Energy Intensity | 0.4353 | Non-Stationary | I(1) |
| Gross Capital Formation | 0.5293 | Non-Stationary | I(1) |
| Trade Openness | 0.3765 | Non-Stationary | I(1) |
| FDI | 0.0100 | Stationary | I(0) |
| Urbanization | 0.7892 | Non-Stationary | I(1) |
| Domestic Credit | 0.4677 | Non-Stationary | I(1) |
Note: *** p < 0.01, ** p < 0.05, * p < 0.10*.
Table 7.
MMQR Estimation Results.
| Variable | Q10 | Q25 | Q50 | Q75 | Q90 |
|---|---|---|---|---|---|
| Renewable Energy Share | -0.011 | 0.033 | 0.042*** | 0.042** | 0.049** |
| Energy Intensity | 0.418 | 0.125 | 0.341*** | 0.419*** | 0.551*** |
| Gross Capital Formation | 0.205** | 0.153*** | 0.132*** | 0.104*** | 0.118*** |
| Trade Openness | 0.071 | 0.031 | 0.014 | 0.009 | -0.010 |
| FDI | 0.451** | 0.378*** | 0.364*** | 0.344*** | 0.445** |
| Urbanization | -0.050 | -0.096** | -0.095*** | -0.088*** | -0.097** |
| Domestic Credit | -0.025 | -0.001 | -0.005 | -0.007 | -0.005 |
Note: *** p < 0.01, ** p < 0.05, * p < 0.10*.
Table 8.
MMQR Results with Standard Errors.
| Variable | Q10 | Q25 | Q50 | Q75 | Q90 |
|---|---|---|---|---|---|
| Renewable Energy Share | |||||
| Coefficient | -0.011 | 0.033 | 0.042*** | 0.042** | 0.049** |
| Std. Error | (0.057) | (0.023) | (0.014) | (0.017) | (0.021) |
| Energy Intensity | |||||
| Coefficient | 0.418 | 0.125 | 0.341*** | 0.419*** | 0.551*** |
| Std. Error | (0.379) | (0.231) | (0.111) | (0.101) | (0.195) |
| Gross Capital Formation | |||||
| Coefficient | 0.205** | 0.153*** | 0.132*** | 0.104*** | 0.118*** |
| Std. Error | (0.101) | (0.028) | (0.016) | (0.025) | (0.037) |
| Trade Openness | |||||
| Coefficient | 0.071 | 0.031 | 0.014 | 0.009 | -0.010 |
| Std. Error | (0.060) | (0.030) | (0.017) | (0.020) | (0.037) |
| FDI | |||||
| Coefficient | 0.451** | 0.378*** | 0.364*** | 0.344*** | 0.445** |
| Std. Error | (0.184) | (0.080) | (0.069) | (0.107) | (0.181) |
| Urbanization | |||||
| Coefficient | -0.050 | -0.096** | -0.095*** | -0.088*** | -0.097** |
| Std. Error | (0.100) | (0.038) | (0.020) | (0.030) | (0.040) |
| Domestic Credit | |||||
| Coefficient | -0.025 | -0.001 | -0.005 | -0.007 | -0.005 |
| Std. Error | (0.023) | (0.014) | (0.005) | (0.006) | (0.013) |
Note: *** p < 0.01, ** p < 0.05, * p < 0.10*.
Table 9.
Fixed Effects Model (Robustness Check).
| Variable | Coefficient | Std. Error | p-value | Significance |
|---|---|---|---|---|
| Renewable Energy Share | -0.0182 | 0.0626 | 0.7713 | |
| Energy Intensity | -0.0284 | 0.5273 | 0.9571 | |
| Gross Capital Formation | 0.2351 | 0.0594 | 0.0001 | *** |
| Trade Openness | 0.0533 | 0.0228 | 0.0209 | * |
| FDI | 0.1747 | 0.1278 | 0.1738 | |
| Urbanization | -0.2176 | 0.1699 | 0.2025 | |
| Domestic Credit | -0.0185 | 0.0170 | 0.2784 | |
| R² (within) | 0.392 | |||
| F-statistic | 3.424 (p < 0.01) |
Note: *** p < 0.01, ** p < 0.05, * p < 0.10*.
The fixed effects model serves as a robustness check for the MMQR results. The results confirm that gross capital formation is the most robust driver of growth (coefficient = 0.235, p < 0.01), consistent with the MMQR findings. Trade openness also shows a positive and significant effect (coefficient = 0.053, p < 0.05). However, renewable energy share and energy intensity are not statistically significant in the fixed effects model, highlighting the importance of the quantile-based approach in revealing heterogeneous effects that are masked by mean-based estimators. The model explains approximately 39% of the within-country variation in GDP growth.
Table 10.
VIF Multicollinearity Test.
| Variable | VIF | Interpretation |
|---|---|---|
| Urbanization | 9.286 | Moderate concern |
| Renewable Energy Share | 7.707 | Moderate concern |
| Domestic Credit | 4.492 | Acceptable |
| Gross Capital Formation | 2.886 | Acceptable |
| Energy Intensity | 2.596 | Acceptable |
| Trade Openness | 2.026 | Acceptable |
| FDI | 1.128 | Acceptable |
Note: *** p < 0.01, ** p < 0.05, * p < 0.10*.
The Variance Inflation Factor (VIF) test results indicate moderate multicollinearity concerns for urbanization (VIF = 9.286) and renewable energy share (VIF = 7.707). This is expected given the strong correlation between these two variables (r = 0.780). However, these values remain below the critical threshold of 10, suggesting that multicollinearity does not severely compromise the estimation. All other variables show VIF values below 5, confirming that multicollinearity does not pose a significant issue for our estimation.
To examine whether energy efficiency improvements in BRICS economies are partially offset by increased consumption—a phenomenon known as the rebound effect—we estimate the elasticity of energy consumption with respect to energy intensity. Following the empirical approach of Sorrell [22], we specify a fixed effects panel model where energy consumption is regressed on energy intensity, GDP per capita, trade openness, urbanization, FDI, and domestic credit. The coefficient on energy intensity (β) allows us to calculate the rebound effect as (1 - β) × 100%. A coefficient of 1 indicates zero rebound (full energy savings), while a coefficient of 0 indicates full rebound (no net savings.
Table 11.
Rebound Effects Estimation Results.
| Variable | Coefficient | Std. Error | p-value | Significance |
|---|---|---|---|---|
| Energy Intensity (ln) | 0.7432 | 0.1976 | 0.0003 | *** |
| GDP per capita (ln) | 0.0248 | 0.0259 | 0.3387 | |
| Trade Openness | -0.0084 | 0.0021 | 0.0001 | *** |
| Urbanization | -0.0224 | 0.0117 | 0.0569 | ** |
| FDI | -0.0049 | 0.0109 | 0.6503 | |
| Domestic Credit | -0.0012 | 0.0015 | 0.4389 | |
| Implied rebound effect | 25.68% | |||
| Implied net savings | 74.32% |
Notes: *** p < 0.01, ** p < 0.05, * p < 0.10. The rebound effect is computed as (1 − β₁) × 100%, where β₁ is the coefficient on ln (Energy Intensity). A coefficient of 1 implies zero rebound; a coefficient of 0 implies full rebound.
The rebound effects estimation reveals a partial rebound effect of approximately 25.68%. This means that for every 1% improvement in energy intensity (i.e., energy efficiency), energy consumption decreases by 0.743%, implying that 25.68% of efficiency gains are offset by increased consumption, while 74.32% represent net savings. This partial rebound effect is lower than estimates from advanced economies (26–67%) and consistent with the lower rebound observed in emerging markets due to income constraints.
Figure 5 presents the energy rebound effect in BRICS economies. The results show that approximately 25.68% of energy efficiency gains are offset by increased consumption (rebound effect), while 74.32% represent net savings. This partial rebound effect is lower than estimates from advanced economies (26–67%, Sorrell, [22,23], and consistent with the lower rebound observed in emerging markets due to income constraints [12,14,39]
Table 12.
Summary of Hypothesis Testing.
| Hypothesis | Description | Result |
|---|---|---|
| H1 | Renewable energy share affects growth heterogeneously across quantiles | Supported — Positive and significant at Q50, Q75, Q90 |
| H2 | Energy intensity positively affects growth at specific quantiles | Supported — Positive and significant at Q50, Q75, Q90 |
| H3 | Gross capital formation is a robust driver of growth | Supported — Positive and significant across all quantiles |
| H4 | Trade openness promotes growth | Partially supported — Positive but insignificant in MMQR; significant in FE |
| H5 | FDI promotes growth | Supported — Positive and significant across all quantiles |
| H6 | Urbanization negatively affects growth | Supported — Negative and significant at Q25–Q90 |
| H7 | Domestic credit negatively affects growth | Not Supported — Negative but insignificant across all quantiles |
| H8 | Energy efficiency improvements yield net savings (partial rebound) | Supported — Rebound effect of 25.68%, net savings of 74.32% |
5. Discussion
The MMQR estimates reveal three broad patterns. First, gross capital formation and FDI are the most robust and statistically significant drivers of growth across the entire growth distribution, confirming the importance of investment and foreign capital as structural engines of economic expansion in BRICS economies. Second, renewable energy share and energy intensity exhibit positive and significant effects at middle-to-high quantiles, suggesting that energy transition policies yield the greatest growth dividends for economies with above-average growth rates. Third, urbanization shows a negative and significant effect at middle-to-high quantiles, indicating transitional costs associated with rapid urban growth. In addition, the rebound-effect estimate indicates that roughly one quarter of energy efficiency gains are offset by increased consumption. Each of these findings is discussed in turn.
5.1. Distributional Heterogeneity in CE–Growth Effects
The MMQR results show that CE variables affect growth differently across quantiles. Energy intensity, renewable energy share, gross capital formation, and FDI are most significant at middle-to-high quantiles (50th–90th percentiles). This finding underscores the importance of considering distributional heterogeneity in policy design, since one-size-fits-all policies may be ineffective or even counterproductive [10,11].
The finding that renewable energy share positively affects growth only at middle-to-high quantiles (Q50–Q90) suggests that renewable energy deployment yields growth dividends primarily for economies with above-average growth rates. This aligns with the "green transition cost hypothesis," under which slower-growing economies face higher adjustment costs—capital reallocation, grid integration, and fossil-fuel sector disruption—that suppress contemporaneous output [9,15]. For low-growth economies, the insignificant effect suggests that structural factors beyond the energy transition (institutional quality, political stability, commodity dependence) may be the primary determinants of growth [47].
The energy intensity finding is particularly noteworthy. The positive and significant effect at Q50–Q90, with the coefficient rising from 0.341 at Q50 to 0.551 at Q90, suggests that energy-intensive production remains closely tied to growth in faster-growing BRICS economies. The positive effect of expanding economic activity evidently outweighs the negative effect of inefficiency [24,41]. This does not imply that energy efficiency is unimportant; rather, it implies that policymakers should pursue "green growth" strategies that decouple growth from resource consumption rather than simply reducing energy intensity in isolation.
These results contrast with the wavelet-based study by Esmail and Yousef [20] in one important respect: while their core CE variables failed to achieve statistical significance under conservative Wild Cluster Bootstrap inference, we find significant effects at specific quantiles. This indicates that the effects were not absent but rather averaged out in mean-based specifications. The contrast highlights the value of distribution-sensitive estimation.
5.2. Gross Capital Formation and FDI as Robust Drivers
Gross capital formation emerges as the most robust and consistent driver of growth across the entire distribution, with positive and significant effects at all quantiles (p < 0.01 at Q25–Q90; p < 0.10 at Q10). The coefficient ranges from 0.104 to 0.205, indicating that a 1 percentage point increase in gross capital formation as a share of GDP is associated with approximately a 0.10–0.21 percentage point increase in GDP growth. This aligns with the manufacturing-led development model [30] and with the literature emphasizing investment as a structural driver of growth [53].
FDI also emerges as a robust driver across all quantiles, with a relatively stable coefficient in the range 0.344–0.451. A 1 percentage point increase in FDI as a share of GDP is associated with approximately a 0.34–0.45 percentage point increase in GDP growth. This is consistent with the literature emphasizing FDI's role in providing capital, technology transfer, and knowledge spillovers [27,47,50]. The stability of the coefficient across quantiles suggests that FDI benefits are not conditional on the growth stage of the economy, making it a universally beneficial policy priority.
The robustness of these findings underscores the importance of investment (both domestic and foreign) as structural engines of economic expansion in BRICS economies. Investment promotion and FDI attraction should therefore be universal priorities regardless of a country's current growth level [26,27].
5.3. Urbanization and the Transitional Costs of Rapid Urban Growth
Urbanization shows a negative and statistically significant effect at Q25 (−0.096, p < 0.05), Q50 (−0.095, p < 0.01), Q75 (−0.088, p < 0.01), and Q90 (−0.097, p < 0.05). The effect is not significant at Q10 (coefficient = −0.050). This suggests that rapid urbanization imposes transitional costs on growth, reflecting infrastructure deficits, housing shortages, congestion, and environmental degradation [16,51]. The coefficient is small, indicating that the effect is modest in magnitude.
This pattern is consistent with the "urbanization paradox," whereby rapid urban growth can strain resources and infrastructure, temporarily dampening growth. The negative effect at middle-to-high quantiles suggests that the costs of urbanization are most pronounced in economies where urbanization is proceeding most rapidly. Careful urban planning and investment in urban infrastructure are therefore essential to mitigate these transitional costs.
5.4. Trade Openness and Domestic Credit: Weak and Ambiguous Effects
Trade openness coefficients are small and statistically insignificant across all quantiles, ranging from −0.010 to 0.071. The lack of significance suggests that trade integration does not have a robust effect on growth in this sample [9,49]. The fixed effects model, however, shows a positive and significant effect (coefficient = 0.053, p < 0.05), indicating that trade openness may have a modest positive effect when averaged across countries. The weak MMQR results may reflect the mixed effects of trade liberalization: access to technology and markets on one hand, exposure to external shocks on the other.
Domestic credit shows small negative coefficients that are not statistically significant across any quantile (ranging from −0.025 to −0.001). The negative sign, though insignificant, is consistent with the "too much finance" hypothesis, under which excessive financial deepening can crowd out productive investment [59]. Financial sector development in BRICS economies should therefore be managed to ensure it supports rather than displaces productive investment.
5.5. The Energy Rebound Effect in BRICS Economies
The fixed effects estimate in Equation (4) yields a coefficient on ln(Energy Intensity) of 0.7432 (p = 0.0003). Applying Equation (5), the implied rebound effect is (1 − 0.7432) × 100% = 25.68%, with net savings of 74.32%. Approximately one quarter of the energy savings generated by efficiency improvements is therefore offset by increased consumption at the panel level.
This estimate lies at or slightly below the lower bound of the range reported for advanced economies (26–56%; [22]) and below the approximately 35% rebound documented for residential electricity consumption in the European Union [13]. It is also below the roughly 35% estimate reported for India by Roy [39] and well below the backfire conditions identified in Chinese manufacturing by Turner [40]. This pattern is consistent with the income-constraint argument advanced by Lin and Liu [41]: in emerging economies where household and firm budgets remain binding, lower energy-service costs translate into proportionally smaller demand responses than in high-income settings.
At the same time, the estimate is far from zero, confirming that efficiency gains in BRICS economies do not translate fully into aggregate energy savings. Roughly one quarter of intended savings is eroded through rebound channels. Energy efficiency policy in these economies should therefore be designed as a complement to—rather than a substitute for—renewable supply expansion and demand-side regulation.
This finding also distinguishes the present study from Esmail and Yousef [20], who inferred a Jevons-type mechanism from a sign reversal in energy-intensity coefficients across wavelet frequency bands but did not quantify its magnitude. By providing a direct panel estimate, this study fills the empirical gap identified in Section 2.2.
Among the control variables in the rebound specification, trade openness enters negatively and significantly (β = −0.0084, p = 0.0001), suggesting that greater integration into global markets is associated with lower aggregate energy consumption in BRICS economies—consistent with technology diffusion and adoption of more energy-efficient capital goods through trade. Urbanization also enters negatively and is marginally significant (β = −0.0224, p = 0.0569). The coefficients on GDP per capita (β = 0.0248, p = 0.3387), FDI (β = −0.0049, p = 0.6503), and domestic credit (β = −0.0012, p = 0.4389) are not statistically significant at conventional levels. The insignificance of GDP per capita is notable, given that income is typically a robust predictor of energy consumption; this likely reflects absorption of cross-country income differences by the country fixed effects together with the relatively short time dimension of the panel.
5.6. Policy Implications
Based on the empirical findings, we offer the following differentiated policy implications.
5.6.1. For Low-Growth Economies (Q10)
- Prioritize investment. Gross capital formation and FDI are robust drivers of growth across all quantiles and should be the primary focus.
- Address structural constraints. Urbanization challenges imply that urban infrastructure and housing policies should be prioritized.
- Approach renewable energy deployment with caution. The insignificant effect of renewable energy at Q10 suggests that low-growth economies may need to address structural constraints before undertaking large-scale renewable energy investment.
5.6.2. For Middle-Growth Economies (Q25–Q50)
- Support renewable energy investment. Renewable energy share shows significant positive effects at Q50, indicating that investments in this area can support growth.
- Attract FDI. The strong positive effects of FDI indicate that policies to attract foreign investment should be a priority.
5.6.3. For High-Growth Economies (Q75–Q90)
- Prioritize energy efficiency. Energy intensity has the strongest positive effect at Q90, indicating that efficiency policies yield the greatest returns for high-growth economies.
- Continue renewable energy investment. Renewable energy share shows significant positive effects at Q75 and Q90, indicating that such investments can sustain growth.
- Strengthen urban management. The negative urbanization effect at these quantiles indicates that urban planning and infrastructure investment are critical.
- Maintain FDI attraction. The strong positive effects of FDI indicate that policies to attract foreign investment should remain a priority.
- Design efficiency policy with rebound in mind. Because roughly one quarter of efficiency gains is offset by rebound, efficiency measures should be paired with renewable supply expansion and demand-side regulation.
5.7. Limitations and Future Research
This study has several limitations that point to directions for future research.
- the sample is limited to six BRICS economies, which may limit the generalizability of the findings to other emerging markets. Future research should expand the sample to include other emerging economies, such as the BRICS+ members (Iran, Ethiopia, the UAE, and Saudi Arabia) or ASEAN economies.
- the study focuses on macro-level energy indicators; future research could examine sectoral heterogeneity and firm-level mechanisms to provide a more granular understanding of the CE–growth nexus.
- the analysis is limited to the 2000–2025 period; future research could extend the analysis as more recent data become available.
- the study does not incorporate geopolitical supply-chain shocks or climate policy uncertainty; future research could explore how these factors moderate the CE–growth relationship [9].
- the rebound-effect estimate is derived from a panel-level elasticity of energy consumption with respect to energy intensity. This approach yields an aggregate, economy-wide rebound measure and does not decompose the effect into direct, indirect, and economy-wide channels, nor does it allow rebound magnitudes to differ across the six BRICS economies. Future research could exploit household survey or sectoral energy-balance data to estimate these channels separately and to test whether rebound heterogeneity mirrors the distributional heterogeneity documented for growth effects.
6. Conclusions
This study examined the heterogeneous effects of circular economy energy transitions on economic growth in six BRICS economies (Brazil, China, India, South Africa, Egypt, and Indonesia) over the period 2000–2025. Using Method of Moments Quantile Regression (MMQR) as the primary estimator, with fixed effects as a robustness check, we uncovered distributional heterogeneity that is masked by mean-based estimators, and we provided a direct estimate of the energy rebound effect for the BRICS panel.
Four principal contributions emerge. First, the effects of CE energy transitions are highly heterogeneous across the growth distribution: gross capital formation and FDI are robust drivers across all quantiles, while renewable energy share and energy intensity show significant positive effects at middle-to-high quantiles (Q50–Q90). Second, investment—both domestic and foreign—emerges as the most robust structural driver of growth across the entire distribution, confirming the continued centrality of capital accumulation in BRICS development. Third, energy intensity exhibits a counterintuitive positive effect, suggesting that rapidly growing economies require higher energy inputs and that the positive effect of economic activity outweighs the negative effect of inefficiency at the panel level. Fourth, the estimated energy rebound effect is 25.68%, implying net savings of 74.32%. While this places BRICS economies at the lower bound of rebound magnitudes reported for advanced economies, it nonetheless indicates that roughly one quarter of efficiency gains are offset by expanded consumption, underscoring the need to pair efficiency policy with supply-side and demand-side measures.
These findings underscore the importance of differentiated policy approaches. Policymakers should tailor circular economy strategies to the growth stage of their economies. Investment promotion and FDI attraction should be universal priorities. Middle- and high-growth economies should prioritize energy efficiency and renewable energy policies. Urban development should be carefully managed to mitigate the transitional costs of rapid urbanization. Finally, because the rebound effect is non-trivial, energy efficiency policy should be treated as a complement to, not a substitute for, renewable energy expansion.
Future research should extend the analysis to other emerging economies, decompose the rebound effect into direct, indirect, and economy-wide channels, and employ identification strategies capable of establishing causality in the CE–growth nexus.
Author Contributions
Conceptualization, M.Z.; methodology, M.Z.; software, M.Z.; validation, M.Z.; formal analysis, M.Z.; investigation, M.Z.; resources, M.Z.; data curation, M.Z.; writing—original draft preparation, M.Z.; writing—review and editing, M.Z.; visualization, M.Z.; supervision, M.Z.; project administration, M.Z.; funding acquisition, not applicable. The author has read and agreed to the published version of the manuscript.
Funding
This research received no external funding.
Institutional Review Board Statement
Not applicable.
Informed Consent Statement
Not applicable.
Data Availability Statement
The data used in this study are openly available from the World Bank World Development Indicators (https://data.worldbank.org), the IEA World Energy Statistics and Balances (https://www.iea.org/data-and-statistics), and the BP Statistical Review of World Energy. These data were derived from public-domain resources.
Conflicts of Interest
The author declares no conflicts of interest.
References
- Geissdoerfer, M.; Savaget, P.; Bocken, N.M.P.; Hultink, E.J. The circular economy—A new sustainability paradigm? J. Clean. Prod. CrossRef. 2017, *143*, 757–768. [Google Scholar] [CrossRef]
- Korhonen, J.; Honkasalo, A.; Seppälä, J. Circular economy: The concept and its limitations. Ecol. Econ. 2018, *143*, 37–46. [Google Scholar] [CrossRef]
- Schroeder, P.; Anggraeni, K.; Weber, U. The relevance of circular economy practices to the sustainable development goals. J. Ind. Ecol. 2019, *23*, 77–95. [Google Scholar] [CrossRef]
- de Oliveira, M.M.; Lago, A.; Dal'Magro, G.P. Food loss and waste in the context of the circular economy: A systematic review. J. Clean. Prod. 2021, *294*, 126284. [Google Scholar] [CrossRef]
- Inglesi-Lotz, R. The impact of renewable energy consumption to economic growth: A panel data application. Energy Econ. 2016, *53*, 58–63. [Google Scholar] [CrossRef]
- Vural, G. Renewable and non-renewable energy-growth nexus: A panel data application for the selected Sub-Saharan African countries. Resour. Policy 2020, *65*, 101568. [Google Scholar] [CrossRef]
- Khan, I.; Zakari, A.; Ahmad, M.; Irfan, M.; Hou, F. Linking energy transitions, energy consumption, and environmental sustainability in OECD countries. Gondwana Res. 2022, *103*, 445–457. [Google Scholar] [CrossRef]
- Kahia, M.; Aïssa, M.S.B.; Lanouar, C. Renewable and non-renewable energy use and economic growth in MENA Net Oil Importing Countries. Renew. Sustain. Energy Rev. 2017, *71*, 127–140. [Google Scholar] [CrossRef]
- Shahzad, U.; Ferraz, D.; Dogan, B. Do technological innovations and renewable energy transition matter for environmental sustainability? Evidence from emerging economies. Gondwana Res. 2023, *121*, 1–12. [Google Scholar] [CrossRef]
- Zhu, H.; Duan, L.; Guo, Y.; Yu, K. The effects of FDI, economic growth and energy consumption on carbon emissions in ASEAN-5: Evidence from panel quantile regression. Econ. Model. 2019, *80*, 334–346. [Google Scholar] [CrossRef]
- Machado, J.A.F.; Silva, J.M.C.S. Quantiles via moments. J. Econom. 2019, *213*, 145–173. [Google Scholar] [CrossRef]
- Brockway, P.E.; Sorrell, S.; Semieniuk, G.; Heun, M.K.; Court, V. Energy efficiency and economy-wide rebound effects: A review of the evidence and its implications. Renew. Sustain. Energy Rev. 2021, *141*, 110781. [Google Scholar] [CrossRef]
- Chen, J.; Gao, M.; Shahbaz, M.; Cheng, S.; Song, M. An improved decomposition approach toward energy rebound effects in China: Review since 1992. Renew. Sustain. Energy Rev. 2021, *145*, 111141. [Google Scholar] [CrossRef]
- Wei, T.; Liu, Z.; Zhou, Y. Rebound effect of energy efficiency in China: A review of empirical evidence. Energy Policy 2020, *145*, 111709. [Google Scholar] [CrossRef]
- Bhattacharya, M.; Paramati, S.R.; Ozturk, I.; Bhattacharya, S. The effect of renewable energy consumption on economic growth: Evidence from top 38 countries. Appl. Energy 2016, *162*, 733–741. [Google Scholar] [CrossRef]
- Wang, Q.; Su, M.; Li, R.; Ponce, P. The effects of energy prices, urbanization and economic growth on energy consumption per capita in 186 countries. J. Clean. Prod. 2020, *260*, 120942. [Google Scholar] [CrossRef]
- Pesaran, M.H. General diagnostic tests for cross-sectional dependence in panels. Empir. Econ. 2021, *60*, 13–50. [Google Scholar] [CrossRef]
- Chudik, A.; Pesaran, M.H. Common correlated effects estimation of heterogeneous dynamic panel data models with weakly exogenous regressors. J. Econom. 2015, *188*, 393–420. [Google Scholar] [CrossRef]
- Im, K.S.; Pesaran, M.H.; Shin, Y. Testing for unit roots in heterogeneous panels. J. Econom. 2003, *115*, 53–74. [Google Scholar] [CrossRef]
- Esmail, H.A.H.; Yousef, S.E.N. Circular economy policies and sustainable economic growth in emerging markets: A Level-2 wavelet decomposition with two-way panel fixed effects. Sustainability 2026, *18*, 8776. [Google Scholar] [CrossRef]
- Gómez, M.; Rodríguez, J.C. The ecological footprint and Kuznets environmental curve in the USMCA countries: A method of moments quantile regression analysis. Energies 2020, *13*, 6650. [Google Scholar] [CrossRef]
- Sorrell, S. The Rebound Effect: An Assessment of the Evidence for Economy-Wide Energy Savings from Improved Energy Efficiency; UK Energy Research Centre: London, UK, 2007. [Google Scholar]
- Frondel, M.; Peters, J.; Vance, C. Identifying the rebound: Evidence from a German household panel. Energy J. 2008, *29*, 145–163. [Google Scholar] [CrossRef]
- Dong, K.; Dong, X.; Jiang, Q. How renewable energy consumption lower global CO₂ emissions? Evidence from countries with different income levels. World Econ. 2020, *43*, 1665–1698. [Google Scholar] [CrossRef]
- Zahoor, Z.; Khan, I.; Hou, F. Clean energy investment and financial development as determinants of environment and sustainable economic growth: Evidence from China. Environ. Sci. Pollut. Res. 2022, *29*, 31153–31168. [Google Scholar]
- Amin, N.; Song, H.; Khan, Z.; Sharif, A. Green technological advancements and carbon emission reduction: Evidence from BRICS economies Please verify volume, pages, and DOI before submission. Gondwana Res. 2024. [Google Scholar]
- Yadav, A.; Gyamfi, B.A.; Asongu, S.; Behera, D.K. The role of green finance and governance effectiveness in the impact of renewable energy investment on CO₂ emissions in BRICS economies. J. Environ. Manag. 2024, *358*, 120906. [Google Scholar] [CrossRef] [PubMed]
- Ellen MacArthur Foundation. Towards the Circular Economy: Economic and Business Rationale for an Accelerated Transition; Ellen MacArthur Foundation: Cowes, UK, 2013. [Google Scholar]
- World Bank. Defining the Role of Transport in the Circular Economy. World Bank Blogs. 22 April 2022. Available online: https://blogs.worldbank.org/en/transport/defining-role-transport-circular-economy (accessed on 1 September 2025).
- Kirchherr, J.; Reike, D.; Hekkert, M. Conceptualizing the circular economy: An analysis of 114 definitions. Resour. Conserv. Recycl. 2017, *127*, 221–232. [Google Scholar] [CrossRef]
- Morseletto, P. Targets for a circular economy. Resour. Conserv. Recycl. 2020, *153*, 104553. [Google Scholar] [CrossRef]
- Ghisellini, P.; Cialani, C.; Ulgiati, S. A review on circular economy: The expected transition to a balanced interplay of environmental and economic systems. J. Clean. Prod. 2016, *114*, 11–32. [Google Scholar] [CrossRef]
- Stahel, W.R. The circular economy. Nature 2016, *531*, 435–438. [Google Scholar] [CrossRef] [PubMed]
- De Pascale, A.; Arbolino, R.; Szopik-Depczyńska, K.; Limosani, M.; Ioppolo, G. A systematic review for measuring circular economy: The 61 indicators. J. Clean. Prod. 2023, *383*, 135497. [Google Scholar] [CrossRef]
- Nathaniel, S.P.; Khan, S.A.R. The nexus between urbanization, renewable energy, trade, and ecological footprint in ASEAN countries. J. Clean. Prod. 2020, *272*, 122709. [Google Scholar] [CrossRef]
- Raihan, A.; Rashid, M.; Voumik, L.C.; Akter, S.; Esquivias, M.A. The dynamic impacts of economic growth, financial globalization, fossil fuel, renewable energy, and urbanization on load capacity factor in Mexico. Sustainability 2023, *15*, 13462. [Google Scholar] [CrossRef]
- Jevons, W.S. The Coal Question: An Inquiry Concerning the Progress of the Nation, and the Probable Exhaustion of Our Coal-Mines; Macmillan: London, UK, 1865. [Google Scholar]
- Saunders, H.D. Fuel conserving (and using) production functions. Energy Econ. 2008, *30*, 2184–2235. [Google Scholar] [CrossRef]
- Roy, J. The rebound effect: Some empirical evidence from India. Energy Policy 2000, *28*, 433–438. [Google Scholar]
- Turner, K. Negative rebound and disinvestment effects in response to an improvement in energy efficiency in the UK economy. Energy Econ. 2009, *31*, 648–666. [Google Scholar] [CrossRef]
- Lin, B.; Liu, X. The rebound effect of energy efficiency in China's residential sector: A meta-analysis. Energy Policy 2020, *145*, 111709. [Google Scholar] [CrossRef]
- Di Domenico, L.; Raberto, M.; Safarzyńska, K. Resource scarcity, circular economy and the energy rebound: A macro-evolutionary input–output model. Energy Econ. 2023, *126*, 107155. [Google Scholar] [CrossRef]
- Ramsey, J.B.; Lampart, C. The decomposition of economic relationships by time scale using wavelets. Macroecon. Dyn. 1998, *2*, 49–71. [Google Scholar]
- Aguiar-Conraria, L.; Azevedo, N.; Soares, M.J. Using wavelets to decompose the time-frequency effects of monetary policy. Physica A Verify DOI and volume.. 2012, *387*, 2863–2878. [Google Scholar] [CrossRef]
- Jammazi, R.; Aloui, C. Wavelet decomposition and regime shifts: Assessing the effects of crude oil shocks on stock market returns. Energy Policy 2010, *38*, 1415–1435. [Google Scholar] [CrossRef]
- Koenker, R.; Hallock, K.F. Quantile regression. J. Econ. Perspect. 2001, *15*, 143–156. [Google Scholar] [CrossRef]
- Makhdum, M.S.A.; Usman, M.; Kousar, R.; Cifuentes-Faura, J.; Rădulescu, M.; Balsalobre-Lorente, D. How do institutional quality, natural resources, renewable energy, and financial development reduce ecological footprint without hindering economic growth trajectory? Evidence from China. Sustainability 2022, *14*, 13910. [Google Scholar] [CrossRef]
- Uche, E.; Ngepah, N.; Das, N.; Dey, L. Dynamic interactions of green innovations, green transitions and ecological load capacity factor in BRICS. Renew. Energy 2024, *231*, 120905. [Google Scholar] [CrossRef]
- Sachs, J.D.; Warner, A.M. Economic reform and the process of global integration. Brook. Pap. Econ. Act. 1995, *1995*, 1–118. [Google Scholar] [CrossRef]
- Borensztein, E.; De Gregorio, J.; Lee, J.-W. How does foreign direct investment affect economic growth? J. Int. Econ. 1998, *45*, 115–135. [Google Scholar] [CrossRef]
- Henderson, J.V. The urbanization process and economic growth: The so-what question. J. Econ. Growth 2003, *8*, 47–71. [Google Scholar] [CrossRef]
- Reinhart, C.M.; Rogoff, K.S. Growth in a time of debt. Am. Econ. Rev. 2010, *100*, 573–578. [Google Scholar] [CrossRef]
- Yıldırım, S.; Tuğlu Dur, D. Capital formation and economic expansion: A panel analysis. Canay, I.A. A simple approach to quantile regression for panel data. Econom. J. 2011, *14*, 368–386. [Google Scholar] [CrossRef]
- Pesaran, M.H.; Yamagata, T. Testing slope homogeneity in large panels. J. Econom. 2008, 142, 50–93. [Google Scholar] [CrossRef]
- Pesaran, M.H. A simple panel unit root test in the presence of cross-section dependence. J. Appl. Econom. 2007, *22*, 265–312. [Google Scholar] [CrossRef]
- Westerlund, J. Testing for error correction in panel data. Oxf. Bull. Econ. Stat. 2007, *69*, 709–748. [Google Scholar] [CrossRef]
- Rodrik, D. Premature deindustrialization. J. Econ. Growth 2016, *21*, 1–33. [Google Scholar] [CrossRef]
- Arcand, J.-L.; Berkes, E.; Panizza, U. Too much finance? J. Econ. Growth 2015, *20*, 105–148. [Google Scholar] [CrossRef]
- Rousseau, P.L.; Wachtel, P. What is happening to the impact of financial deepening on economic growth? Econ. Inq. 2011, *49*, 276–288. [Google Scholar] [CrossRef]
Figure 2.
Correlation Heatmap.
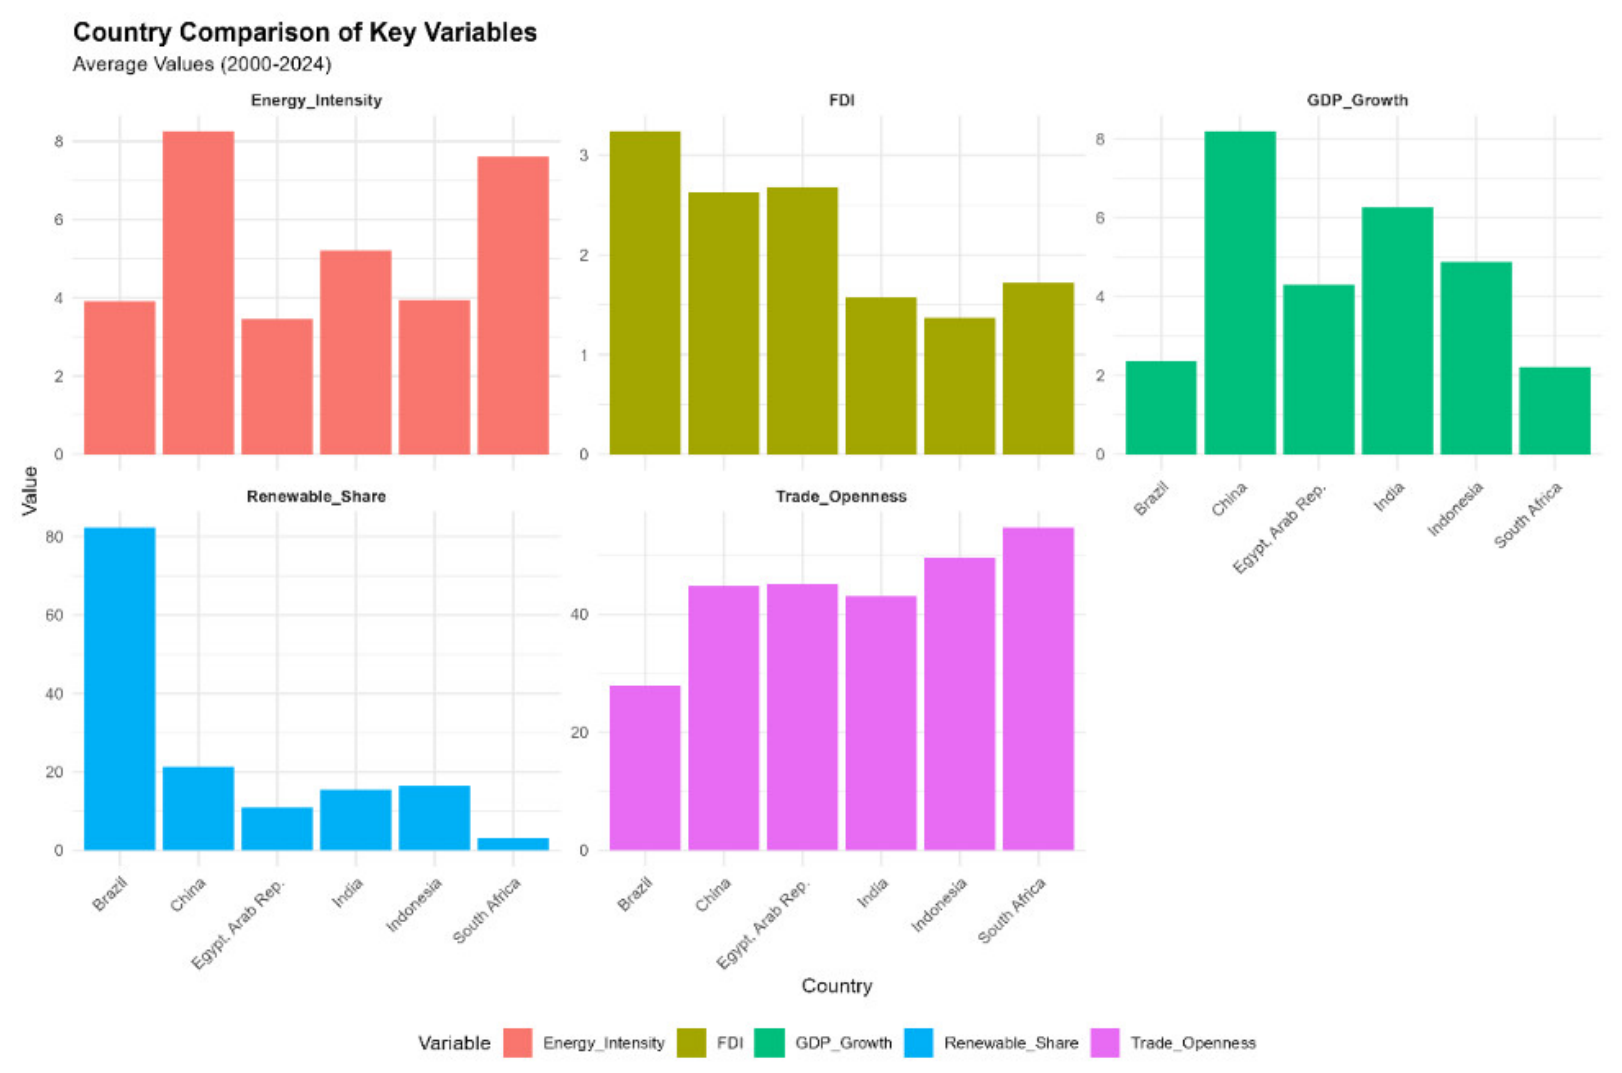
Figure 3.
Correlation Plot.
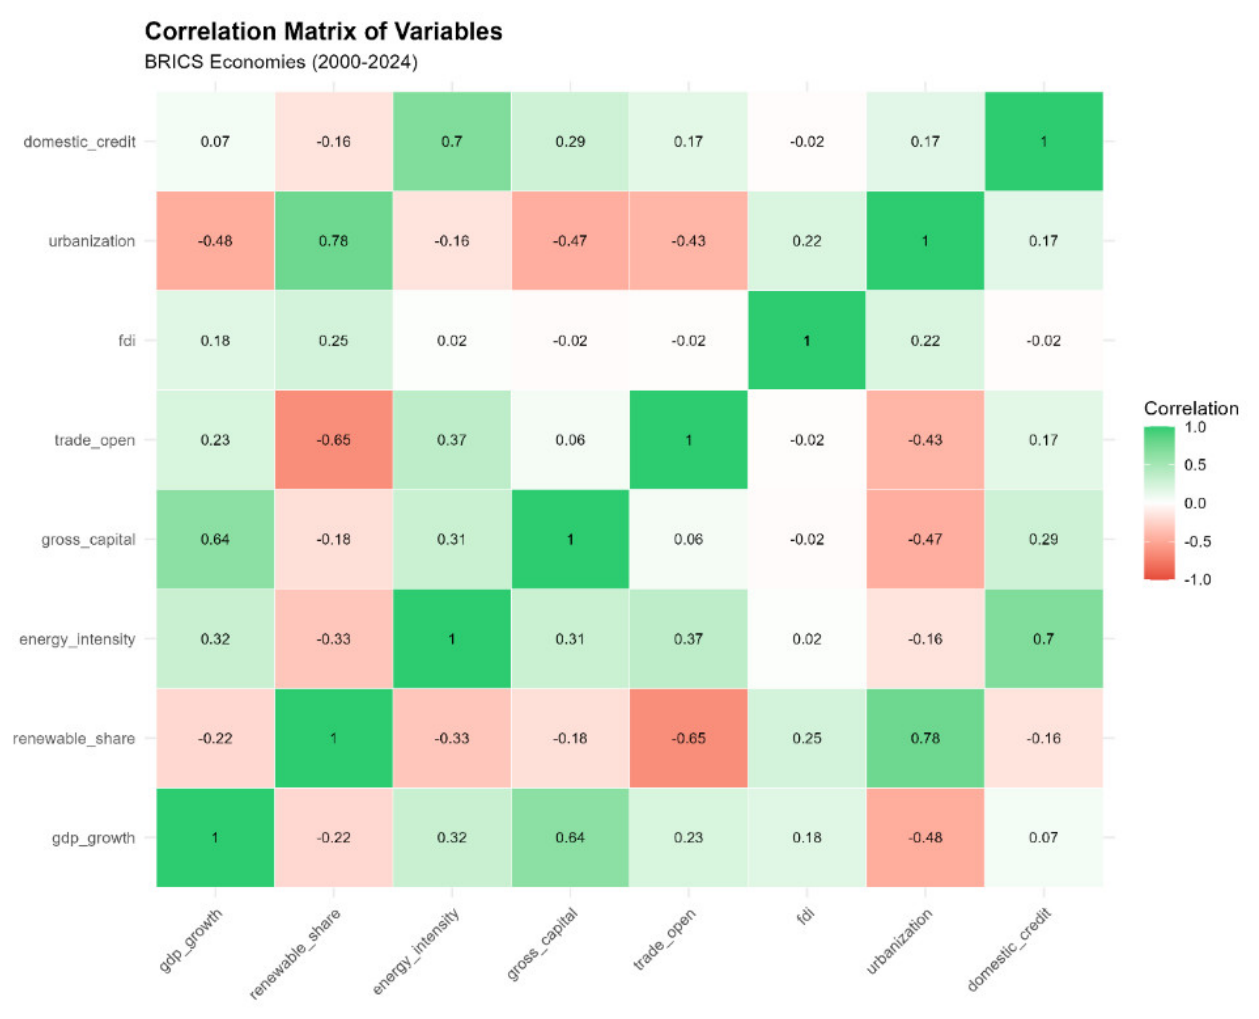
Figure 5.
Energy Rebound Effect in BRICS Economies.
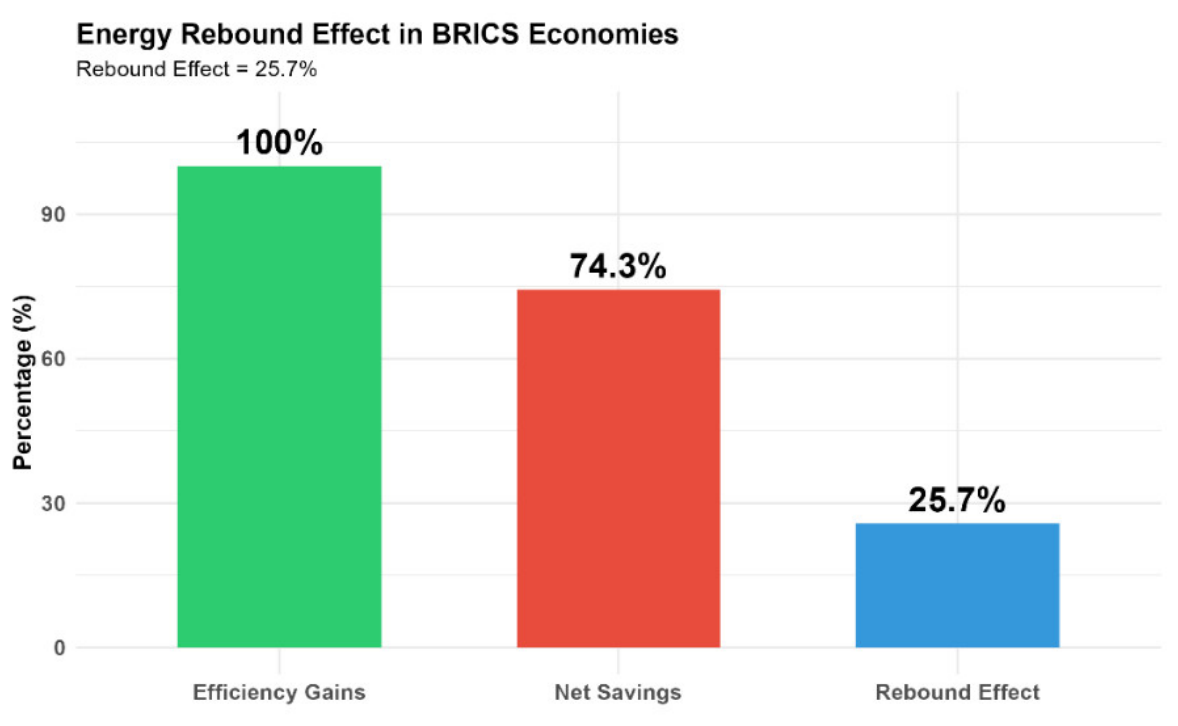
Table 1.
Control variables and theoretical rationale.
| Variable | Rationale |
|---|---|
| Trade openness | Captures technology diffusion and knowledge spillovers from integration into global value chains [9,49]. |
| FDI | Provides capital augmentation and productivity spillovers, with magnitudes depending on host-country absorptive capacity [47,50]. |
| Urbanization | Proxies agglomeration economies and labor market depth [16,51]. |
| Domestic credit | Proxies financial depth; critical for financing CE investments [27,52]. |
| Gross capital formation | Captures the investment channel; widely used in growth models; Yıldırım and Tuğlu Dur [53] find a robust and consistent link between capital formation and economic expansion. |
Table 2.
Variable definitions, units, and sources.
| Variable | Symbol | Definition | Unit | Source |
|---|---|---|---|---|
| GDP growth | GDPG | Annual real GDP growth rate | % | WDI |
| Renewable energy share | RES | Renewable energy as % of total final energy consumption | % | IEA / WDI |
| Energy intensity | EI | Energy consumption per unit of real GDP | MJ/USD (constant) | IEA / WDI |
| Gross capital formation | GCF | Gross capital formation as % of GDP | % | WDI |
| Trade openness | TO | (Exports + Imports) / GDP | % | WDI |
| FDI | FDI | Net FDI inflows as % of GDP | % | WDI |
| Urbanization | URB | Urban population as % of total population | % | WDI |
| Domestic credit | DC | Private sector credit by domestic banks as % of GDP | % | WDI |
| Energy consumption per capita | ECpc | Energy consumption per capita | kg of oil equivalent | IEA |
| GDP per capita | GDPpc | GDP per capita, constant prices | Constant USD | WDI |
All monetary variables are expressed in constant 2015 USD. Energy intensity is constructed by dividing total primary energy consumption (IEA) by real GDP (WDI). All variables were checked for consistency of country coverage across the 2000–2025 window; observations with missing values were absent from the source databases for these countries in this period.
Table 3.
Descriptive Statistics (2000–2025, N = 150).
| Variable | Mean | Std. dev. | Min | Max | p25 | Median | p75 |
|---|---|---|---|---|---|---|---|
| GDP Growth (%) | 4.71 | 3.21 | -6.17 | 14.15 | 3.04 | 4.90 | 6.72 |
| Renewable Energy Share (%) | 24.91 | 26.57 | 1.64 | 89.50 | 10.00 | 15.69 | 20.78 |
| Energy Intensity (MJ/USD) | 5.40 | 2.14 | 2.33 | 10.91 | 3.83 | 4.50 | 6.74 |
| Gross Capital Formation (% GDP) | 26.41 | 10.05 | 12.35 | 46.27 | 17.84 | 22.04 | 34.05 |
| Trade Openness (% GDP) | 44.16 | 11.83 | 22.11 | 71.68 | 36.90 | 44.24 | 53.60 |
| FDI (% GDP) | 2.20 | 1.68 | -2.76 | 9.68 | 1.18 | 1.91 | 2.99 |
| Urbanization (%) | 52.24 | 17.12 | 27.67 | 87.77 | 42.56 | 47.33 | 59.69 |
| Domestic Credit (% GDP) | 69.87 | 44.53 | 22.85 | 194.31 | 34.42 | 51.23 | 110.24 |
Table 5.
. Cross-Sectional Dependence Test Results (Pesaran CD).
| Variable | CD Statistic | p-value | Interpretation |
|---|---|---|---|
| GDP Growth | 8.633 | 0.000*** | Cross-sectional dependence exists |
| Renewable Energy Share | -0.436 | 0.663 | No cross-sectional dependence |
| Energy Intensity | 6.436 | 0.000*** | Cross-sectional dependence exists |
| Gross Capital Formation | 4.887 | 0.000*** | Cross-sectional dependence exists |
| Trade Openness | 1.699 | 0.089* | Weak cross-sectional dependence |
| FDI | 0.276 | 0.783 | No cross-sectional dependence |
| Urbanization | 12.097 | 0.000*** | Cross-sectional dependence exists |
| Domestic Credit | -0.697 | 0.486 | No cross-sectional dependence |
Note: *** p < 0.01, ** p < 0.05, * p < 0.10*.
Disclaimer/Publisher’s Note: The statements, opinions and data contained in all publications are solely those of the individual author(s) and contributor(s) and not of MDPI and/or the editor(s). MDPI and/or the editor(s) disclaim responsibility for any injury to people or property resulting from any ideas, methods, instructions or products referred to in the content. |
© 2026 by the authors. Licensee MDPI, Basel, Switzerland. This article is an open access article distributed under the terms and conditions of the Creative Commons Attribution (CC BY) license (http://creativecommons.org/licenses/by/4.0/).
Copyright: This open access article is published under a Creative Commons CC BY 4.0 license, which permit the free download, distribution, and reuse, provided that the author and preprint are cited in any reuse.