

Submitted:
07 October 2026
Posted:
10 October 2026
You are already at the latest version
Abstract
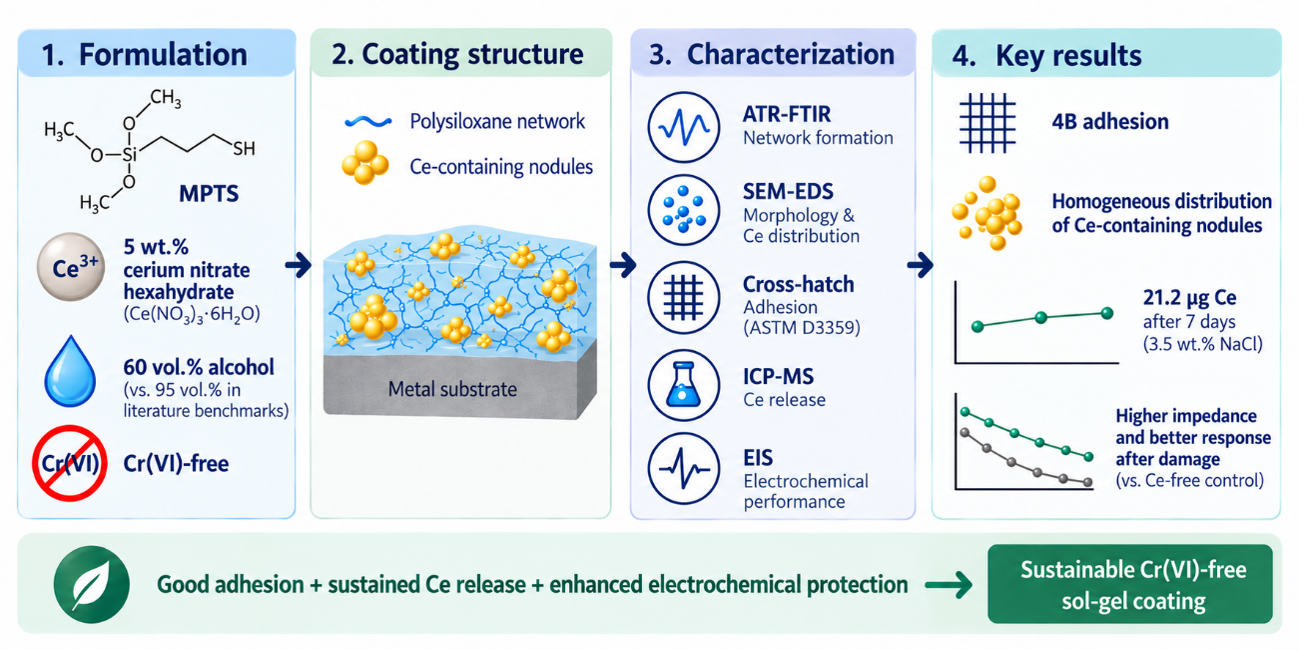
Corrosion remains a major industrial challenge, compromising material durability and generating substantial economic costs. Conventional hexavalent chromium (Cr(VI)) compounds provide active protection but face restrictions due to toxicity. Hybrid organic–inorganic sol-gel coatings offer a versatile platform for chromate-free corrosion protection. This work investigates the physicochemical characteristics and corrosion performance of a cerium-containing hybrid organic–inorganic sol-gel coating based on 3-mercaptopropyltrimethoxysilane (MPTS). To enhance environmental sustainability, the coating was formulated with 60 vol.% alcohol, compared with ≈95 vol.% in literature benchmarks, and incorporated 5 wt.% cerium, reducing volatile organic compound use while eliminating Cr(VI). Chemical structure, morphology, elemental distribution, adhesion, cerium release, and electrochemical performance were evaluated by ATR-FTIR, SEM- EDS, an ASTM D3359- adapted cross-hatch test, ICP-MS, and EIS. ATR-FTIR confirmed polysiloxane network formation, while SEM-EDS revealed a homogeneous surface distribution of cerium-containing nodules. The coating achieved a 4B adhesion rating and sustained cerium release of 21.2 µg after 1 week in 3.5 wt.% NaCl. EIS demonstrated a low-frequency impedance modulus of 9.03×10⁵ Ω⋅cm2 after 1 week and improved electrochemical response in artificially damaged coatings versus Ce-free control. Combined adhesion, sustained cerium release, and electrochemical protection highlight this sustainable hybrid sol-gel formulation for high-performance chromate-free corrosion protection.
Keywords:
sol-gel coatings
; corrosion protection
; chromate-free coatings
; cerium
1. Introduction
Corrosion control and prevention remain critical challenges across major industrial sectors, including aerospace, oil and gas, marine, and infrastructure, where metallic components are continuously exposed to harsh operating conditions and aggressive environments. The economic impact of corrosion is considerable, with its direct costs estimated to account for approximately 3–4% of national Gross Domestic Product (GDP) [1,2]. Nevertheless, the implementation of established corrosion management and prevention strategies has the potential to reduce these costs by 15–35% [2]. Among the approaches historically employed to achieve effective active corrosion protection, conversion coatings, pretreatments, and primers containing hexavalent chromium (Cr(VI)) compounds have played an important role [3]. Despite their well-established protective performance, the widespread use of Cr6+ is increasingly impractical due to its high toxicity, environmental persistence, and significant risks to human health. In particular, Cr(VI) compounds are classified as Group 1 carcinogens by the International Agency for Research on Cancer (IARC) [4], while regulatory frameworks such as the European Union’s REACH (Registration, Evaluation, Authorisation and Restriction of Chemicals) regulation have imposed stringent restrictions on their industrial use [5].
This situation has created an urgent need to develop lower-environmental-impact, chromate-free anticorrosive coatings capable of providing both passive barrier protection and active inhibition performance comparable to more traditional technologies. Among the most promising alternatives, coatings synthesised via the sol-gel process offer chemical versatility, mild processing conditions, and potential for reduced environmental impact [6]. Conventionally, the sol-gel process employs metal alkoxides, such as silicon-, titanium-, or zirconium-based precursors, to form dense, inorganic oxide networks [7]. However, particular interest has shifted towards organosilanes, which contain both non-hydrolysable organic functional groups and hydrolysable alkoxy moieties, allowing for tailored chemical functionality to meet specific application requirements.
Through the simultaneous hydrolysis and condensation reactions of these organosilanes, the sol-gel route yields inorganic or organic-inorganic hybrid (OIH) materials. These systems effectively combine the flexibility of the organic phase with the thermal stability and chemical resistance of an inorganic three-dimensional siloxane (Si-O-Si) network within a single matrix [8]. Furthermore, the relatively low processing temperatures associated with sol-gel synthesis facilitate the formation of thin continuous coatings using straightforward deposition techniques, such as dip-coating and spraying. These characteristics make OIH sol-gel coatings particularly attractive as versatile platforms for corrosion protection [6].
Nevertheless, purely barrier-based coatings remain vulnerable to mechanical damage or local cracking during service, which can expose the underlying metal to the corrosive environment. To address this limitation, recent research has increasingly focused on the development of smart, self-healing, and stimuli-responsive coating systems. By incorporating active corrosion inhibitors into the hybrid matrix (including green alternatives such as plant extracts and biopolymers, metal-organic frameworks (MOFs) and nanostructured carriers), these systems combine robust physical barrier protection with active, localised corrosion control [9,10,11]. Among the wide range of active agents explored for corrosion inhibition, rare-earth elements, such as cerium (Ce) and lanthanum (La), have emerged as comparatively less hazardous alternatives to toxic chromate-based inhibitors [12,13].
Cerium species act primarily as cathodic inhibitors. When local coating breakdown occurs, the local pH change driven by cathodic oxygen reduction causes Ce3+ cations to migrate and precipitate as insoluble cerium hydroxides and oxides overactive cathodic sites. The resulting deposits inhibit the cathodic reaction and thereby suppress further corrosion propagation [14,15]. Integrating cerium cations into an organosilane-derived hybrid matrix creates a dual-action protective system: the condensed siloxane network acts as a physical barrier against water, ions and other corrosive species, while the stored Ce3+ ions provide an active, localised response upon coating degradation. This combination of passive barrier protection and active inhibition offers a promising strategy for developing chromate-free coatings with active corrosion-inhibition capability [16].
To achieve this dual functionality, 3-mercaptopropyltrimethoxysilane (MPTS) serves as a suitable organosilane precursor for the matrix. MPTS features hydrolysable methoxy groups that undergo hydrolysis and condensation to form the siloxane network, along with a propyl chain functionalised with a thiol group (-SH). The presence of the thiol group promotes matrix cohesion and interfacial bonding with metallic substrates [17,18].
A key aspect of this formulation design is the reduction in organic-solvent use during synthesis. While conventional sol-gel routes reported in the literature ([17,19,20]) rely on high ethanol contents (typically 90-95 vol.%), this study employs a low-alcohol formulation. Controlling the apparent pH within a slightly acidic range moderates the rates of MPTS hydrolysis and condensation. This approach not only reduces volatile organic compound emissions but also promotes colloidal sol stability and the proper retention of Ce cations within the matrix.
In this context, the primary objective of this study was to synthesise and physiochemically characterise an OIH sol-gel hybrid coating based on MPTS, doped with Ce3+, formulated without chromates, and developed via a low-alcohol route, and to evaluate its anticorrosive performance. To validate the potential applicability of the developed system to metallic substrates, coatings were deposited onto commercially pure titanium substrates processed by powder metallurgy, used as a model substrate to verify the protective performance of the developed system.
2. Results and Discussion
2.1. Surface Characterisation
Surface characterisation by SEM using secondary electron (SE) and backscattered electron (BSE) modes enabled the assessment of surface topography and differential composition (Figure 1), complemented by semi-quantitative elemental analysis by EDS (Figure 2).
The R-Control coating displayed a continuous, homogeneous surface morphology, free of visible microcracks. Linear features observed in SE (secondary electron) mode corresponded to grinding grooves from the underlying titanium substrate, while BSE (backscattered electron) imaging confirmed compositional uniformity across the film surface. EDS microanalysis verified the presence of C, O, Si, and S, characteristic of the organosilica network derived from the MPTS precursor (Figure 2, Area 1).
In contrast, the cerium precursor induced marked structural alterations in the R-Ce coating. SEM micrographs revealed surface heterogeneity characterised by nodular, island-like domains uniformly distributed across the film (Figure 2). BSE contrast confirmed that these features corresponded to high-atomic-density regions resulting from localised segregation or agglomeration of the cerium inhibitor. Subsequent EDS analysis of these nodules (Figure 3, Area 3) verified a strong Ce signal, confirming the localised enrichment of the corrosion inhibitor within the hybrid matrix. Additionally, no Ce was detected in nodule-free areas (Figure 2, Area 2), indicating that Ce was concentrated in the nodules. These observations suggest that the Ce-containing species were not homogeneously distributed throughout the polysiloxane matrix but were preferentially segregated into Ce-rich domains. These domains may contain precursor-derived Ce species formed during sol–gel processing and drying.
2.2. Contact Angle
The measured contact angle values for bare Ti, R-Control, and R-Ce were 65.15 ± 5.33 ͦ, 91.22 ± 3.59 ͦ and 69.30 ± 3.89 ̊, respectively.
In contrast to the hydrophobic nature of R-Control, the R-Ce coating exhibited more hydrophilic behaviour, matching the lower contact angles observed on bare Ti. The lower contact angle observed for R-Ce may result from a combination of compositional changes and the altered surface morphology induced by the Ce-containing precursor, both of which can influence the interaction of the coating with the saline electrolyte (Figure 1). This behaviour is consistent with the swelling and water-related spectral changes observed for R-Ce.
From a functional perspective, this higher electrolyte affinity may facilitate the mobilisation of Ce-containing species within the coating. However, increased electrolyte uptake may also promote matrix hydration and hydrolytic degradation. The overall protective response therefore likely reflects a balance between inhibitor availability and preservation of the coating barrier properties.
2.3. Thickness
2.4. Adhesion
The interfacial adhesion between the hybrid coatings and the titanium substrate was assessed via cross-cut tests following the ASTM D3359 standard (Figure 3). Both R-Control and R-Ce formulations achieved a 4B classification, indicating flaking of less than 5% and indicating good adhesion to the substrate. No detectable change in adhesion rating was observed following cerium addition suggesting that adhesion was retained under the tested conditions.
2.5. ATR-FTIR
The ATR-FTIR spectra of R-Control and R-Ce xerogels (Figure 4) confirmed the successful formation of the siloxane network and revealed specific structural modifications induced by Ce3+ incorporation.
Overall, the main spectroscopic features associated with the polysiloxane network were preserved after Ce incorporation. This structural integrity is evidenced by the retention of the characteristic bands assigned to the siloxane bonds, including Si-O-Si stretching at approximately 1000 and 1090 cm-1, formed during polycondensation, as well as asymmetric Si-C stretching at 750 cm-1 [25]. Furthermore, both spectra exhibited identical bands corresponding to the organic precursor chains (C-H asymmetric and symmetric stretching at 2940 and 2840 cm-1, respectively) [17,26].
Despite the preservation of the primary network, several changes were observed upon the incorporation of Ce3+. The most notable difference was the increased intensity of the broad band at ~3420 cm-1, attributed to O-H stretching in surface/absorbed water, and residual silanol groups (Si-OH) [26,27]. Additionally, R-Ce exhibited a band at approximately 1640 cm-1, corresponding to the H–O–H bending vibration of molecular water, which was not detected in R-Control [27]. These features indicate a greater contribution from water- and hydroxyl-related species in R-Ce, which may be associated with the hydrated cerium precursor, differences in the degree of condensation, and/or increased hygroscopicity of the Ce-containing formulation. This observation is consistent with the lower contact angle and greater swelling observed for R-Ce, suggesting an increased contribution from hydroxyl- and water-related species and a greater affinity of the coating towards the aqueous media.
Additionally, the R-Ce spectrum displayed new bands in the region of 1300-1450 cm-1, which can be associated with the presence of nitrate ions (NO3-) from the cerium precursor. The band present at 1440 cm-1 may be attributed to nitrate vibrational modes, while the additional band observed at ~1040 cm-1 may involve N-O vibrations, although this region partially overlaps with the Si-O-Si stretching bands of the polysiloxane network [28]. The persistence of nitrate-related bands, together with the Ce-rich domains observed by SEM/EDS, is consistent with the presence of segregated precursor-derived Ce-containing species within the coating. Finally, a noticeable decrease in intensity was observed for the thiol band at 2550 cm-1 (S-H stretching) in R-Ce, indicating that Ce incorporation altered the local chemical environment of the –SH functional groups [17]. However, this spectral change alone is insufficient to establish direct Ce-S coordination, which would require complementary spectroscopic evidence.
In summary, these results demonstrate that, while the incorporation of a nominal Ce3+ loading of 5 wt.% induces localised changes within the chemical structure, particularly those associated with water retention, no major disruption of the polysiloxane network was detectable by ATR-FTIR.
2.6. Cerium Release Study
Cerium release kinetics were evaluated in a 3.5 wt.% NaCl aqueous solution at 25ºC. Quantitative analysis via ICP-MS was performed using a linear calibration curve (R2 = 0.999). Figure 5 displays the cumulative mass of released cerium as a function of immersion time.
Most of the measured Ce release had already occurred by the first sampling point at 24 h, yielding approximately 20.5 µg of released cerium, followed by only minor changes between 24 h and 1 week. This amount of Ce detected at the first sampling may be associated, at least in part, with the dissolution of readily accessible Ce-containing species from the Ce-rich domains observed by SEM/EDS before immersion. Such early Ce availability could potentially contribute to active corrosion inhibition, as it enriches the medium with Ce ions. Upon localised coating damage, these free ions react with OH- species generated at cathodic sites and precipitate as insoluble cerium hydroxides to partially block or occlude active microdefects.
Between 24 h and 72 h, the cumulative cerium concentration remained virtually constant, indicating a markedly reduced release rate after the first sampling point. By 1 week of immersion, a slight increase in released cerium was detected (~21.2 µg). This slight additional release indicates that releasable Ce-containing species were still present in the coating after 72 h and may be associated with progressive hydrolytic degradation of the coating, which facilitates gradual diffusion of the remaining Ce-containing reservoir within the coating.
2.7. Electrochemical Characterisation
Corrosion protection performance and hydrolytic degradation mechanisms of the undoped (R-Control) and cerium-doped (R-Ce) sol-gel coatings were evaluated in an aqueous 3.5 wt.% NaCl solution at room temperature using electrochemical impedance spectroscopy (EIS) over immersion periods of 24 h, 72 h, and 1 week.
Open-circuit potential (OCP) measurements taken before and after the applied potential perturbation (±10 mV) showed minor variations. After 24 h of immersion, the R-Ce system exhibited a more positive OCP value (-0.185 ± 0.009 V) compared to the R-Control formulation (-0.309 ± 0.040 V). These values are consistent with those reported in the literature for analogous systems [29,30,31]. Following 1 week of exposure, both systems displayed an anodic shift in potential: R-Control reached -0.187 ± 0.012 V, whereas R-Ce shifted to a positive potential of +0.117 ± 0.002 V. This potential shift in R-Ce is indicative of an enhanced protective state, possibly driven by the formation of insoluble cerium precipitates combined with the repassivation of the titanium substrate.
Nyquist and Bode spectra recorded after 24 h, 72 h, and 1 week of exposure (Figure 6) illustrate distinct electrochemical behaviours between the two coating systems. For R-Control, the Nyquist plots exhibit a predominantly resistive-capacitive response that remains relatively stable throughout the testing period. The low-frequency impedance modulus (|Z|0.01 Hz) varied minimally, moving from 6.73 × 10⁵ Ω ⋅ cm2 at 24 h to 7.22 × 10⁵ Ω ⋅ cm2 after 1 week.
R-Ce showed a different temporal evolution. At 24 h, its low-frequency impedance modulus (|Z|0.01 Hz = 5.68 × 10⁵ Ω ⋅ cm2), was slightly lower than that of R-Control. However, the modulus subsequently increased at 72 h (8.92 × 10⁵ Ω ⋅ cm2) and remained at a similar level after 1 week (9.03 × 10⁵ Ω ⋅ cm2), exceeding the corresponding values of R-Control at these later exposure times. This trend indicates that barrier response of R-Ce was maintained, and even improved relative to the initial 24 h response, over the investigated exposure period.
Impedance spectra were fitted using a two-time-constant equivalent electrical circuit (Figure 7), widely accepted for these metal/coating systems [16,32,33,34]. In this model, RS represents the electrolyte resistance; the high-to-mid frequency time constant (Rsg and CPEsg) models the ion conduction resistance and capacitive behaviour of the sol-gel matrix; and the low-frequency time constant (Rtc and CPEdl) reflects the charge transfer resistance and double-layer capacitance at the metal/coating interface. The analysis focused primarily on the coating-related parameters listed in Table 1.
For R-Control, Rsg steadily decreased from 2.8 × 10⁴ Ω ⋅ cm2 to 2.2 × 10⁴ Ω ⋅ cm2 over 1 week, consistent with progressive hydrolytic degradation of the siloxane matrix. This degradation led to increased coating porosity and micro-discontinuities. Correspondingly, CPEsg-T increased while the CPEsg − P exponent decreased, indicating a progressively more non-ideal capacitive response of the coating. This evolution is consistent with increasing heterogeneity and electrolyte interaction within the sol-gel matrix.
Rsg remained substantially higher for R-Ce than R-Control at all exposure times, with differences approaching or exceeding one order of magnitude. The initial rise in Rsg at 72 h (3.3 ± 0.5 × 10⁵ Ω ⋅ cm2) may be attributed to two concurrent effects: matrix swelling due to the hygroscopic nature of the cerium salt, and the localised precipitation of Ce3+ hydroxides/oxides blocking conduction pathways [35]. Although Rsg decreased moderately after 1 week (2.2 × 10⁵ Ω ⋅ cm2), it remained substantially higher than that of R-Control. Furthermore, CPEsg − T for R-Ce consistently decreased over time, while CPEsg − P remained comparatively stable (∼0.78), indicating a different evolution of the coating dielectric response compared with R-Control.
2.7.1. Electrochemical Response of Coatings with an Artificial Defect
To evaluate the electrochemical response of the coatings following artificial damage, EIS measurements were conducted on samples subjected to a controlled scalpel scratch during 24 h of exposure to a 3.5 wt.% NaCl aqueous solution.
As illustrated by the Nyquist and Bode spectra in Figure 8, the introduction of an artificial defect shifts the electrochemical system from a predominantly capacitive dielectric barrier response to an interface- and mass-transport-influenced process. The damaged systems exhibited contrasting behaviours: while R-Control displayed a progressive decrease in the Nyquist arc diameter, reflecting a loss of coating protective performance, damaged R-Ce retained a pronounced diffusion-related response throughout the 24 h exposure period.
To account for the diffusion-related contribution observed in the impedance spectra the data were fitted using the equivalent electrical circuit shown in Figure 9, which incorporates a finite-length Warburg diffusion element (ZW). The corresponding fitted parameters are summarised in Table 2. Additionally, all chi-square values were on the order of 10-4, demonstrating a good fit.
Analysis of Rsg revealed values approximately three orders of magnitude lower in both damaged systems than in the corresponding intact coatings, consistent with localised physical disruption of the sol-gel matrix. Despite this initial loss, the post-damage responses diverge substantially between the two systems. In R-Control, both Rsg and Rtc progressively decreased with exposure time. In particular, Rtc decreased from 3.98 × 10⁵ Ω · cm² at 4 h to 2.57 × 10⁵ Ω · cm² at 24 h, indicating increasing interfacial electrochemical activity. In contrast, R-Ce maintained relatively stable Rsg values and showed a progressive increase in Rtc from 1.16 × 10⁶ to 1.58 × 10⁶ Ω · cm² over the same period, indicating a reduction in interfacial electrochemical activity. This contrasting evolution may reflect the combined contribution of intrinsic Ti repassivation, and an additional inhibitory effect associated with released Ce-containing species. The Warburg-related parameters also differed markedly between the two systems. R-Control exhibited ZW-P values close to 0.44 throughout the exposure period, together with progressive increases in ZW-R from 1.08 × 10⁶ to 2.75 × 10⁶ Ω · cm² and in ZW-T from 3.88 to 9.47 s. In contrast, R-Ce showed lower ZW-P values of approximately 0.36-0.38 and substantially lower ZW-R and ZW-T values. Although ZW-R increased from 1.74 × 10⁴ to 1.47 × 10⁵ Ω · cm² between 4 and 24 h, ZW-T remained very low at 4 and 12 h and increased to 4.09 × 10⁻² s after 24 h. These differences indicate a markedly different and more non-ideal mass-transport response in the Ce-containing system.
Overall, the contrasting Rtc evolution of the two systems supports a more stable interfacial electrochemical response for R-Ce following artificial damage. Together with the independent evidence of Ce release, this behaviour is consistent with a possible additional inhibitory contribution from released Ce-containing species, superimposed on the intrinsic repassivation of the titanium substrate. Nevertheless, the proposed formation of a mixed passivating layer comprising TiO2 and cerium-containing species remains a working hypothesis requiring direct compositional validation via surface-sensitive techniques such as XPS.
R-Ce therefore showed improved retention of electrochemical barrier properties following artificial damage compared with R-Control. However, complete self-healing capability, defined as the full recovery of the original barrier properties, was not achieved under the tested conditions. Extended exposure times and a broader range of Ce3+ concentrations should be investigated to further elucidate these active protection mechanisms.
2.8. Surface Characterisation After EIS
EIS characterisation was correlated with microstructural analysis by SEM (Figure 10) and compositional characterisation by EDS (Figure 11) after 24 h and 1 week of immersion in a 3.5 wt.% NaCl aqueous solution.
For R-Control, SEM analysis after 24 h of immersion revealed the initial degradation of the polysiloxane network, evidenced by fine micropores and localised surface discontinuities. After 1 week, the density and morphology of these defects remained largely unchanged. These observations are consistent with the EIS response, in which the initial development of microporosity was accompanied by a decrease in Rsg after 24 h, followed by relatively stable resistance values after 1 week.
R-Ce also exhibited partial degradation of the sol-gel matrix after 24 h of immersion. However, BSE micrographs revealed the presence of high-contrast particles preferentially located within and around the pores. High-magnification SEM imaging combined with spot EDS analysis (Figure 11) indicated a high content of cerium (67.51 wt.%) and oxygen (31.4 wt.%), confirming that these features corresponded to Ce- and O-rich deposits. Their composition is consistent with the possible formation of cerium oxide- and/or hydroxide-containing species, although their chemical nature cannot be established by EDS alone. The disappearance of the initially observed Ce-rich nodules after electrolyte exposure, together with the appearance of Ce- and O-rich deposits, is consistent with partial dissolution of accessible Ce-containing domains followed by local redistribution and reprecipitation of Ce-containing species during immersion. However, as the same individual regions were not tracked before and after exposure, this dissolution–reprecipitation pathway should be regarded as a proposed mechanism rather than direct evidence. The presence of these deposits may contribute to the electrochemical response observed for R-Ce.
After 1 week, R-Ce retained its overall morphological integrity despite a slight increase in defect density, while the cerium-rich precipitates became less pronounced. The lower local cerium content detected by EDS (Figure 11, Area 2) suggests partial dissolution or leaching of these species into the electrolyte. This interpretation is qualitatively consistent with the data obtained by ICP-MS. Nevertheless, the coating resistance remained approximately one order of magnitude higher than that of the R-Control system.
Another change was observed in coating thickness after exposure to the NaCl solution. The coatings exhibited contrasting behaviour. In R-Control, average thickness decreased by 16% (to 30.34 ± 4.16 µm), indicating moderate hydrolytic degradation. In contrast, in R-Ce, average thickness increased by 27% (to 41.25 ± 3.77 µm), driven by water absorption and matrix swelling. This hydrophilic swelling in R-Ce aligns with the increased surface wettability and the increased intensity of the O-H absorption bands demonstrated in the contact angle and ATR-FTIR analyses.
No areas of macroscopically exposed titanium were detected by SEM under the immersion conditions investigated. Thus, despite evidence of matrix degradation and the development of local surface defects, both sol-gel formulations retained overall morphological continuity throughout the evaluated exposure period.
3. Conclusions
A low-alcohol MPTS sol-gel coating formulated with a nominal Ce3+ loading of 5 wt.% was successfully developed on powder-metallurgy titanium substrates. The coating exhibits increased surface wettability, which promotes matrix hydration and time-dependent cerium leaching, as verified by EDS and ICP-MS. EIS analysis supported a combination of barrier protection and a possible active contribution in the Ce-containing system. Following artificial damage R-Ce showed relatively stable coating resistance and a progressive increase in charge-transfer resistance during saline immersion, in contrast with the decrease observed for R-Control. This behaviour is consistent with reduced interfacial electrochemical activity and may result from the combined effects of intrinsic Ti repassivation and inhibition associated with released Ce-containing species. However, direct evidence of the formation of a protective cerium-containing phase was not obtained within the evaluated exposure period. Overall, this hybrid sol-gel system represents a chromate-free surface-treatment approach aligned with current efforts to replace Cr(VI)-based corrosion inhibitors. Future work should focus on optimising the cerium concentration (exploring loadings both above and below 5 wt.%) and assessing extended immersion behaviour to establish long-term barrier durability and active protection kinetics.
4. Materials and Methods
4.1. Synthesis of Sol-Gel Coatings
Sol-gel coatings were synthesised using (3-mercaptopropyl)trimethoxysilane (MPTS, 95%, Thermo Fisher Scientific, Waltham, MA, USA) as the organosilane precursor. For the undoped reference formulation (designated as R-Control), MPTS was dispersed in ethanol (EtOH, 99.98%, Sigma-Aldrich, St. Louis, MI, USA) at an MPTS:EtOH molar ratio of 1:10 and stirred for 30 min to obtain a homogeneous solution. Hydrolysis was initiated by the dropwise addition of deionised water (H2O, Sigma-Aldrich) at an MPTS:H2O molar ratio of 1:7. The pH of the solution was adjusted to 3.5 using glacial acetic acid (99.7%, Sigma-Aldrich). This formulation corresponds to an ethanol volumetric fraction of 65% of the total synthesis volume, representing a 30% overall solvent reduction and an 87.5% decrease in ethanol per unit of silane precursor compared to previously reported literature [17,19,20]. For the cerium-doped formulation (designated as R-Ce), cerium (III) nitrate hexahydrate (Ce(NO3)3·6H2O, Sigma-Aldrich) was dissolved in the required volume of deionised water. The amount of precursor was calculated to provide a nominal Ce3+ content of 5 wt.% relative to the total mass of the sol mixture. This solution was added dropwise to the MPTS/EtOH mixture, and the pH was adjusted to 3.5, as previously described. Both formulations were stirred continuously at 450 rpm inside a glovebox for 2.5 h at room temperature prior to coating deposition.
Commercially pure titanium (cp-Ti) substrates with a diameter of 15.0 ± 1.0 mm and a thickness of 2.5 ± 0.5 mm were fabricated via powder metallurgy, as previously described by Bolzoni et al. [21]. Prior to coating deposition, the substrate surfaces were ground using silicon carbide papers of increasing grit size from 320 to 1200. To ensure a grease- and dust-free surface, the ground samples were cleaned sequentially in an ultrasonic bath with ethanol and acetone for 5 min each, rinsed thoroughly with distilled water and dried under a stream of compressed air.
Coatings were applied via dip-coating, at immersion and withdrawal speeds of 50 mm/s. Following deposition, coated samples were dried in an oven at 70 ͦC for 1 h.
4.2. Surface and Morphological Characterisation
The surface morphology and chemical homogeneity of the coatings were examined using an FEI Teneo scanning electron microscope (SEM; FEI Company, Hillsboro, OR, USA), equipped with a tungsten filament. To prevent electrical charging caused by the dielectric nature of the coatings, conductive double-sided copper tape was applied to the edges of the substrates prior to analysis. Surface imaging was performed at a low accelerating voltage of 2 kV and a beam current of 0.2 nA. Elemental composition was determined via energy-dispersive X-ray spectroscopy (EDS) operated at an accelerating voltage of 10 kV using an Octane Plus detector (active area of 30 mm2). Additionally, the surface integrity and degradation of the coatings were evaluated following 24 h and 1 week of exposure to the electrolyte (3.5 wt.% NaCl aqueous solution) to complement the electrochemical characterisation.
Coating thickness was determined on both as-deposited samples and those subjected to 1 week of electrolyte immersion. Following immersion, samples were briefly rinsed with deionized water to remove residual salt deposits and gently dried with compressed air to eliminate superficial moisture. Measurements were taken using a coating thickness gauge (PCE-CT 27FN, PCE Instruments, Meschede, Germany) at five randomly selected locations on two independent samples prepared under identical conditions (n = 10 measurements per formulation).
The interfacial adhesion between the sol-gel coatings and the titanium substrate was qualitatively evaluated via a cross-cut tape test adapted from ASTM D3359 (Standard Test Methods for Measuring Adhesion by Tape Test, Test Method B, Cross-cut Tape Test) [22]. The standard testing protocol was modified to accommodate the reduced dimensions of the substrates. Micrographs of the resulting cuts were taken using an Olympus GX71 optical microscope (Olympus Corporation, Tokyo, Japan). All evaluations were performed in triplicate.
Surface wettability was evaluated via static contact angle measurements using the sessile drop method on an OCA 20 Contact Angle System (DataPhysics Instruments GmbH, Filderstadt, Germany). Prior to testing, sample surfaces were cleaned under a stream of compressed air. A 3.5 wt.% NaCl aqueous solution was employed as the probe liquid. Droplets of 3 µL were deposited onto the surface at a controlled dispensing rate of 1 µL/s at room temperature. Image analysis and contact angle calculations were carried out using SCA20 software. All measurements were conducted in triplicate on three independent samples.
4.3. Chemical Characterisation
The chemical structure and functional groups of the synthesised xerogels were analysed via Fourier-transform infrared spectroscopy (FTIR) using a Thermo Scientific Nicolet iS50 FTIR spectrometer equipped with an attenuated total reflectance (ATR) accessory (GladiATR, Pike Technologies, Madison, WI, USA). Spectra were recorded at room temperature in absorbance mode across the mid-infrared range (4000-400 cm-1) with a spectral resolution of 4 cm-1. All measurements were performed in triplicate.
4.4. Cerium Release Kinetics
The release kinetics of cerium species from R-Ce coatings were evaluated by immersing three individual specimens in 3.5 mL of a 3.5 wt.% NaCl aqueous solution under controlled temperature. At scheduled timepoints (24 h, 72 h, and 1 week), 3.0 mL aliquots were withdrawn for analysis and immediately replenished with an equal volume of fresh solution to restore the initial solution volume and maintain sink-like conditions.
Cerium concentrations were quantified via inductively coupled plasma mass spectrometry (ICP-MS), using a Bruker Aurora Elite spectrometer (Bruker, Billerica, MA, USA) equipped with a collision cell. The 140Ce isotope was monitored using 115In as an internal standard.
Cumulative Ce release was corrected for the Ce removed at each sampling step. The cumulative released mass at each time point was calculated as , where Cn is the Ce concentration measured at the current sampling point, Vt is the total immersion volume (3.5 mL), Vs is the sampled volume (3.0 mL), and represents the concentrations measured at all preceding sampling points.
4.5. Electrochemical Analysis
The corrosion behaviour and hydrolytic degradation of R-Control and R-Ce coatings were evaluated via Electrochemical Impedance Spectroscopy (EIS), using a Metrohm Autolab PGSTAT302N potentiostat (Metrohm, Herisau, Switzerland) in a 3.5 wt.% NaCl aqueous solution. To ensure reliable electrical contact, the reverse face of each sample was ground to remove the coating and attached to a copper strip. A conventional three-electrode set-up was employed, consisting of the coated sample as the working electrode (exposed area = 0.85 cm2), a saturated Ag/AgCl/KCl electrode (E = 0.197 V vs. NHE) as the reference electrode, and a platinum counter electrode.
Impedance measurements were acquired over a frequency range of 10 mHz to 10 kHz, with 10 points per decade, using a sinusoidal AC amplitude of ±10 mV. The open circuit potential (OCP) was measured before and after each frequency sweep.
Two different testing protocols were conducted: intact coatings were evaluated after 24 h, 72 h, and 1 week of continuous electrolyte immersion, whereas artificially defective coatings (featuring a controlled linear scratch (~0.5 cm in length) made with a scalpel to expose the titanium substrate) were analysed every 2 h over a 24 h period.
All tests were performed in triplicate. Data acquisition and equivalent circuit fitting were carried out using Nova v2.1.4 (Metrohm AG) and ZView v4.1b (Scribner Associates, Charlottesville, VA, USA), respectively. Graphical representations were made using OriginPro 9.5 software (OriginLab, Northampton, MA, USA).
Author Contributions
Conceptualization, B.T. and A.J.-M.; Methodology, B.T. and A.J.-M.; Validation, O.V.-V., B.T., A.T.-C. and A.J.-M.; Formal Analysis, B.T., O.V.-V. and A.J.-M.; Investigation, O.V.-V. and A.T.-C.; Resources, A.J.-M.; Data Curation, O.V.-V. and A.T.-C.; Writing – Original Draft Preparation, O.V.-V. and A.T.-C.; Writing – Review & Editing, B.T., O.V.-V. and A.J.-M.; Visualization, O.V.-V. and A.T.-C.; Supervision, B.T. and A.J.-M.; Project Administration, A.J.-M.; Funding Acquisition, A.J.-M. All authors have read and agreed to the published version of the manuscript.
Funding
Olena Velyt-Vepryk acknowledges support from Universidad Carlos III de Madrid through a predoctoral research contract awarded under the PIPF programme (call reference: PIPF UC3M 01-2425).
Data Availability Statement
The data supporting the findings of this study are available from the corresponding author upon reasonable request.
Acknowledgments
The authors thank Dr. Cristina Moral Gil for her technical assistance with scanning electron microscopy (SEM). The authors also acknowledge the support of the R&D&I project PID2023-148002OB-I00, funded by MICIU/AEI/10.13039/501100011033 and by ERDF/EU. The authors acknowledge the use of Gemini and ChatGPT () during the preparation and revision of this manuscript to assist with language translation, proofreading, text organization, and stylistic refinement. All output was critically reviewed and revised by the authors, who assume full responsibility for the contents and final version of this work.
Conflicts of Interest
The authors declare no conflict of interest. The sponsors had no role in the design, execution, interpretation, or writing of the study, or in the decision to publish the results.
References
- Iannuzzi, M.; Frankel, G. S. The carbon footprint of steel corrosion. npj Mater. Degrad. 2022, vol. 6(no. 1), 101. [Google Scholar] [CrossRef]
- Koch, G. Cost of corrosion. Trends Oil Gas. Corros. Res. Technol. Prod. Transm. 2017, 3–30. [Google Scholar] [CrossRef]
- Makhlouf, S. H. Current and advanced coating technologies for industrial applications. Nanocoatings Ultra-Thin Films Technol. Appl. 2011, 3–23. [Google Scholar] [CrossRef]
- Alvarez, C.; Bravo Gómez, M. E.; Hernández Zavala, A. Hexavalent chromium: Regulation and health effects. J. Trace Elem. Med. Biol. 2021, vol. 65, 126729. [Google Scholar] [CrossRef]
- Hredoy, R. H.; et al. Regulations and Policies for Chromium Emissions to the Environment. Chromium Toxic. Chall. Solut. 2026, 73–101. [Google Scholar] [CrossRef]
- Figueira, R. B. Hybrid Sol–gel Coatings for Corrosion Mitigation: A Critical Review. Polymers 2020, vol. 12(no. 3), 689. [Google Scholar] [CrossRef]
- Tranquillo, E.; Bollino, F. Surface modifications for implants lifetime extension: An overview of sol-gel coatings; MDPI AG, 2020. [Google Scholar] [CrossRef]
- Indumathy, B.; Sathiyanathan, P.; Prasad, G.; Reza, M. S.; Prabu, A. A.; Kim, H. A Comprehensive Review on Processing, Development and Applications of Organofunctional Silanes and Silane-Based Hyperbranched Polymers. Polymers 2023, Vol. 15, Page 2517, vol. 15(no. 11), 2517, May 2023. [Google Scholar] [CrossRef]
- Paul, S.; Kaushik, A. K.; Jain, A.; Banerjee, S. Intelligent Self-Healing Polymeric Systems for Functional and Durable Coatings. Chem. Asian J. 2026, vol. 21(no. 1). [Google Scholar] [CrossRef]
- Wang, J.; Seidi, F.; Liu, Y.; Huang, Y.; Xiao, H. Stimuli-Responsive Intelligent Coatings With Nano/Microcarriers for Early Corrosion Sensing: Advances and Challenges. Small 2026, vol. 22(no. 37), e73901. [Google Scholar] [CrossRef]
- Alamiery; Shaker, L. M. Smart and green corrosion inhibitors: Mechanisms, computational tools, and sustainable protection strategies. Mater. Chem. Phys. 2026, vol. 348, 131639. [Google Scholar] [CrossRef]
- Das; Rajendrachari, S.; Das, A.; Rajendrachari, S. Corrosion Mechanisms and Protective Strategies in Aluminum Alloys. In Aluminium Alloys - Synthesis, Properties, and Applications [Working Title]; Jan 2026. [Google Scholar] [CrossRef]
- Büyükgenç, Ö. Review of the Effects of Rare Earth Element Additions to Magnesium Alloys on Biocompatibility: An Evaluation from Mechanical, Corrosion, and Biological Perspectives. Int. J. Met. 2026, 2026, 1–30. [Google Scholar] [CrossRef]
- Garcia-Galvan, F. R.; et al. Development of Green Conversion Sol-Gel Coatings for Corrosion Protection of AZ61 Magnesium Alloy. ECS Meet. Abstr. 2025, vol. MA2024-02(no. 13), 1571–1571. [Google Scholar] [CrossRef]
- Wang, T.; Qian, H.; Xu, P.; Tang, S.; Zhang, B.; Meng, G. Protection and mechanism of cerium chemical conversion film against copper corrosion in solution containing sulfate-reducing bacteria. J. Rare Earths 2026, vol. 44(no. 8), 2486–2500. [Google Scholar] [CrossRef]
- Alcantara-Garcia; Garcia-Casas, A.; Jimenez-Morales, A. Electrochemical study of the synergic effect of phosphorus and cerium additions on a sol-gel coating for Titanium manufactured by powder metallurgy. Prog. Org. Coat. 2018, vol. 124, 267–274. [Google Scholar] [CrossRef]
- Fan, H. Q.; Shi, D. D.; Ding, M. M.; Li, M. C.; Cheng, Y. F.; Li, Q. Preparation of (3-mercaptopropyl)trimethoxylsilane film on brass and its corrosion resistance in natural seawater. Prog. Org. Coat. 2020, vol. 138, 105392. [Google Scholar] [CrossRef]
- Li, Q.; Liu, X.; Wang, W. Controlled Design and Mechanism of Highly Protective Performance for Copper Surface by Electrolysis Technique. Langmuir 2025, vol. 41(no. 51), 34583–34594. [Google Scholar] [CrossRef]
- Monticelli; Zanotto, F.; Grassi, V.; Seyedi, M.; Balbo, A. Improving the Protectiveness of 3-Mercaptopropyl-Trimethoxysilane Coatings on Bronze by Addition of Oxidic Nano- and Microparticles. Coatings 2020, Vol. 10, Page 225, vol. 10(no. 3), 225. [Google Scholar] [CrossRef]
- Scott, F.; Gray-Munro, J. E.; Shepherd, J. L. Influence of coating bath chemistry on the deposition of 3-mercaptopropyl trimethoxysilane films deposited on magnesium alloy. J. Colloid Interface Sci. 2009, vol. 343, 474–483. [Google Scholar] [CrossRef]
- Bolzoni, L.; Ruiz-Navas, E. M.; Gordo, E. Powder metallurgy CP-Ti performances: Hydride–dehydride vs. sponge. Mater. Des. 2014, vol. 60, 226–232. [Google Scholar] [CrossRef]
- W.C. ASTM International. ASTM D3359-02, Standard Test Methods for Measuring Adhesion by Tape Test. Dec 2010. [CrossRef]
- Lu, S.; Shao, J.; Wu, F. Industrial applications of sol–gel derived coatings. J. Solgel Sci. Technol. 2022, vol. 114(no. 1), 1. [Google Scholar] [CrossRef]
- Lakshmi, R.; Aruna, S.; Sampath, S. “Sol-gel based organic-inorganic hybrid coatings for corrosion protection of aerospace aluminium alloy,” 2021. Available online: https://api.semanticscholar.org/CorpusID:276108112 (accessed on Sep. 14 2026).
- Kim, M. T. Deposition behavior of hexamethydisiloxane films based on the FTIR analysis of Si–O–Si and Si–CH3 bonds. Thin Solid Films 1997, vol. 311(no. 1–2), 157–163. [Google Scholar] [CrossRef]
- Li, Y. S.; Wang, Y.; Tran, T.; Perkins, A. Vibrational spectroscopic studies of (3-mercaptopropyl)trimethoxylsilane sol–gel and its coating. Spectrochim. Acta A Mol. Biomol. Spectrosc. 2005, vol. 61(no. 13–14), 3032–3037. [Google Scholar] [CrossRef]
- Kotov, N.; Keskitalo, M. M.; Johnson, C. M. Nano FTIR spectroscopy of liquid water in the –OH stretching region. Spectrochim. Acta A Mol. Biomol. Spectrosc. 2025, vol. 330, 125640. [Google Scholar] [CrossRef]
- Wattanathana, W.; et al. Crystallographic and spectroscopic investigations on oxidative coordination in the heteroleptic mononuclear complex of cerium and benzoxazine dimer. Molecules 2021, vol. 26(no. 17). [Google Scholar] [CrossRef]
- Toirac, et al. Electrochemical characterization of coatings for local prevention of Candida infections on titanium-based biomaterials. Prog. Org. Coat. 2020, vol. 146. [Google Scholar] [CrossRef]
- Jiménez-Morales, et al. Bilayer sol-gel system for local prevention in prosthetic joint infections and osteointegration improvement. Commun. Mater. 2025, 2025 6:1, vol. 6(no. 1), 67. [Google Scholar] [CrossRef]
- Carbonell, J.; García-Casas, A.; Izquierdo, J.; Souto, R. M.; Galván, J. C.; Jiménez-Morales, A. Scanning electrochemical microscopy characterization of sol-gel coatings applied on AA2024-T3 substrate for corrosion protection. Corros. Sci. 2016, vol. 111, 625–636. [Google Scholar] [CrossRef]
- Valero-Gómez, et al. Microencapsulation of cerium and its application in sol-gel coatings for the corrosion protection of aluminum alloy AA2024. J. Solgel Sci. Technol. 2020, vol. 93, 36–51. [Google Scholar] [CrossRef]
- Blanco, G.; Bautista, A.; Takenouti, H. EIS study of passivation of austenitic and duplex stainless steels reinforcements in simulated pore solutions. Cem. Concr. Compos. 2006, vol. 28(no. 3), 212–219. [Google Scholar] [CrossRef]
- Rosero-Navarro, N. C.; Pellice, S. A.; Durán, A.; Aparicio, M. Effects of Ce-containing sol–gel coatings reinforced with SiO2 nanoparticles on the protection of AA2024. Corros. Sci. 2008, vol. 50(no. 5), 1283–1291. [Google Scholar] [CrossRef]
- Alcantara-Garcia; Garcia-Casas, A.; Jimenez-Morales, A. The effect of the organosilane content on the barrier features of sol-gel anticorrosive coatings applied on carbon steel. Prog. Org. Coat. 2020, vol. 139, 105418. [Google Scholar] [CrossRef]
Figure 1.
Representative SE (left) and BSE (right) SEM images of R-Control and R-Ce coatings.
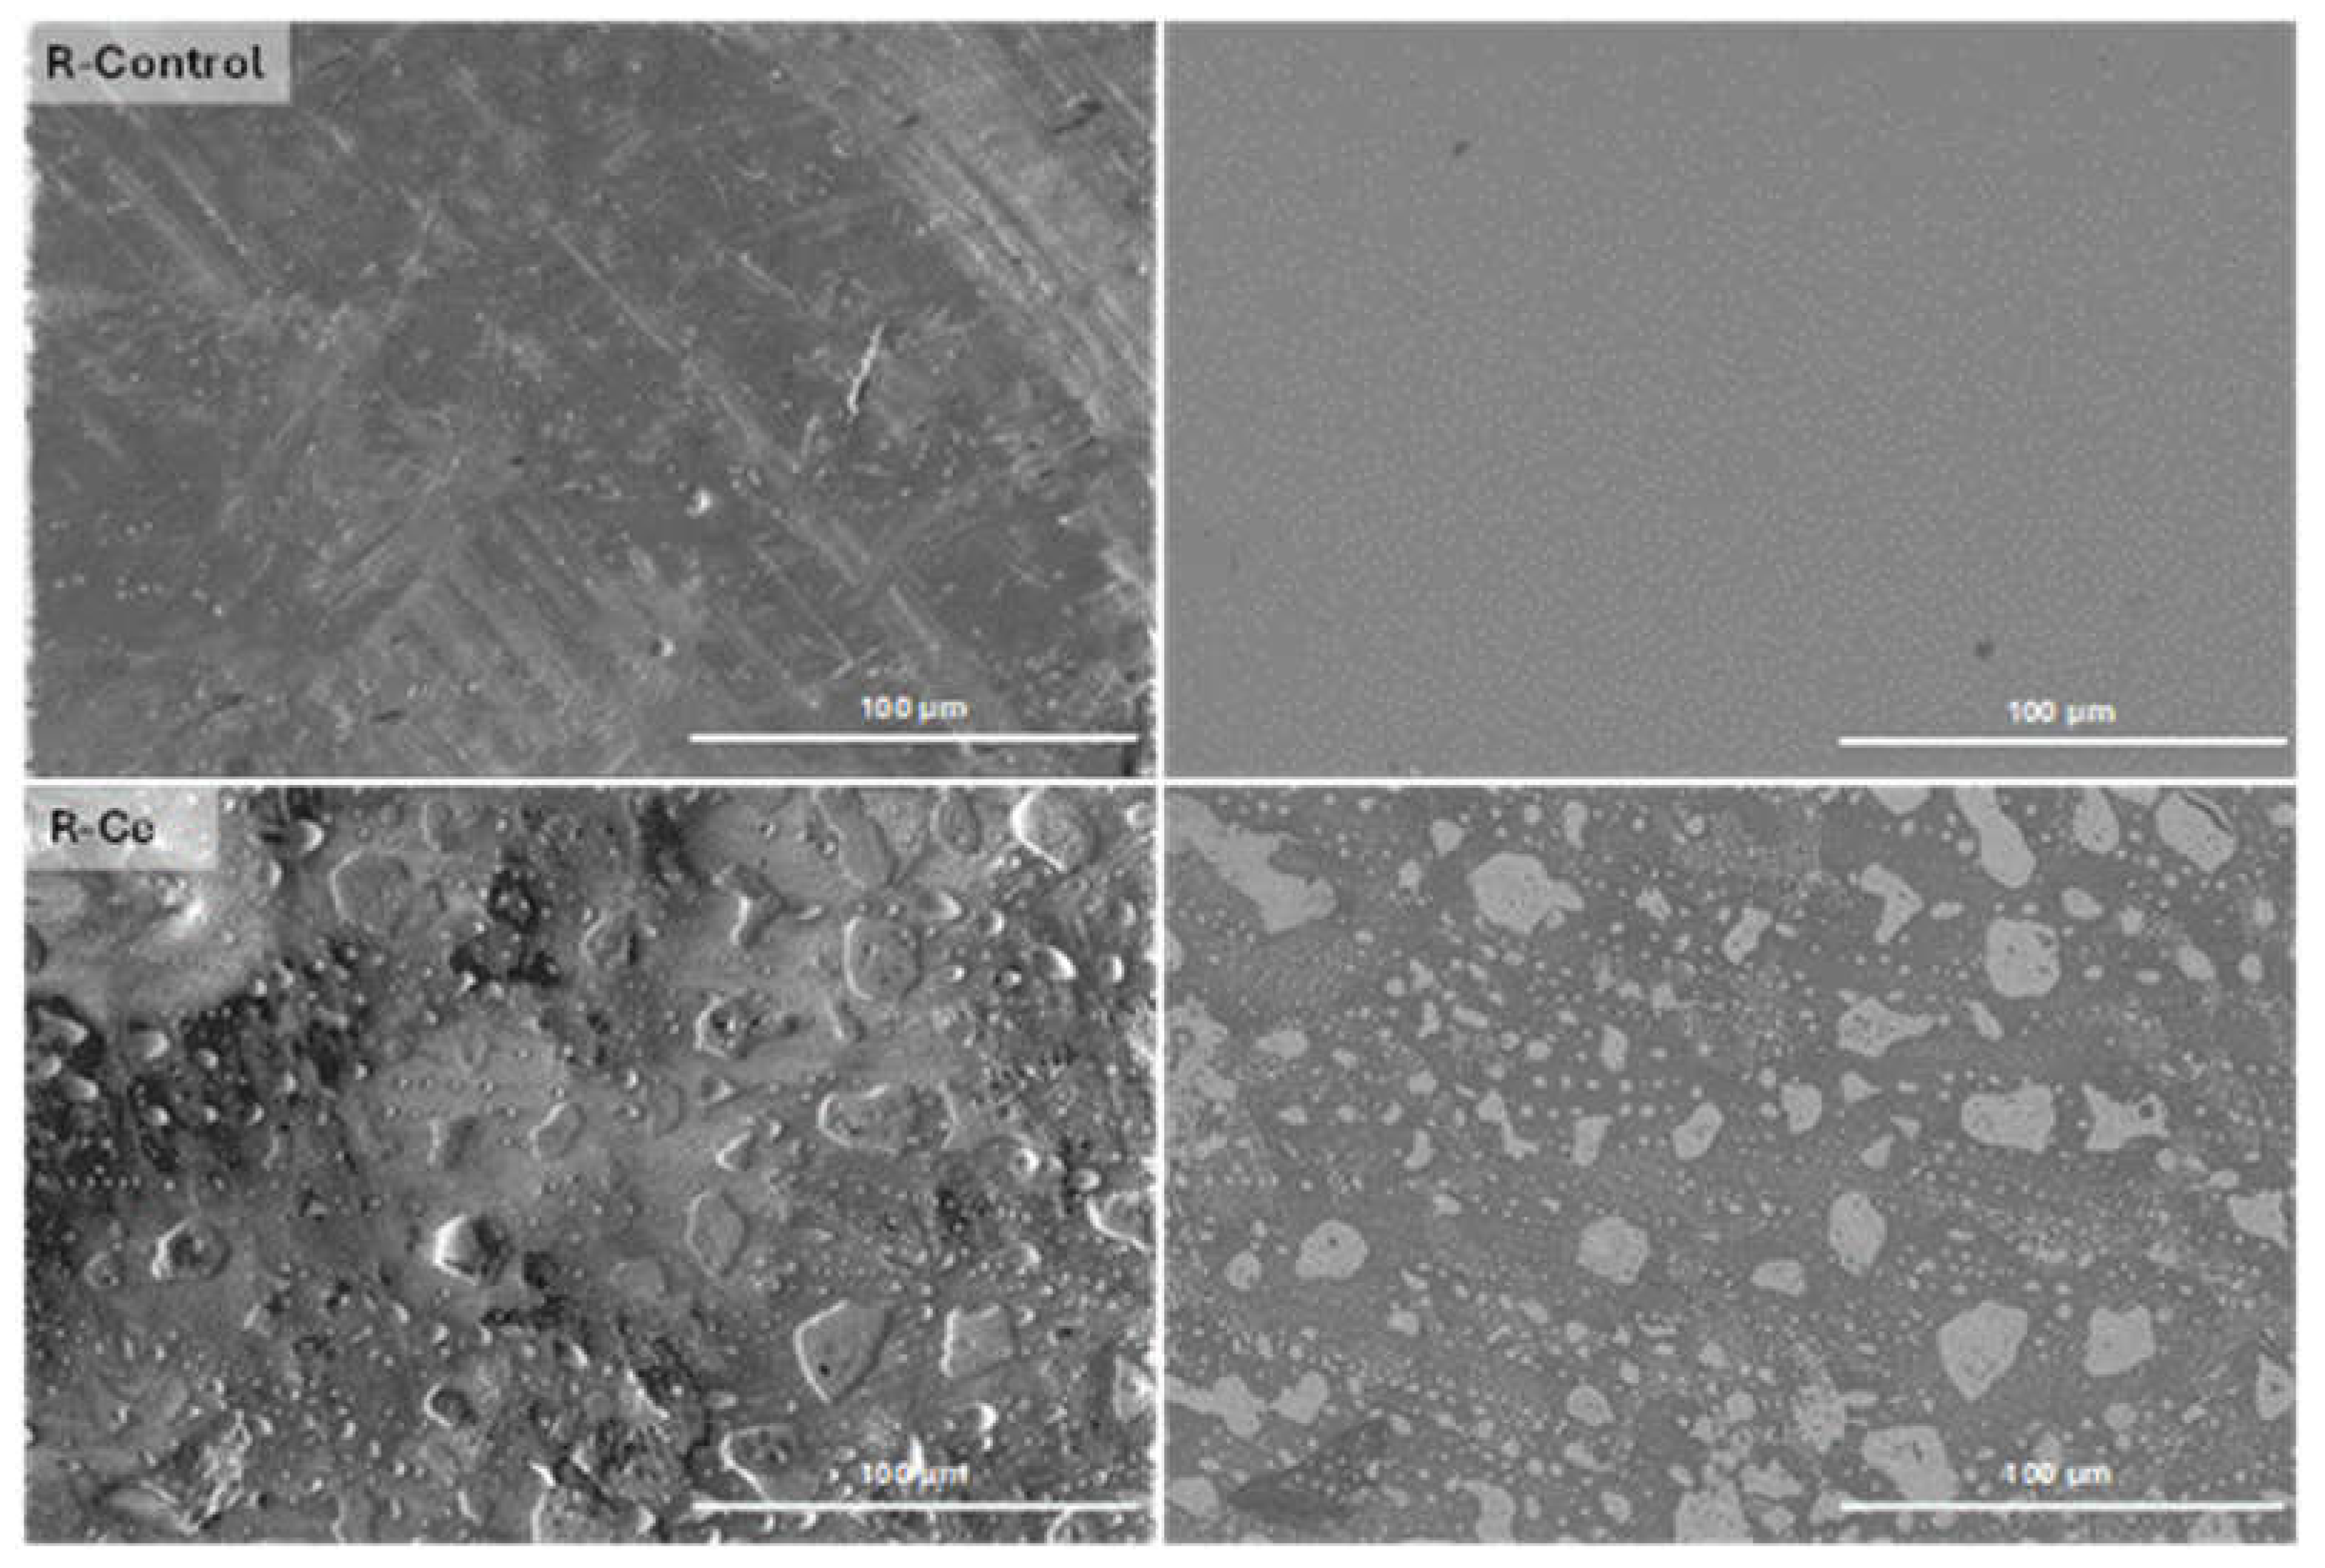
Figure 2.
Surface morphology via BSE-SEM (left) and elemental composition via EDS (right) of marked regions on R-Control and R-Ce.
Figure 2.
Surface morphology via BSE-SEM (left) and elemental composition via EDS (right) of marked regions on R-Control and R-Ce.
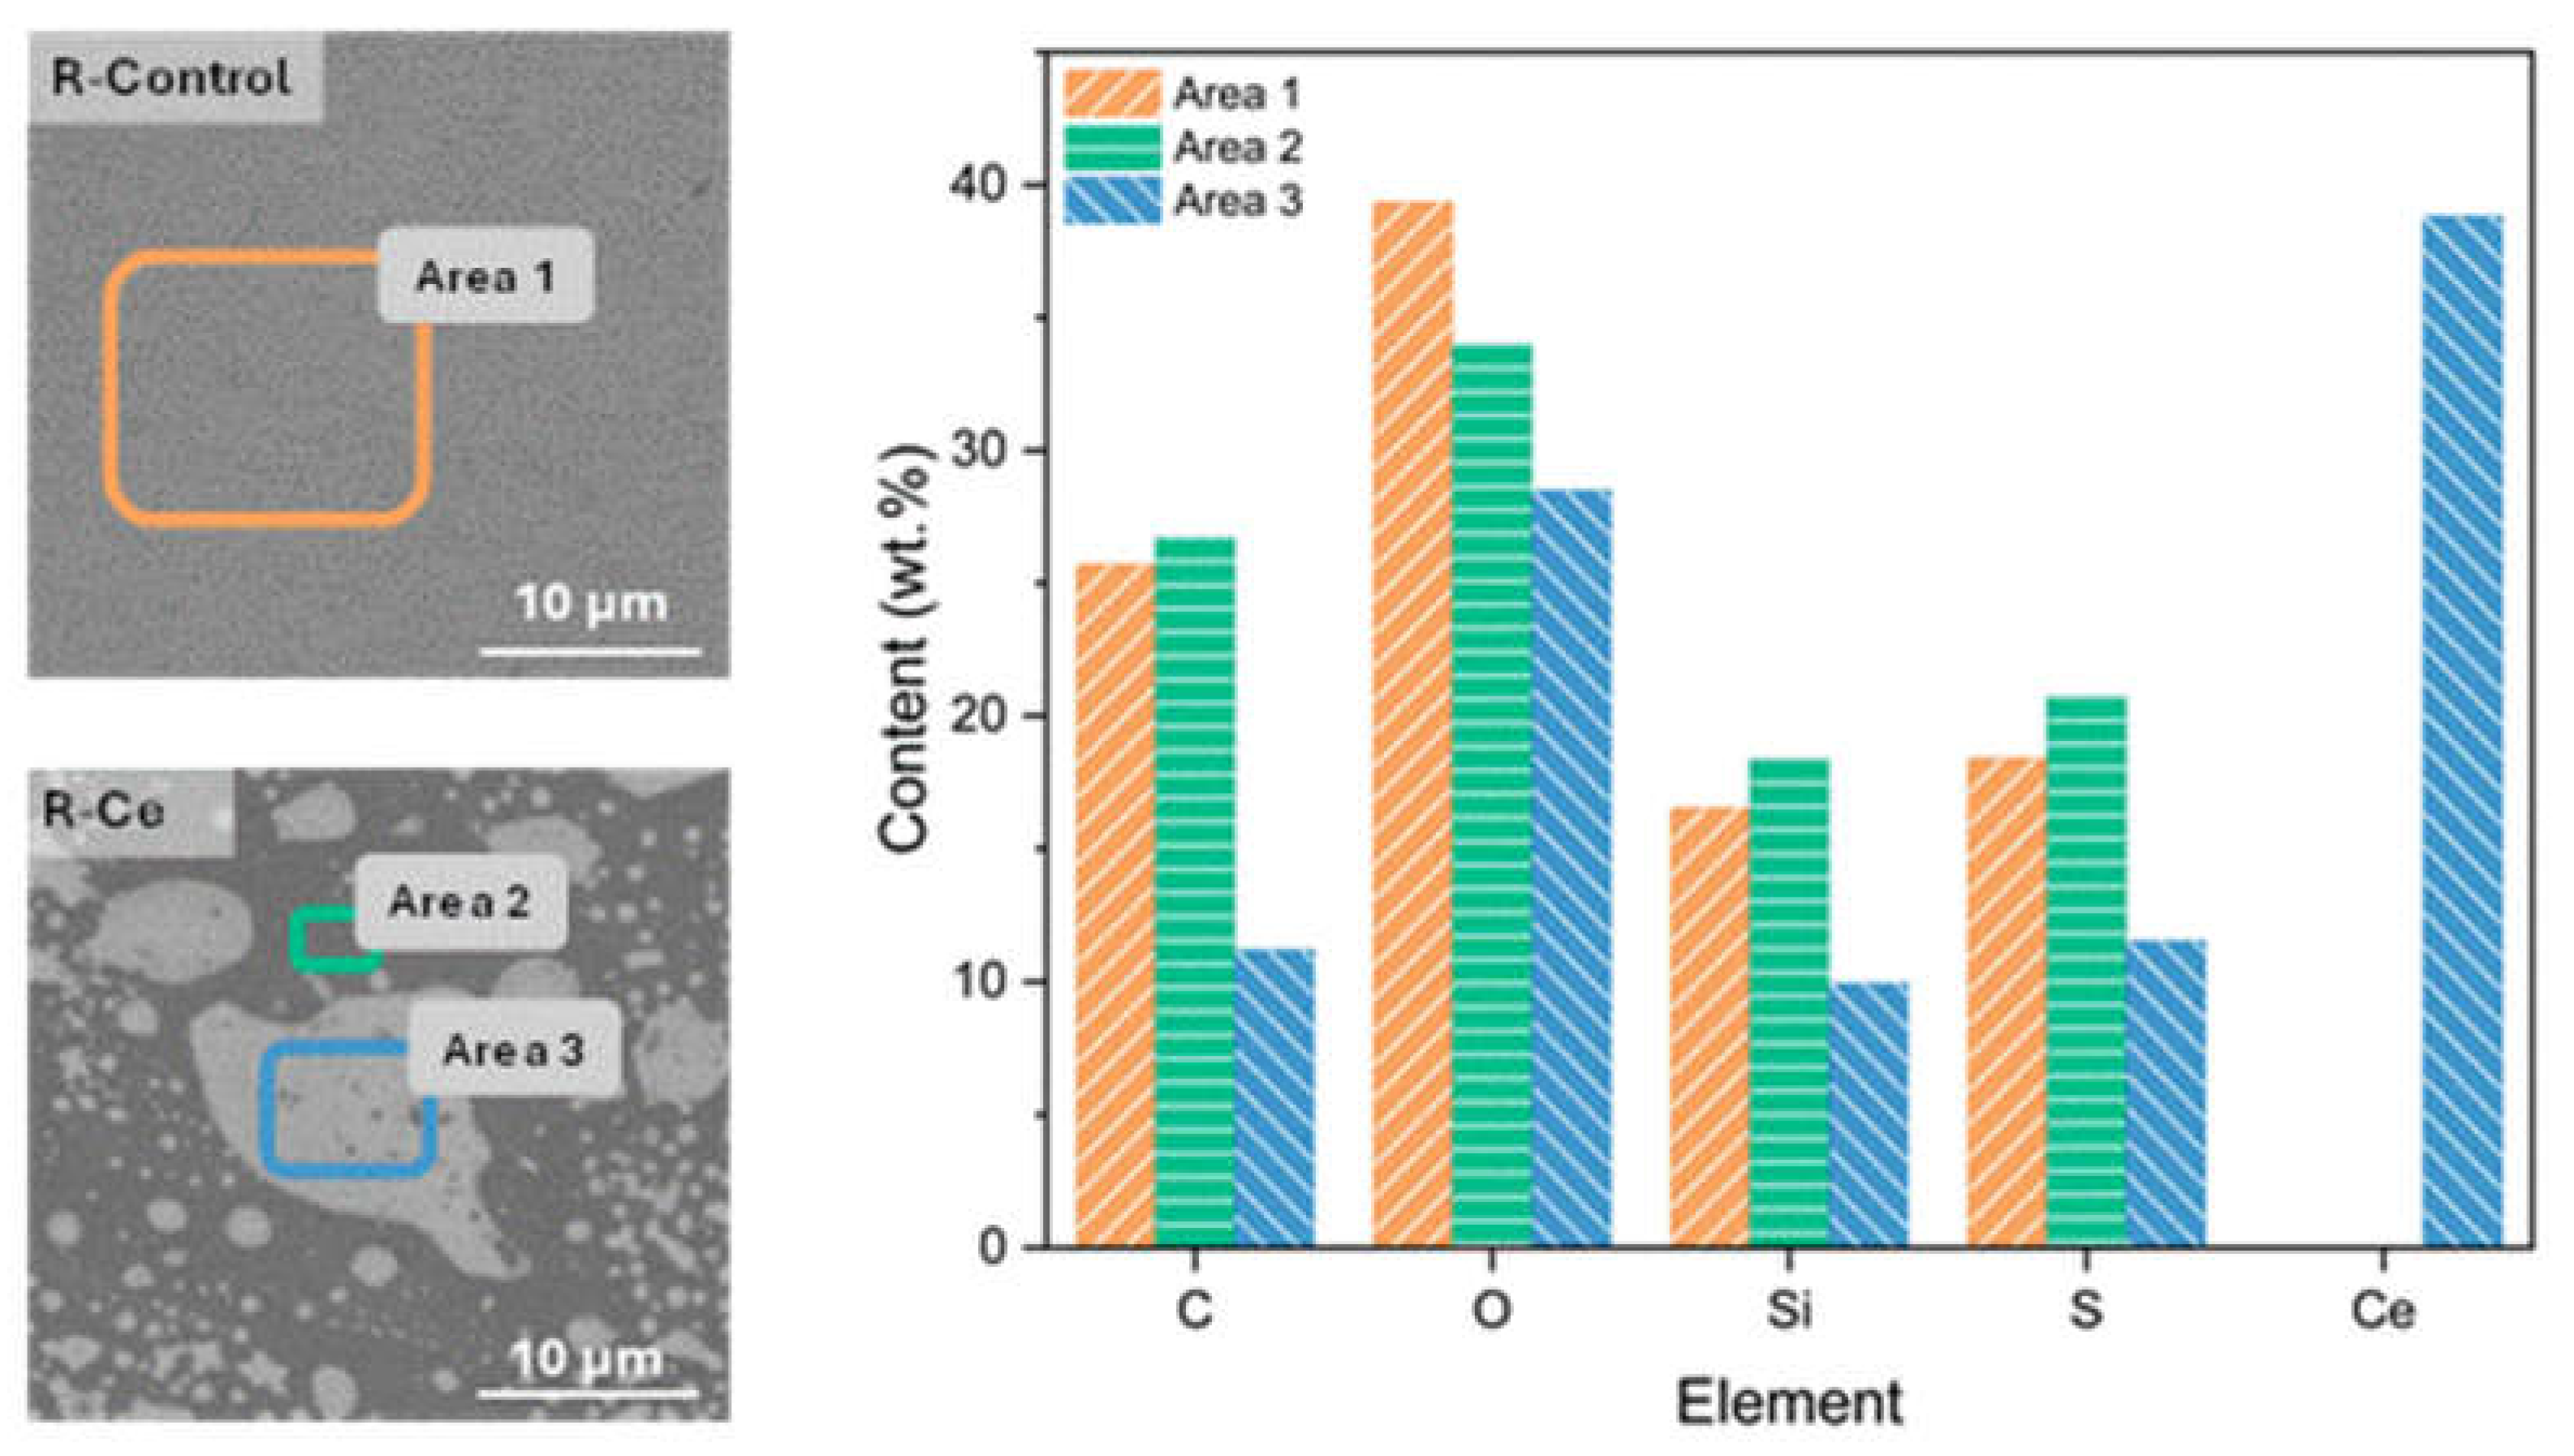
Figure 3.
Optical microscope images of the coatings after the cross-cutting test taken at 20x magnification.
Figure 3.
Optical microscope images of the coatings after the cross-cutting test taken at 20x magnification.
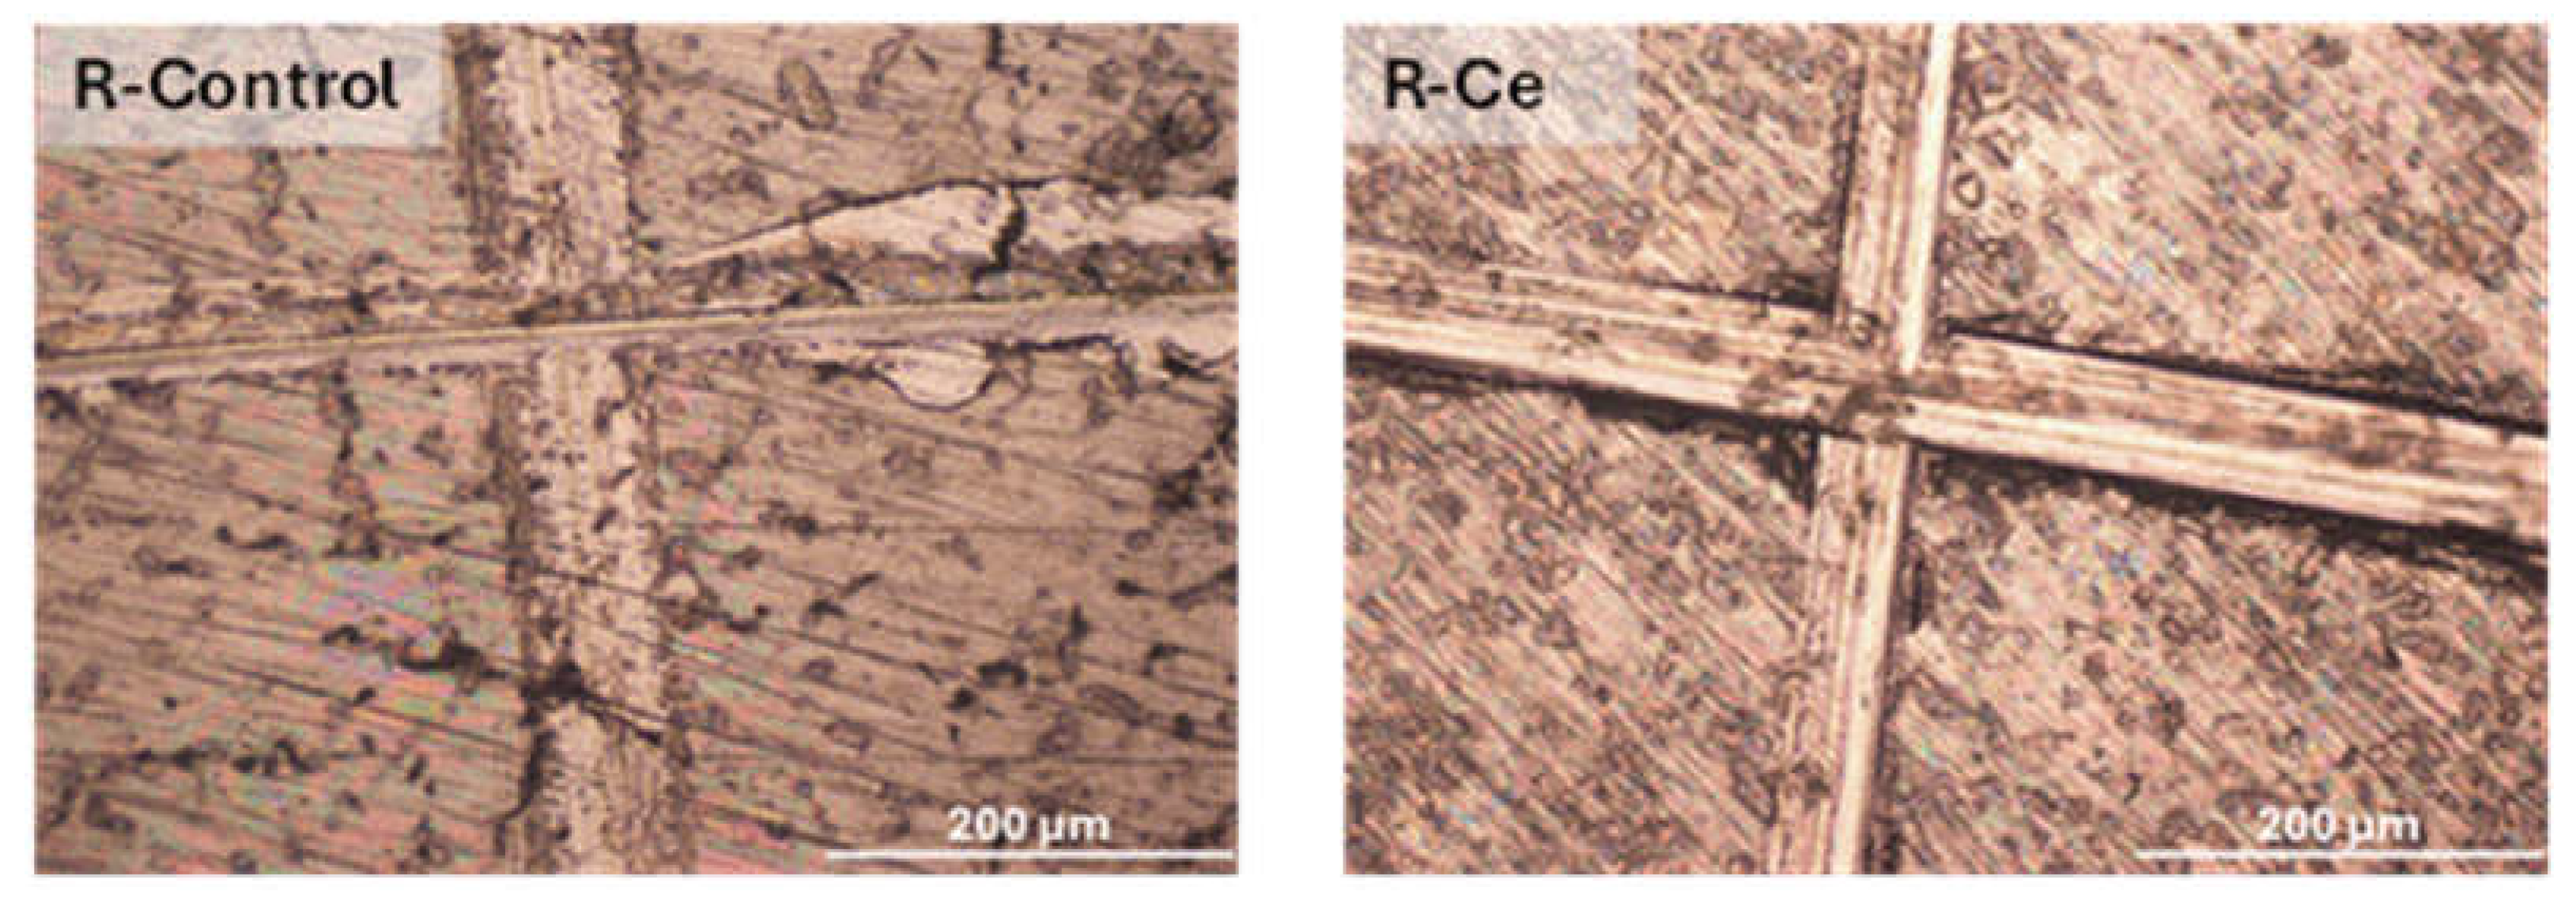
Figure 4.
ATR-FTIR spectra of the control and Ce-doped xerogels.
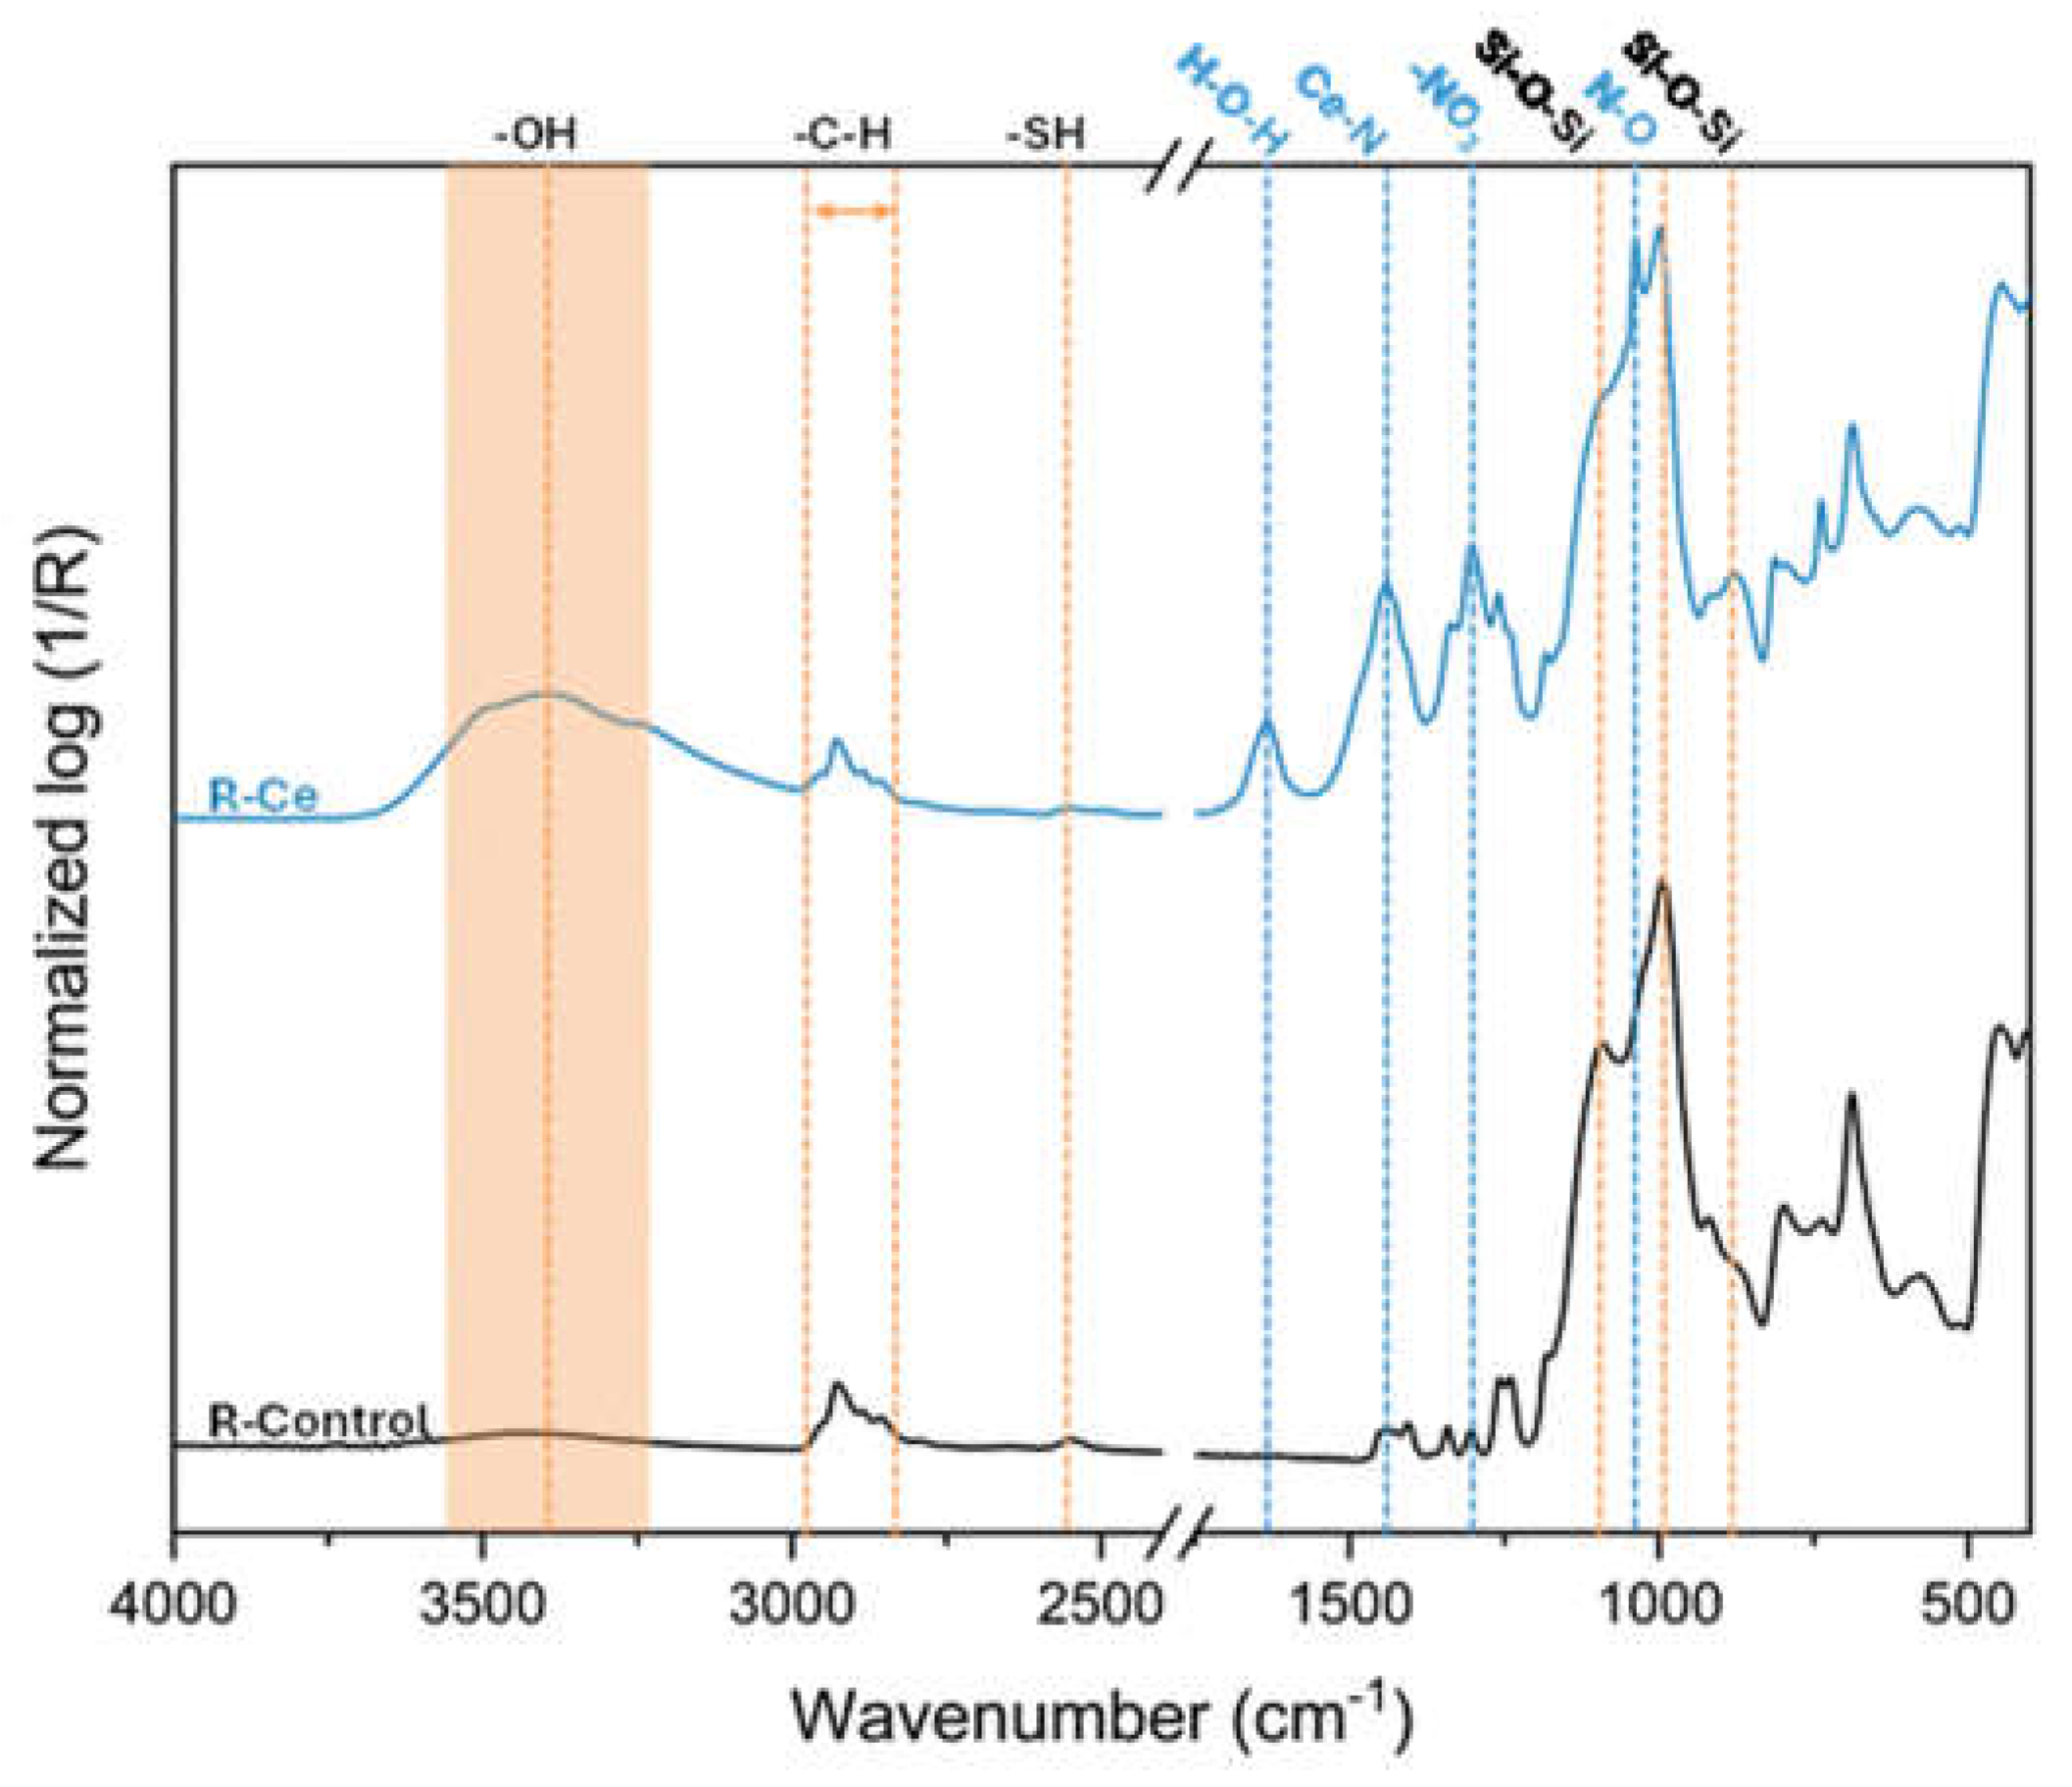
Figure 5.
Cumulative Ce release kinetics from R-Ce coatings as a function of immersion time.
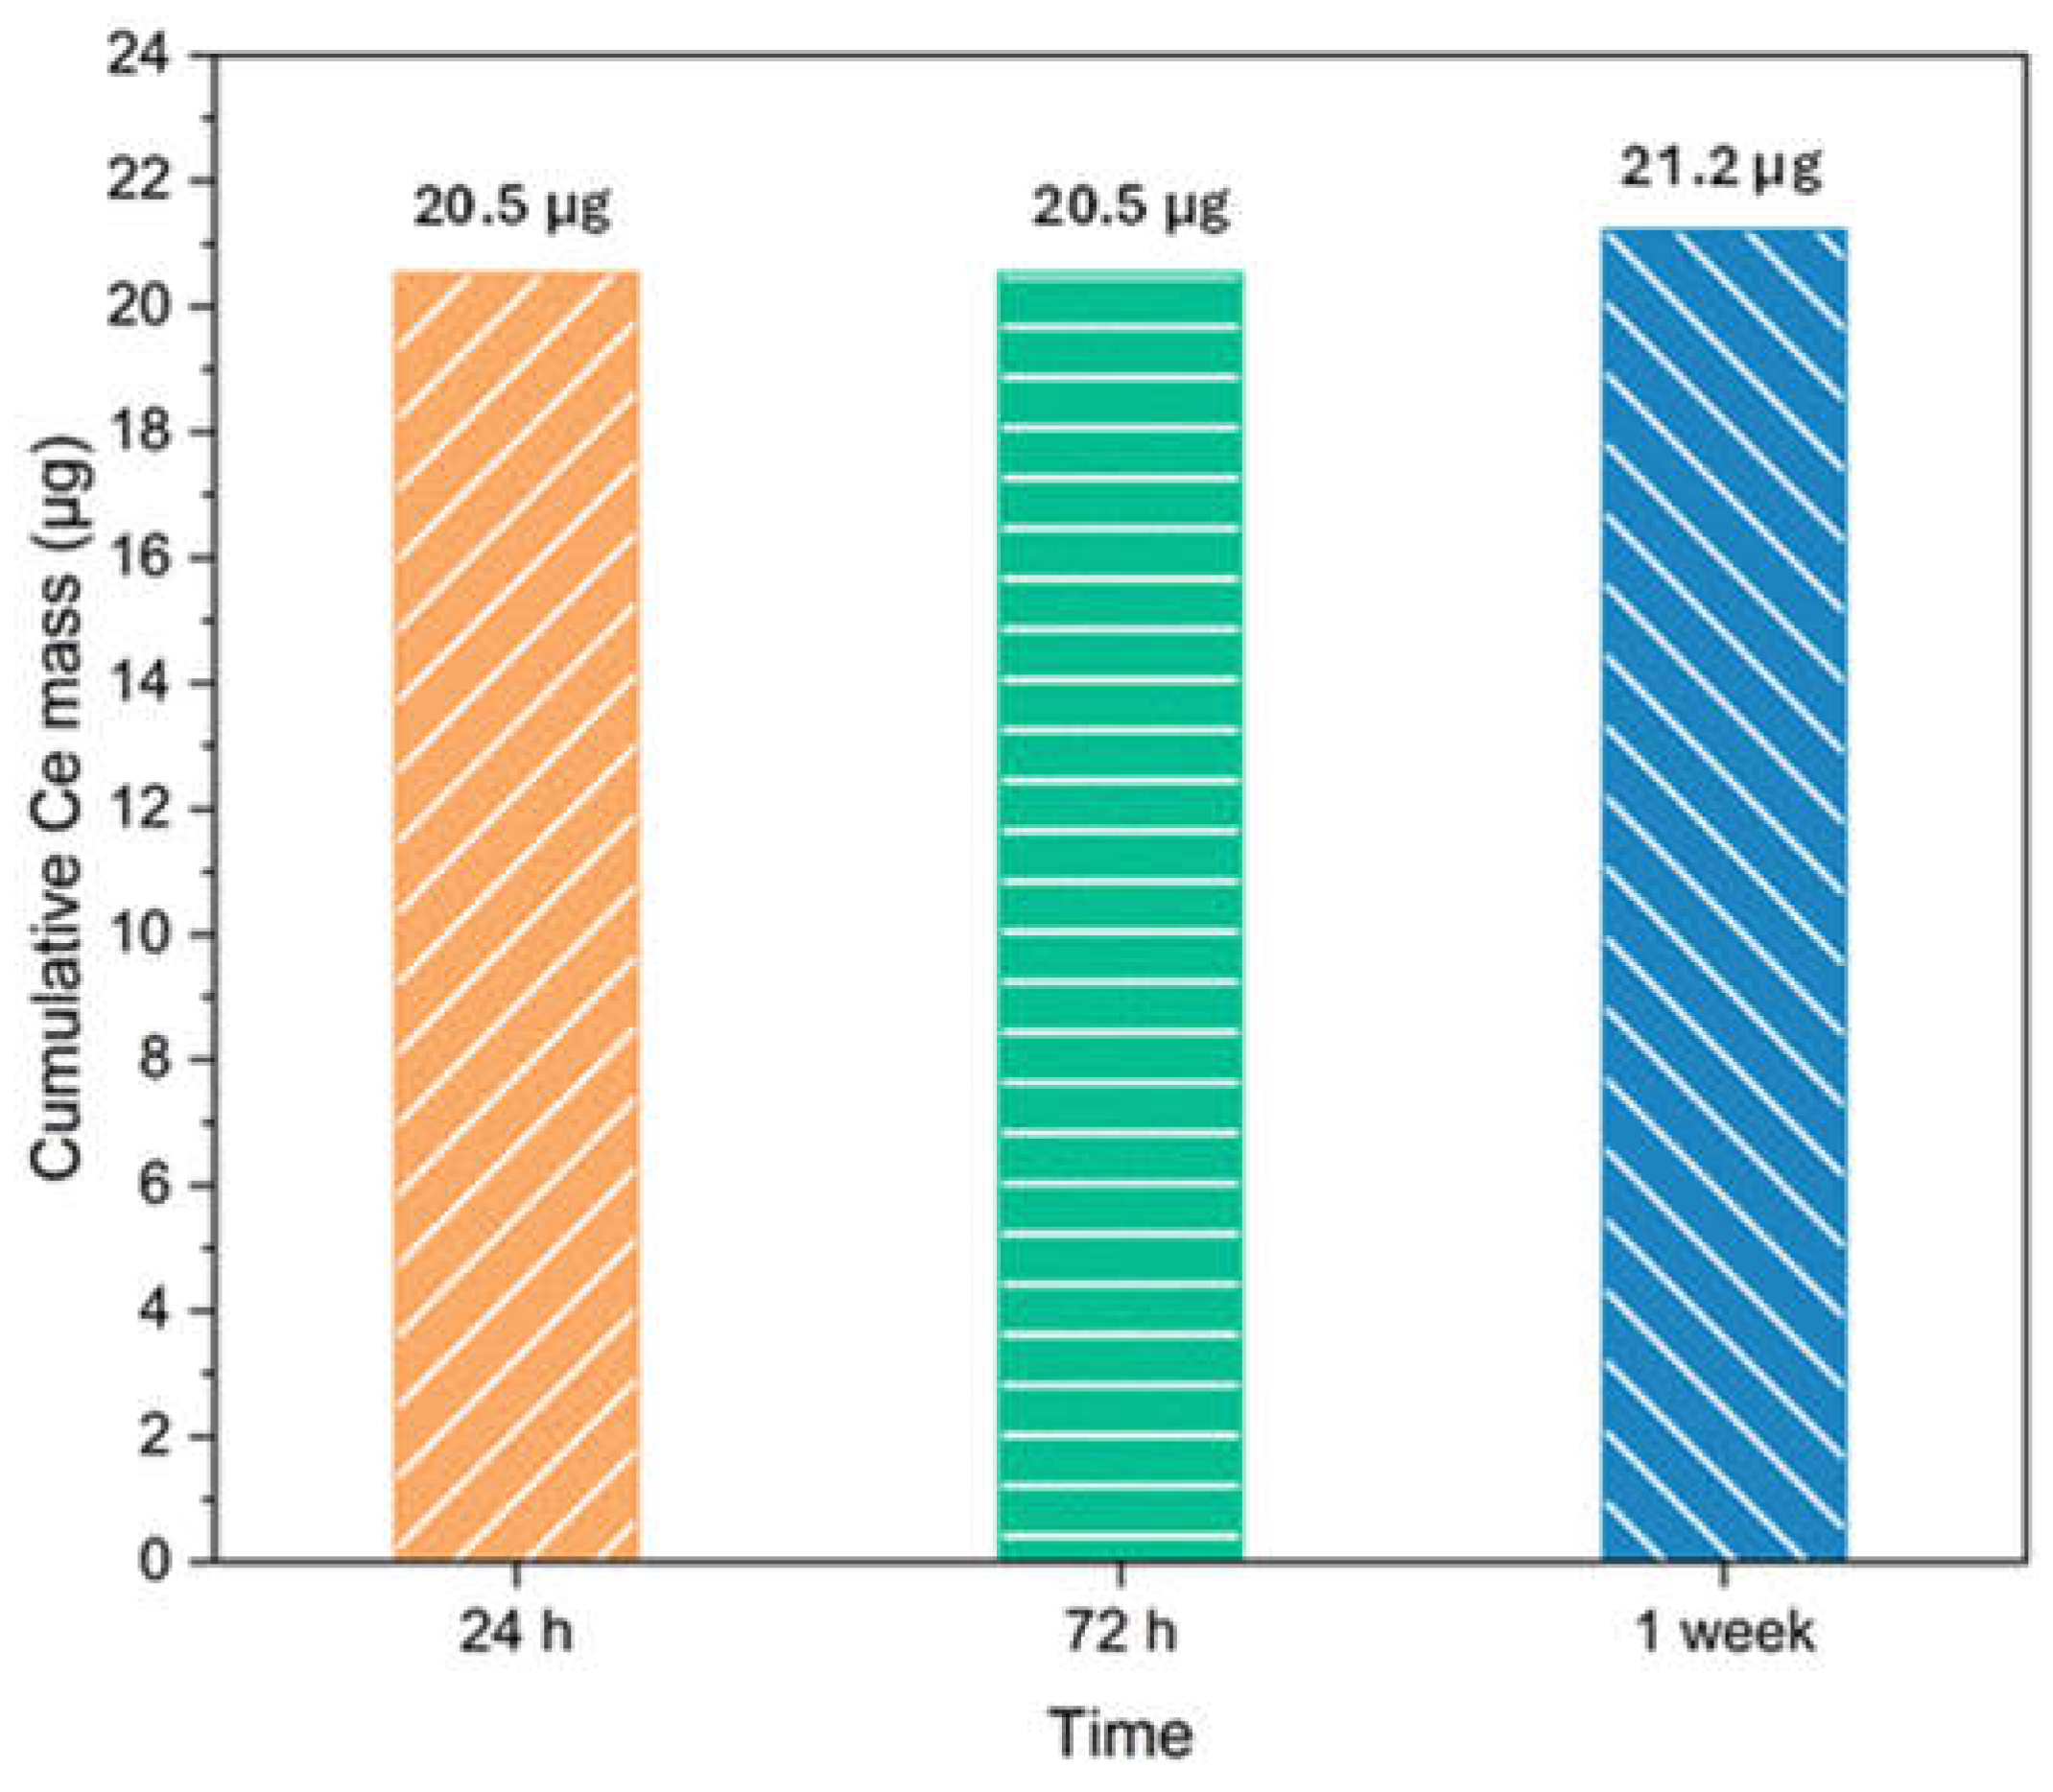
Figure 6.
Nyquist (left) and Bode (right) plots for undamaged R-Control and R-Ce coatings after 24 h, 72 h and 1 week of exposure to 3.5 wt.% NaCl solution. Symbols represent experimental data, while solid lines denote equivalent circuit fitting results.
Figure 6.
Nyquist (left) and Bode (right) plots for undamaged R-Control and R-Ce coatings after 24 h, 72 h and 1 week of exposure to 3.5 wt.% NaCl solution. Symbols represent experimental data, while solid lines denote equivalent circuit fitting results.
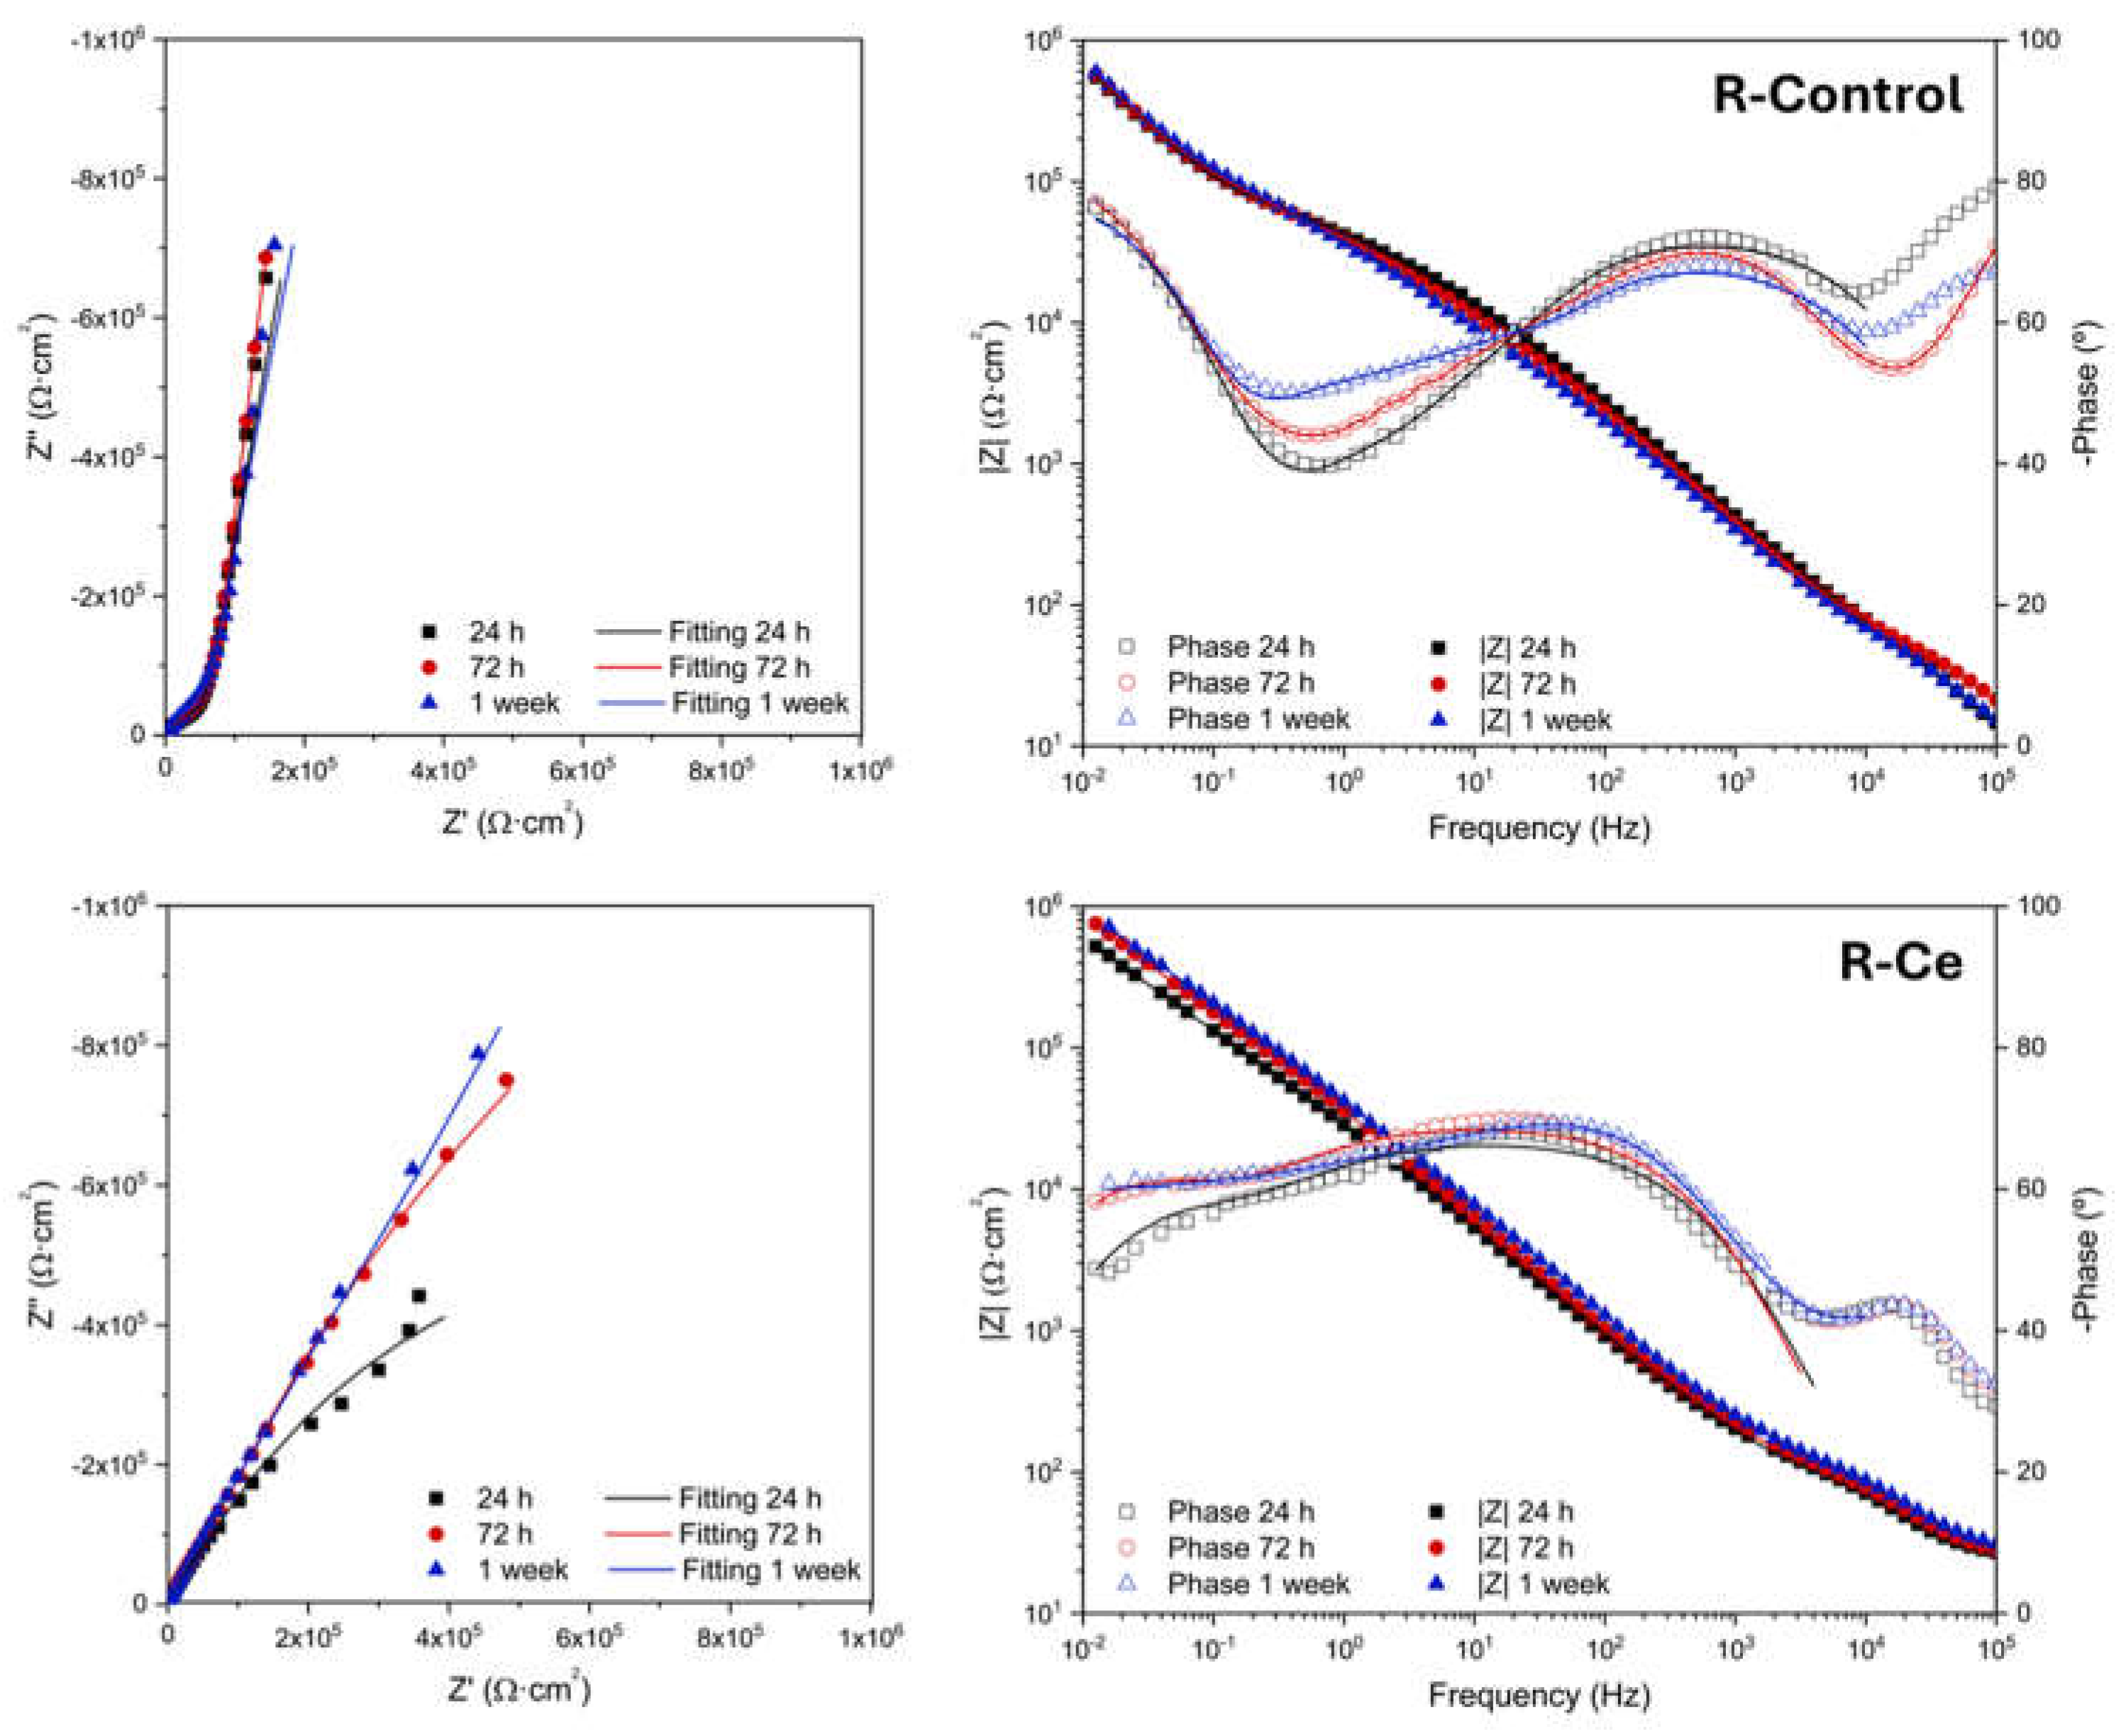
Figure 7.
Equivalent electrical circuit model used to fit the EIS data for undamaged R-Control and R-Ce coatings.
Figure 7.
Equivalent electrical circuit model used to fit the EIS data for undamaged R-Control and R-Ce coatings.
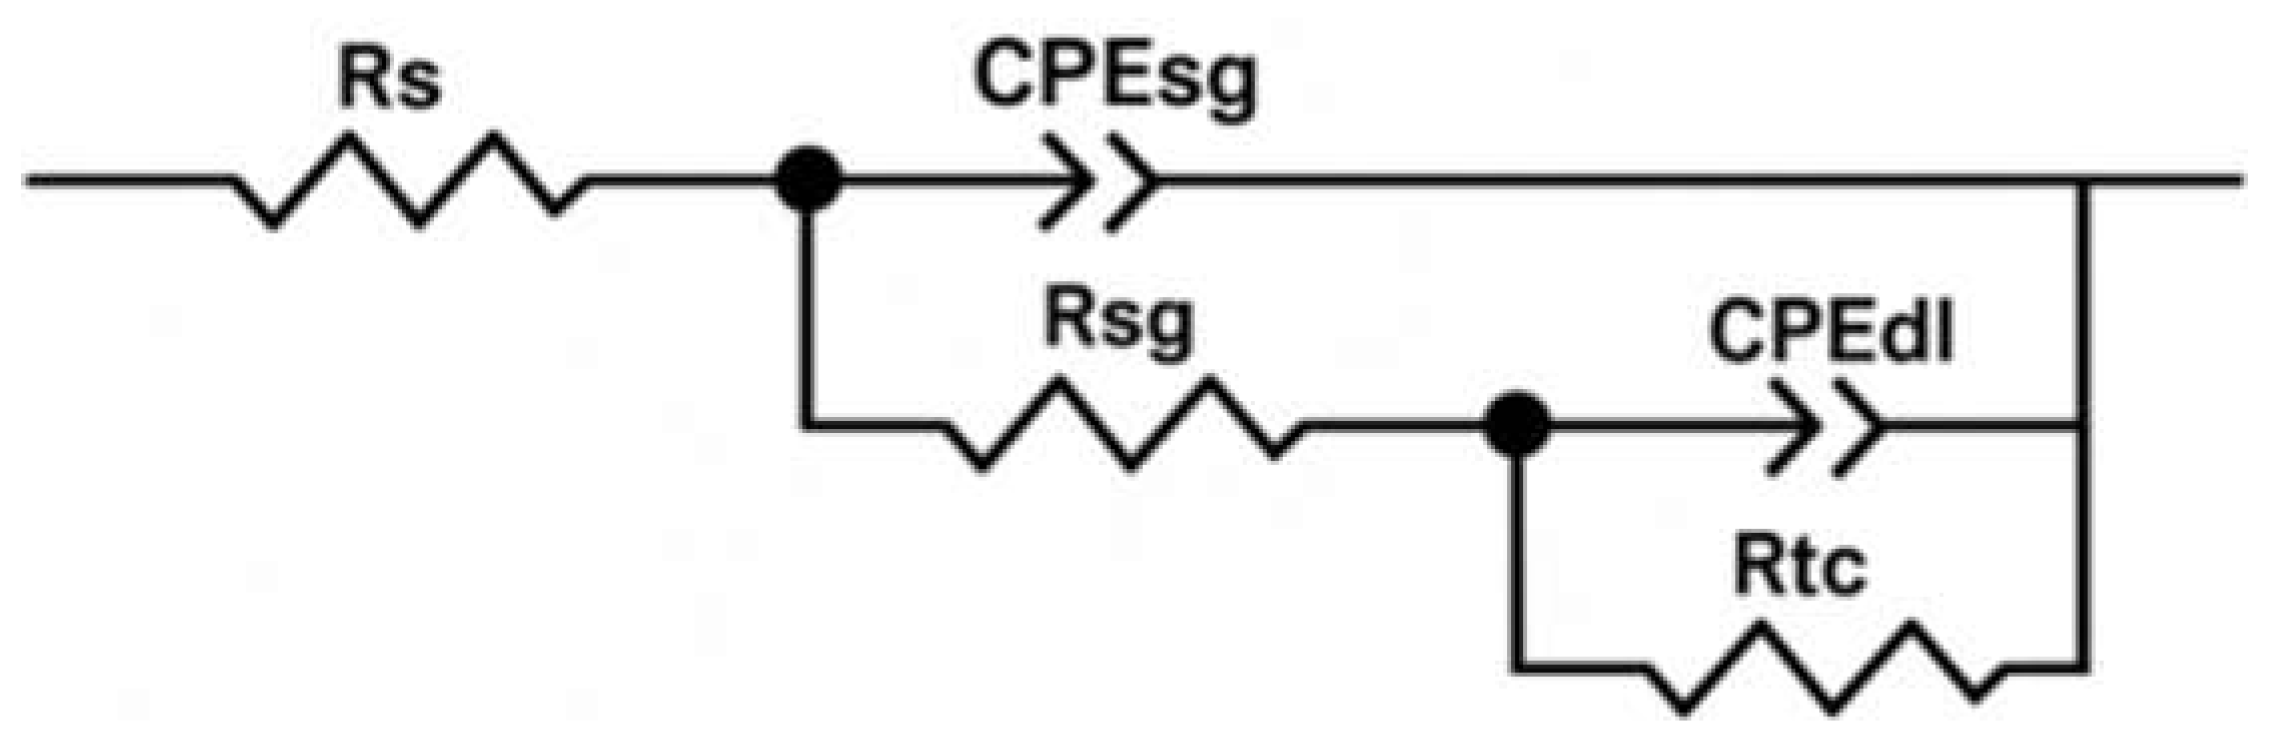
Figure 8.
Nyquist (left) and Bode (right) plots for artificially defected (scalpel-scribed) R-Control and R-Ce coatings after 24 h of exposure to 3.5 wt.% NaCl solution. Symbols represent experimental data, while solid lines denote equivalent circuit fitting results.
Figure 8.
Nyquist (left) and Bode (right) plots for artificially defected (scalpel-scribed) R-Control and R-Ce coatings after 24 h of exposure to 3.5 wt.% NaCl solution. Symbols represent experimental data, while solid lines denote equivalent circuit fitting results.
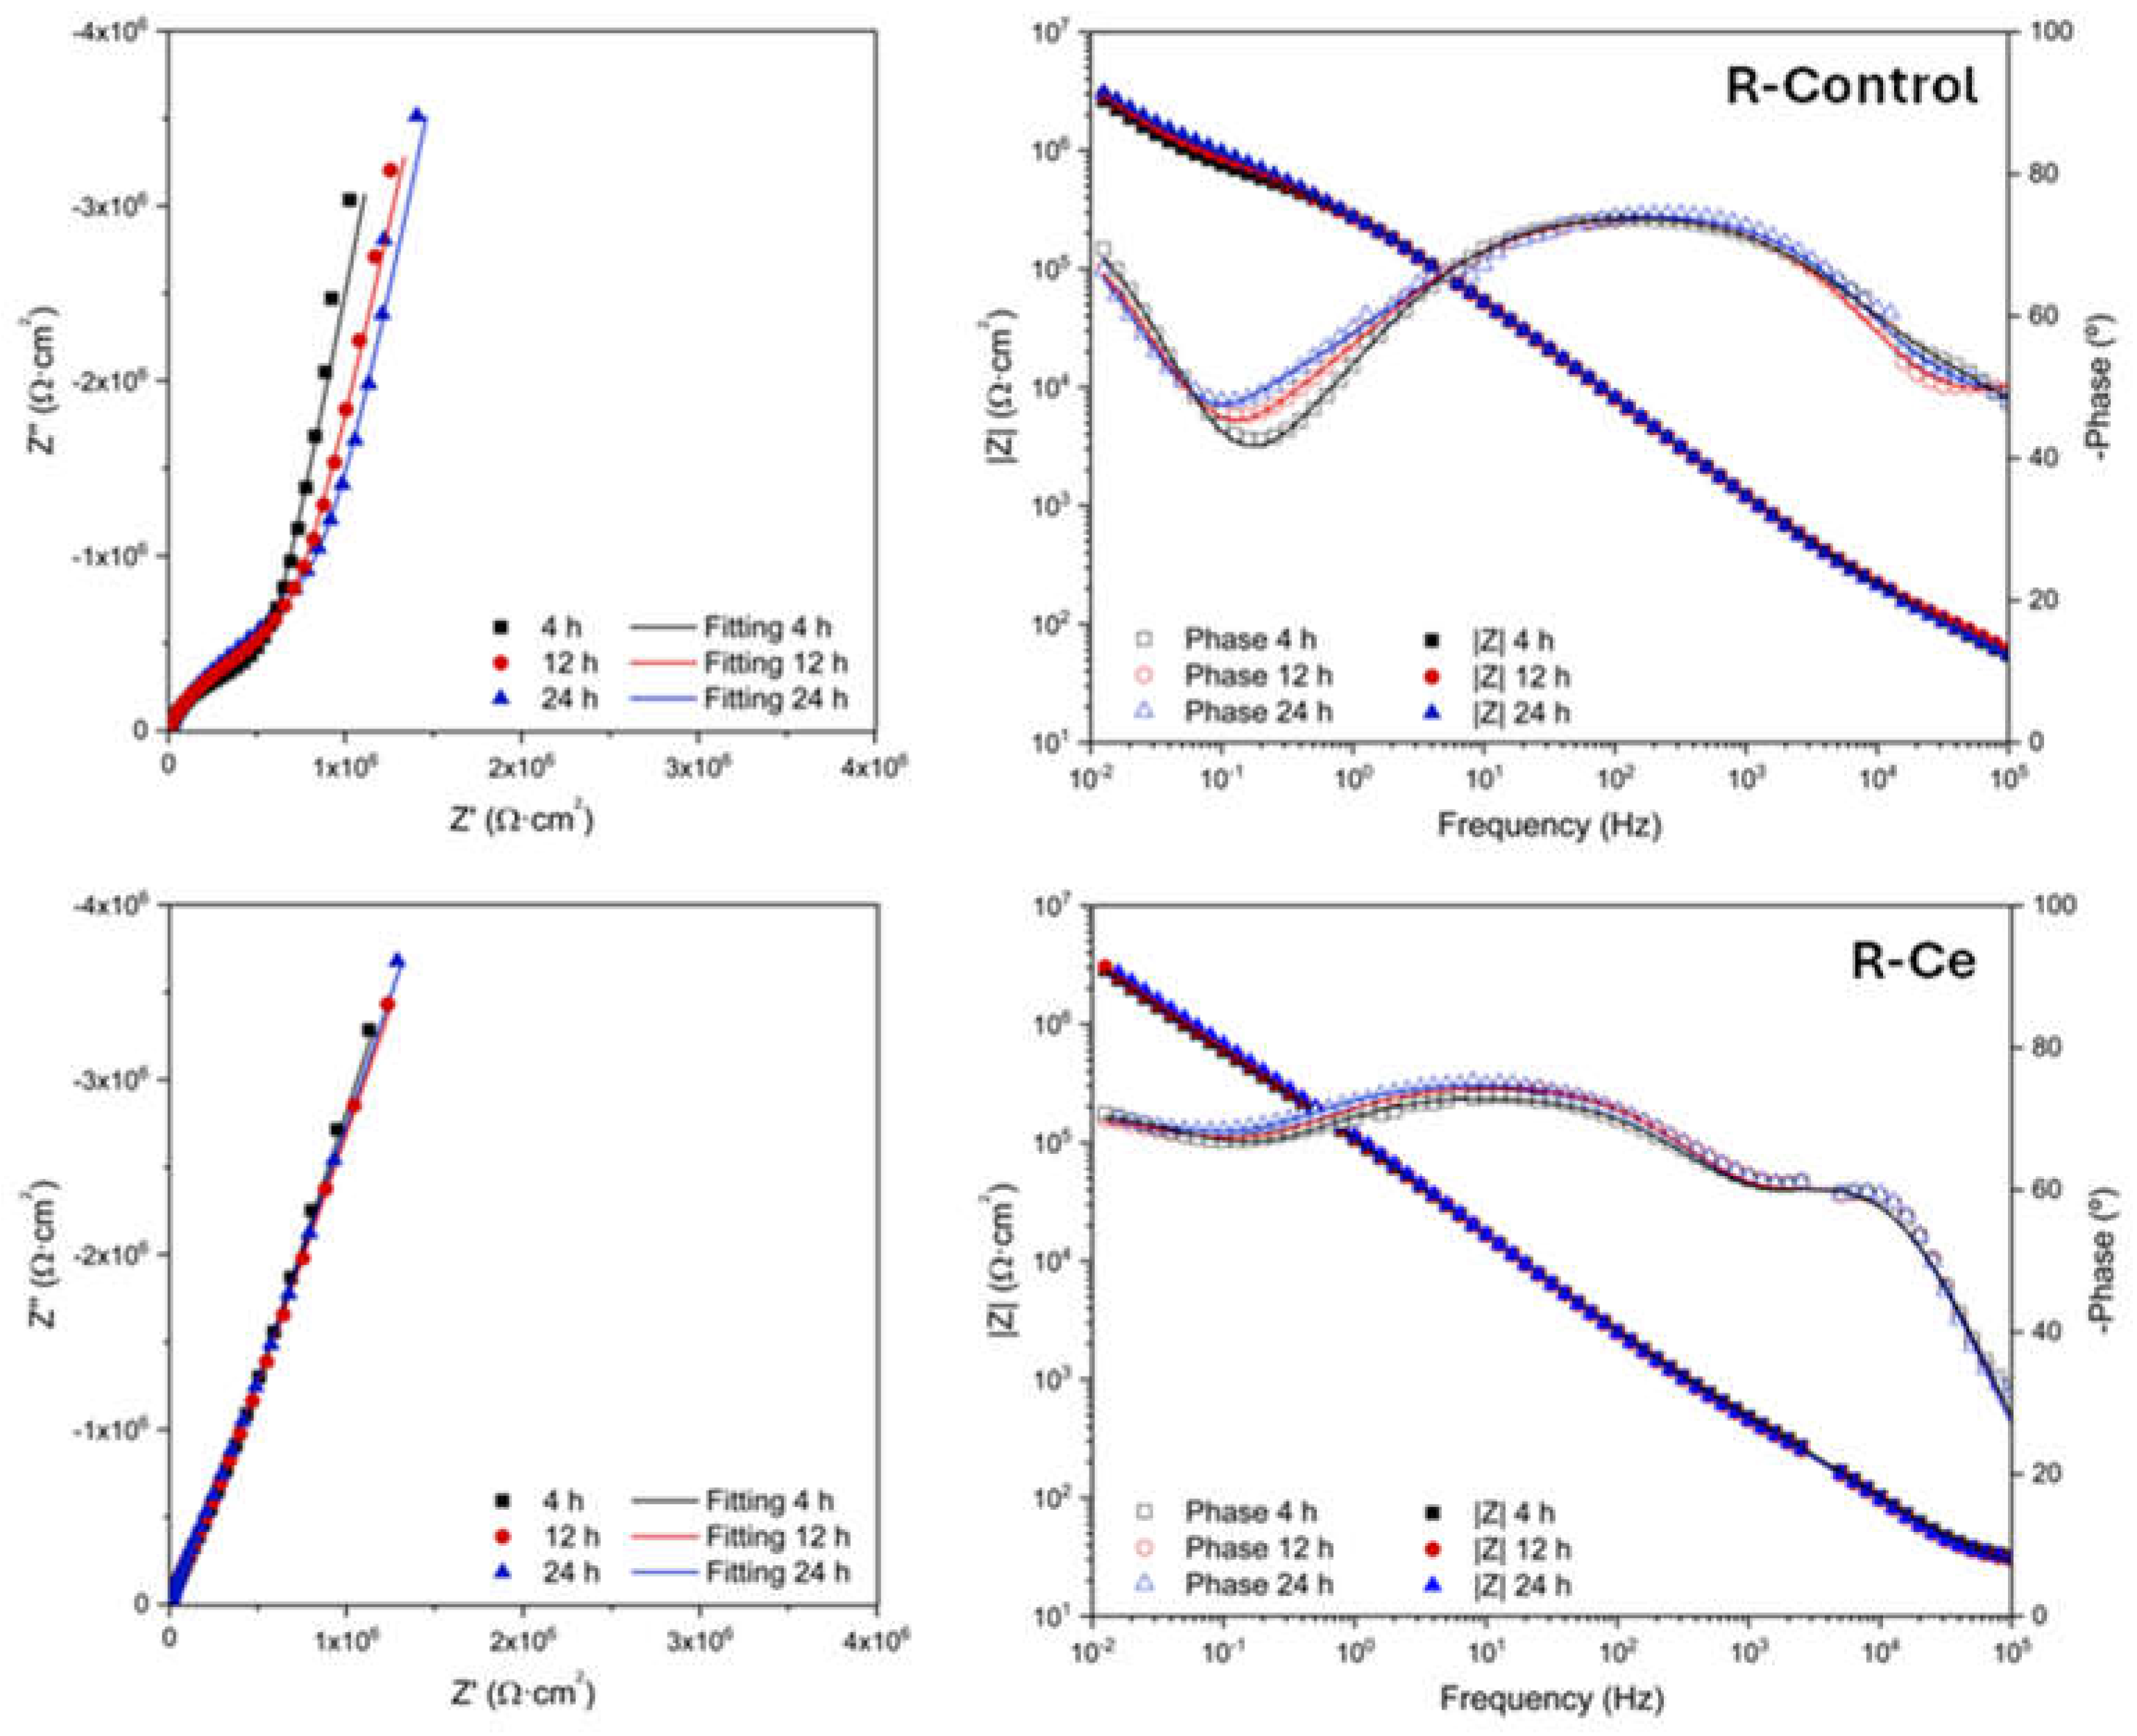
Figure 9.
Equivalent electrical circuit model used to fit the EIS data for artificially defected R-Control and R-Ce coatings.
Figure 9.
Equivalent electrical circuit model used to fit the EIS data for artificially defected R-Control and R-Ce coatings.

Figure 10.
Representative SE (left) and BSE (right) SEM images of undamaged R-Control and R-Ce coatings for different immersion times in a 3.5 wt.% NaCl aqueous solution.
Figure 10.
Representative SE (left) and BSE (right) SEM images of undamaged R-Control and R-Ce coatings for different immersion times in a 3.5 wt.% NaCl aqueous solution.
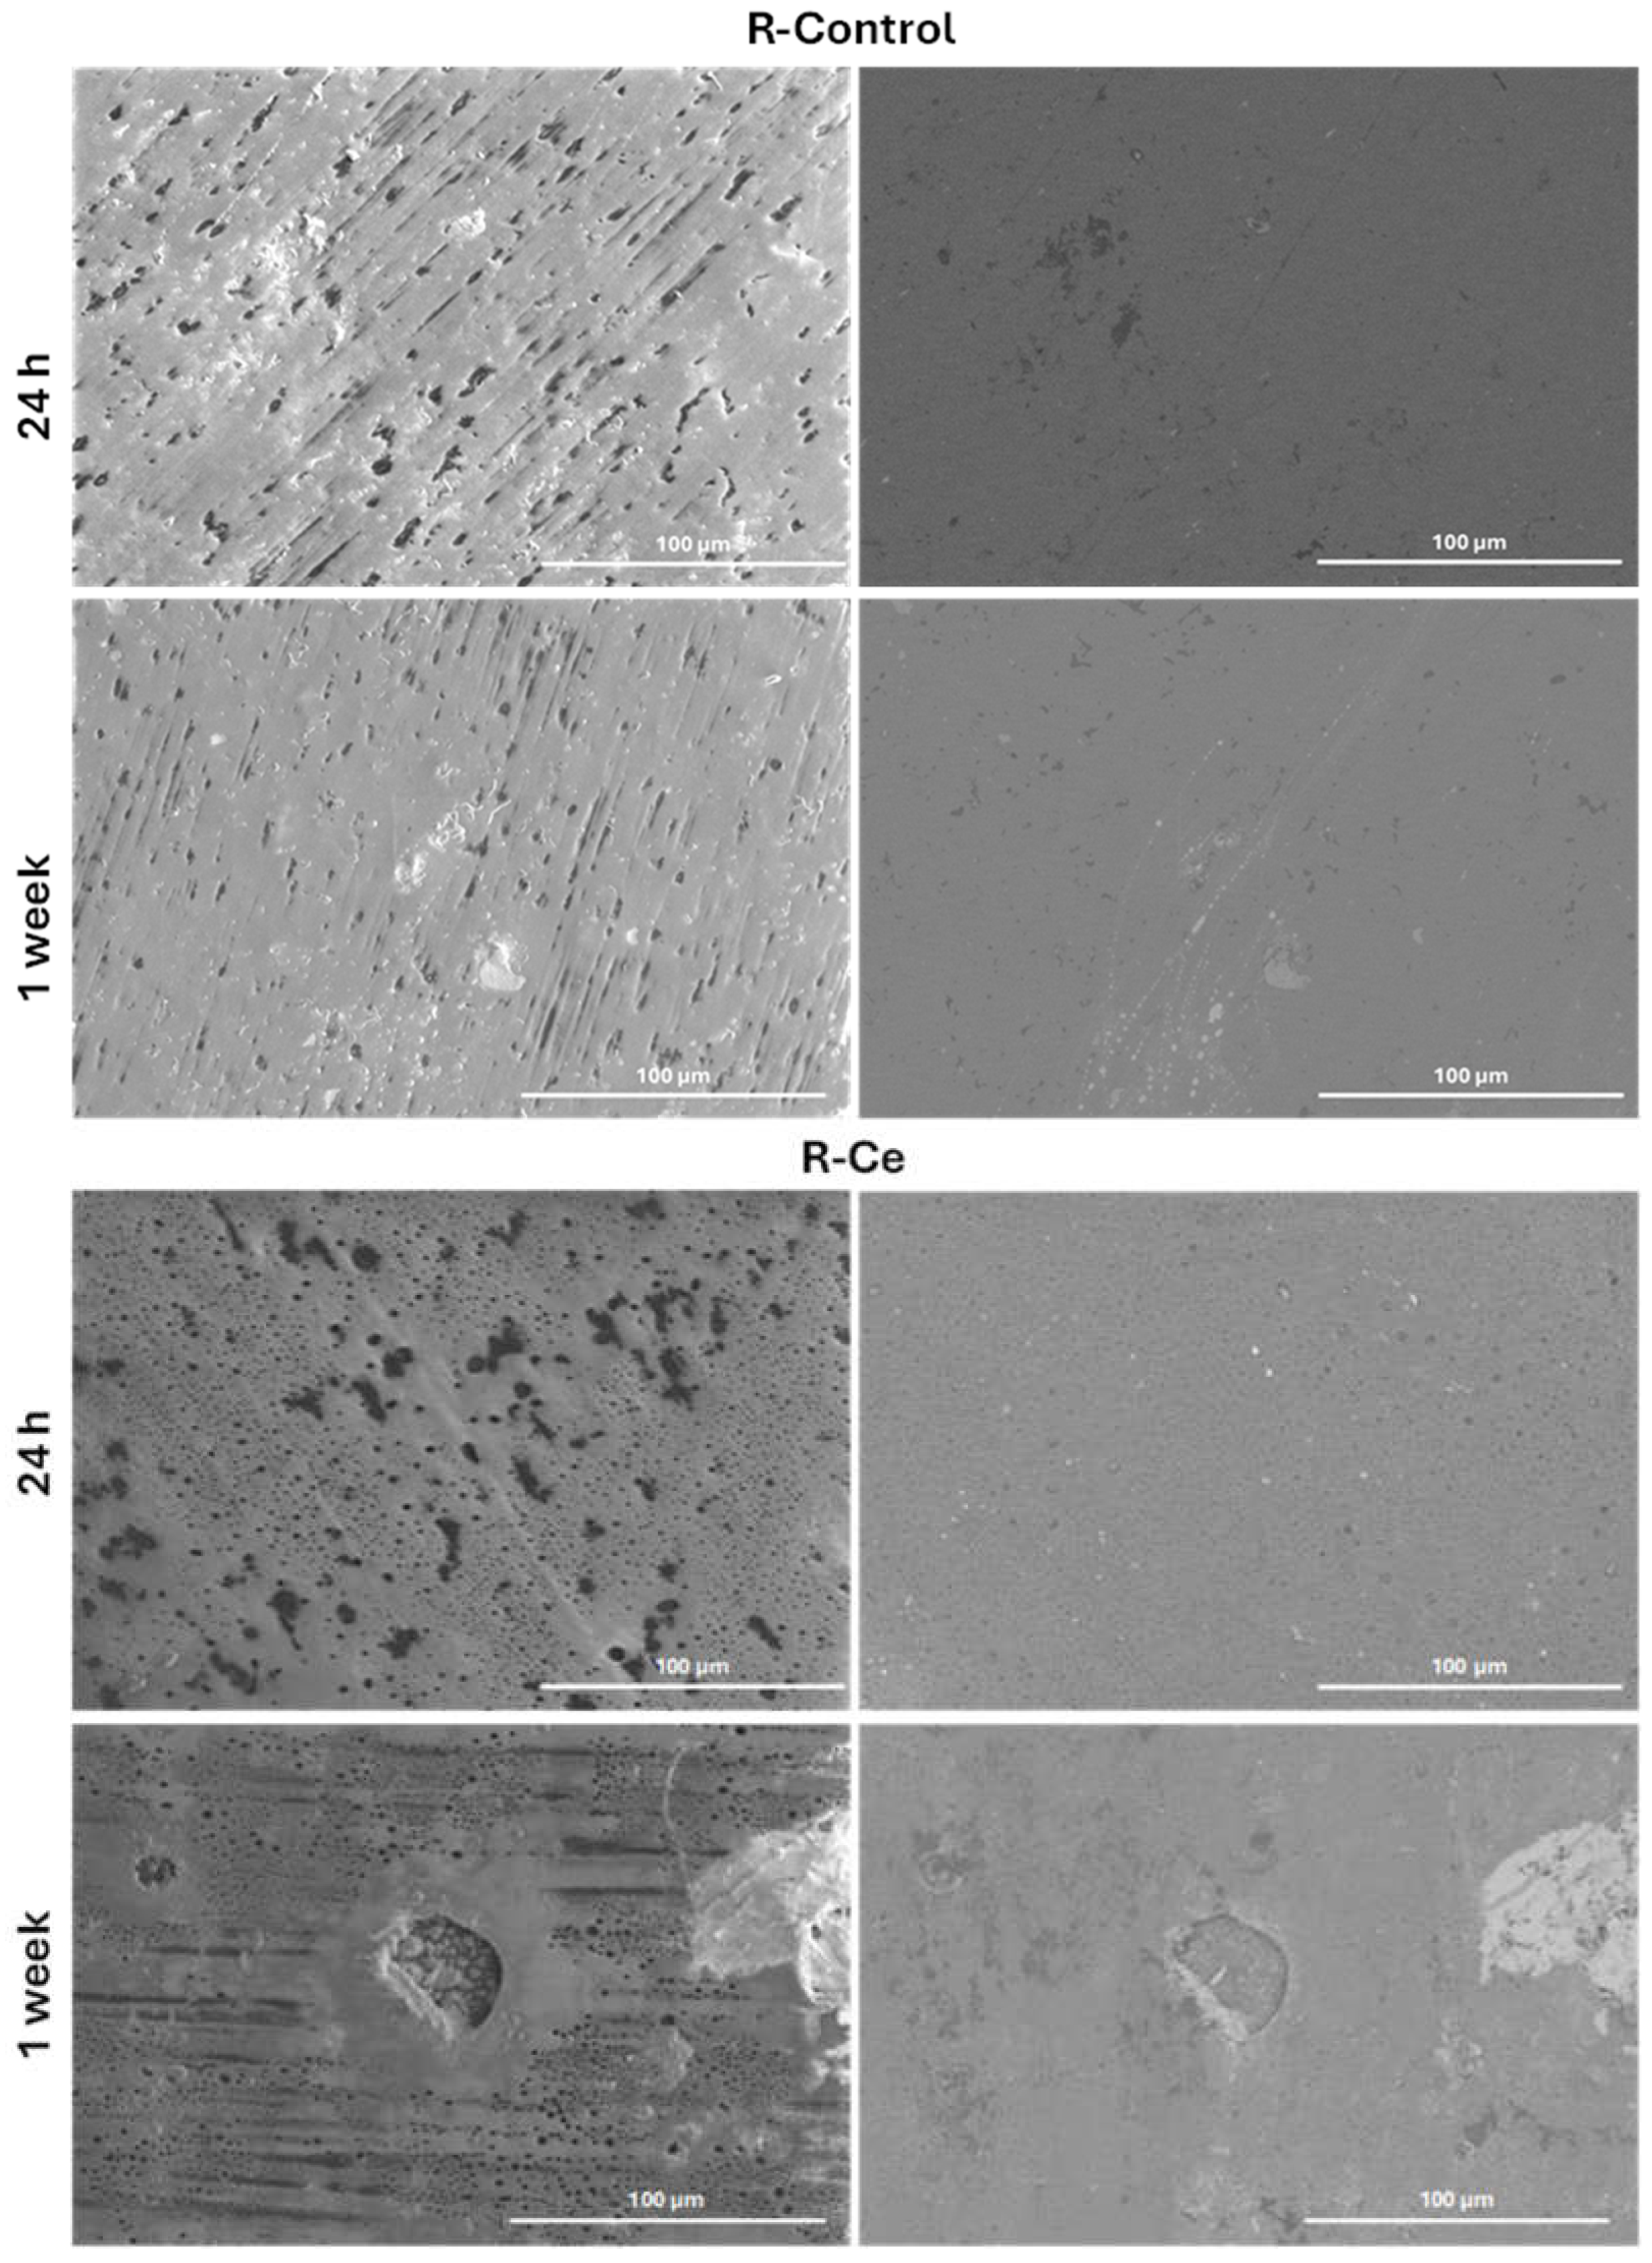
Figure 11.
Surface morphology via BSE-SEM (left) and Ce content via EDS following 24 h and 1 week of immersion (right).
Figure 11.
Surface morphology via BSE-SEM (left) and Ce content via EDS following 24 h and 1 week of immersion (right).
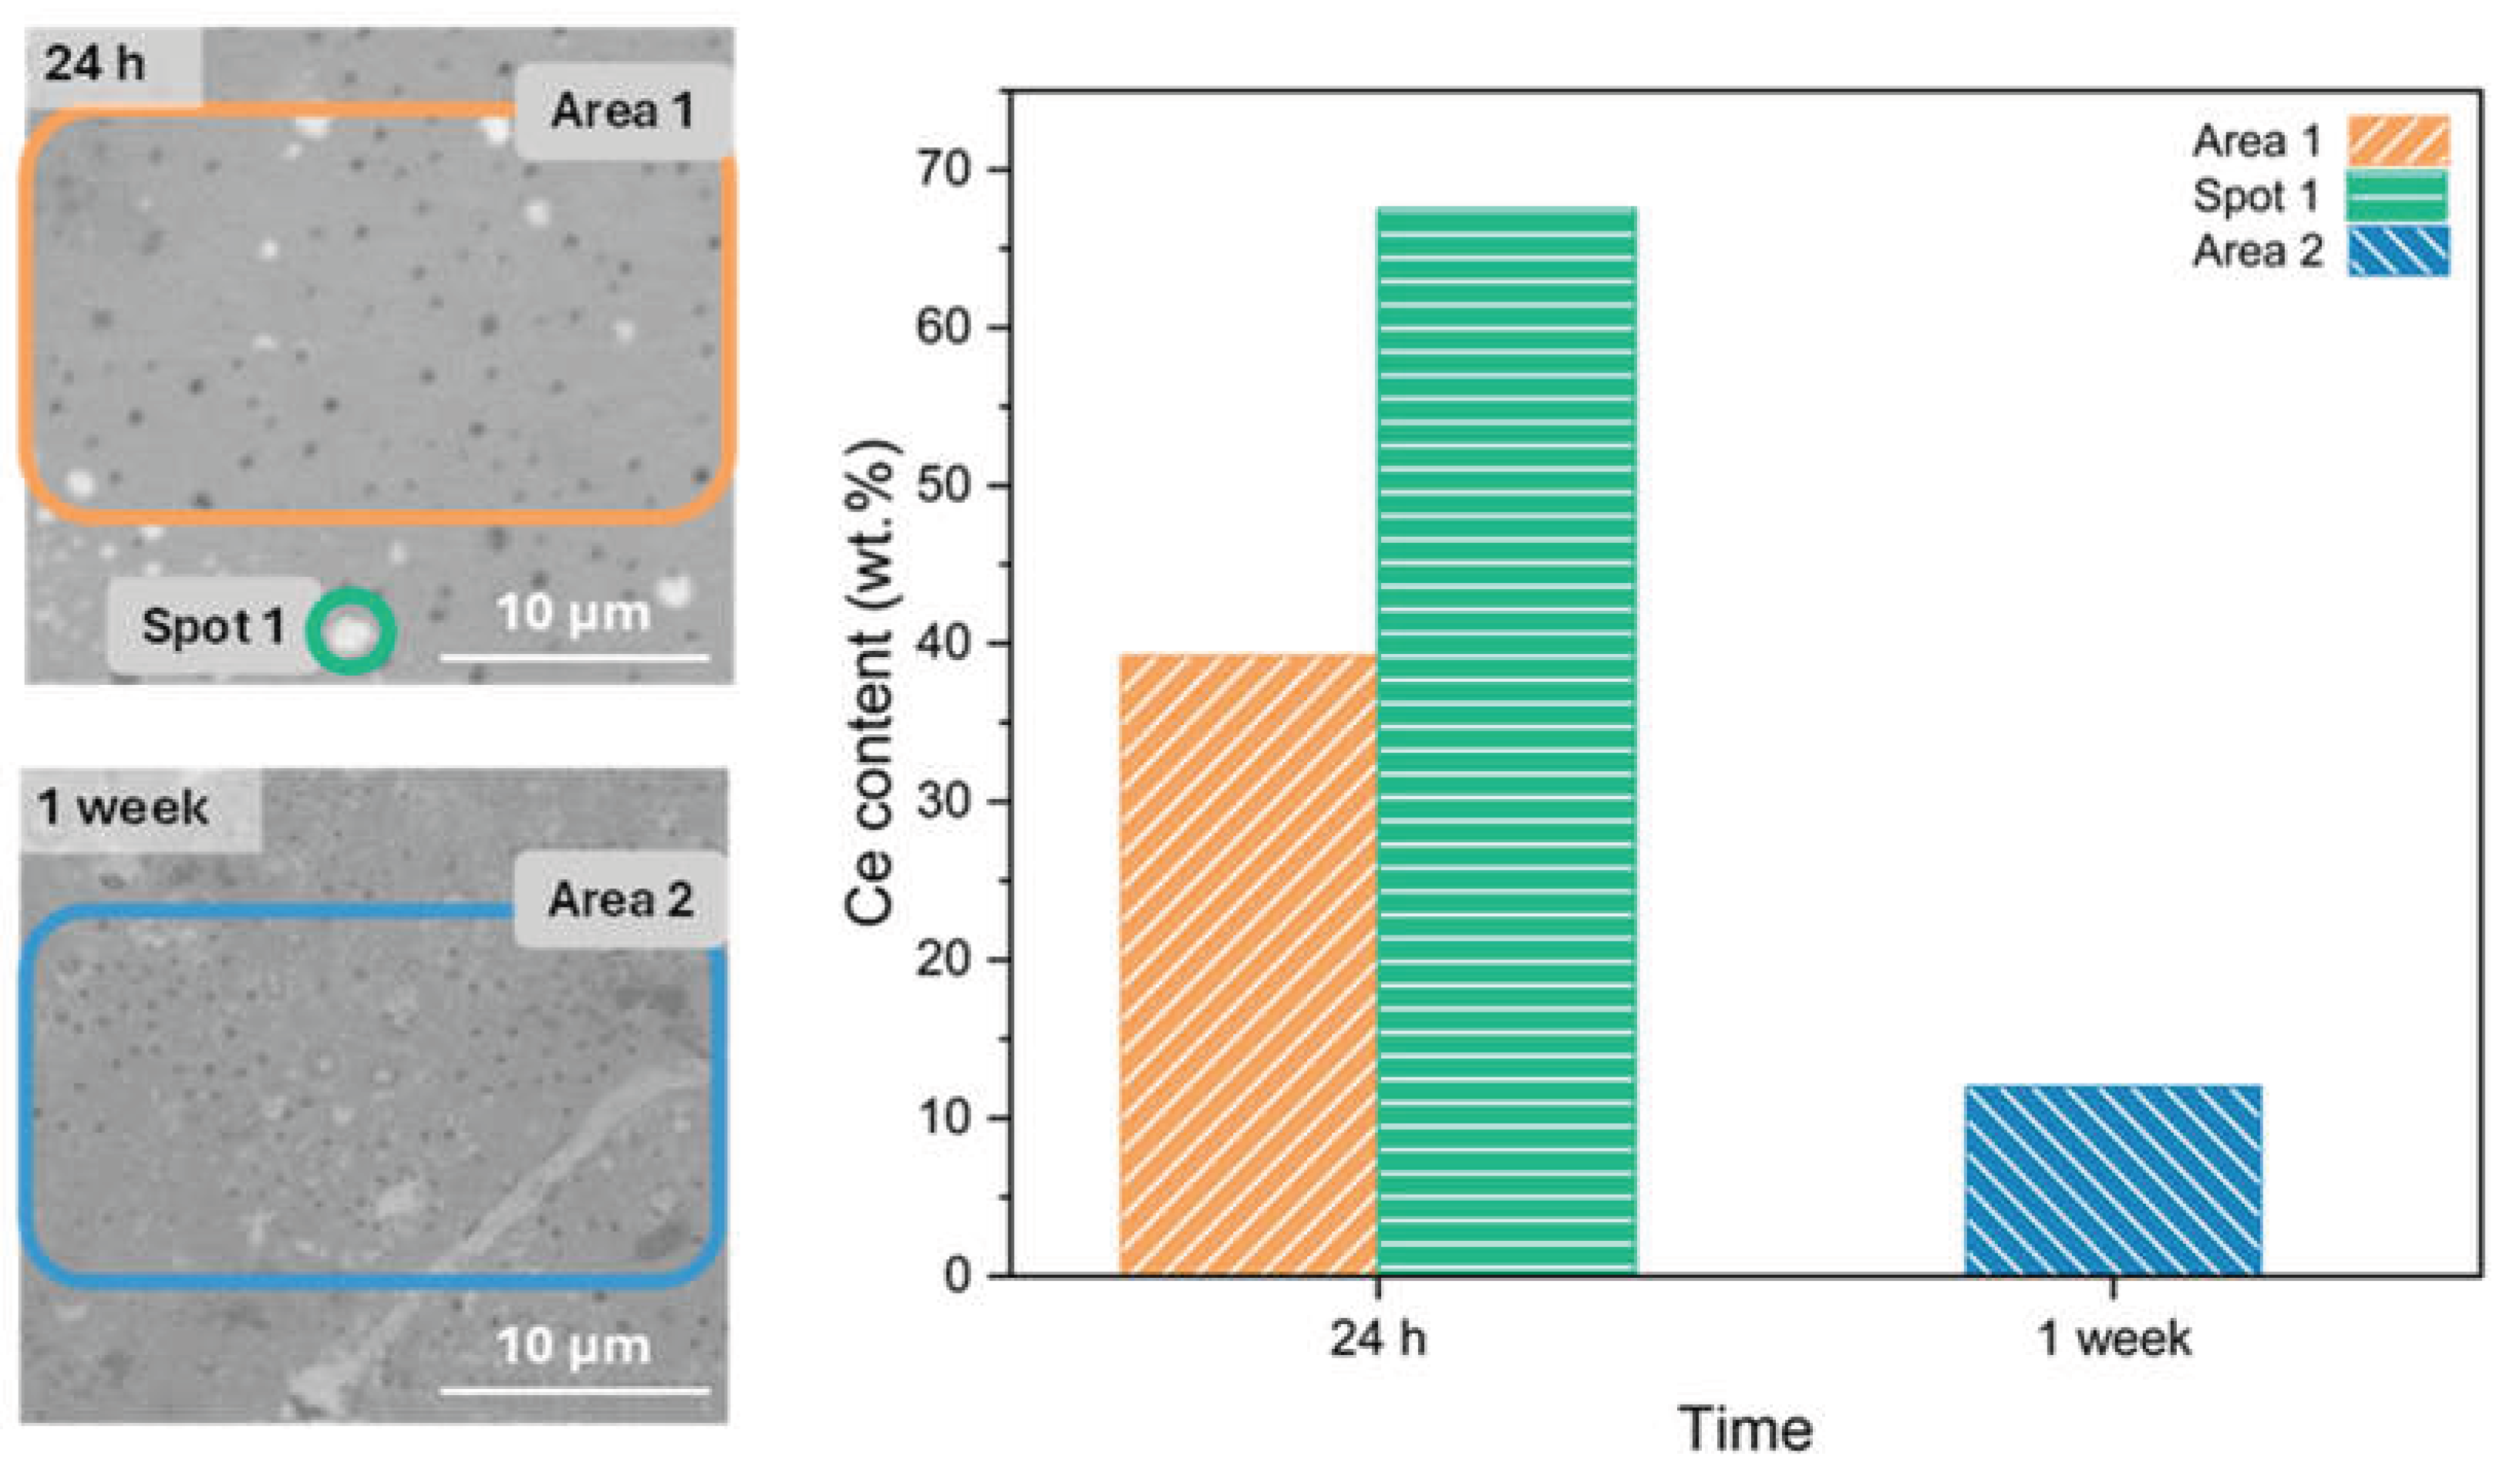

Table 1.
Experimental low-frequency impedance modulus and fitted equivalent-circuit parameters for undamaged R-Control and R-Ce coatings immersed in a 3.5 wt.% NaCl solution for up to 1 week.
Table 1.
Experimental low-frequency impedance modulus and fitted equivalent-circuit parameters for undamaged R-Control and R-Ce coatings immersed in a 3.5 wt.% NaCl solution for up to 1 week.
| Sample | Time | |Z| (Ω·cm2) | Rsg(Ω·cm2) | CPEsg-P | CPEsg-T (µF·s(n-1)·cm-2) |
| R-Control | 24 h | 6.73·105 | 2.8·104 | 0.818 | 1.80 |
| 72 h | 7.02·105 | 2.3·104 | 0.805 | 2.28 | |
| 1 week | 7.22·105 | 2.2·104 | 0.775 | 3.31 | |
| R-Ce | 24 h | 5.68·105 | 1.9·105 | 0.771 | 7.72 |
| 72 h | 8.92·105 | 3.3·105 | 0.789 | 6.08 | |
| 1 week | 9.03·105 | 2.2·105 | 0.785 | 5.04 |
Table 2.
Fitted electrochemical parameters obtained from the equivalent circuit analysis of artificially damaged R-Control and R-Ce coatings immersed in a 3.5 wt.% NaCl solution for 24 h.
Table 2.
Fitted electrochemical parameters obtained from the equivalent circuit analysis of artificially damaged R-Control and R-Ce coatings immersed in a 3.5 wt.% NaCl solution for 24 h.
| Sample | Time (h) | Rsg(Ω·cm2) | CPEsg-P | CPEsg-T * | Rtc(Ω·cm2) | CEPdl-P | CEPdl -T* | ZW-R (Ω·cm2) | ZW-P | ZW-T (s) |
| R-Control | 4 | 87.2 | 0.604 | 9.88 | 3.98·105 | 0.837 | 0.56 | 1.08·106 | 0.443 | 3.88 |
| 12 | 78.4 | 0.667 | 3.60 | 3.20·105 | 0.838 | 0.54 | 2.21·106 | 0.437 | 7.64 | |
| 24 | 65.9 | 0.714 | 2.16 | 2.57·105 | 0.842 | 0.54 | 2.75·106 | 0.440 | 9.47 | |
| R-Ce | 4 | 187.8 | 0.798 | 3.69 | 1.16·106 | 0.824 | 1.97 | 1.74·104 | 0.382 | 3.57·10-3 |
| 12 | 186.5 | 0.791 | 3.93 | 1.27·106 | 0.841 | 1.84 | 9.69·104 | 0.364 | 2.77·10-3 | |
| 24 | 190.6 | 0.803 | 3.39 | 1.58·106 | 0.843 | 1.82 | 1.47·105 | 0.364 | 4.09·10-2 |
*Units: (µF·s(n-1)·cm-2).
Disclaimer/Publisher’s Note: The statements, opinions and data contained in all publications are solely those of the individual author(s) and contributor(s) and not of MDPI and/or the editor(s). MDPI and/or the editor(s) disclaim responsibility for any injury to people or property resulting from any ideas, methods, instructions or products referred to in the content. |
© 2026 by the authors. Licensee MDPI, Basel, Switzerland. This article is an open access article distributed under the terms and conditions of the Creative Commons Attribution (CC BY) license (http://creativecommons.org/licenses/by/4.0/).
Copyright: This open access article is published under a Creative Commons CC BY 4.0 license, which permit the free download, distribution, and reuse, provided that the author and preprint are cited in any reuse.