

Submitted:
09 October 2026
Posted:
10 October 2026
You are already at the latest version
Abstract
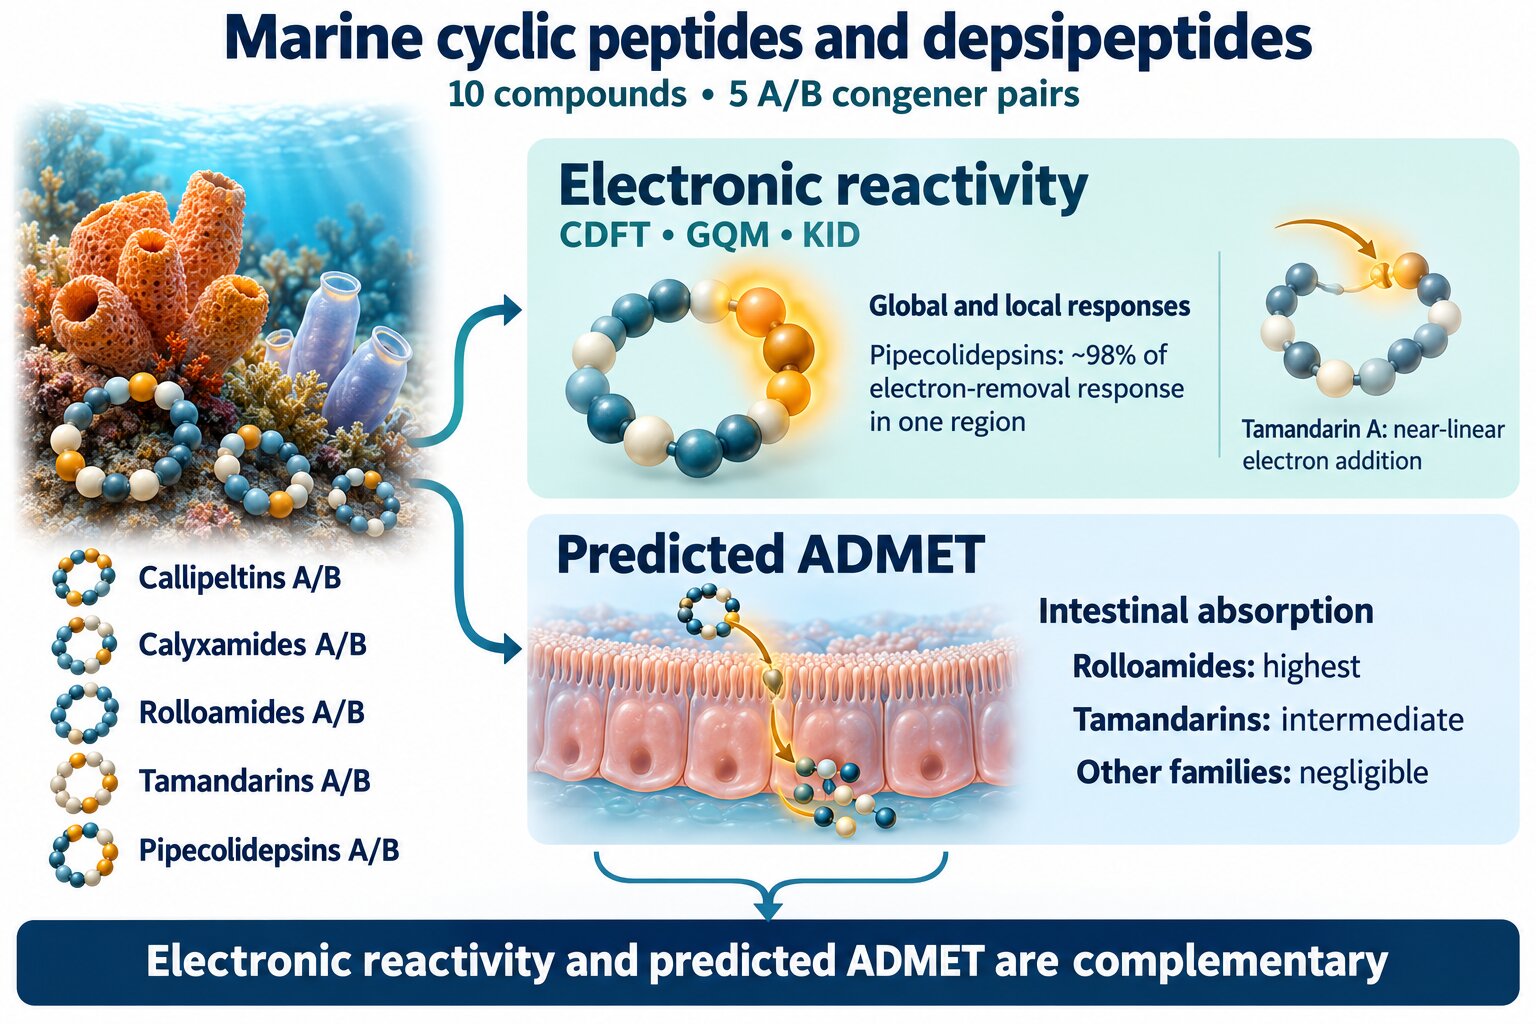
Marine cyclic peptides and depsipeptides constitute structurally complex natural products of considerable interest for drug discovery, but the relationship between their electronic reactivity and predicted pharmacokinetic behavior remains insufficiently characterized. In this work, five pairs of bioactive marine congeners, Callipeltins, Calyxamides, Rolloamides, Tamandarins, and Pipecolidepsins, were investigated using Conceptual Density Functional Theory within the Generalized Quadratic Model (GQM), complemented by KID consistency criteria, atom-resolved Fukui functions, frontier-orbital and electrostatic-potential analyses, and in silico ADMET predictions. The GQM/KID analysis revealed branch- and family-dependent electronic responses, including an exceptionally small electron-addition deviation for Tamandarin A, a larger corresponding deviation for Calyxamide A, pronounced A-to-B electronic reorganization for the Rolloamides, and comparatively larger electron-removal deviations for the Pipecolidepsins. Local reactivity patterns further differentiated the congeners, with approximately 98% of the Pipecolidepsin electron-removal response concentrated on the same N68–C67–C66–C65 region. Rolloamides showed the highest predicted intestinal absorption, followed by Tamandarins, whereas negligible absorption was predicted for the other families. Overall, electronic differentiation was not necessarily mirrored by predicted ADMET behavior, demonstrating that GQM/CDFT and pharmacokinetic profiling provide complementary dimensions for the computational characterization of complex marine natural products.
Keywords:
marine cyclic peptides
; depsipeptides
; Conceptual Density Functional Theory
; Generalized Quadratic Model
; Fukui functions
; electronic reactivity
; ADMET
; computer-aided drug discovery
1. Introduction
Cyclic peptides and depsipeptides occupy a distinctive region of chemical space between conventional small molecules and larger biomolecular therapeutics. Their macrocyclic architectures can restrict conformational freedom while accommodating structurally diverse and frequently non-proteinogenic amino-acid residues, features that have stimulated considerable interest in their use as molecular scaffolds for drug discovery [1,2]. Marine organisms constitute a particularly rich source of these compounds, providing structurally unusual peptides associated with a broad range of biological activities [2]. At the same time, their relatively large size, structural complexity, and heterogeneous physicochemical properties make the assessment of their electronic reactivity and developability a challenging problem that can benefit from complementary computational approaches [3,4].
Among marine cyclic peptides and depsipeptides, the Callipeltins, Calyxamides, Rolloamides, Tamandarins, and Pipecolidepsins constitute particularly interesting examples because each family contains closely related congeners with documented biological activity. Callipeltin A was originally isolated from the New Caledonian sponge Callipelta sp. as a structurally unusual cyclic depsidecapeptide displaying anti-HIV activity, whereas Callipeltin B was subsequently identified as a related cytotoxic congener sharing the same cyclic depsipeptide core but differing in its appended structural elements [5,6]. The continuing synthetic interest in this family is illustrated by the recent preparation of the cyclic heptapeptide core of Callipeltin A [7]. Calyxamides A and B, isolated from the marine sponge Discodermia calyx, are cytotoxic cyclic peptides containing 5-hydroxytryptophan and thiazole moieties [8]. Rolloamides A and B are cyclic heptapeptides isolated from the Caribbean sponge Eurypon laughlini, with Rolloamide A showing growth-suppressive activity against a panel of cancer cell lines [9]. Together, these systems illustrate the structural diversity that can occur even within closely related marine peptide families.
Two additional depsipeptide families extend this diversity. Tamandarins A and B were isolated from a Brazilian marine ascidian of the family Didemnidae and were identified as cytotoxic depsipeptides; Tamandarin A displayed activity against several human cancer cell lines [10]. Subsequent total-synthesis and analogue studies have further explored the relationship between structural modification and biological activity in this family [11,12]. Pipecolidepsins A and B, isolated from the Madagascan sponge Homophymia lamellosa, are cyclic depsipeptides containing several unusual amino-acid residues and were reported to display cytotoxicity against a panel of human tumor cell lines [13]. The subsequent total synthesis of Pipecolidepsin A provided chemical validation of the natural-product structure and a synthetic route suitable for accessing related analogues [14]. The occurrence of structurally related A/B congeners across these five families provides an opportunity to investigate whether relatively localized structural modifications are accompanied by detectable changes in electronic response and predicted pharmacokinetic behavior.
Conceptual Density Functional Theory (CDFT) provides a theoretical framework for interpreting chemical reactivity in terms of quantities derived from the response of the electronic energy and density to changes in electron number and external potential [15,16]. Global descriptors characterize the overall electronic response of a molecular system, whereas local descriptors such as the Fukui functions provide spatial information about the regions preferentially involved in electron addition and electron removal. Such descriptors are therefore particularly attractive for the analysis of structurally complex bioactive molecules, for which relatively small structural changes may alter both the energetics and localization of the electronic response [17,18]. More recently, CDFT descriptors have also been considered within broader computational drug-discovery strategies, where they can provide electronic-reactivity information complementary to other molecular-modeling and cheminformatics approaches [19]. CDFT-based computational peptidology has recently been applied to marine peptide families such as Pipestelides A–C and Kapakahines A–G, illustrating the usefulness of combining electronic-reactivity descriptors with computational estimates of drug-relevant molecular properties [20,21].
A recent development of particular relevance to this type of analysis is the Generalized Quadratic Model (GQM) introduced by Albavera-Mata, Gázquez, and Vela [22]. Rather than describing the energy response to fractional electron-number variation through a single quadratic representation, the GQM employs separate quadratic branches for electron removal and electron addition. The formulation reduces to the linear regime for density functionals satisfying the ionization theorems and provides a branch-specific description of charge-transfer behavior [22]. This framework is especially useful in conjunction with KID-type consistency analysis because deviations involving the ionization energy and HOMO energy, or the electron affinity and LUMO energy, can be related directly to the corresponding GQM curvatures. Combining this global energetic description with atom-resolved Fukui functions offers the possibility of examining both the magnitude and the spatial organization of the electronic response.
Against this background, the present work investigates five pairs of structurally related bioactive marine cyclic peptides and depsipeptides: Callipeltins A and B, Calyxamides A and B, Rolloamides A and B, Tamandarins A and B, and Pipecolidepsins A and B. Their electronic reactivity is examined within the Generalized Quadratic Model of Conceptual DFT, with particular attention to the separate electron-removal and electron-addition branches, their relationship with the KID consistency criteria, and the spatial distribution of the local Fukui responses. These electronic descriptors are complemented by frontier-orbital and electrostatic-potential analyses and by in silico ADMET predictions. By comparing closely related A/B congeners, the study aims to determine how relatively localized structural modifications are reflected in global and local electronic responses and whether such electronic differentiation is accompanied by analogous changes in predicted pharmacokinetic properties. The resulting integrated GQM/CDFT–ADMET description is intended to provide a multidimensional computational characterization of these marine natural products within a computer-aided drug-discovery framework.
2. Materials and Methods
2.1. Molecular Systems and Structure Preparation
The molecular systems investigated in this work comprise five pairs of structurally related marine bioactive cyclic peptides and depsipeptides: Callipeltins A and B, Calyxamides A and B, Rolloamides A and B, Tamandarins A and B, and Pipecolidepsins A and B. These ten compounds were selected to provide a chemically diverse yet structurally related set of marine natural products suitable for the comparative analysis of global and local electronic reactivity within the framework of Conceptual Density Functional Theory (CDFT).
The initial molecular structures were constructed from their reported chemical structures, with particular attention being paid to the stereochemistry and connectivity of the constituent residues. The resulting structures were subsequently subjected to conformational exploration prior to quantum-chemical optimization. For each compound, the lowest-energy conformational candidates were used as starting structures for the electronic-structure calculations. The same molecular structures were subsequently employed for the analysis of the frontier molecular orbitals, molecular electrostatic potential, CDFT reactivity descriptors, and pharmacokinetic properties, thereby providing a consistent structural basis for comparison among the five A/B congener pairs.
2.2. Conformational Search and DFT Calculations
A conformational search was initially performed using the MMFF94 molecular mechanics force field in order to explore the conformational space of the cyclic peptides and depsipeptides [23,24,25,26,27]. One hundred conformers were generated for each molecular system, using an energy window of 0.1 kcal mol− for conformer discrimination. The selected low-energy structures were subsequently subjected to a preliminary geometry optimization using a density-functional tight-binding (DFTB) approach with Gaussian 16 software [28] before carrying out the final Density Functional Theory (DFT) calculations.
The final geometry optimizations were performed using the MN12SX screened-exchange density functional [29] in conjunction with the def2-SVP basis set [30,31]. Solvent effects were included through the Solvation Model based on Density (SMD) [32], with water as the solvent, in order to provide a computational environment more representative of the conditions relevant to the biological behavior of the investigated peptides. The optimized structures were verified and subsequently employed for the calculation of the electronic properties required for the CDFT analysis.
In addition to the neutral species, calculations were performed for the corresponding cationic and anionic states while retaining the molecular geometry of the neutral system. The resulting electronic energies for the N, N-1, and N+1 electron species were used to determine the vertical ionization energy and electron affinity and to construct the Generalized Quadratic Model (GQM) representation of the energy as a function of electron number. Frontier orbital energies of the neutral systems were retained for comparison with the corresponding finite-difference quantities within the KID analysis.
2.3. Conceptual DFT and Generalized Quadratic Framework
Conceptual Density Functional Theory (CDFT) provides a framework for interpreting chemical reactivity in terms of the response of the electronic energy to changes in the number of electrons at a fixed external potential [15,16,33]. Within this framework, the chemical potential and chemical hardness are associated with the first and second derivatives, respectively, of the energy with respect to the electron number. Although conventional quadratic models approximate this dependence through a second-order expansion of the energy, the exact ensemble description requires the energy to exhibit piecewise-linear behavior between consecutive integer electron numbers, with derivative discontinuities at the integers [22,33].
In the present work, electronic reactivity was analyzed using the Generalized Quadratic Model (GQM) proposed by Albavera-Mata et al. [22]. This formulation extends the quadratic description by explicitly distinguishing between electron-removal and electron-addition processes. For each branch, the energy variation may be expressed as
where and characterize the electron-removal branch, whereas and characterize the electron-addition branch. This formulation allows the two charge-transfer directions to be described independently rather than imposing a single curvature on both processes.
For a reference system containing N electrons, the vertical ionization energy I and electron affinity A were obtained from the total-energy differences
and
Within the GQM, the first-order coefficients associated with the two charge-transfer branches are related to the frontier molecular orbital energies of the neutral system according to
and
In the PyCRDFT implementation employed in the present work [34], the corresponding branch-specific curvature parameters are evaluated as
and
The sign convention for the electron-addition curvature in Equation (7) follows the implementation of the GeneralizedQuadratic class in PyCRDFT [34]. The signed curvature parameters therefore retain information on the direction of the deviation from the corresponding linear condition, whereas their absolute magnitudes quantify the extent of that deviation.
Consequently, the GQM combines total-energy differences obtained from the , N, and electronic states with the HOMO and LUMO energies of the neutral species. As the relevant frontier-orbital/finite-difference relations are approached, the magnitudes of the corresponding curvature parameters tend toward zero, recovering the piecewise-linear limit.
2.4. Global and Local Reactivity Descriptors
The GQM provides separate global reactivity descriptors for the electron-addition and electron-removal branches. In addition to the vertical ionization energy I and electron affinity A, the branch-specific chemical potentials and and curvature parameters and were obtained as described in Section 2.3.
The corresponding branch-specific electrophilicity-like quantities were evaluated as
following the Generalized Quadratic implementation employed in PyCRDFT [34]. Because these quantities depend inversely on the corresponding curvature, their magnitudes can become very large when approaches zero. Accordingly, and were retained as complementary GQM descriptors, but were interpreted with caution for systems approaching the corresponding linear limit.
Local reactivity was characterized using the grouped Fukui functions provided by the Generalized Quadratic implementation in PyCRDFT [34]. The electron-addition and electron-removal responses at atomic center k are denoted by and , respectively, whereas the corresponding radical response is represented by . For the systems considered here, the latter is given by
The difference between the electron-addition and electron-removal responses was additionally evaluated as
providing a convenient local measure of the relative predominance of the two directional electronic responses at each atomic center.
Branch-specific local chemical potentials were obtained by weighting the corresponding global chemical potentials with the appropriate Fukui functions,
and
In addition, the local charge-transfer descriptor used in the GQM analysis was evaluated as
The numerical consistency of the grouped Fukui functions was assessed through their normalization, for which
The atom-resolved analysis was focused on heavy atoms in order to facilitate the identification and comparison of the principal reactive regions among the five A/B congener pairs.
2.5. KID Analysis and Internal Consistency Criteria
The internal consistency of the frontier-orbital and finite-difference descriptions was examined using the Koopmans-in-DFT (KID) framework [20,21]. For the electron-removal and electron-addition branches, respectively, the following deviation measures were considered:
and
These quantities measure the absolute deviations between the vertical finite-difference energies and the corresponding frontier-orbital relationships. Thus, smaller values of and indicate a closer agreement between the two descriptions for electron removal and electron addition, respectively.
Within the GQM formulation employed here, the KID deviation measures are directly related to the magnitudes of the branch-specific curvatures. From Equations (6) and (7), it follows that
and
Consequently, the KID and GQM analyses are not treated here as independent criteria. Rather, the and values provide an absolute measure of the same deviations from branchwise linearity that are represented, with their signs retained, by the GQM curvature parameters and . In the corresponding linear limit,
and therefore
The KID quantities were therefore employed as internal consistency indicators rather than as independent measures of molecular reactivity. Their magnitudes were used to assess the proximity of each electronic branch to the corresponding linear condition, whereas the signed GQM curvatures were retained to distinguish the direction of the deviation. This combined interpretation was applied consistently to the ten cyclic peptides and depsipeptides investigated in this work.
2.6. Molecular Orbital and Electrostatic Potential Analysis
The spatial distributions of the frontier molecular orbitals and the molecular electrostatic potential were examined for the optimized neutral species. The electronic structure obtained at the MN12SX/def2-SVP level with the SMD solvation model for water was used consistently for this analysis.
Following the electronic-structure calculation of each neutral system, Gaussian cube files were generated from the corresponding checkpoint file without performing additional geometry optimizations. The electron density, electrostatic potential, HOMO, and LUMO cube files were generated using the Cube keyword with a medium grid resolution. The molecular geometry and molecular orbital information were read directly from the checkpoint file, thereby ensuring that the graphical representations corresponded to the same neutral electronic structure employed in the CDFT analysis.
The HOMO and LUMO distributions were examined to identify the molecular regions predominantly involved in the electron-removal and electron-addition responses, respectively. These orbital representations were considered together with the local CDFT descriptors described in Section 2.4, providing complementary information on the spatial localization of the electronic response.
The molecular electrostatic potential (ESP) was generated from the neutral electronic structure and mapped onto the corresponding electron-density surface using GaussView. The resulting ESP maps provide a qualitative representation of the spatial distribution of electrostatic regions over the molecular surface and complement the frontier-orbital and local-reactivity analyses.
The HOMO and LUMO cube files and the ESP mapped onto the electron-density surface were visualized using GaussView. The resulting representations were employed in Figure 1, Figure 2, Figure 3, Figure 4, Figure 5, Figure 6, Figure 7, Figure 8, Figure 9 and Figure 10 to facilitate comparison among the five A/B congener pairs.
2.7. ADMET Prediction
The pharmacokinetic and toxicity profiles of the ten investigated cyclic peptides and depsipeptides were evaluated using the pkCSM platform, a graph-based computational approach for the prediction of small-molecule Absorption, Distribution, Metabolism, Excretion, and Toxicity (ADMET) properties [35].
For each compound, the corresponding SMILES representation was retrieved from the PubChem database [36] and used as molecular input for the pkCSM web server. The SMILES strings were submitted individually through the pkCSM prediction interface, and the complete ADMET prediction mode was selected to obtain the available absorption, distribution, metabolism, excretion, and toxicity endpoints.
The predicted absorption properties included water solubility, Caco-2 permeability, human intestinal absorption, skin permeability, and P-glycoprotein substrate and inhibitor behavior. Distribution-related predictions comprised the steady-state volume of distribution (VDss), fraction unbound, blood–brain barrier (BBB) permeability, and central nervous system (CNS) permeability. Metabolic properties included predicted substrate or inhibitory behavior toward the principal cytochrome P450 isoforms considered by pkCSM. Total clearance and renal organic cation transporter 2 (OCT2) substrate behavior were included as excretion parameters.
The toxicity profile comprised Ames mutagenicity, maximum tolerated dose, hERG I and hERG II inhibition, acute and chronic oral rat toxicity, hepatotoxicity, skin sensitization, Tetrahymena pyriformis toxicity, and minnow toxicity. Both numerical and categorical predictions were retained as reported by pkCSM, together with their corresponding units.
The resulting ADMET profiles were used as in silico estimates to compare the pharmacokinetic and toxicological behavior of the five A/B congener pairs. These predictions were interpreted as complementary to, rather than as direct consequences of, the electronic-reactivity descriptors obtained from the GQM/CDFT analysis.

Table 1.
Predicted ADMET profile of Callipeltins A and B
| Property | Model Name | Callipeltin A | Callipeltin B | Unit |
|---|---|---|---|---|
| Absorption | Water solubility | -2.892 | -2.887 | Numeric (log mol/L) |
| Absorption | Caco-2 permeability | -0.520 | -0.118 | Numeric (log Papp in 10−6 cm/s) |
| Absorption | Intestinal absorption (human) | 0 | 0 | Numeric (% Absorbed) |
| Absorption | Skin permeability | -2.735 | -2.735 | Numeric (log Kp) |
| Absorption | P-glycoprotein substrate | Yes | Yes | Categorical (Yes/No) |
| Absorption | P-glycoprotein I inhibitor | No | No | Categorical (Yes/No) |
| Absorption | P-glycoprotein II inhibitor | No | No | Categorical (Yes/No) |
| Distribution | VDss (human) | -0.619 | -0.387 | Numeric (log L/kg) |
| Distribution | Fraction unbound (human) | 0.399 | 0.506 | Numeric (Fu) |
| Distribution | BBB permeability | -3.183 | -2.487 | Numeric (log BB) |
| Distribution | CNS permeability | -6.863 | -5.027 | Numeric (log PS) |
| Metabolism | CYP2D6 substrate | No | No | Categorical (Yes/No) |
| Metabolism | CYP3A4 substrate | Yes | No | Categorical (Yes/No) |
| Metabolism | CYP1A2 inhibitor | No | No | Categorical (Yes/No) |
| Metabolism | CYP2C19 inhibitor | No | No | Categorical (Yes/No) |
| Metabolism | CYP2C9 inhibitor | No | No | Categorical (Yes/No) |
| Metabolism | CYP2D6 inhibitor | No | No | Categorical (Yes/No) |
| Metabolism | CYP3A4 inhibitor | No | No | Categorical (Yes/No) |
| Excretion | Total Clearance | -2.442 | -1.624 | Numeric (log ml/min/kg) |
| Excretion | Renal OCT2 substrate | No | No | Categorical (Yes/No) |
| Toxicity | Ames toxicity | No | No | Categorical (Yes/No) |
| Toxicity | Max. tolerated dose (human) | 0.445 | 0.480 | Numeric (log mg/kg/day) |
| Toxicity | hERG I inhibitor | No | No | Categorical (Yes/No) |
| Toxicity | hERG II inhibitor | Yes | Yes | Categorical (Yes/No) |
| Toxicity | Oral Rat Acute Toxicity (LD50) | 2.482 | 2.483 | Numeric (mol/kg) |
| Toxicity | Oral Rat Chronic Toxicity (LOAEL) | 6.505 | 5.153 | Numeric (log mg/kg_bw/day) |
| Toxicity | Hepatotoxicity | Yes | Yes | Categorical (Yes/No) |
| Toxicity | Skin Sensitization | No | No | Categorical (Yes/No) |
| Toxicity | T.Pyriformis toxicity | 0.285 | 0.285 | Numeric (log g/L) |
| Toxicity | Minnow toxicity | 20.595 | 16.316 | Numeric (log mM) |
Table 2.
Predicted ADMET profile of Calyxamides A and B
| Property | Model Name | Calyxamide A | Calyxamide B | Unit |
|---|---|---|---|---|
| Absorption | Water solubility | -2.909 | -2.909 | Numeric (log mol/L) |
| Absorption | Caco-2 permeability | 0.669 | 0.669 | Numeric (log Papp in 10−6 cm/s) |
| Absorption | Intestinal absorption (human) | 0 | 0 | Numeric (% Absorbed) |
| Absorption | Skin permeability | -2.735 | -2.735 | Numeric (log Kp) |
| Absorption | P-glycoprotein substrate | Yes | Yes | Categorical (Yes/No) |
| Absorption | P-glycoprotein I inhibitor | Yes | Yes | Categorical (Yes/No) |
| Absorption | P-glycoprotein II inhibitor | No | No | Categorical (Yes/No) |
| Distribution | VDss (human) | -0.061 | -0.061 | Numeric (log L/kg) |
| Distribution | Fraction unbound (human) | 0.246 | 0.246 | Numeric (Fu) |
| Distribution | BBB permeability | -2.134 | -2.134 | Numeric (log BB) |
| Distribution | CNS permeability | -5.358 | -5.358 | Numeric (log PS) |
| Metabolism | CYP2D6 substrate | No | No | Categorical (Yes/No) |
| Metabolism | CYP3A4 substrate | No | No | Categorical (Yes/No) |
| Metabolism | CYP1A2 inhibitor | No | No | Categorical (Yes/No) |
| Metabolism | CYP2C19 inhibitor | No | No | Categorical (Yes/No) |
| Metabolism | CYP2C9 inhibitor | No | No | Categorical (Yes/No) |
| Metabolism | CYP2D6 inhibitor | No | No | Categorical (Yes/No) |
| Metabolism | CYP3A4 inhibitor | No | No | Categorical (Yes/No) |
| Excretion | Total Clearance | -0.443 | -0.443 | Numeric (log ml/min/kg) |
| Excretion | Renal OCT2 substrate | No | No | Categorical (Yes/No) |
| Toxicity | Ames toxicity | No | No | Categorical (Yes/No) |
| Toxicity | Max. tolerated dose (human) | 0.758 | 0.758 | Numeric (log mg/kg/day) |
| Toxicity | hERG I inhibitor | No | No | Categorical (Yes/No) |
| Toxicity | hERG II inhibitor | Yes | Yes | Categorical (Yes/No) |
| Toxicity | Oral Rat Acute Toxicity (LD50) | 2.622 | 2.622 | Numeric (mol/kg) |
| Toxicity | Oral Rat Chronic Toxicity (LOAEL) | 4.510 | 4.510 | Numeric (log mg/kg_bw/day) |
| Toxicity | Hepatotoxicity | Yes | Yes | Categorical (Yes/No) |
| Toxicity | Skin Sensitization | No | No | Categorical (Yes/No) |
| Toxicity | T.Pyriformis toxicity | 0.285 | 0.285 | Numeric (log g/L) |
| Toxicity | Minnow toxicity | 9.713 | 9.713 | Numeric (log mM) |
Table 3.
Predicted ADMET profile of Rolloamides A and B
| Property | Model Name | Rolloamide A | Rolloamide B | Unit |
|---|---|---|---|---|
| Absorption | Water solubility | -3.279 | -3.367 | Numeric (log mol/L) |
| Absorption | Caco-2 permeability | 0.820 | 1.013 | Numeric (log Papp in 10−6 cm/s) |
| Absorption | Intestinal absorption (human) | 48.454 | 41.672 | Numeric (% Absorbed) |
| Absorption | Skin permeability | -2.735 | -2.735 | Numeric (log Kp) |
| Absorption | P-glycoprotein substrate | Yes | Yes | Categorical (Yes/No) |
| Absorption | P-glycoprotein I inhibitor | Yes | Yes | Categorical (Yes/No) |
| Absorption | P-glycoprotein II inhibitor | No | No | Categorical (Yes/No) |
| Distribution | VDss (human) | -0.346 | -0.806 | Numeric (log L/kg) |
| Distribution | Fraction unbound (human) | 0.253 | 0.285 | Numeric (Fu) |
| Distribution | BBB permeability | -0.358 | -0.517 | Numeric (log BB) |
| Distribution | CNS permeability | -2.941 | -3.404 | Numeric (log PS) |
| Metabolism | CYP2D6 substrate | No | No | Categorical (Yes/No) |
| Metabolism | CYP3A4 substrate | Yes | Yes | Categorical (Yes/No) |
| Metabolism | CYP1A2 inhibitor | No | No | Categorical (Yes/No) |
| Metabolism | CYP2C19 inhibitor | No | No | Categorical (Yes/No) |
| Metabolism | CYP2C9 inhibitor | No | No | Categorical (Yes/No) |
| Metabolism | CYP2D6 inhibitor | No | No | Categorical (Yes/No) |
| Metabolism | CYP3A4 inhibitor | No | No | Categorical (Yes/No) |
| Excretion | Total Clearance | -0.485 | 0.845 | Numeric (log ml/min/kg) |
| Excretion | Renal OCT2 substrate | No | No | Categorical (Yes/No) |
| Toxicity | Ames toxicity | No | No | Categorical (Yes/No) |
| Toxicity | Max. tolerated dose (human) | -0.033 | -0.104 | Numeric (log mg/kg/day) |
| Toxicity | hERG I inhibitor | No | No | Categorical (Yes/No) |
| Toxicity | hERG II inhibitor | Yes | Yes | Categorical (Yes/No) |
| Toxicity | Oral Rat Acute Toxicity (LD50) | 2.734 | 2.826 | Numeric (mol/kg) |
| Toxicity | Oral Rat Chronic Toxicity (LOAEL) | 3.891 | 3.848 | Numeric (log mg/kg_bw/day) |
| Toxicity | Hepatotoxicity | Yes | Yes | Categorical (Yes/No) |
| Toxicity | Skin Sensitization | No | No | Categorical (Yes/No) |
| Toxicity | T.Pyriformis toxicity | 0.285 | 0.285 | Numeric (log g/L) |
| Toxicity | Minnow toxicity | 9.282 | 10.069 | Numeric (log mM) |
Table 4.
Predicted ADMET profile of Tamandarins A and B
| Property | Model Name | Tamandarin A | Tamandarin B | Unit |
|---|---|---|---|---|
| Absorption | Water solubility | -2.919 | -2.930 | Numeric (log mol/L) |
| Absorption | Caco-2 permeability | 0.900 | 1.077 | Numeric (log Papp in 10−6 cm/s) |
| Absorption | Intestinal absorption (human) | 25.817 | 30.346 | Numeric (% Absorbed) |
| Absorption | Skin permeability | -2.735 | -2.735 | Numeric (log Kp) |
| Absorption | P-glycoprotein substrate | Yes | Yes | Categorical (Yes/No) |
| Absorption | P-glycoprotein I inhibitor | Yes | Yes | Categorical (Yes/No) |
| Absorption | P-glycoprotein II inhibitor | No | No | Categorical (Yes/No) |
| Distribution | VDss (human) | -0.075 | -0.172 | Numeric (log L/kg) |
| Distribution | Fraction unbound (human) | 0.252 | 0.212 | Numeric (Fu) |
| Distribution | BBB permeability | -1.463 | -1.458 | Numeric (log BB) |
| Distribution | CNS permeability | -3.661 | -3.314 | Numeric (log PS) |
| Metabolism | CYP2D6 substrate | No | No | Categorical (Yes/No) |
| Metabolism | CYP3A4 substrate | Yes | Yes | Categorical (Yes/No) |
| Metabolism | CYP1A2 inhibitor | No | No | Categorical (Yes/No) |
| Metabolism | CYP2C19 inhibitor | No | No | Categorical (Yes/No) |
| Metabolism | CYP2C9 inhibitor | No | No | Categorical (Yes/No) |
| Metabolism | CYP2D6 inhibitor | No | No | Categorical (Yes/No) |
| Metabolism | CYP3A4 inhibitor | No | No | Categorical (Yes/No) |
| Excretion | Total Clearance | 0.349 | 0.253 | Numeric (log ml/min/kg) |
| Excretion | Renal OCT2 substrate | No | No | Categorical (Yes/No) |
| Toxicity | Ames toxicity | No | No | Categorical (Yes/No) |
| Toxicity | Max. tolerated dose (human) | 0.099 | -0.110 | Numeric (log mg/kg/day) |
| Toxicity | hERG I inhibitor | No | No | Categorical (Yes/No) |
| Toxicity | hERG II inhibitor | Yes | Yes | Categorical (Yes/No) |
| Toxicity | Oral Rat Acute Toxicity (LD50) | 2.689 | 2.774 | Numeric (mol/kg) |
| Toxicity | Oral Rat Chronic Toxicity (LOAEL) | 4.471 | 2.889 | Numeric (log mg/kg_bw/day) |
| Toxicity | Hepatotoxicity | Yes | Yes | Categorical (Yes/No) |
| Toxicity | Skin Sensitization | No | No | Categorical (Yes/No) |
| Toxicity | T.Pyriformis toxicity | 0.285 | 0.285 | Numeric (log g/L) |
| Toxicity | Minnow toxicity | 11.357 | 8.393 | Numeric (log mM) |
Table 5.
Predicted ADMET profile of Pipecolidepsins A and B
| Property | Model Name | Pipecolidepsin A | Pipecolidepsin B | Unit |
|---|---|---|---|---|
| Absorption | Water solubility | -2.892 | -2.892 | Numeric (log mol/L) |
| Absorption | Caco-2 permeability | -0.259 | -0.361 | Numeric (log Papp in 10−6 cm/s) |
| Absorption | Intestinal absorption (human) | 0 | 0 | Numeric (% Absorbed) |
| Absorption | Skin permeability | -2.735 | -2.735 | Numeric (log Kp) |
| Absorption | P-glycoprotein substrate | No | No | Categorical (Yes/No) |
| Absorption | P-glycoprotein I inhibitor | No | No | Categorical (Yes/No) |
| Absorption | P-glycoprotein II inhibitor | No | No | Categorical (Yes/No) |
| Distribution | VDss (human) | -0.318 | -0.291 | Numeric (log L/kg) |
| Distribution | Fraction unbound (human) | 0.359 | 0.360 | Numeric (Fu) |
| Distribution | BBB permeability | -3.098 | -3.255 | Numeric (log BB) |
| Distribution | CNS permeability | -6.612 | -6.852 | Numeric (log PS) |
| Metabolism | CYP2D6 substrate | No | No | Categorical (Yes/No) |
| Metabolism | CYP3A4 substrate | No | No | Categorical (Yes/No) |
| Metabolism | CYP1A2 inhibitor | No | No | Categorical (Yes/No) |
| Metabolism | CYP2C19 inhibitor | No | No | Categorical (Yes/No) |
| Metabolism | CYP2C9 inhibitor | No | No | Categorical (Yes/No) |
| Metabolism | CYP2D6 inhibitor | No | No | Categorical (Yes/No) |
| Metabolism | CYP3A4 inhibitor | No | No | Categorical (Yes/No) |
| Excretion | Total Clearance | -2.752 | -2.870 | Numeric (log ml/min/kg) |
| Excretion | Renal OCT2 substrate | No | No | Categorical (Yes/No) |
| Toxicity | Ames toxicity | No | No | Categorical (Yes/No) |
| Toxicity | Max. tolerated dose (human) | 0.441 | 0.441 | Numeric (log mg/kg/day) |
| Toxicity | hERG I inhibitor | No | No | Categorical (Yes/No) |
| Toxicity | hERG II inhibitor | No | No | Categorical (Yes/No) |
| Toxicity | Oral Rat Acute Toxicity (LD50) | 2.482 | 2.482 | Numeric (mol/kg) |
| Toxicity | Oral Rat Chronic Toxicity (LOAEL) | 7.580 | 7.551 | Numeric (log mg/kg_bw/day) |
| Toxicity | Hepatotoxicity | Yes | Yes | Categorical (Yes/No) |
| Toxicity | Skin Sensitization | No | No | Categorical (Yes/No) |
| Toxicity | T.Pyriformis toxicity | 0.285 | 0.285 | Numeric (log g/L) |
| Toxicity | Minnow toxicity | 33.427 | 34.362 | Numeric (log mM) |
3. Results and Discussion
3.1. Molecular and Electronic Structure
The optimized structures and the corresponding frontier molecular orbital and electrostatic potential representations of the ten investigated cyclic peptides and depsipeptides are shown in Figure 1, Figure 2, Figure 3, Figure 4, Figure 5, Figure 6, Figure 7, Figure 8, Figure 9 and Figure 10. The molecular set comprises five structurally related A/B congener pairs, allowing the electronic consequences of relatively localized structural modifications to be examined within otherwise closely related molecular frameworks.
Inspection of the frontier molecular orbitals reveals that the HOMO and LUMO distributions are generally localized over specific molecular regions rather than uniformly delocalized throughout the complete peptide or depsipeptide framework. Moreover, the regions contributing predominantly to the HOMO and LUMO are not necessarily coincident. This spatial differentiation is consistent with the existence of distinct regions involved in electron-removal and electron-addition processes and provides a qualitative electronic-structure counterpart to the branch-specific reactivity description introduced within the GQM framework.
Comparison within the individual A/B pairs shows that structural similarity does not necessarily lead to identical frontier-orbital distributions. Although the overall molecular frameworks are retained within each congener pair, changes in the localization and spatial extension of the HOMO and LUMO can be observed. These differences are particularly relevant because they indicate that relatively limited structural modifications may redistribute the frontier electronic density without requiring major changes in the overall molecular architecture. The quantitative consequences of these changes for the electron-removal and electron-addition branches are examined through the GQM/KID descriptors in Section 3.2 and 3.3.
The ESP maps further demonstrate the heterogeneous electronic character of the molecular surfaces. Regions of different electrostatic potential are distributed over the peptide and depsipeptide frameworks, reflecting the presence and spatial arrangement of the chemically distinct functional groups. The ESP representations therefore complement the frontier-orbital analysis by describing the electrostatic heterogeneity of the molecular surface, whereas the HOMO and LUMO distributions identify the regions most directly associated with the frontier electronic structure.
Taken together, the molecular orbital and ESP representations show that the investigated marine peptides possess electronically heterogeneous surfaces and spatially differentiated frontier-orbital regions. Importantly, the visual comparison of the A/B congeners suggests that structural similarity at the molecular level can coexist with differences in the spatial organization of the frontier electronic density. These qualitative features provide the structural and electronic context for the quantitative GQM/KID analysis and the atom-resolved Fukui-function analysis discussed in the following sections.
3.2. Global Electronic Reactivity Within the GQM/KID Framework
The global electronic-reactivity descriptors obtained within the GQM framework are summarized in Table 6. The vertical ionization energies span from 5.474 eV for Calyxamide A to 6.705 eV for Rolloamide B, whereas the electron affinities range from 0.709 eV for Rolloamide B to 2.276 eV for Calyxamide B. Thus, although all the investigated systems belong to the same broad class of marine cyclic peptides and depsipeptides, their responses toward electron removal and electron addition cover appreciably different energetic ranges.
A close correspondence is generally observed between the vertical ionization energies and the negative HOMO energies. This behavior is reflected in the relatively small values, which range from 0.0088 eV for Callipeltin B to 0.0414 eV for Pipecolidepsin A. The electron-addition branch also exhibits generally small deviations, although with a somewhat broader variation. The values range from only 0.0002 eV for Tamandarin A to 0.0527 eV for Calyxamide A. Consequently, all ten systems remain relatively close to the corresponding branchwise linear conditions, while the degree of agreement is clearly dependent on both the molecular system and the charge-transfer direction.
The GQM curvature parameters provide the signed counterpart of these KID deviations. As established in Section 2.5, their absolute magnitudes satisfy and . Accordingly, the small KID deviations are directly reflected in the generally small curvature magnitudes shown in Table 6. The signed quantities, however, provide additional information by distinguishing the direction of the deviation from the corresponding linear condition. Most systems display positive values, with Rolloamide A being the exception, whereas both positive and negative values of occur across the molecular set.
Tamandarin A represents the closest approach to the linear condition in the electron-addition branch, with eV and eV. In contrast, Calyxamide A exhibits the largest electron-addition deviation, with eV and eV. For the electron-removal branch, the largest deviations are found for the two Pipecolidepsins, with values close to 0.041 eV and corresponding values of approximately 0.082 eV. These results illustrate that proximity to the branchwise linear limit is not a uniform molecular property but may differ substantially between electron removal and electron addition within the same compound.
An additional feature emerges from the signs of the GQM curvatures. Changes in curvature sign are observed for some closely related congeners, most notably in the Rolloamide and Pipecolidepsin series for the electron-addition branch, while Rolloamide A also displays a negative electron-removal curvature. Because and contain only the absolute deviations, these directional differences would not be apparent from the KID measures alone. The combined GQM/KID description therefore provides both the magnitude and the direction of the departure from branchwise linearity.
Overall, the results demonstrate that the frontier-orbital and finite-difference descriptions are mutually consistent to a high degree for the investigated molecular set, while retaining sufficient branch-specific variation to differentiate their electronic responses. The extent to which these differences arise from the structural modifications distinguishing each A/B congener pair is examined explicitly in Section 3.3.
Table 6.
Global electronic-reactivity and KID consistency descriptors obtained within the GQM framework for the investigated cyclic peptides and depsipeptides. All energy quantities are given in eV.
Table 6.
Global electronic-reactivity and KID consistency descriptors obtained within the GQM framework for the investigated cyclic peptides and depsipeptides. All energy quantities are given in eV.
| Compound | I | A | ||||||
|---|---|---|---|---|---|---|---|---|
| Callipeltin A | 5.831 | 1.245 | -5.797 | -1.235 | 0.0343 | 0.0097 | 0.0686 | -0.0194 |
| Callipeltin B | 5.981 | 0.937 | -5.972 | -0.934 | 0.0088 | 0.0029 | 0.0177 | -0.0059 |
| Calyxamide A | 5.474 | 2.262 | -5.455 | -2.315 | 0.0186 | 0.0527 | 0.0373 | 0.1053 |
| Calyxamide B | 5.587 | 2.276 | -5.570 | -2.306 | 0.0170 | 0.0300 | 0.0341 | 0.0600 |
| Rolloamide A | 6.072 | 0.996 | -6.082 | -1.018 | 0.0099 | 0.0216 | -0.0198 | 0.0431 |
| Rolloamide B | 6.705 | 0.709 | -6.694 | -0.703 | 0.0113 | 0.0059 | 0.0226 | -0.0118 |
| Tamandarin A | 6.212 | 1.237 | -6.202 | -1.237 | 0.0105 | 0.0002 | 0.0210 | 0.0004 |
| Tamandarin B | 6.121 | 1.020 | -6.104 | -1.028 | 0.0169 | 0.0080 | 0.0338 | 0.0159 |
| Pipecolidepsin A | 6.329 | 0.889 | -6.288 | -0.895 | 0.0414 | 0.0059 | 0.0827 | 0.0118 |
| Pipecolidepsin B | 6.324 | 1.045 | -6.283 | -1.030 | 0.0408 | 0.0146 | 0.0815 | -0.0292 |
3.3. Pairwise Electronic Effects Within the A/B Congener Series
To examine more directly the electronic consequences of the structural differences within each congener pair, the changes in the principal global descriptors were evaluated as . The resulting pairwise differences are summarized in Table 7. The comparison reveals that the transition from congener A to congener B does not produce a common electronic response across the five molecular families. Instead, both the magnitude and the direction of the changes depend strongly on the particular congener pair and on whether electron removal or electron addition is considered.
Table 7.
Pairwise changes in the global electronic-reactivity and KID descriptors upon going from congener A to congener B. Differences are defined as . All quantities are given in eV.
Table 7.
Pairwise changes in the global electronic-reactivity and KID descriptors upon going from congener A to congener B. Differences are defined as . All quantities are given in eV.
| Congener Pair | ||||||
|---|---|---|---|---|---|---|
| Callipeltin | 0.150 | -0.307 | -0.175 | 0.301 | -0.0254 | -0.0068 |
| Calyxamide | 0.113 | 0.014 | -0.115 | 0.009 | -0.0016 | -0.0226 |
| Rolloamide | 0.633 | -0.287 | -0.612 | 0.315 | 0.0014 | -0.0157 |
| Tamandarin | -0.091 | -0.217 | 0.097 | 0.210 | 0.0064 | 0.0078 |
| Pipecolidepsin | -0.005 | 0.155 | 0.005 | -0.135 | -0.0006 | 0.0087 |
For the Callipeltins, the A-to-B modification increases the ionization energy by 0.150 eV while decreasing the electron affinity by 0.307 eV. These changes are accompanied by a stabilization of the HOMO by 0.175 eV and a destabilization of the LUMO by 0.301 eV. Particularly noteworthy is the simultaneous reduction of both KID deviations: decreases by 0.0254 eV and by 0.0068 eV. Thus, Callipeltin B approaches the corresponding branchwise linear conditions more closely than Callipeltin A for both electron removal and electron addition.
The Calyxamides display a different pattern. The A-to-B transition produces only a very small change in electron affinity and LUMO energy, whereas the ionization energy increases by 0.113 eV and the HOMO is stabilized by approximately 0.115 eV. The electron-removal consistency is essentially preserved, as indicated by the small change in , while decreases by 0.0226 eV. The principal GQM/KID consequence of the structural difference within this pair is therefore associated with the electron-addition branch rather than with electron removal.
The Rolloamides exhibit the largest pairwise electronic reorganization within the investigated series. From Rolloamide A to Rolloamide B, the ionization energy increases by 0.633 eV and the HOMO decreases by 0.612 eV, whereas the electron affinity decreases by 0.287 eV and the LUMO increases by 0.315 eV. Despite these comparatively large changes in the frontier and finite-difference energies, changes by only 0.0014 eV, whereas decreases by 0.0157 eV. Furthermore, the signed GQM curvatures change from negative to positive for and from positive to negative for . The Rolloamide pair thus illustrates that substantial shifts in the underlying electronic energies can coexist with relatively small absolute KID deviations.
The Tamandarins show the opposite trend with respect to the KID consistency measures. The transition from Tamandarin A to Tamandarin B decreases the ionization energy by 0.091 eV and the electron affinity by 0.217 eV, while shifting both frontier orbital energies upward. In this case, both and increase. The change in the electron-addition branch is particularly significant because Tamandarin A is extremely close to the corresponding linear condition, whereas Tamandarin B exhibits a larger, although still small, deviation. Thus, the structural modification distinguishing the two congeners moves the electron-addition response away from the nearly linear behavior observed for Tamandarin A.
Finally, the Pipecolidepsins display a remarkably conserved electron-removal response. The A-to-B differences in ionization energy and HOMO energy are only -0.005 and 0.005 eV, respectively, while changes by less than 0.001 eV. In contrast, the electron-addition branch is more sensitive: the electron affinity increases by 0.155 eV, the LUMO is stabilized by 0.135 eV, and increases by 0.0087 eV. Consistent with this change, reverses sign between Pipecolidepsin A and Pipecolidepsin B, whereas remains positive and nearly unchanged.
Taken together, the pairwise analysis demonstrates that the structural differences separating the A and B congeners affect the two electronic branches in distinct ways. Callipeltins show improved agreement with the branchwise linear conditions in both directions, Calyxamides are differentiated mainly through the electron-addition branch, Rolloamides undergo the largest overall frontier-energy reorganization, Tamandarins move away from the nearly linear electron-addition behavior of congener A, and Pipecolidepsins preserve an almost invariant electron-removal response while displaying a more responsive electron-addition branch. These family-dependent effects provide the global electronic context for the atom-resolved reactivity analysis presented in Section 3.4.
3.4. Local Reactivity Patterns and Fukui-Function Analysis
The global electronic-reactivity analysis was complemented by the atom-resolved Fukui functions in order to determine how the electron-addition and electron-removal responses are distributed throughout the molecular frameworks. For all ten systems, the sums of the grouped , , and functions were essentially equal to unity, confirming the numerical consistency of the condensed local-reactivity analysis. The dominant atomic contributions are summarized in Table 8. Overall, the results reveal markedly family-dependent patterns, ranging from a pronounced spatial separation of the two electronic-response branches to substantial overlap between them.
The Callipeltins display a clear differentiation between the electron-addition and electron-removal responses. In Callipeltin A, the largest contributions occur at C89, O17, C95, C86, and O18, whereas is dominated by N33, N37, and N38, followed by C97 and C106. A closely related pattern is obtained for Callipeltin B: C50, O9, C70, C68, and C62 dominate , while N25, N23, and N26 provide the largest contributions. Thus, despite the different atom numbering and structural differences between the congeners, both molecules exhibit a common qualitative organization in which electron addition is preferentially associated with carbon/oxygen-containing regions, whereas electron removal is strongly concentrated on nitrogen-containing regions.
Table 8.
Dominant atomic centers for the electron-addition () and electron-removal () responses of the investigated cyclic peptides and depsipeptides. The five largest contributions for each response are reported.
Table 8.
Dominant atomic centers for the electron-addition () and electron-removal () responses of the investigated cyclic peptides and depsipeptides. The five largest contributions for each response are reported.
| Compound | Top Centers | Top Centers |
|---|---|---|
| Callipeltin A | C89 (0.124) O17 (0.093) C95 (0.076) C86 (0.073) O18 (0.071) |
N33 (0.233) N37 (0.232) N38 (0.176) C97 (0.124) C106 (0.106) |
| Callipeltin B | C50 (0.138) O9 (0.095) C70 (0.082) C68 (0.077) C62 (0.076) |
N25 (0.212) N23 (0.187) N26 (0.164) C65 (0.122) C73 (0.083) |
| Calyxamide A | O13 (0.172) C39 (0.143) C40 (0.127) O14 (0.089) N18 (0.056) |
C67 (0.210) C59 (0.120) N21 (0.116) C63 (0.111) C62 (0.094) |
| Calyxamide B | C48 (0.236) C50 (0.165) C46 (0.125) C45 (0.094) O47 (0.080) |
C68 (0.214) C65 (0.138) N62 (0.127) C61 (0.103) O69 (0.101) |
| Rolloamide A | C33 (0.166) O6 (0.159) C39 (0.136) C40 (0.074) C45 (0.074) |
N9 (0.214) C23 (0.172) C33 (0.131) C20 (0.075) C16 (0.064) |
| Rolloamide B | C52 (0.245) C53 (0.187) C51 (0.106) C55 (0.093) C54 (0.091) |
C55 (0.169) C52 (0.134) C51 (0.093) C37 (0.083) C53 (0.071) |
| Tamandarin A | C50 (0.201) O11 (0.145) C70 (0.070) C47 (0.058) C36 (0.057) |
C72 (0.155) C73 (0.135) O14 (0.127) C71 (0.116) C75 (0.099) |
| Tamandarin B | C47 (0.145) O10 (0.138) C36 (0.087) C70 (0.064) C44 (0.056) |
C72 (0.137) C71 (0.131) O14 (0.110) C69 (0.104) C70 (0.098) |
| Pipecolidepsin A | C94 (0.148) O96 (0.106) C92 (0.056) C69 (0.026) O95 (0.025) |
N68 (0.662) C67 (0.221) C66 (0.065) C65 (0.031) C26 (0.010) |
| Pipecolidepsin B | C34 (0.213) O36 (0.135) C33 (0.108) C9 (0.103) O35 (0.084) |
N68 (0.660) C67 (0.225) C66 (0.061) C65 (0.032) C26 (0.010) |
The Calyxamides also exhibit a substantial differentiation between the two response directions, although their local patterns are chemically more heterogeneous. For Calyxamide A, the principal contributions are associated with O13, C39, C40, O14, and N18, whereas the largest values occur at C67, C59, N21, C63, and C62. In Calyxamide B, becomes more strongly concentrated on a carbon-rich region, particularly C48, C50, C46, and C45, with additional contributions from O47 and S51. In contrast, the electron-removal response is distributed among C68, C65, N62, C61, and O69. The A-to-B modification therefore changes the detailed localization of the electron-addition response while preserving the broader separation between the dominant regions involved in electron addition and removal.
A distinctly different behavior is found for the Rolloamides, for which the two electronic-response branches show considerably greater spatial overlap. In Rolloamide A, C33 contributes strongly to both and , while additional overlap is observed for several carbon and oxygen centers. This feature becomes particularly pronounced in Rolloamide B. The main centers C52, C53, C51, C55, and C54 also make substantial contributions to , with C55, C52, C51, and C53 appearing among the dominant electron-removal centers. Thus, the pronounced global electronic reorganization identified for the Rolloamide pair in Section 3.3 is accompanied by a redistribution of the local response toward a molecular region that participates appreciably in both electron addition and electron removal.
The Tamandarins show an intermediate pattern combining branch-specific centers with a partially shared response region. In Tamandarin A, C50 and O11 dominate while contributing only weakly to . However, C70, C71, C72, C73, and C47 participate to varying degrees in both response directions. Tamandarin B displays a closely related organization: C47 and O10 are prominent electron-addition centers, whereas C72, C71, O14, C69, and C70 dominate electron removal, with C70 and other carbon centers contributing to both branches. The qualitative conservation of this local organization is noteworthy because Tamandarin A exhibits an exceptionally small and , whereas these quantities increase in Tamandarin B. Consequently, proximity to the global linear electron-addition limit does not imply a spatially uniform local electronic response.
The most striking branch separation is observed for the Pipecolidepsins. For Pipecolidepsin A, the electron-addition response is distributed over several centers, with C94 and O96 providing the largest contributions. In sharp contrast, the electron-removal response is highly localized: N68 alone accounts for approximately 66% of the total response, while N68, C67, C66, and C65 together account for approximately 98%. Remarkably, essentially the same pattern is retained in Pipecolidepsin B. In this congener, N68 contributes approximately 66% of , and the same N68–C67–C66–C65 group accounts for approximately 98% of the total electron-removal response. The descriptor likewise emphasizes the same atomic region in both congeners, with N68 giving by far the largest local contribution. This conservation indicates that the strongly localized electron-removal response is a robust electronic feature of the Pipecolidepsin pair despite the changes observed in the electron-addition branch.
Taken together, the local-reactivity results demonstrate that the global GQM/KID differences arise from distinct family-dependent spatial response patterns. Callipeltins and Pipecolidepsins exhibit pronounced separation between the dominant electron-addition and electron-removal regions, Calyxamides retain substantial branch differentiation with a more heterogeneous atomic composition, Rolloamides show the greatest overlap between the two responses, and Tamandarins display an intermediate organization combining differentiated and shared centers. The global and local descriptors therefore provide complementary levels of description: the GQM/KID quantities characterize the energetics and deviations from linearity of the two electronic branches, whereas the Fukui functions identify the atomic regions through which these responses are preferentially expressed.
3.5. Pharmacokinetic and Toxicological Profiling
The predicted ADMET properties summarized in Table 1, Table 2, Table 3, Table 4 and Table 5 reveal marked family-dependent differences among the investigated cyclic peptides and depsipeptides. Although the compounds share the general structural characteristics of relatively large and conformationally complex marine natural products, their predicted absorption, distribution, metabolism, excretion, and toxicity profiles are not uniform. In several cases, the differences between molecular families are considerably greater than those observed between the corresponding A/B congeners.
The most pronounced differences are found in the absorption-related properties. Callipeltins, Calyxamides, and Pipecolidepsins display negligible predicted human intestinal absorption, with values of 0% for both members of each congener pair. Their predicted Caco-2 permeabilities, however, differ among the families. The Callipeltins and Pipecolidepsins show comparatively low values, whereas the Calyxamides exhibit a Caco-2 permeability of 0.669 for both congeners. In contrast, the Rolloamides display the highest predicted intestinal absorption, with values of 48.454% and 41.672% for Rolloamides A and B, respectively, accompanied by Caco-2 permeabilities of 0.820 and 1.013. The Tamandarins occupy an intermediate position, with predicted intestinal absorption values of 25.817% and 30.346% and Caco-2 permeabilities of 0.900 and 1.077 for congeners A and B, respectively. These results indicate that permeability and intestinal absorption constitute some of the clearest pharmacokinetic discriminators within the investigated molecular set. These differences are particularly relevant for cyclic peptides, for which intestinal absorption and passive membrane permeability represent important and often interdependent considerations in the development of orally bioavailable compounds [37].
The predicted interaction with P-glycoprotein (P-gp) provides an additional distinction among the molecular families. Callipeltins, Calyxamides, Rolloamides, and Tamandarins are predicted to behave as P-gp substrates, whereas neither Pipecolidepsin A nor Pipecolidepsin B is predicted to show this behavior. Furthermore, the Calyxamides, Rolloamides, and Tamandarins are predicted to inhibit P-glycoprotein I, whereas the Callipeltins and Pipecolidepsins are not. None of the ten compounds is predicted to inhibit P-glycoprotein II. Thus, the predicted P-gp behavior further emphasizes that structurally related cyclic peptides and depsipeptides may exhibit substantially different transporter-related profiles.
The distribution-related descriptors also show considerable variation. The predicted blood–brain barrier and central nervous system permeabilities are particularly low for the Callipeltins and Pipecolidepsins. The Rolloamides display substantially less negative BBB permeability values, with log BB values of -0.358 and -0.517 for Rolloamides A and B, respectively, whereas the Tamandarins and Calyxamides occupy intermediate regions of the predicted distribution profile. These values should be interpreted comparatively within the present molecular set rather than as direct evidence of in vivo central nervous system exposure.
The metabolic predictions are characterized by the absence of predicted inhibition of the CYP1A2, CYP2C19, CYP2C9, CYP2D6, and CYP3A4 isoforms for all ten compounds. More variation is observed for CYP3A4 substrate behavior. Both Rolloamides and both Tamandarins are predicted to be CYP3A4 substrates, whereas the Calyxamides and Pipecolidepsins are not. Within the Callipeltin pair, Callipeltin A is predicted to be a CYP3A4 substrate while Callipeltin B is not, providing one of the relatively few categorical pharmacokinetic differences observed between congeners within the same family.
Differences in the predicted total clearance are also evident. The Callipeltins and Pipecolidepsins show negative log clearance values, with particularly low values for the Pipecolidepsins (-2.752 and -2.870). By contrast, Tamandarins A and B display positive values of 0.349 and 0.253, respectively. The Rolloamide pair exhibits the largest intra-family difference, changing from -0.485 for Rolloamide A to 0.845 for Rolloamide B. None of the investigated compounds is predicted to behave as a renal OCT2 substrate.
The toxicity predictions reveal both conserved and family-dependent features. None of the ten compounds is predicted to exhibit Ames mutagenicity or hERG I inhibition, and no skin sensitization is predicted. In contrast, pkCSM predicts a hepatotoxicity liability for all investigated compounds. A particularly notable family-dependent difference is observed for hERG II inhibition: Callipeltins, Calyxamides, Rolloamides, and Tamandarins are predicted as hERG II inhibitors, whereas both Pipecolidepsins are predicted as non-inhibitors. The remaining numerical toxicity endpoints, including the predicted maximum tolerated dose and acute and chronic oral rat toxicity, vary among the molecular families and between some congeners, further illustrating the multidimensional nature of their predicted toxicological profiles.
Overall, the pkCSM results demonstrate that the investigated marine cyclic peptides and depsipeptides cannot be characterized by a single common pharmacokinetic profile. Rolloamides and, to a lesser extent, Tamandarins exhibit the most favorable predicted intestinal absorption within the present molecular set, whereas Callipeltins, Calyxamides, and Pipecolidepsins are predicted to have negligible intestinal absorption. At the same time, potentially relevant liabilities, including P-gp substrate behavior, hERG II inhibition, and predicted hepatotoxicity, show distinct family-dependent patterns.
These predictions should be regarded as comparative in silico estimates rather than experimental pharmacokinetic or toxicological evidence. It should also be recognized that pkCSM was developed primarily for the prediction of small-molecule ADMET properties [35], whereas the cyclic peptides and depsipeptides investigated here occupy a comparatively large and structurally complex molecular space. Accordingly, the numerical predictions should be interpreted with appropriate caution, particularly with regard to the applicability of the underlying predictive models to this class of compounds. Their principal value in the present study is therefore to complement the electronic-reactivity analysis and to provide a comparative computational description of the drug-relevant properties of the ten marine natural products.
3.6. Integration of Electronic Reactivity and ADMET Properties
The combined analysis of the GQM/CDFT and ADMET results provides two complementary perspectives on the investigated marine cyclic peptides and depsipeptides. The electronic descriptors characterize the energetic and spatial responses associated with electron removal and electron addition, whereas the pkCSM predictions describe properties related to absorption, distribution, metabolism, excretion, and toxicity. Comparison of these two levels of description reveals that electronic differentiation between closely related congeners does not necessarily translate into an analogous degree of differentiation in their predicted pharmacokinetic properties.
The Calyxamides provide a particularly clear example of this behavior. Calyxamide A exhibits the largest electron-addition deviation of the molecular set, with eV and eV, whereas these quantities decrease to 0.0300 and 0.0600 eV, respectively, for Calyxamide B. Their local electron-addition responses also differ, with Calyxamide B displaying a stronger concentration of on a carbon-rich molecular region. Nevertheless, the pkCSM predictions for the two congeners are essentially identical across the reported ADMET endpoints. Thus, the electronic-structure analysis is sensitive to differences between the two Calyxamides that are not reflected by the present pharmacokinetic prediction model.
The Rolloamides illustrate a different situation. This pair displays the largest A-to-B changes in ionization energy and frontier-orbital energies among the investigated congeners, together with changes in the signs of the GQM curvatures. The local analysis further reveals a pronounced overlap between the electron-addition and electron-removal responses in Rolloamide B. These electronic differences are accompanied by changes in several predicted ADMET properties, including Caco-2 permeability, intestinal absorption, distribution, and particularly total clearance. However, the individual pharmacokinetic quantities do not change in a uniform direction. The simultaneous occurrence of electronic and ADMET differentiation therefore does not establish a direct correspondence between any individual CDFT descriptor and a particular pharmacokinetic endpoint.
The Tamandarins provide an additional illustration of the distinction between global electronic behavior and predicted pharmacokinetic properties. Tamandarin A is exceptionally close to the linear electron-addition condition, with eV and eV, whereas Tamandarin B shows a larger deviation. Despite this pronounced relative difference in the GQM/KID description, both compounds retain qualitatively similar local-reactivity patterns and broadly comparable ADMET profiles. The exceptionally small curvature of Tamandarin A should therefore be interpreted as a feature of its electronic response rather than as an indicator of intrinsically superior pharmacokinetic behavior.
The Pipecolidepsins provide perhaps the clearest example of conservation at both the local electronic and pharmacokinetic levels. In both congeners, approximately 98% of the electron-removal Fukui response is concentrated on the same N68–C67–C66–C65 region, with N68 alone accounting for approximately 66%. Their electron-removal KID deviations are also very similar, with values close to 0.041 eV. At the same time, the two compounds display highly similar predicted ADMET profiles, including negligible intestinal absorption, absence of predicted P-gp substrate behavior, low BBB and CNS permeabilities, and absence of predicted hERG II inhibition. Although this parallel conservation is noteworthy, it should not be interpreted as evidence that the localized electronic response determines the pharmacokinetic behavior; rather, both sets of descriptors indicate a high degree of similarity between the two congeners from their respective computational perspectives.
Taken together, these comparisons indicate that no simple one-to-one relationship emerges between the GQM/CDFT descriptors and the pkCSM endpoints for the present molecular set. This is not unexpected because the two approaches encode fundamentally different aspects of molecular behavior. The GQM and Fukui-function analyses describe intrinsic electronic responses at the quantum-chemical level, whereas ADMET predictions integrate structural features through statistical models trained against pharmacokinetic and toxicological data. Their value in the present context therefore lies in their complementarity rather than in their redundancy.
From a computational drug-discovery perspective, this complementarity is particularly relevant. Electronic-reactivity descriptors can distinguish closely related molecules even when their predicted ADMET profiles are nearly indistinguishable, as observed for the Calyxamides, while ADMET models can identify pharmacokinetic differences that cannot be inferred from electronic reactivity alone. A multidimensional assessment combining electronic response, local reactivity, and predicted pharmacokinetic behavior therefore provides a more informative characterization of these marine natural products than any of these computational descriptions considered in isolation.
3.7. Implications for Computer-Aided Drug Discovery
The results obtained in this study illustrate the potential value of combining Conceptual DFT descriptors with in silico pharmacokinetic profiling in the computational characterization of structurally complex marine natural products, consistent with the broader use of CDFT as a complementary component of modern computational drug-discovery strategies [19]. In this context, the GQM framework provides a branch-specific description of the electronic response that distinguishes electron-removal and electron-addition processes, while the atom-resolved Fukui functions identify the molecular regions through which these responses are preferentially expressed. These electronic descriptors therefore provide information that is not directly contained in conventional structure-based pharmacokinetic predictions.
This distinction may be particularly useful when closely related natural products are considered. The comparisons between A/B congeners show that relatively limited structural modifications can produce measurable changes in global electronic descriptors and substantial redistribution of local reactivity, even when the corresponding predicted ADMET profiles remain largely unchanged. Conversely, differences in pharmacokinetic predictions cannot necessarily be anticipated from the electronic descriptors alone. The two computational levels should therefore be regarded as complementary filters rather than interchangeable criteria for molecular characterization.
From a computer-aided drug-discovery perspective, such an integrated strategy can contribute to the prioritization of natural-product scaffolds for subsequent investigation. GQM/KID analysis can characterize the energetic response associated with charge transfer and assess its internal consistency, whereas local CDFT descriptors can identify electronic regions potentially sensitive to structural modification. ADMET predictions provide an additional and complementary assessment of pharmacokinetic and toxicological properties that may represent limitations for further development. Considered together, these descriptors provide a multidimensional computational profile that can assist in identifying features worthy of further optimization or experimental examination.
The present analysis should nevertheless be regarded as a computational characterization rather than as a direct prediction of biological activity or therapeutic efficacy. The investigated set comprises ten closely related marine cyclic peptides and depsipeptides, and the ADMET properties are derived from predictive models rather than experimental measurements. Further studies incorporating molecular-target information, binding calculations, molecular dynamics simulations, and experimental pharmacokinetic and biological data would be required to establish direct structure–activity relationships. Within these limitations, the combined GQM/CDFT–ADMET framework provides a systematic approach for examining electronic reactivity and developability-related properties of complex marine natural products within a computer-aided drug-discovery context.
4. Conclusions
In this work, the electronic reactivity and predicted pharmacokinetic properties of five pairs of structurally related marine cyclic peptides and depsipeptides were investigated through an integrated computational strategy combining Conceptual Density Functional Theory, the Generalized Quadratic Model, KID consistency criteria, atom-resolved Fukui functions, and ADMET predictions. The branch-specific formulation of the GQM made it possible to distinguish the responses associated with electron removal and electron addition, while the comparison of the A/B congeners provided a systematic means of examining the electronic consequences of relatively localized structural modifications.
The GQM/KID analysis showed that all ten compounds remain relatively close to their corresponding branchwise linear conditions, although the magnitude and direction of the deviations depend on both the molecular system and the charge-transfer direction. Particularly informative cases include the exceptionally small electron-addition deviation of Tamandarin A, the larger electron-addition deviation observed for Calyxamide A, the pronounced A-to-B electronic reorganization of the Rolloamides, and the comparatively larger electron-removal deviations of the Pipecolidepsins. The local reactivity analysis further demonstrated that these global differences are associated with distinct spatial response patterns. Callipeltins and Pipecolidepsins exhibit pronounced differentiation between the dominant electron-addition and electron-removal regions, whereas Rolloamides show greater overlap between the two responses and Tamandarins display an intermediate behavior. Particularly noteworthy is the highly localized and conserved electron-removal response of the Pipecolidepsins, for which approximately 98% of the response is concentrated on the same N68–C67–C66–C65 region in both congeners.
The predicted ADMET profiles revealed an additional level of family-dependent differentiation. Rolloamides showed the highest predicted intestinal absorption within the investigated set, followed by the Tamandarins, whereas negligible intestinal absorption was predicted for the Callipeltins, Calyxamides, and Pipecolidepsins. At the same time, several predicted pharmacokinetic and toxicological features were conserved within individual congener pairs. Comparison with the electronic descriptors showed that electronic differentiation does not necessarily translate into an equivalent differentiation in predicted ADMET behavior. Conversely, pharmacokinetic differences cannot be inferred directly from the electronic-reactivity descriptors. The two computational descriptions therefore provide complementary rather than redundant information.
Overall, the results demonstrate that structural similarity among closely related marine natural products can coexist with appreciable differences in their global and local electronic responses, while such electronic differences need not be directly mirrored by pharmacokinetic predictions. The combined GQM/CDFT–ADMET strategy consequently provides a multidimensional framework for characterizing complex cyclic peptides and depsipeptides and for identifying electronic and developability-related features that may warrant further investigation. The present results should be regarded as a computational basis for subsequent studies rather than as direct evidence of biological activity or therapeutic efficacy. Integration with molecular-target information, binding calculations, molecular dynamics simulations, and experimental biological and pharmacokinetic data will be required to establish direct structure–activity relationships and to assess the potential of these marine natural-product scaffolds in computer-aided drug discovery.
Funding
This research received no external funding.
Institutional Review Board Statement
Not applicable.
Informed Consent Statement
Not applicable.
Data Availability Statement
All the data generated during this research are available from the author upon request.
Acknowledgments
Daniel Glossman-Mitnik is an affiliated researcher at the Centro de Investigación en Materiales Avanzados (CIMAV) and member of the Sistema Nacional de Investigadoras e Investigadores (SNII) of the Secretaría de Ciencia, Humanidades, Tecnología e Innovación (SECIHTI), México.
Conflicts of Interest
The author declares no conflicts of interest.
Abbreviations
The following abbreviations are used in this manuscript:
| ADMET | Absorption, Distribution, Metabolism, Excretion, and Toxicity |
| BBB | Blood–brain barrier |
| CDFT | Conceptual Density Functional Theory |
| CNS | Central nervous system |
| DFT | Density Functional Theory |
| DFTB | Density-functional tight binding |
| ESP | Electrostatic potential |
| GQM | Generalized Quadratic Model |
| HOMO | Highest occupied molecular orbital |
| KID | Koopmans-in-DFT |
| LUMO | Lowest unoccupied molecular orbital |
| MMFF94 | Merck Molecular Force Field 94 |
| OCT2 | Organic cation transporter 2 |
| SMD | Solvation Model based on Density |
| SMILES | Simplified Molecular Input Line Entry System |
| VDss | Steady-state volume of distribution |
References
- Ji, X.; Nielsen, A.L.; Heinis, C. Cyclic Peptides for Drug Development. Angew. Chem. Int. Ed. 2024, 63, e202308251. [Google Scholar] [CrossRef]
- Ribeiro, R.; Pinto, E.; Fernandes, C.; Sousa, E. Marine Cyclic Peptides: Antimicrobial Activity and Synthetic Strategies. Mar. Drugs 2022, 20, 397. [Google Scholar] [CrossRef]
- Dougherty, P.G.; Sahni, A.; Pei, D. Understanding Cell Penetration of Cyclic Peptides. Chem. Rev. 2019, 119, 10241–10287. [Google Scholar] [CrossRef]
- Li, J.; Yanagisawa, K.; Sugita, M.; Fujie, T.; Ohue, M.; Akiyama, Y. CycPeptMPDB: A Comprehensive Database of Membrane Permeability of Cyclic Peptides. J. Chem. Inf. Model. 2023, 63, 2240–2250. [Google Scholar] [CrossRef]
- Zampella, A.; D’Auria, M.V.; Gomez Paloma, L.; Casapullo, A.; Minale, L.; Debitus, C.; Henin, Y. Callipeltin A, an Anti-HIV Cyclic Depsipeptide from the New Caledonian Lithistida Sponge Callipelta sp. J. Am. Chem. Soc. 1996, 118, 6202–6209. [Google Scholar] [CrossRef]
- D’Auria, M.V.; Zampella, A.; Gomez Paloma, L.; Minale, L.; Debitus, C.; Roussakis, C.; Le Bert, V. Callipeltins B and C; Bioactive Peptides from a Marine Lithistida Sponge Callipelta sp. Tetrahedron 1996, 52, 9589–9596. [Google Scholar] [CrossRef]
- Horn, A.; Kazmaier, U. Synthesis of the Cyclic Heptapeptide Core of Callipeltin A. Org. Chem. Front. 2022, 9, 5213–5218. [Google Scholar] [CrossRef]
- Kimura, M.; Wakimoto, T.; Egami, Y.; Tan, K.C.; Ise, Y.; Abe, I. Calyxamides A and B, Cytotoxic Cyclic Peptides from the Marine Sponge Discodermia calyx. J. Nat. Prod. 2012, 75, 290–294. [Google Scholar] [CrossRef]
- Williams, D.E.; Yu, K.; Behrisch, H.W.; Van Soest, R.; Andersen, R.J. Rolloamides A and B, Cytotoxic Cyclic Heptapeptides Isolated from the Caribbean Marine Sponge Eurypon laughlini. J. Nat. Prod. 2009, 72, 1253–1257. [Google Scholar] [CrossRef]
- Vervoort, H.; Fenical, W.; Epifanio, R.A. Tamandarins A and B: New Cytotoxic Depsipeptides from a Brazilian Ascidian of the Family Didemnidae. J. Org. Chem. 2000, 65, 782–792. [Google Scholar] [CrossRef]
- Liang, B.; Richard, D.J.; Portonovo, P.S.; Joullié, M.M. Total Syntheses and Biological Investigations of Tamandarins A and B and Tamandarin A Analogs. J. Am. Chem. Soc. 2001, 123, 4469–4474. [Google Scholar] [CrossRef]
- Adrio, J.; Cuevas, C.; Manzanares, I.; Joullié, M.M. Total Synthesis and Biological Evaluation of Tamandarin B Analogues. J. Org. Chem. 2007, 72, 5129–5138. [Google Scholar] [CrossRef]
- Coello, L.; Reyes, F.; Martin, M.J.; Cuevas, C.; Fernandez, R. Isolation and Structures of Pipecolidepsins A and B, Cytotoxic Cyclic Depsipeptides from the Madagascan Sponge Homophymia lamellosa. J. Nat. Prod. 2014, 77, 298–303. [Google Scholar] [CrossRef]
- Pelay-Gimeno, M.; García-Ramos, Y.; Martin, M.J.; Spengler, J.; Molina-Guijarro, J.M.; Munt, S.; Francesch, A.M.; Cuevas, C.; Tulla-Puche, J.; Albericio, F. The First Total Synthesis of the Cyclodepsipeptide Pipecolidepsin A. Nat. Commun. 2013, 4, 2352. [Google Scholar] [CrossRef]
- Parr, R.G.; Yang, W. Density Functional Approach to the Frontier-Electron Theory of Chemical Reactivity. J. Am. Chem. Soc. 1984, 106, 4049–4050. [Google Scholar] [CrossRef]
- Chakraborty, D.; Chattaraj, P.K. Conceptual Density Functional Theory Based Electronic Structure Principles. Chem. Sci. 2021, 12, 6264–6279. [Google Scholar] [CrossRef]
- Geerlings, P.; Chamorro, E.; Chattaraj, P.K.; Proft, F.D.; Gázquez, J.L.; Liu, S.; Morell, C.; Toro-Labbé, A.; Vela, A.; Ayers, P. Conceptual Density Functional Theory: Status, Prospects, Issues. Theor. Chem. Acc. 2020, 139. [Google Scholar] [CrossRef]
- Geerlings, P. From Density Functional Theory to Conceptual Density Functional Theory and Biosystems. Pharmaceuticals 2022, 15, 1112. [Google Scholar] [CrossRef]
- Rohit, H.; Tandon, H. Conceptual Density Functional Theory in Drug Discovery: An Overview. J. Mol. Model. 2025, 31, 291. [Google Scholar] [CrossRef]
- Flores-Holguín, N.; Frau, J.; Glossman-Mitnik, D. Unveiling Pipestelides A-C: Conceptual Density Functional Theory-based Computational Peptidology Approach to their Chemical and Pharmacological Potential. Theor. Chem. Acc. 2025, 144, 63. [Google Scholar] [CrossRef]
- Flores-Holguín, N.; Frau, J.; Glossman-Mitnik, D. Exploring the Chemical and Pharmaceutical Potential of Kapakahines A–G Using Conceptual Density Functional Theory-Based Computational Peptidology. Computation 2025, 13, 111. [Google Scholar] [CrossRef]
- Albavera-Mata, A.; Gázquez, J.L.; Vela, A. Generalized Quadratic Model for Charge Transfer. Phys. Chem. Chem. Phys. 2025, 27, 11318–11330. [Google Scholar] [CrossRef]
- Halgren, T.A. Merck Molecular Force Field. I. Basis, Form, Scope, Parameterization, and Performance of MMFF94. J. Comput. Chem. 1996, 17, 490–519. [Google Scholar]
- Halgren, T.A. Merck Molecular Force Field. II. MMFF94 van der Waals and Electrostatic Parameters for Intermolecular Interactions. J. Comput. Chem. 1996, 17, 520–552. [Google Scholar]
- Halgren, T.A. MMFF VI. MMFF94s Option for Energy Minimization Studies. J. Comput. Chem. 1999, 20, 720–729. [Google Scholar]
- Halgren, T.A.; Nachbar, R.B. Merck Molecular Force Field. IV. Conformational Energies and Geometries for MMFF94. J. Comput. Chem. 1996, 17, 587–615. [Google Scholar]
- Halgren, T.A. Merck Molecular Force Field. V. Extension of MMFF94 Using Experimental Data, Additional Computational Data, and Empirical Rules. J. Comput. Chem. 1996, 17, 616–641. [Google Scholar]
- Frisch, M.J.; Trucks, G.W.; Schlegel, H.B.; Scuseria, G.E.; Robb, M.A.; Cheeseman, J.R.; Scalmani, G.; Barone, V.; Petersson, G.A.; Nakatsuji, H.; et al. Gaussian 16 Revision C.01, 2016; Gaussian Inc: Wallingford, CT, USA, 2016. [Google Scholar]
- Peverati, R.; Truhlar, D.G. Screened-Exchange Density Functionals with Broad Accuracy for Chemistry and Solid-State Physics. Phys. Chem. Chem. Phys. 2012, 14, 16187. [Google Scholar] [CrossRef]
- Weigend, F.; Ahlrichs, R. Balanced Basis Sets of Split Valence, Triple Zeta Valence and Quadruple Zeta Valence Quality for H to Rn: Design and Assessment of Accuracy. Phys. Chem. Chem. Phys. 2005, 7, 3297. [Google Scholar] [CrossRef]
- Weigend, F. Accurate Coulomb-fitting Basis Sets for H to Rn. Phys. Chem. Chem. Phys. 2006, 8, 1057. [Google Scholar] [CrossRef]
- Marenich, A.V.; Cramer, C.J.; Truhlar, D.G. Universal Solvation Model Based on Solute Electron Density and on a Continuum Model of the Solvent Defined by the Bulk Dielectric Constant and Atomic Surface Tensions. J. Phys. Chem. B 2009, 113, 6378–6396. [Google Scholar] [CrossRef]
- Pucci, R.; Angilella, G.G.N. Density Functional Theory, Chemical Reactivity, and the Fukui Functions. Found. Chem. 2022, 24, 59–71. [Google Scholar] [CrossRef]
- Guerrero-Gutiérrez, O.X.; Acosta-García, A.; Vela, A. PyCRDFT: A Python Package to Evaluate Chemical Reactivity Descriptors within Conceptual DFT. J. Chem. Sci. 2026, 138, 23. [Google Scholar] [CrossRef]
- Pires, D.E.V.; Blundell, T.L.; Ascher, D.B. pkCSM: Predicting Small-Molecule Pharmacokinetic and Toxicity Properties Using Graph-Based Signatures. J. Med. Chem. 2015, 58, 4066–4072. [Google Scholar] [CrossRef]
- Kim, S.; Chen, J.; Cheng, T.; Gindulyte, A.; He, J.; He, S.; Li, Q.; Shoemaker, B.; Thiessen, P.; Yu, B.; et al. PubChem 2025 update. Nucleic Acids Res. 2024, 53, D1516–D1525. [Google Scholar] [CrossRef]
- Wang, C.K.; Craik, D.J. Cyclic Peptide Oral Bioavailability: Lessons from the Past. Biopolymers 2016, 106, 901–909. [Google Scholar] [CrossRef]
Figure 1.
Molecular depiction, HOMO and LUMO distributions, and molecular electrostatic potential (ESP) mapped onto the electron-density surface of Callipeltin A. The electronic-structure data were obtained at the MN12SX/def2-SVP level using the SMD solvation model for water.
Figure 1.
Molecular depiction, HOMO and LUMO distributions, and molecular electrostatic potential (ESP) mapped onto the electron-density surface of Callipeltin A. The electronic-structure data were obtained at the MN12SX/def2-SVP level using the SMD solvation model for water.
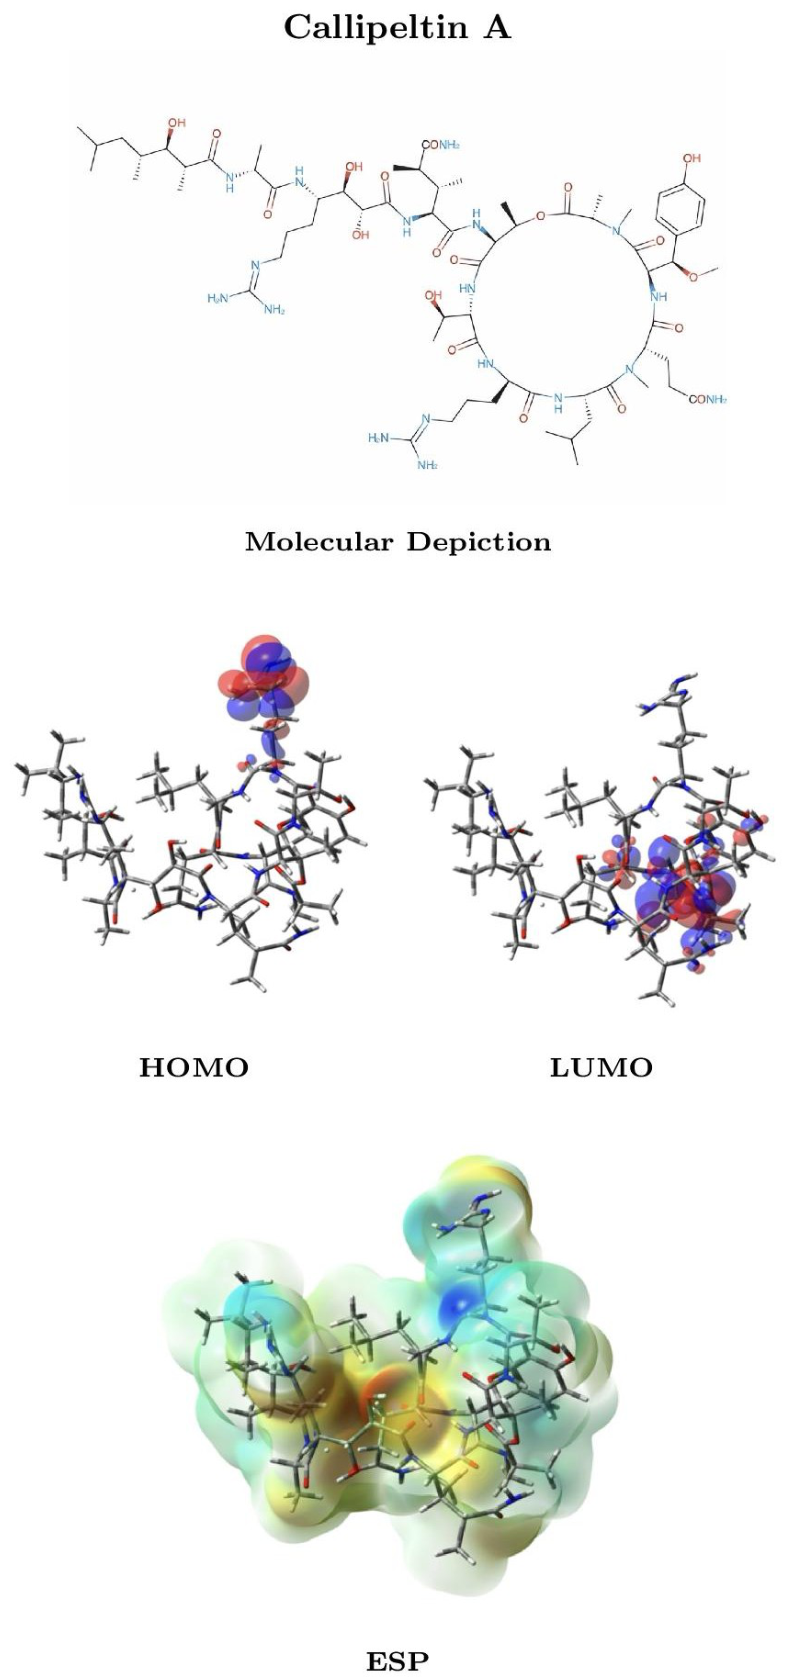
Figure 2.
Molecular depiction, HOMO and LUMO distributions, and molecular electrostatic potential (ESP) mapped onto the electron-density surface of Callipeltin B. The electronic-structure data were obtained at the MN12SX/def2-SVP level using the SMD solvation model for water.
Figure 2.
Molecular depiction, HOMO and LUMO distributions, and molecular electrostatic potential (ESP) mapped onto the electron-density surface of Callipeltin B. The electronic-structure data were obtained at the MN12SX/def2-SVP level using the SMD solvation model for water.
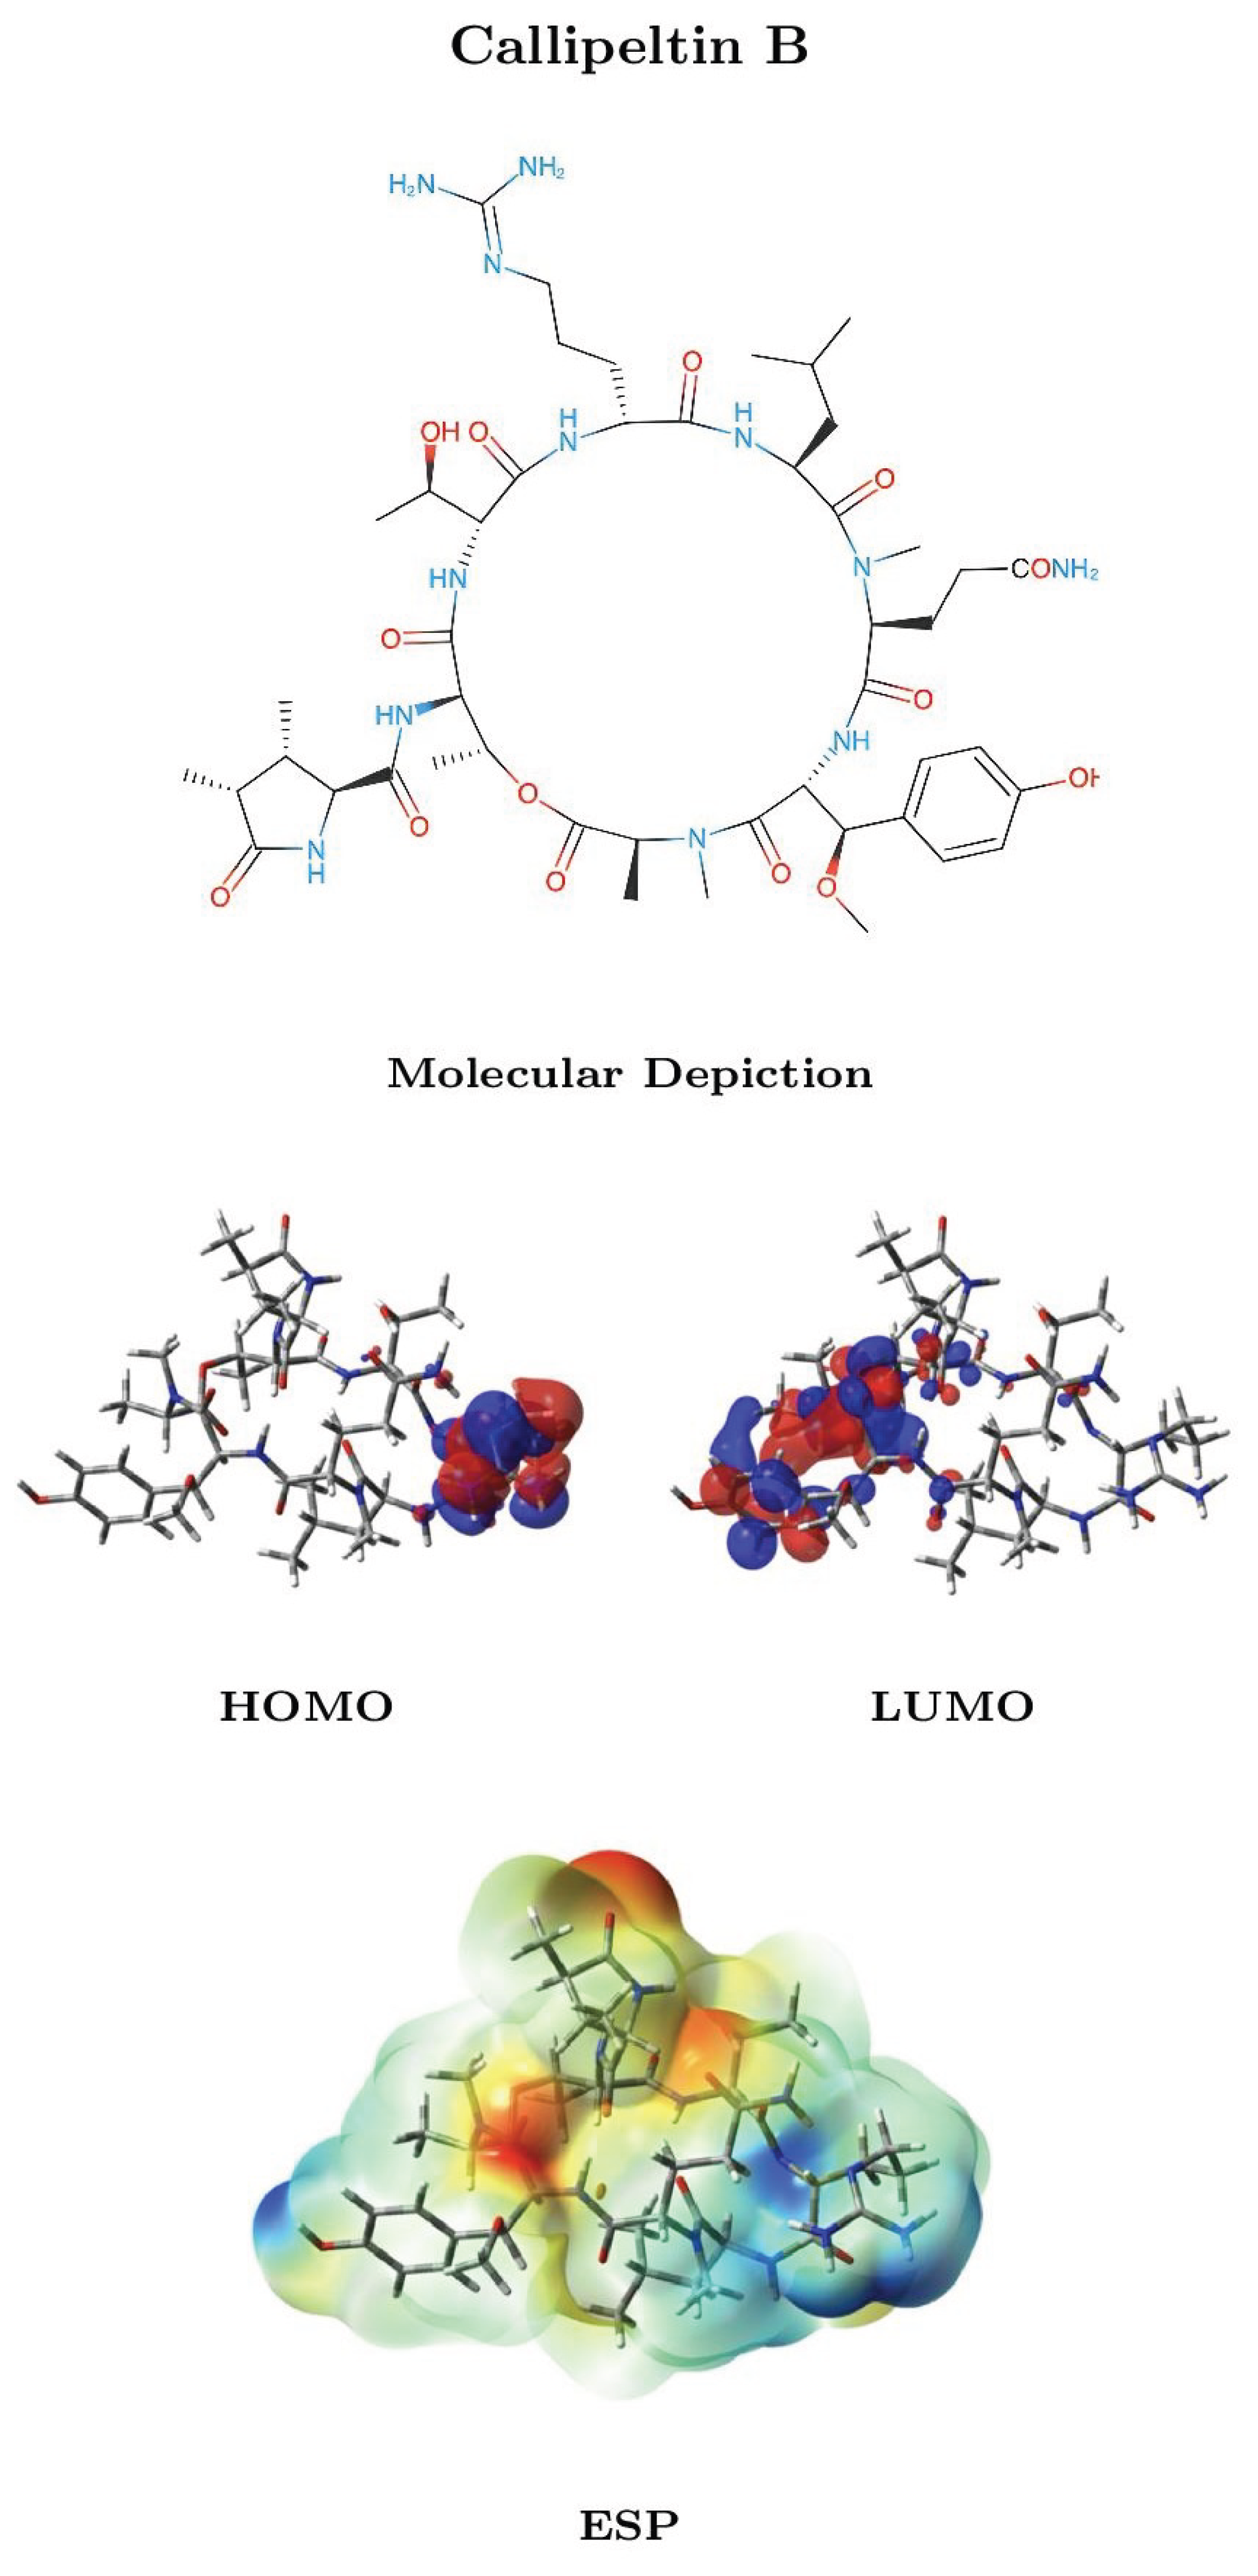
Figure 3.
Molecular depiction, HOMO and LUMO distributions, and molecular electrostatic potential (ESP) mapped onto the electron-density surface of Calyxamide A. The electronic-structure data were obtained at the MN12SX/def2-SVP level using the SMD solvation model for water.
Figure 3.
Molecular depiction, HOMO and LUMO distributions, and molecular electrostatic potential (ESP) mapped onto the electron-density surface of Calyxamide A. The electronic-structure data were obtained at the MN12SX/def2-SVP level using the SMD solvation model for water.
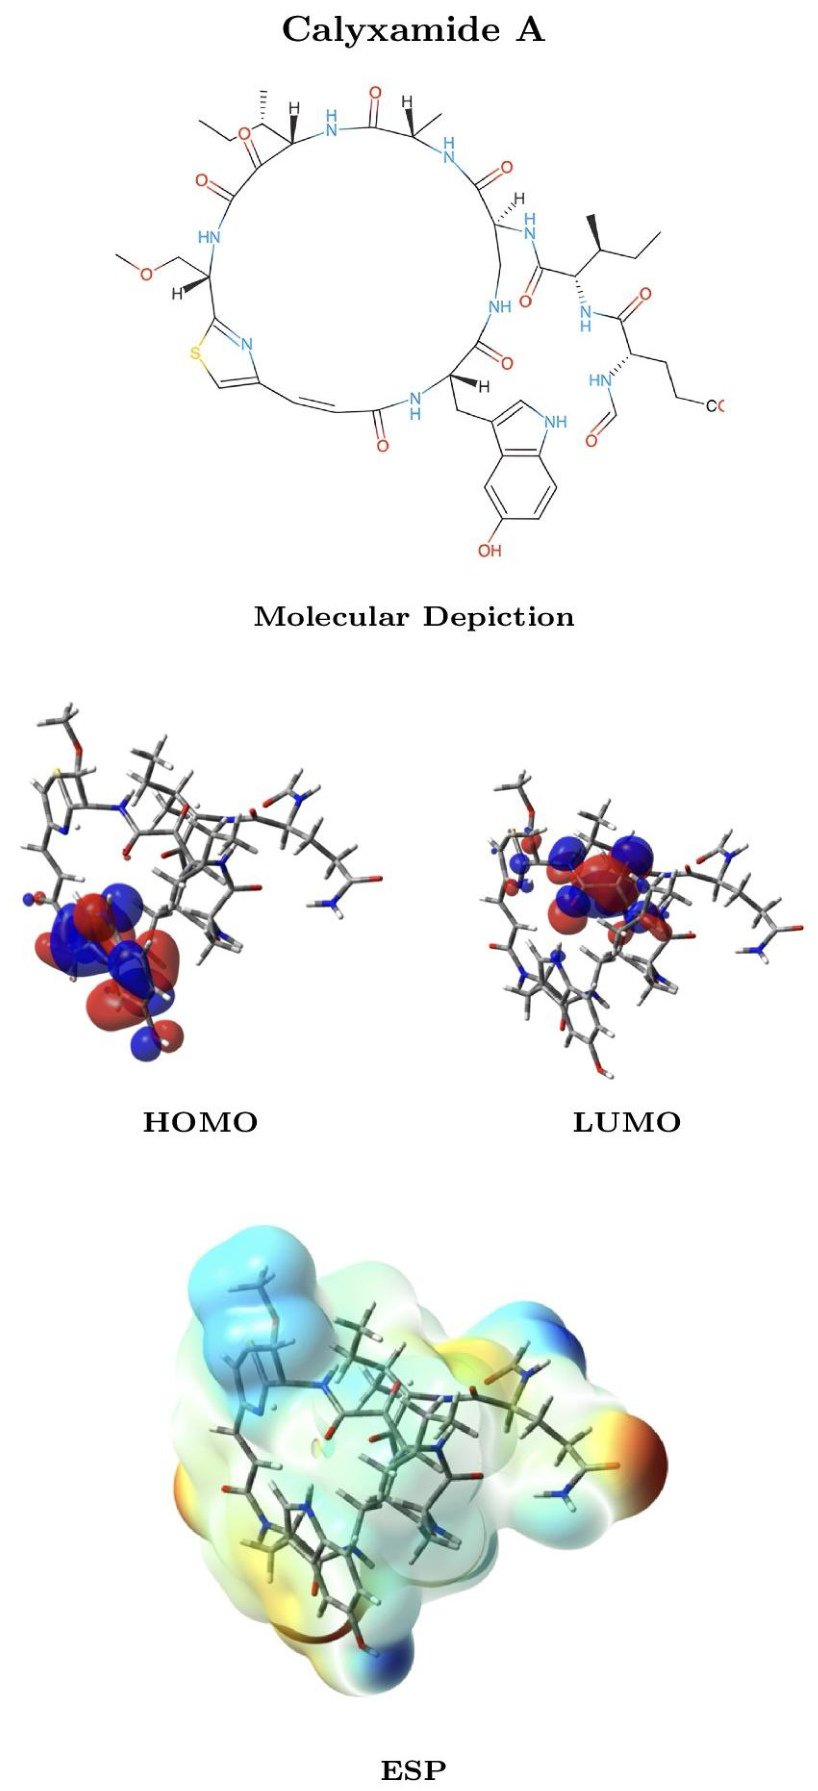
Figure 4.
Molecular depiction, HOMO and LUMO distributions, and molecular electrostatic potential (ESP) mapped onto the electron-density surface of Calyxamide B. The electronic-structure data were obtained at the MN12SX/def2-SVP level using the SMD solvation model for water.
Figure 4.
Molecular depiction, HOMO and LUMO distributions, and molecular electrostatic potential (ESP) mapped onto the electron-density surface of Calyxamide B. The electronic-structure data were obtained at the MN12SX/def2-SVP level using the SMD solvation model for water.
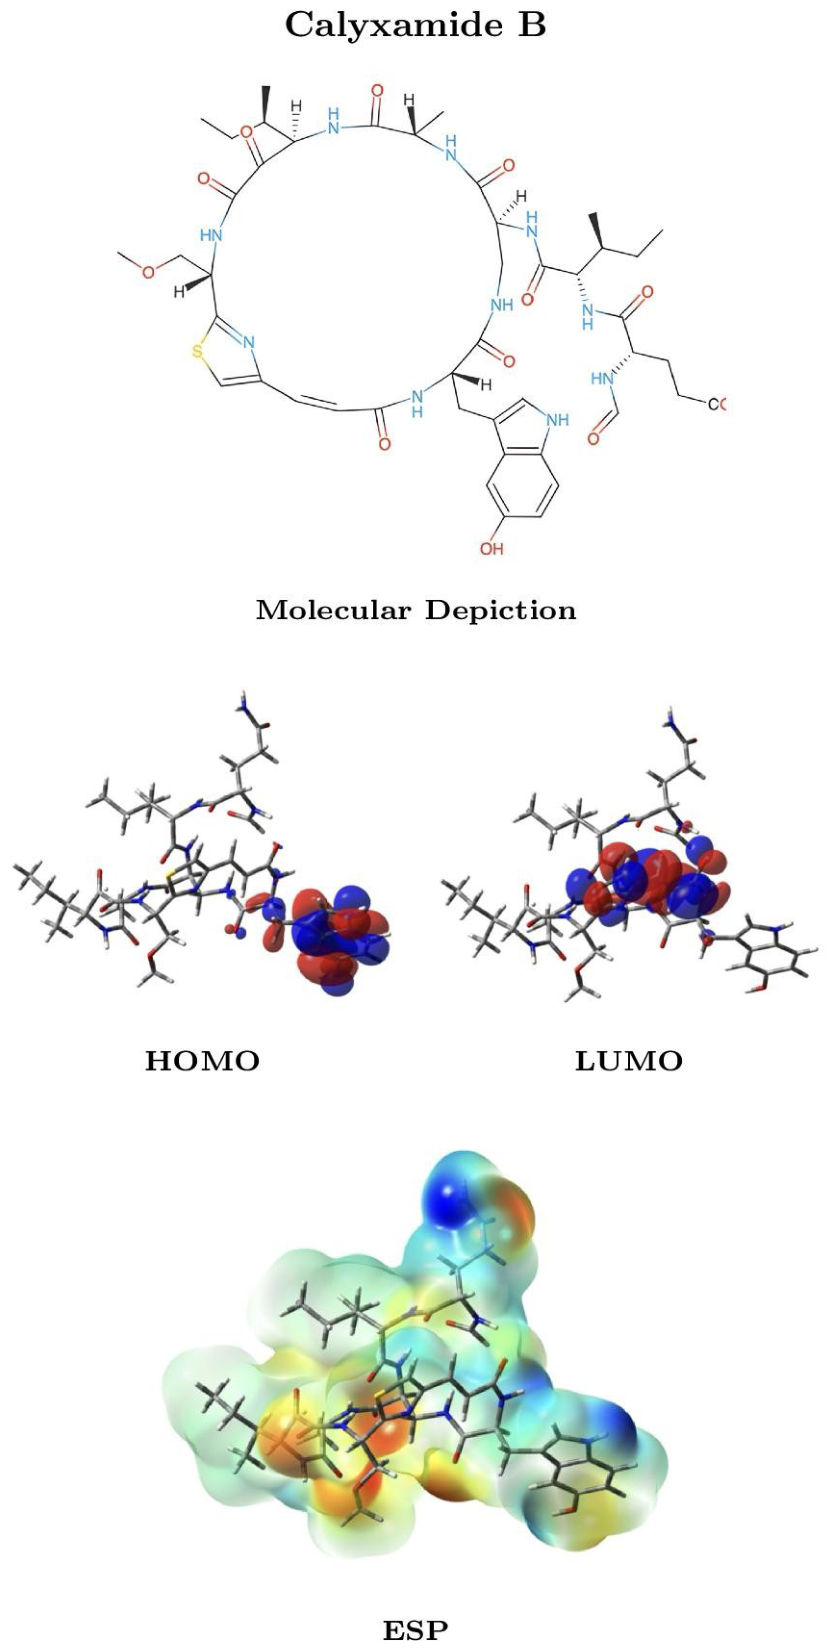
Figure 5.
Molecular depiction, HOMO and LUMO distributions, and molecular electrostatic potential (ESP) mapped onto the electron-density surface of Rolloamide A. The electronic-structure data were obtained at the MN12SX/def2-SVP level using the SMD solvation model for water.
Figure 5.
Molecular depiction, HOMO and LUMO distributions, and molecular electrostatic potential (ESP) mapped onto the electron-density surface of Rolloamide A. The electronic-structure data were obtained at the MN12SX/def2-SVP level using the SMD solvation model for water.
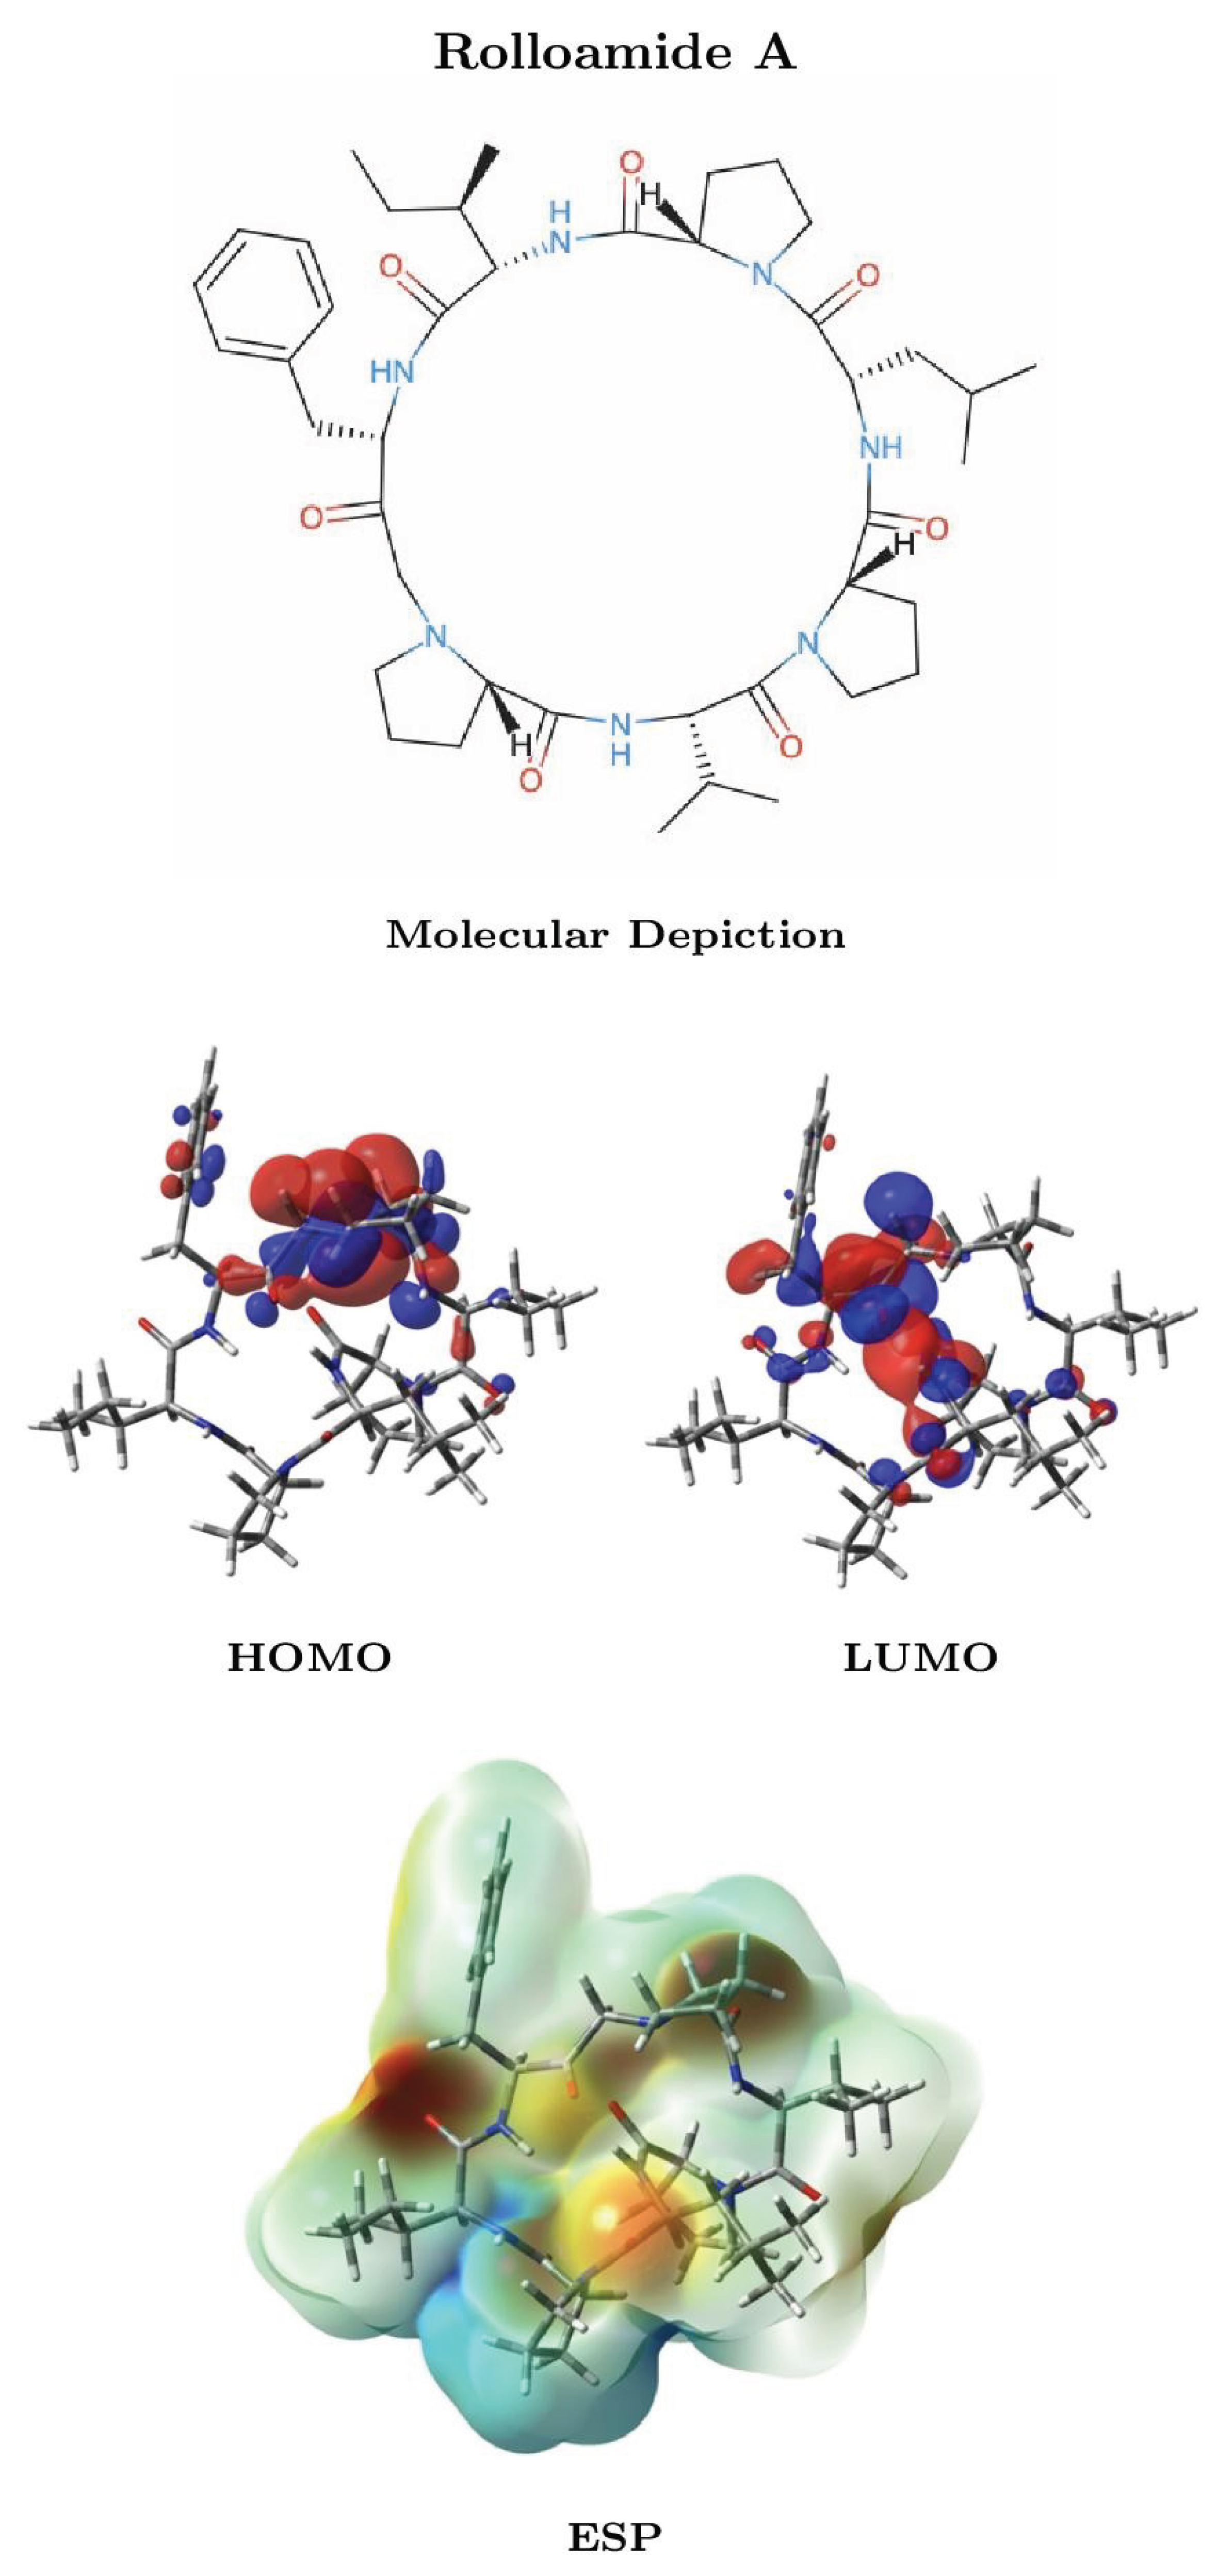
Figure 6.
Molecular depiction, HOMO and LUMO distributions, and molecular electrostatic potential (ESP) mapped onto the electron-density surface of Rolloamide B. The electronic-structure data were obtained at the MN12SX/def2-SVP level using the SMD solvation model for water.
Figure 6.
Molecular depiction, HOMO and LUMO distributions, and molecular electrostatic potential (ESP) mapped onto the electron-density surface of Rolloamide B. The electronic-structure data were obtained at the MN12SX/def2-SVP level using the SMD solvation model for water.
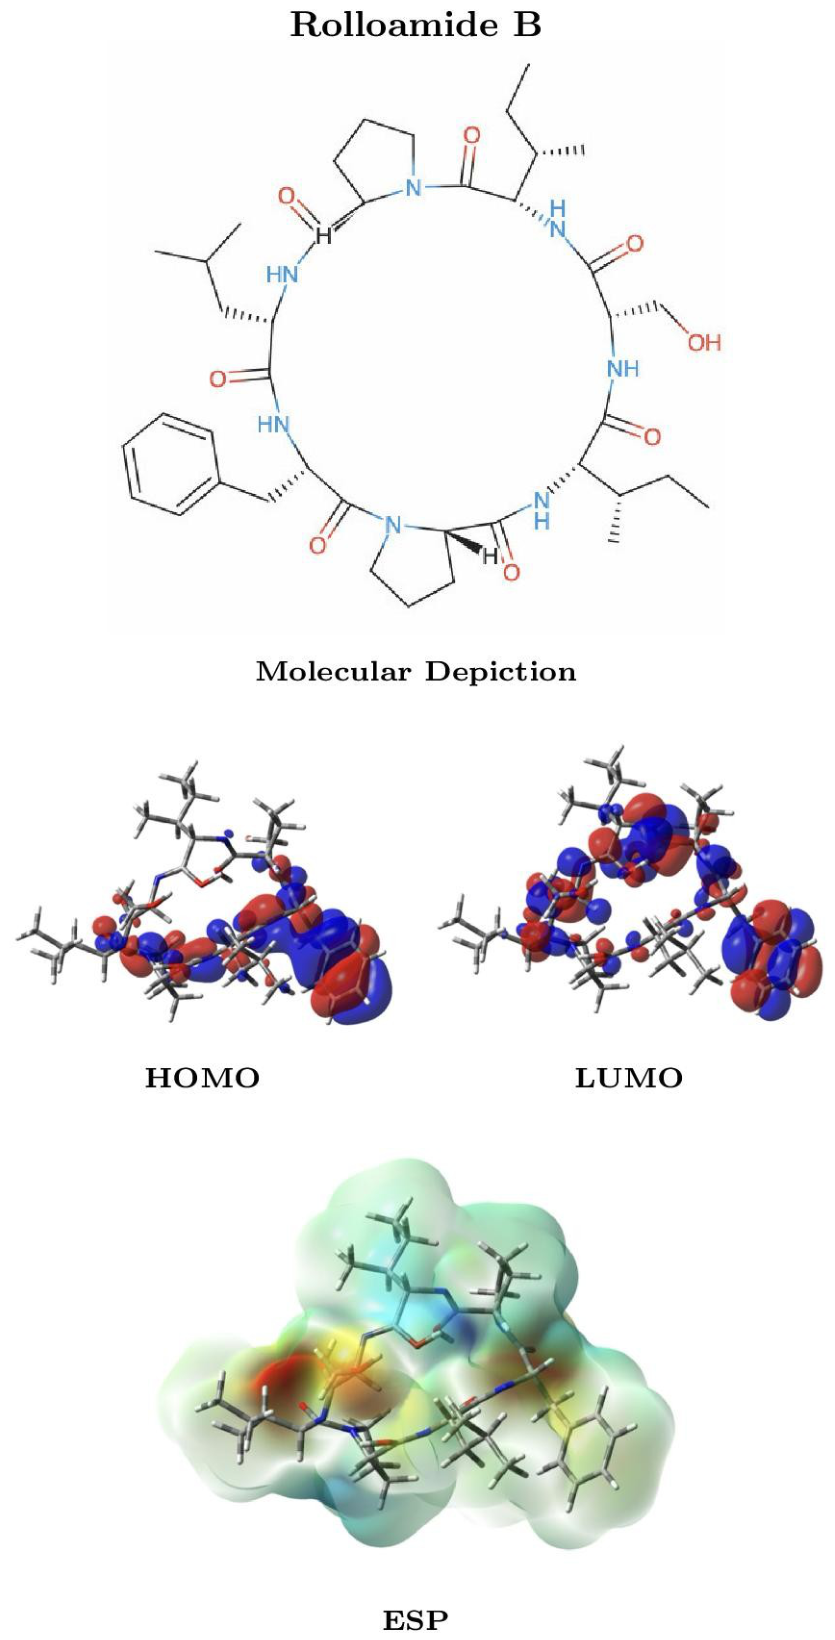
Figure 7.
Molecular depiction, HOMO and LUMO distributions, and molecular electrostatic potential (ESP) mapped onto the electron-density surface of Tamandarin A. The electronic-structure data were obtained at the MN12SX/def2-SVP level using the SMD solvation model for water.
Figure 7.
Molecular depiction, HOMO and LUMO distributions, and molecular electrostatic potential (ESP) mapped onto the electron-density surface of Tamandarin A. The electronic-structure data were obtained at the MN12SX/def2-SVP level using the SMD solvation model for water.
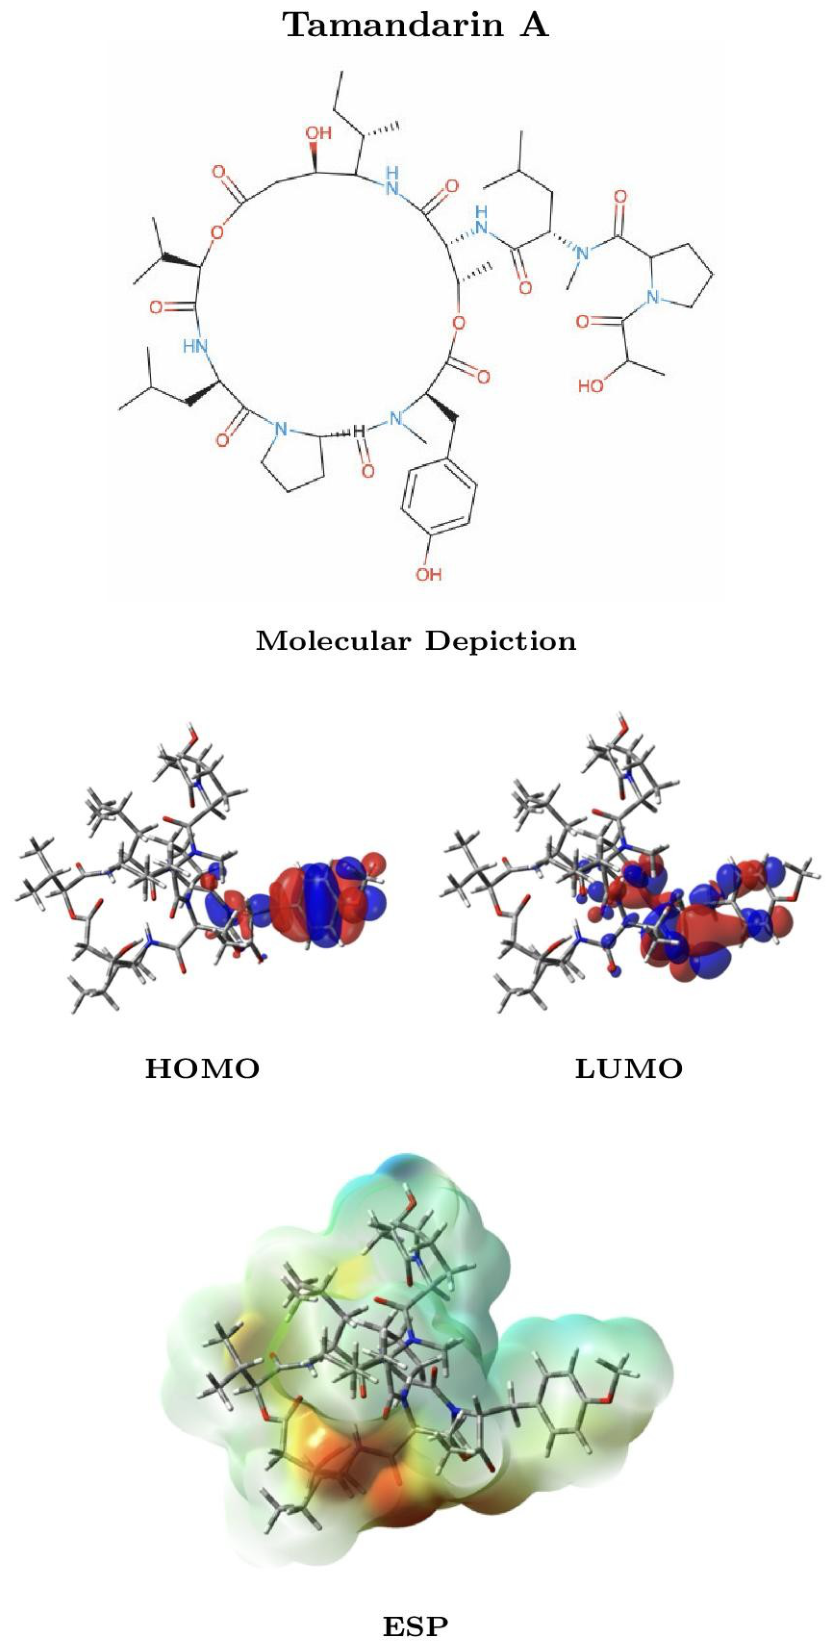
Figure 8.
Molecular depiction, HOMO and LUMO distributions, and molecular electrostatic potential (ESP) mapped onto the electron-density surface of Tamandarin B. The electronic-structure data were obtained at the MN12SX/def2-SVP level using the SMD solvation model for water.
Figure 8.
Molecular depiction, HOMO and LUMO distributions, and molecular electrostatic potential (ESP) mapped onto the electron-density surface of Tamandarin B. The electronic-structure data were obtained at the MN12SX/def2-SVP level using the SMD solvation model for water.
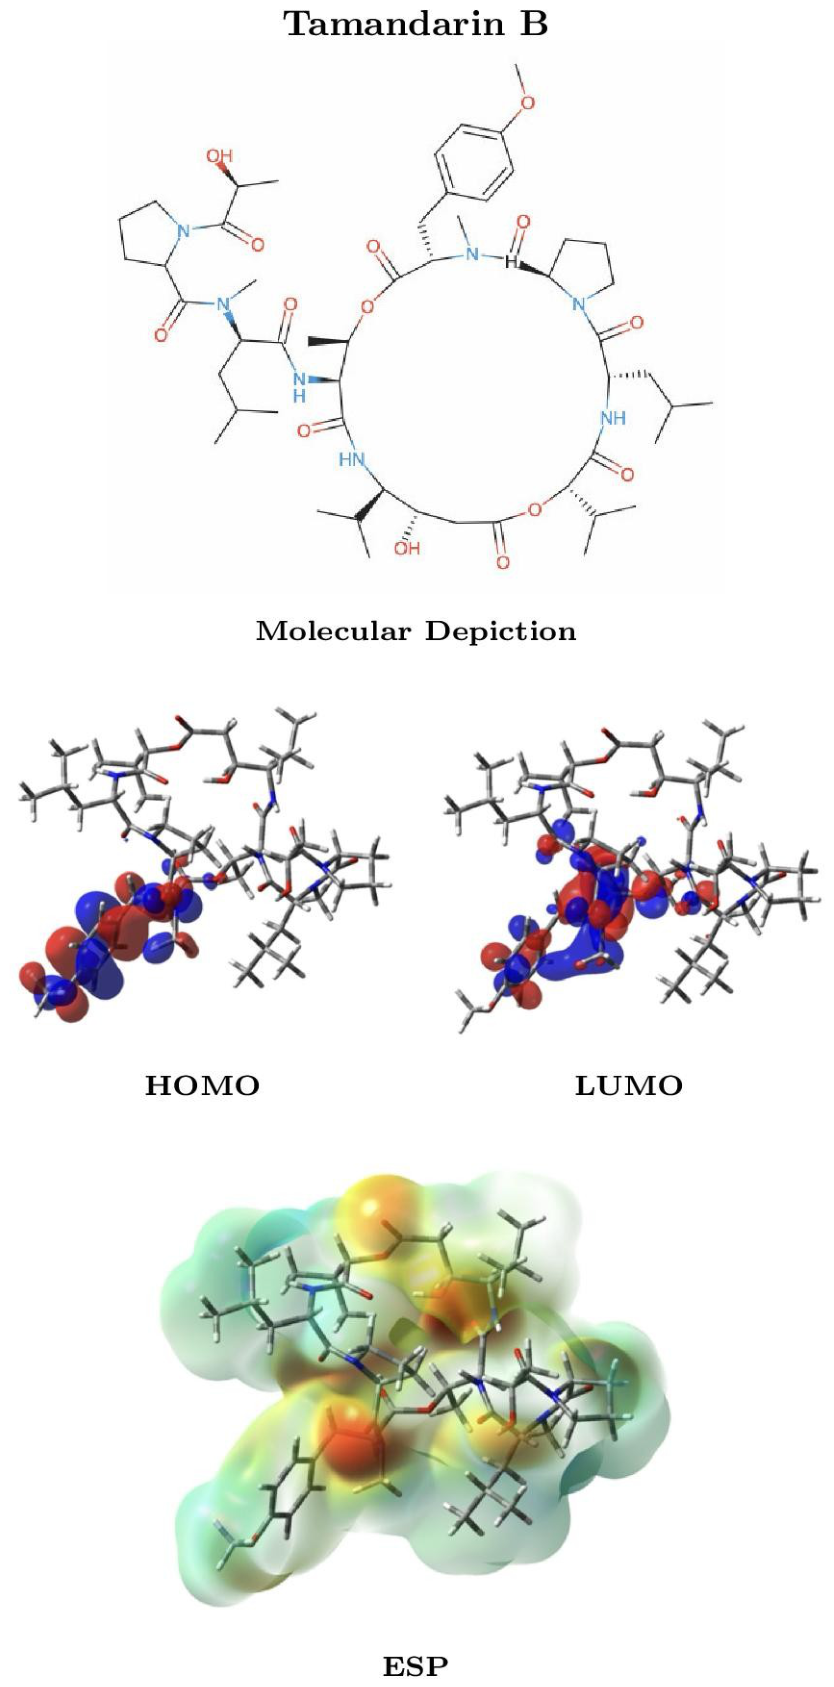
Figure 9.
Molecular depiction, HOMO and LUMO distributions, and molecular electrostatic potential (ESP) mapped onto the electron-density surface of Pipecolidepsin A. The electronic-structure data were obtained at the MN12SX/def2-SVP level using the SMD solvation model for water.
Figure 9.
Molecular depiction, HOMO and LUMO distributions, and molecular electrostatic potential (ESP) mapped onto the electron-density surface of Pipecolidepsin A. The electronic-structure data were obtained at the MN12SX/def2-SVP level using the SMD solvation model for water.
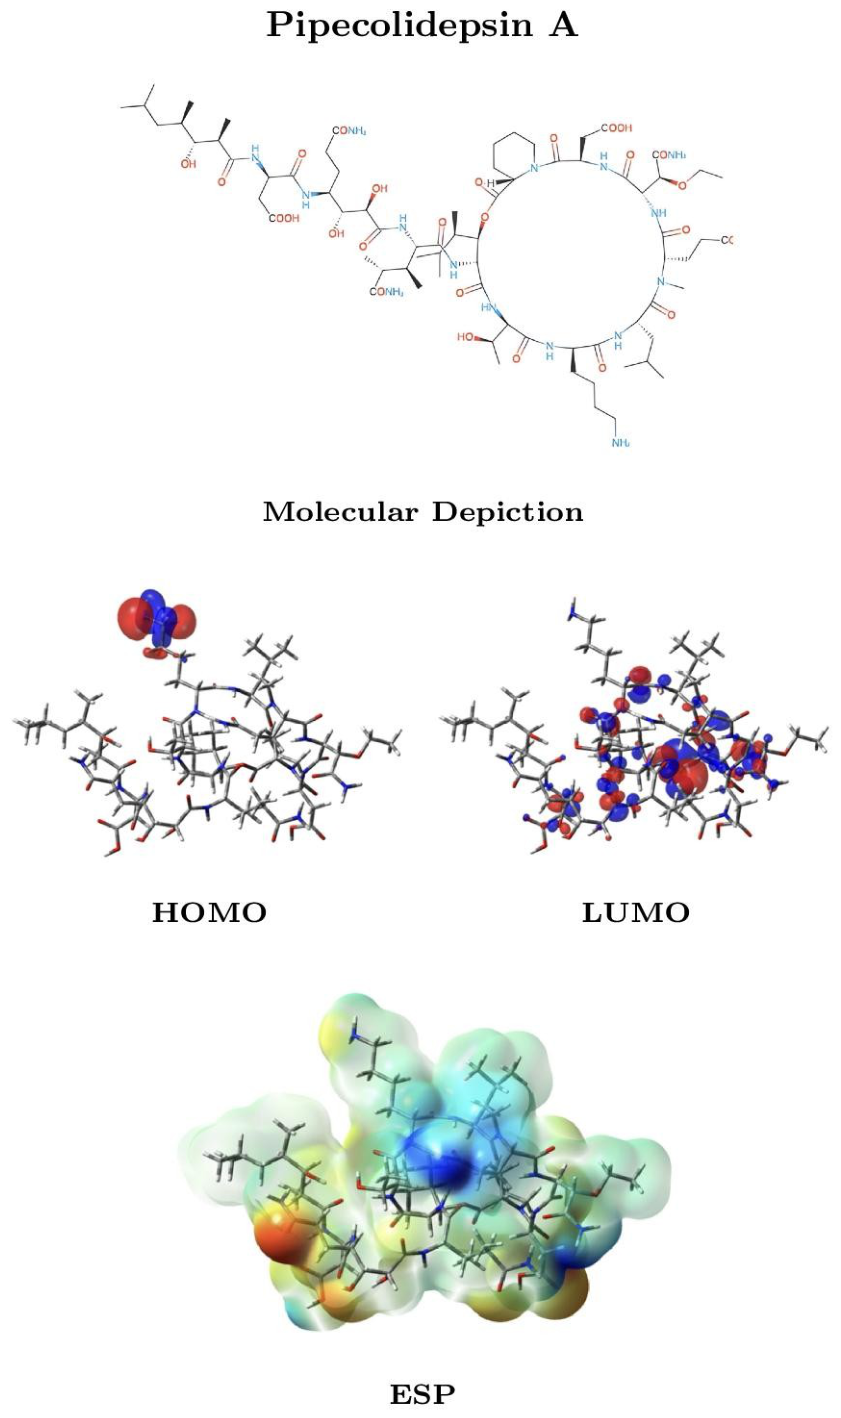
Figure 10.
Molecular depiction, HOMO and LUMO distributions, and molecular electrostatic potential (ESP) mapped onto the electron-density surface of Pipecolidepsin B. The electronic-structure data were obtained at the MN12SX/def2-SVP level using the SMD solvation model for water.
Figure 10.
Molecular depiction, HOMO and LUMO distributions, and molecular electrostatic potential (ESP) mapped onto the electron-density surface of Pipecolidepsin B. The electronic-structure data were obtained at the MN12SX/def2-SVP level using the SMD solvation model for water.
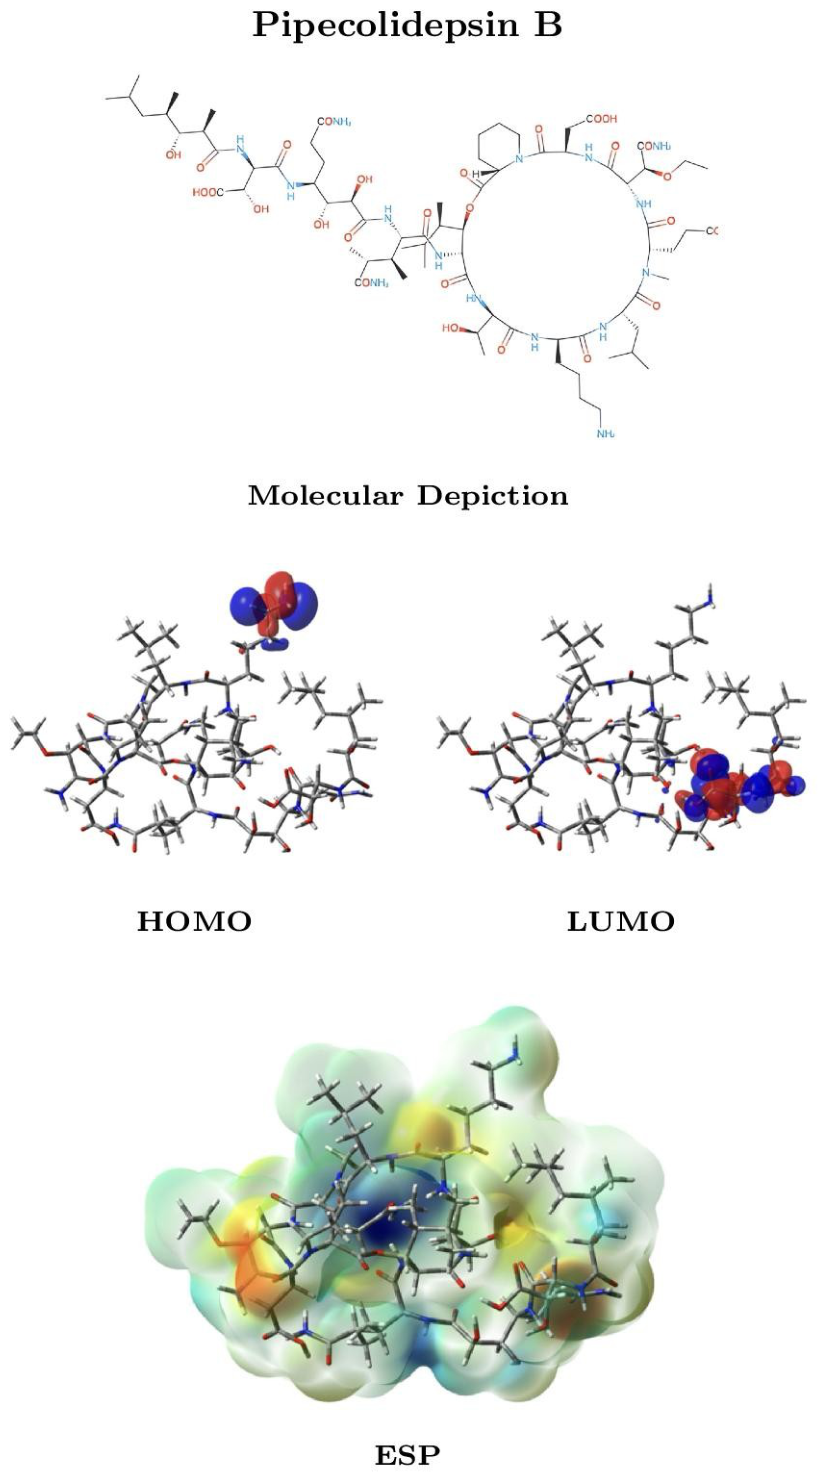
Disclaimer/Publisher’s Note: The statements, opinions and data contained in all publications are solely those of the individual author(s) and contributor(s) and not of MDPI and/or the editor(s). MDPI and/or the editor(s) disclaim responsibility for any injury to people or property resulting from any ideas, methods, instructions or products referred to in the content. |
© 2026 by the author. Licensee MDPI, Basel, Switzerland. This article is an open access article distributed under the terms and conditions of the Creative Commons Attribution (CC BY) license.
Copyright: This open access article is published under a Creative Commons CC BY 4.0 license, which permit the free download, distribution, and reuse, provided that the author and preprint are cited in any reuse.