

Submitted:
08 October 2026
Posted:
09 October 2026
You are already at the latest version
Abstract
Higher income may be associated with lower medical financial hardship, but this association may differ by race. Guided by Minorities’ Diminished Returns (MDRs), we examined two related outcomes among Black and White adults in California: medical bill payment difficulties and inability to afford basic necessities due to medical bills among adults reporting payment difficulties. We used annual California Health Interview Survey estimates for 2017–2024, comparing income below versus at or above 400% of the federal poverty level. We calculated relative reductions first and absolute contrasts second, using equally weighted annual mean prevalences. For payment difficulties, relative reductions were smaller among Black than White adults in 2017–2024 (47.7% versus 58.0%) and 2019–2024 (45.6% versus 58.3%). Full-period absolute reductions were also smaller (6.96 versus 8.29 percentage points). For inability to afford necessities, the 2019–2024 relative reduction was smaller among Black adults (38.2% versus 43.4%), while absolute reductions were similar (16.0 versus 15.6 points). The smaller relative reduction among Black adults was consistent with MDRs. The two outcomes have different denominators. Future research should formally test race-by-income interactions when respondent-level survey data and design information become available; these tests were not possible using the supplied online-analysis exports.
Keywords:
minorities’ diminished returns
; income
; medical financial hardship
; medical bill payment difficulties
; basic necessities
; black adults
; California
; California health interview survey
1. Introduction
Difficulty paying medical bills is a form of financial hardship that connects health care costs with household economic security. A person may experience payment difficulties even when insured or when no unpaid balance remains at the time of the survey. Research on medical debt provides related evidence about financial strain, although debt and payment difficulties are distinct measures. National studies have documented medical debt among insured adults and associations between newly acquired debt and subsequent food and housing insecurity [1]. Another study of consumer credit reports found that medical debt in collections was concentrated in lower-income communities [2]. These findings make the affordability of medical bills relevant to research on social inequality.
Medical financial hardship includes material problems, such as difficulty paying bills; psychological responses, such as worry about costs; and behavioral responses, such as delaying needed care [3]. These domains may overlap, but they are not interchangeable. Studies of cancer survivors illustrate the importance of disease burden and treatment costs when interpreting hardship, including medical debt and bankruptcy [4,5]. Those disease-specific findings provide context rather than evidence about the prevalence or income gradient in the present California population. Our two outcomes concern reported payment difficulties and associated inability to afford basic necessities. They do not measure all three domains.
Income is an important economic resource because it may help households cover both routine expenses and unexpected costs. Fundamental cause theory describes how access to flexible resources can shape health inequalities across changing risks and settings [6]. However, income captures only one part of socioeconomic position. The meaning of a given income may differ across racial groups when households have different wealth, employment conditions, or exposure to discrimination. Research on race and socioeconomic status has therefore cautioned against assuming that standard economic indicators represent equivalent social circumstances for Black and White populations [7].
Socioeconomic position is multidimensional, and income, education, occupation, and wealth need not represent the same circumstances [8,9]. Income relative to the FPL accounts for differences in the poverty threshold, but it does not directly measure savings, disposable income after essential expenses, or the adequacy of insurance. Research on inequalities in health care also points to the need to consider access and quality alongside household resources [10]. Thus, the present income contrast is one part of a broader question about financial protection.
Minorities’ Diminished Returns (MDRs) theory proposes that socioeconomic resources can have weaker associations with favorable outcomes among minoritized populations than among socially advantaged populations. In Black–White comparisons, this framework focuses on whether the association of a resource with an outcome is smaller among Black people. The theory directs attention to social barriers that may limit the translation of resources into health and well-being [11,12]. For a negative outcome such as medical bill payment difficulties, an MDR pattern would involve a smaller income-associated reduction in prevalence among Black than White adults. A racial difference within the higher-income group alone is insufficient to establish this pattern; the comparison must also consider the income contrast within each racial group.
Income-related MDRs should be examined for specific outcomes rather than assumed to apply universally. Earlier work summarized evidence of similar income-associated mortality differences across Black and White populations [12]. In contrast, a Michigan study found that higher household income was more strongly associated with better self-rated mental health among White than Black adults [13]. Medical bill payment difficulties provide another outcome for assessing whether economic resources have similar associations across racial groups. The question concerns financial security in the context of health care, rather than a direct measure of physical or mental health.
Structural racism offers a broader context for this question. Mutually reinforcing systems of housing, employment, credit, and health care may shape both the resources households hold and the costs they face [14]. National financial data also show large Black–White differences in wealth [15]. These conditions suggest possible reasons why a similar income category may not imply similar capacity to absorb medical expenses. The current data do not measure these mechanisms, and an observed racial difference in the income gradient cannot by itself identify their contribution.
The distinction between race and racism matters for interpretation. Race categories reflect social histories and classification practices; they are not direct measures of the institutions or experiences that may produce unequal outcomes [16]. Frameworks on levels of racism and racism as a fundamental cause of inequality place institutional conditions alongside interpersonal experiences [17,18]. Reviews describe multiple structural and interpersonal pathways that may shape health and access to care [19,20]. Our comparison is informed by this literature, while the available estimates do not identify a specific pathway.
We examined two related outcomes among Black and White adults in California using annual California Health Interview Survey (CHIS) estimates for 2017–2024. We compared income below and at or above 400% of the federal poverty level (FPL). Aim 1 was to assess whether the relative reduction in medical bill payment difficulties associated with higher income was smaller among Black adults. Aim 2 was to assess the same hypothesis for inability to afford basic necessities due to medical bills among adults who reported payment difficulties. We present relative reductions first for both aims and absolute contrasts as complementary measures. We assessed period summaries and annual variation. Because the available data consisted of published subgroup estimates, this study was an exploratory descriptive assessment rather than an adjusted test of individual-level interaction.
2. Materials and Methods
2.1. Study Design and Data Source
This study used repeated cross-sectional aggregate estimates from CHIS for 2017 through 2024. CHIS is a population survey designed to represent California residents, and AskCHIS provides direct survey-weighted estimates across demographic and socioeconomic groups [21]. We analyzed two investigator-supplied AskCHIS spreadsheets, each containing four annual tables for Black and White adults in two income categories. Each file identified the adult universe and displayed annual percentages, 95% confidence intervals, estimated population counts, and statistical instability flags. No respondent-level records, unweighted subgroup sample sizes, or survey replicate weights were available for this analysis.
CHIS changed from telephone-based sampling to address-based sampling with web and telephone administration beginning in 2019 [22]. We retained the full 2017–2024 period but considered this redesign when interpreting changes across years. The study describes annual cross-sectional populations and does not follow the same individuals as their income changes. The first outcome provided 32 annual prevalence estimates. The second outcome provided 31 reported estimates, with the higher-income Black affirmative estimate suppressed in 2017. The second item was restricted to adults reporting medical bill payment problems.
2.2. Study Population and Race
The study population consisted of California adults classified as Black or White in the supplied queries. The investigator confirmed that the left-to-right tables represented Black adults at or above 400% FPL, White adults at or above 400% FPL, Black adults below 400% FPL, and White adults below 400% FPL. The export did not retain the detailed race and ethnicity filter definitions. We therefore use Black and White without assigning an unverified non-Hispanic or single-race restriction. Race is interpreted as a social classification relevant to exposure to racialized conditions. The results should not be read as evidence of inherent biological differences between groups. The second file had a different column order, identified by matching its eligible population totals to the first item’s affirmative-response population counts across the same years. Appendix A specifies both mappings.
2.3. Income
Income was represented by two categories relative to the FPL: below 400% and at or above 400%. We refer to these as the lower-income and higher-income categories within this study. The cutoff is four times the poverty level, so the lower-income category includes people above the official poverty threshold. The higher-income category also contains a broad range of incomes. This grouping was confirmed by the investigator and was not reconstructed from individual income records. The analysis could not compare finer income bands or establish whether income distributions within the two categories were similar across racial groups.
2.4. Medical Financial Hardship Outcomes
The outcome was a reported problem paying medical bills for oneself or a household family member during the past 12 months. The export described the topic as ‘Ever had problems paying for self or household family’s medical bills in past 12 months’ and distinguished respondents who had problems paying from those who had not. We analyzed the prevalence of an affirmative response. This measure captures adult respondents’ reports about their own or their household family’s bills; it is not a household-level prevalence estimate. It does not establish the amount, duration, or current existence of medical debt. We therefore use the term medical bill payment difficulties throughout.
An affirmative response may reflect a temporary cash-flow problem, difficulty meeting an installment payment, or a longer-lasting unpaid bill. The binary measure does not distinguish these situations. Conversely, a negative response does not establish that medical care was affordable: a respondent may have delayed care, relied on relatives, or used savings without reporting a payment problem. The financial hardship literature supports examining material, psychological, and behavioral measures separately and together [3,5]. The export does not provide those additional measures or the bill types involved.
Earlier research described household trade-offs involving medical bills, family finances, and access to care [23]. That work highlights why a binary payment-problem measure may miss how households manage expenses, including competing demands on their budgets. In the present analysis, the absence of information about these responses limits interpretation of both affirmative and negative answers.
The second outcome was labeled “Ever unable to pay for basic necessities due to medical bills,” with an affirmative category described as inability to pay for basic necessities due to medical debt. The export explicitly restricted this question to adults who had problems paying for their own or their household’s medical bills. We preserve this wording without assuming an independently verified recall period or a particular list of necessities. Its percentages describe hardship within the payment-problem group, rather than among all adults. Adults without payment problems were excluded from this denominator; they were not included as zero responses in the supplied table. A skip restriction is distinct from missing responses among eligible adults, and underlying microdata skip codes were not available for inspection.
2.5. Descriptive Analysis
We extracted the annual affirmative-response percentages and retained the confidence intervals and instability flags as reported. Percentages stored as decimal fractions and percentages stored as text were converted to the same percentage scale. Calculations used the exported values, which were already rounded to one decimal place. Estimated population counts were not treated as respondent counts or used to create binomial standard errors. Small discrepancies between displayed counts and percentages were expected because the export reports rounded population estimates.
For each race and year, we first calculated the relative reduction as (lower-income prevalence minus higher-income prevalence) divided by lower-income prevalence, multiplied by 100. A smaller relative reduction among Black than White adults was classified as descriptively consistent with MDRs on the relative scale. We then calculated the absolute contrast as lower-income minus higher-income prevalence, in percentage points. A positive White minus Black absolute contrast indicates a smaller absolute reduction among Black adults. Relative and absolute contrasts describe different aspects of the data and can differ in direction. These definitions were applied separately within the appropriate denominator for each outcome.
We report both scales because the size and direction of a between-group contrast can depend on the scale of comparison. Guidance on effect modification recommends displaying subgroup associations and clarifying additive and relative comparisons [24]. Here, these are descriptive contrasts of published prevalences; they are not estimates of causal interaction.
To summarize the period, we calculated an arithmetic mean of the available annual prevalence estimates within a common period for each race–income group, giving each year equal weight. Period-level relative reductions were the differences between mean prevalences divided by the corresponding lower-income mean. We then calculated period-level absolute contrasts from these means. They were not the means of the annual relative reductions. These summaries describe an average annual pattern and are not pooled CHIS prevalence estimates. All comparisons were unadjusted. We did not conduct significance tests, fit regression models, or calculate confidence intervals for the derived contrasts because the exports did not provide the design information required for those analyses.
2.6. Sensitivity Analysis
The Black higher-income estimates for 2017 and 2018 were marked statistically unstable in the source. We repeated the period summary using 2019–2024, excluding both years for all four groups to preserve comparable time coverage. This was an exploratory sensitivity analysis prompted by the source flags. It also restricted the analysis to the period following the CHIS redesign, so its results cannot distinguish the influence of unstable estimates from the influence of survey mode or other temporal changes. We retained all annual results in the main tables rather than removing observations that did not support the hypothesis.
For the second outcome, the main comparable full-period summary used 2018–2024 because the 2017 higher-income Black affirmative estimate was suppressed. We also examined 2019–2024 to align with the first outcome’s sensitivity period and the CHIS redesign. The 2019–2024 relative comparison is emphasized for the second aim, but we also report the 2018–2024 summary and all annual results to show sensitivity to the chosen period. Restricting to 2019–2024 did not remove all instability flags for this outcome.
2.7. Research Transparency
The analysis used existing aggregate estimates and involved no new participant recruitment or collection of identifiable information. All affirmative-response estimates used in the analysis are reproduced in Table 1, and Appendix A describes the source mapping and calculations. ChatGPT assisted with manuscript drafting, literature identification, arithmetic verification, and figure preparation. It did not generate survey observations. Author review of the analysis, citations, and final wording is required before submission. Detailed race filter definitions and the institutional determination regarding review of this aggregate-data analysis should be confirmed by the authors.
3. Results
3.1. Annual Prevalence
Annual prevalence estimates and their reported 95% confidence intervals are presented in Table 1. Figure 1 displays the annual patterns separately for the two income categories. Among Black adults, medical bill payment difficulties ranged from 10.2% to 20.4% below 400% FPL and from 4.0% to 11.3% at or above 400% FPL. Among White adults, the corresponding ranges were 12.3% to 16.5% and 4.9% to 6.4%. Higher-income prevalence was lower than lower-income prevalence for both racial groups in every year. The Black higher-income estimates in 2017 and 2018 were flagged as statistically unstable; their point estimates were 4.0% and 7.5%, respectively.
3.2. Mean Annual Prevalence and Income Contrasts
Across 2017–2024, mean annual prevalence in the lower-income category was 14.59% among Black adults and 14.30% among White adults. Mean annual prevalence in the higher-income category was 7.63% and 6.01%, respectively (Table 2 and Figure 2A). The Black–White difference was 0.29 percentage points below 400% FPL and 1.61 percentage points at or above 400% FPL. Differences were calculated before rounding the displayed means.
Using the lower-income mean as the reference, the relative reduction associated with higher income was 47.7% among Black adults and 58.0% among White adults, a difference of 10.2 percentage points in relative reduction. The absolute reductions were 6.96 and 8.29 percentage points, respectively; the White contrast exceeded the Black contrast by 1.33 points. Both summary scales were consistent with a smaller income-associated reduction among Black adults. These descriptive comparisons do not establish statistical significance.
3.3. Variation Across Years
Relative reductions associated with higher income were smaller among Black adults in five of eight years: 2018, 2019, 2020, 2021, and 2022. In 2019, the absolute reduction was larger for Black adults, while the proportional reduction was smaller because lower-income prevalence was higher among Black adults. Higher-income Black prevalence exceeded higher-income White prevalence in six years, was lower in 2017, and was equal in 2024. This within-category comparison supports describing residual racial differences, but it does not replace the comparison of income contrasts.
The annual absolute income contrast was smaller among Black than White adults in 2018, 2020, 2021, and 2022 (Table 3 and Figure 2C and Figure 3A). The difference between White and Black contrasts was largest in 2022, at 6.3 percentage points. In 2017, 2019, 2023, and 2024, the absolute contrast was larger among Black adults. The annual difference ranged from −2.6 to 6.3 percentage points. Thus, an MDR pattern on the absolute scale was observed in four of eight years rather than consistently throughout the period.
3.4. Sensitivity Analysis
For 2019–2024, the relative reduction in payment difficulties associated with higher income was 45.6% among Black adults and 58.3% among White adults. Mean annual prevalence was 15.17% below 400% FPL and 8.25% at or above 400% FPL among Black adults; corresponding White estimates were 14.27% and 5.95%. Absolute reductions were 6.92 and 8.32 percentage points, respectively, a White minus Black difference of 1.40 points. Excluding years with unstable Black higher-income estimates preserved the direction on both scales. Annual relative reductions were smaller among Black adults in four of the six retained years; absolute reductions were smaller in three of six.
3.5. Inability to Afford Basic Necessities due to Medical Bills
For Aim 2, the 2019–2024 relative reduction associated with higher income was smaller among Black adults than White adults (38.2% versus 43.4%). This finding is consistent with MDRs on the relative scale. Absolute reductions remained similar (16.0 versus 15.6 percentage points). Mean annual conditional prevalence was 41.75% below and 25.80% at or above 400% FPL among Black adults, compared with 35.98% and 20.38% among White adults. The item 2 panels in Figure 1, Figure 2 and Figure 3 use the same display approaches as item 1. These percentages apply only to adults reporting medical bill payment difficulties.
The period comparison was sensitive to the included years. Across the common 2018–2024 period, relative reductions were nearly identical (42.6% among Black adults and 42.7% among White adults), while absolute reductions were 17.31 and 15.03 percentage points. For 2019–2024, annual relative reductions were smaller among Black adults in 2020 and 2024, but larger in 2019, 2021, 2022, and 2023. Absolute reductions were smaller among Black adults in 2020 and 2024, larger in 2019, 2021, and 2022, and equal in 2023. In 2020, higher-income Black prevalence exceeded lower-income Black prevalence. The 2017 higher-income Black affirmative estimate was suppressed, and several remaining estimates were unstable (Table 1).
4. Discussion
4.1. Principal Findings
For Aim 1, relative reductions in medical bill payment difficulties associated with higher income were smaller among Black than White adults in both the 2017–2024 and 2019–2024 summaries. Absolute reductions also followed the MDR direction. For Aim 2, the 2019–2024 relative reduction in inability to afford basic necessities due to medical bills was smaller among Black adults (38.2% versus 43.4%), consistent with MDRs on the relative scale. Absolute reductions were similar (16.0 versus 15.6 percentage points). Both aims showed smaller relative reductions among Black adults in the 2019–2024 summaries.
A consistent feature of the 2019–2024 period summaries was higher mean prevalence of both forms of hardship among higher-income Black than White adults. At or above 400% FPL, mean annual medical bill payment difficulties were 8.25% among Black adults and 5.95% among White adults. Among adults reporting payment difficulties, mean annual inability to afford basic necessities due to medical bills was 25.80% and 20.38%, respectively. These findings suggest that substantial financial hardship may persist among Black adults despite higher income. We use higher-income rather than non-poor because the comparison threshold was 400% FPL; the category below that threshold also includes adults above the official poverty line. This consistency concerns the period averages, not every annual estimate. Within the higher-income category, Black prevalence exceeded White prevalence in five of six years for payment difficulties, with equality in 2024, and in three of six years for inability to afford necessities. Higher prevalence among higher-income Black adults is a related finding, but does not by itself establish diminished returns; that assessment also requires comparing income associations within each racial group.
The annual findings qualify these interpretations. For payment difficulties, five of eight relative contrasts and four of eight absolute contrasts followed the MDR direction. For inability to afford necessities, relative reductions were smaller among Black adults in only two of the six years from 2019 through 2024. Its 2018–2024 relative reductions were nearly identical across races. The two aims therefore offer different levels of descriptive support rather than two statistically established interactions. The second item’s selected denominator and unstable estimates further limit comparison between outcomes.
Prior national studies documented greater medical debt and payment difficulties among Black than White adults, including older adults. Differences in health, income, and insurance explained part of the disparity; borrowing, collection contacts, and use of savings also differed by race. Recent credit-report research using imputed race and ethnicity likewise identified the highest medical-debt burden among Black borrowers. These studies provide relevant context, although their measures and populations differ from CHIS. [25,26,27]
Higher income was associated with lower prevalence of medical bill payment difficulties among both Black and White adults, expressed as a relative reduction of 47.7% and 58.0%, respectively, across 2017–2024. This shared protective association is consistent with the socioeconomic gradient described by Adler and Ostrove and with Link and Phelan’s theory of fundamental causes: economic resources can support access to care and the ability to respond to health needs [6,8]. In this study, higher income may provide more capacity to absorb medical bills while meeting everyday expenses. These pathways are plausible explanations rather than mechanisms tested with the aggregate data.
Marmot identifies material conditions, social participation, and control over life circumstances as pathways linking income to health [28]. Applied to medical financial hardship, greater income can increase the resources available for treatment and household necessities and expand choices when unexpected expenses occur. Ross and Mirowsky’s work on perceived control and problem solving provides complementary psychosocial context, although its outcome was depression rather than medical financial hardship [29]. Their research on insurance also directly showed reduced difficulties paying medical bills among insured adults, reinforcing the relevance of coverage alongside economic resources [30].
Zajacova and Lawrence emphasize that socioeconomic resources operate within educational, institutional, and historical contexts [31]. Their review concerns education and health, but it helps frame why income should be interpreted within the opportunities and protections available to households. Together, these perspectives support the main association observed in both racial groups while allowing its magnitude to differ. The weaker relative reduction among Black adults therefore complements the overall protective association of higher income; it does not imply that higher income offers no protection to Black adults.
4.2. Interpretation Through the MDR Framework
The results extend the question posed by MDRs to a measure of health care affordability. Much of the framework concerns whether resources are associated with similar health advantages across social groups [11]. Here, the observed contrasts concern the ability to pay medical bills and to afford basic necessities among adults experiencing payment problems. A smaller difference by income could arise when households in the higher-income category remain exposed to costs or obligations that their income does not fully offset. The findings also show that higher income was associated with lower payment-problem prevalence among Black adults in every year, while the necessities outcome showed a reversal in 2020. The descriptive MDR pattern concerns the relative size of that association, rather than an absence of an income gradient.
Income-related findings may differ across outcomes, settings, and periods. The Michigan study of self-rated mental health reported a smaller income association among Black adults, whereas earlier MDR discussions noted that income did not always follow the pattern seen for other resources [12,13]. Our California estimates cannot determine whether the same pathways operate across mental health, mortality, and medical bill payment difficulties. They instead identify a financial outcome for which the hypothesis can be assessed using individual-level data. Reporting contradictory annual estimates is necessary to avoid treating the theory as a conclusion established in advance.
Medical bills can compete with food, housing, and other necessities. A national study of families with children associated medical debt with food insecurity across income groups, while research on debt-related financial hardship linked changes in spending and care-seeking to poorer health. These findings support examining payment difficulties and necessities hardship as related but distinct outcomes. [32,33]
Insurance status alone does not capture financial protection. Studies of insurance and financial well-being, inadequate coverage, and alternative measures of unaffordability emphasize the relevance of benefit design and access. Expenditure-to-income measures can overlook people who avoid care because of cost; medical spending can also reduce the income remaining for basic needs. Coverage disruptions have been associated with worse access and affordability even among adults insured at the time of interview. [34,35,36,37,38]
Clinical needs may further differentiate financial hardship within income groups. Medical debt has been associated with serious psychological distress and deferred medical, mental health, and dental care. Research among uninsured adults linked billed charges to payment defaults and documented racial differences. Cancer-related employment and coverage disruptions and childbirth-associated debt among commercially insured adults illustrate additional sources of heterogeneity that the aggregate CHIS tables cannot examine. [39,40,41,42,43]
4.3. Possible Social and Economic Explanations
Wealth is one possible explanation for differences within income categories. Income measures a flow of resources, while savings and other assets may help households absorb unexpected bills. National Survey of Consumer Finances findings document large racial differences in wealth and financial uncertainty [15]. If higher-income Black and White households differ in liquid assets or existing obligations, the same income category could represent different levels of financial security. This explanation is plausible, but wealth was not measured in the supplied CHIS tables and was not tested here.
Household financial security may also depend on how resources are shared and how stable they are over time. A household with variable earnings, dependents with ongoing care needs, or limited liquid savings may face payment difficulties despite income above the study cutoff. None of these conditions can be inferred from racial identity alone. A follow-up study should measure assets, debt obligations, employment stability, and family composition directly and assess whether they account for part of the observed pattern [9].
Health insurance and medical care needs may also matter. National evidence links medical indebtedness with coverage loss, high-deductible private coverage, disability, and hospitalization [1]. Racial differences in insurance continuity, plan costs, or care needs within income categories could contribute to different payment difficulties. Alternatively, the observed pattern may partly reflect age composition or differences in household size and family medical expenses. Because the outcome includes bills for household family members, information about the respondent’s own insurance or health alone would not fully capture the relevant exposure.
Medical expenses and income may change together. An event-study analysis found that hospital admissions were followed by higher medical spending and unpaid bills as well as lower earnings among nonelderly insured adults [44]. This provides a reason to consider health-related income loss and timing, rather than treating income as necessarily preceding payment difficulties. Evidence from the Oregon insurance experiment and studies of coverage expansion also indicates that insurance arrangements can affect financial strain and affordability [45,46,47]. These studies do not show that insurance explains the Black–White contrast in our data.
A recent national study of US adults using Medical Expenditure Panel Survey data for 2014–2023 found that functional limitations were associated with household medical bill payment problems after adjustment [48]. This is closely related to our outcome and reinforces the need to consider disability and health needs when comparing income groups. However, their national analysis used different data and did not establish the Black–White income contrast examined here. Our tables cannot show whether functional limitations explain part of that contrast.
Structural racism may shape these conditions through unequal opportunities in employment, housing, and credit, as well as unequal experiences in health care [14]. This interpretation places the research question in its social context. However, no measure of structural racism or discrimination was available in this export, and race was not a direct measure of any single mechanism. The analysis cannot attribute the observed income contrasts to racism, distinguish between specific structural pathways, or rule out compositional explanations. These questions require designs that measure the relevant conditions and define the causal assumptions explicitly.
Place may shape the conditions under which income is associated with financial security. Literature on residential segregation and neighborhood conditions describes geographically patterned access to resources and exposures [49,50]. Structural racism scholarship also emphasizes the importance of policies that organize opportunities across places [51]. In this study, county, neighborhood, health care market, and urban or rural residence were not available. Geographic explanations are therefore hypotheses for a multilevel follow-up, rather than findings of the present analysis.
Evidence from Louisiana and Michigan associates Medicaid expansion enrollment with reductions in medical debt in collections, while research on Oregon's hospital financial assistance policy associates expanded assistance with lower county-level medical debt and increased charity care. These findings identify policy approaches worth evaluating in California alongside racial equity in eligibility, enrollment, and implementation; the present analysis does not estimate their effects. [52,53,54]
Medical financial hardship also has broader health relevance. County-level research associated medical debt with worse health, premature death, and mortality, and individual-level research has examined hardship in relation to mortality risk. Earlier research among bankruptcy filers illustrates that serious medical financial strain can occur among insured and middle-class households. These outcomes extend beyond the payment and necessities measures analyzed here and should not be treated as interchangeable. [55,56,57]
4.4. Implications for Research and Policy
Research on medical affordability should consider whether income categories identify comparable financial security across racial groups. A focus limited to adults below the poverty line may overlook payment difficulties among adults with higher incomes. In these estimates, the higher-income Black group had a mean annual prevalence of 7.63%, suggesting that this income category did not eliminate reported difficulties. At the same time, prevalence was substantially higher in the lower-income category for both races. Policies that address low income remain relevant even when researchers also examine unequal associations of resources.
The findings support evaluating affordability initiatives across both race and income, rather than assuming uniform associations. Possible areas for evaluation include out-of-pocket costs, continuity of coverage, access to financial assistance, and billing practices. Measures of savings, debt obligations, and family medical expenses could help clarify which households remain financially exposed despite higher income. These recommendations arise from the observed distribution of difficulties and the broader literature; the present analysis did not assess any policy intervention or show that a specific reform would reduce the racial difference.
The external policy literature gives reasons to evaluate coverage and financial protection, but it should not be used to infer that a particular reform would change the income gradient observed here. The Oregon experiment examined a specific low-income population, and studies of Medicaid expansion evaluated settings and eligibility groups different from the higher-income category in this study [45,46,47]. Evaluations in California should report overall affordability and distributional changes across race, income, and place, including whether people obtain needed care. Lower payment difficulties accompanied by greater unmet need would require a different interpretation from lower difficulties with maintained access.
When respondent-level data and appropriate survey design information become available, future research should conduct formal race-by-income interaction tests for each outcome to assess statistical evidence. These tests could not be performed using the supplied AskCHIS online-analysis tables, which lack the respondent records, replicate weights, and covariance information needed for valid inference on the derived contrasts. Future analyses should present relative associations first, alongside marginal predicted prevalences and absolute contrasts. They should distinguish all-adult payment difficulties from hardship conditional on reporting payment problems, examine finer income categories, and consider the CHIS redesign. Age and household composition are important standardization variables. Insurance, employment, wealth, and care use should be included according to a stated research question rather than treated as interchangeable controls.
Further work should also examine whether the association differs within Black populations and across other racial and ethnic groups. Ethnicity can include nativity, national origin, and language as well as a group’s social position [58]. Research on Black immigrants shows why a single Black category may conceal differences related to origin and migration history, although those studies examined health rather than medical bill payment difficulties [59,60]. Intersectionality provides a framework for considering race together with gender, age, disability, and socioeconomic position [61,62]. Adequate subgroup samples and explicit hypotheses are needed to avoid interpreting noisy estimates as evidence of distinct patterns.
4.5. Strengths and Limitations
A strength of this study is the use of eight years of publicly disseminated survey-weighted estimates from a California population survey. We evaluated relative and absolute contrasts for two related outcomes with explicitly different denominators, displayed all annual results, and examined whether the period summary depended on source instability flags. The explicit outcome definitions avoid conflating payment difficulties with current medical debt. The tables also allow readers to reproduce the descriptive calculations from the same rounded inputs.
4.5.1. Aggregate Data and Statistical Uncertainty
The data consisted of aggregate race–income estimates. We could not standardize for age, gender, employment, insurance, household composition, disability, chronic illness, or use of care. Differences between the groups may therefore partly reflect their composition. The source confidence intervals describe individual annual prevalences, not the difference between income contrasts. Overlap or nonoverlap of these intervals is not a formal test of interaction; differences between estimates require their own uncertainty assessment [24,63]. Survey replicate weights, subgroup respondent counts, and covariance information were unavailable. Estimated population counts cannot substitute for sample sizes.
The Black higher-income estimates in 2017 and 2018 were flagged as statistically unstable, and other annual Black estimates also have wide source-reported intervals. Removing the two flagged years preserved the direction of the period summary, but this does not establish that the remaining contrasts are precise. The annual absolute pattern was present in only four of eight years. Its reversal in other years may reflect sampling variation, population changes, or variation in the underlying association. Neither the summary difference nor the annual reversals should be described as statistically established.
For the necessities outcome, higher-income Black estimates were flagged as statistically unstable in 2018, 2019, 2021, 2022, and 2023; the 2017 affirmative estimate was suppressed. The lower-income Black estimate in 2017 and higher-income White estimate in 2017 were also flagged. The eligible population counts are weighted population estimates, not respondent sample sizes. The selected 2019–2024 summary retains several unstable inputs, and its modest relative-scale difference should not be interpreted as a confirmed interaction.
4.5.2. Study Design and Income Measurement
The equally weighted mean of annual estimates is a descriptive summary, rather than a pooled population prevalence or the estimated response to an income increase. Each year contributes equally even though population sizes and precision may differ. The cross-sectional data do not follow individuals, establish temporal ordering, or distinguish selection into income categories from changes in affordability. Medical illness can reduce earnings while increasing bills, creating a possible source of reverse temporal ordering [44]. Calculations also use source percentages rounded to one decimal place; displaying summary values to two decimal places does not restore information lost through rounding.
Dichotomizing income at 400% FPL conceals variation within broad categories. The category below 400% FPL includes both adults below the official poverty threshold and adults with incomes above it. The category at or above 400% FPL includes a wide range of household resources. Black and White adults within the same category may have different income distributions. The analysis cannot distinguish a smaller association of equivalent income from unequal distributions within the categories. It also lacks information about wealth, liquid savings, debt, income volatility, and resources remaining after essential expenses [8,9].
4.5.3. Medical Bill Payment Difficulties
The outcome is self-reported difficulty paying medical bills for oneself or a household family member during the past 12 months. It is neither a current debt balance nor a measure of the respondent’s personal bills alone. We cannot identify whose care generated the bill, the amount owed, the proportion of household income involved, the length or frequency of the difficulty, or whether the problem was resolved. The export does not separate hospital, outpatient, prescription, dental, or other charges; establish which of these were included by respondents; or identify billing errors, insurance denials, collection activity, payment plans, or sources of financial assistance. These details could alter the meaning and severity of an affirmative response.
Material, psychological, and behavioral hardship are related but distinct [3]. The first item does not quantify worry about future costs, sacrifices of necessities, borrowing, depletion of savings, or delayed and forgone care. The second item adds reported inability to afford basic necessities but does not identify which necessities were affected, the duration or severity, or other coping strategies. Differences in care use can also change exposure to bills. A person who avoids needed care may report no payment difficulty despite substantial unmet need. The same affirmative response may represent a brief payment delay for one household and prolonged financial strain for another. Future analyses should combine payment difficulties with care access and other hardship measures rather than treating this item as a complete measure of financial protection.
Recall over 12 months, interpretation of “problems paying,” and willingness to report hardship may differ across respondents. We cannot assess whether these reporting processes vary by race, income, language, or survey mode. Household members may also differ in their knowledge of bills and coverage. Multiple adult respondents from a household, if represented in the survey, would not make the adult prevalence a household prevalence. The available export does not permit examination of these measurement issues.
The necessities item was asked only of adults with payment difficulties. This restriction excludes adults with a negative response to the first item by design; it is not evidence of extensive ordinary item nonresponse and does not show that skips were coded as zero in this export. Conditioning on payment problems may select different populations across race and income, so the second association cannot be generalized directly to all adults or interpreted as an independent replication of the first. Analysis of a population-level joint outcome would require a separately defined measure and appropriate survey uncertainty assessment. The file does not provide a complete accounting of missing responses within the eligible population.
4.5.4. Racial Classification and Other Groups
The export omitted the detailed race and ethnicity query filters. We therefore cannot verify whether Black and White categories were restricted to non-Hispanic respondents, how multiracial identities were handled, or whether race and ethnicity categories overlapped. Black should not automatically be treated as synonymous with non-Hispanic Black, US-born African American, or a single ancestry group. Classification choices may affect both the populations represented and the resulting contrasts. Race and ethnicity should be defined explicitly and interpreted as social classifications rather than biological explanations [16,58].
The study included only Black and White adults. It offers no direct evidence about Hispanic or Latino, Asian, American Indian or Alaska Native, Native Hawaiian or Pacific Islander, multiracial, or other populations. Their exclusion reflects the supplied tables and does not imply that their experiences are less relevant or follow the same pattern. A Black–White comparison cannot establish diminished income associations for all minoritized groups. Future research should examine additional groups with transparent coding, sufficient samples, and meaningful disaggregation of national origin and ethnic identity where possible [58].
4.5.5. Heterogeneity Within Black and White Populations
The Black category combines people with different ancestry, nativity, migration histories, national origins, language use, and ethnic identities. It may include US-born African Americans, African and Caribbean immigrants and their descendants, Black Latino adults, and multiracial Black adults, depending on the unverified query settings. Prior research has documented heterogeneity in health by migration history among Black adults, but those findings cannot establish subgroup differences in payment difficulties here [59,60]. We could not assess whether income contrasts differed by these characteristics or whether annual changes reflected shifts in subgroup composition.
The analysis also does not distinguish age, gender, disability, sexual orientation, family structure, occupation, education, or insurance arrangements within either racial category. Intersections of these social positions may shape resources, care needs, and experiences of exclusion [61,62]. Differences in skin tone, perceived racial identity, or discrimination were not measured. White adults are also heterogeneous in socioeconomic circumstances, nativity, ethnicity, and place. The group-level result should not be assumed to describe every member or subgroup of either population. Disaggregation would require a balance between substantive detail, survey precision, and respondent confidentiality.
Evidence from a small study of rural LGBTQ+ adults in southern Illinois reported variation in medical bill payment difficulties across sexual orientation groups and differences in experiences of care across gender identities [64]. This supports examining the intersection of place, sexual orientation, and gender identity in future affordability research. It does not establish the corresponding pattern among Black Californians, and its small sample and regional setting limit generalization. These dimensions were not available in the supplied tables.
4.5.6. Geography and Generalizability
Statewide estimates may obscure differences across California counties, metropolitan areas, rural communities, and neighborhoods. The export provided no geographic detail beyond the state. We could not evaluate segregation, local housing costs, transportation, provider availability, medical prices, hospital billing practices, or local assistance programs. These features are plausible contextual influences, but their contribution was not estimated. Research on segregation and neighborhoods supports examining place directly rather than attributing all differences to individual income [49,50].
A national FPL threshold does not by itself measure local costs of living. The same income category may imply different resources after housing and other essential expenses across California. Black and White populations may also be distributed differently across places, so a statewide contrast may partly reflect geography. County- or neighborhood-level analyses with appropriate survey methods could assess this possibility. The results apply to the included California adult populations during 2017–2024 and cannot be presumed to represent other states, children, or later periods. Differences in coverage arrangements and health care systems further limit transportability of the observed association.
4.5.7. Survey Changes and Unmeasured Pathways
CHIS changed sampling and administration in 2019. The 2019–2024 sensitivity analysis reduced one comparability concern but did not separate survey changes from temporal changes in the population. The period also spans the COVID-19 pandemic and changing economic and health care conditions. We cannot attribute any annual movement to the pandemic, a policy change, or another event. Nonresponse, coverage, language access, and income imputation may also affect estimates; the supplied tables do not allow us to evaluate their influence within the four groups.
Finally, neither structural racism nor specific discrimination experiences were measured. Race is not a substitute for measures of segregation, employment discrimination, credit conditions, unequal insurance benefits, or treatment within health care. Frameworks on racism emphasize the need to define and measure mechanisms at the appropriate level and over time [17,51,65]. The observed pattern is compatible with several social explanations but does not identify them, establish mediation, or exclude alternative explanations. These limitations make the present study a starting point for more detailed analysis rather than a causal demonstration.
5. Conclusions
Higher income was associated with smaller relative prevalence of medical bill payment difficulties among both Black and White adults, with a smaller reduction among Black adults in the period summaries. For inability to afford basic necessities due to medical bills among adults reporting payment problems, the 2019–2024 relative reduction was smaller among Black adults, consistent with MDRs on the relative scale. Absolute reductions for this second outcome were similar. Together, the 2019–2024 relative comparisons suggest weaker income-associated protection among Black adults across both outcomes. When suitable respondent-level survey data become available, future research should conduct formal race-by-income interaction tests to assess statistical evidence; this could not be done with the supplied online-analysis exports.
Appendix A. Source Mapping and Reproducibility
The analytic source was the worksheet “Bl Wh-400-500 % Poverty Line” in the investigator-supplied file “CHIS med debt by race and poverty in CA.xlsx.” The investigator confirmed the four race–income groups. Columns C, G, L, and Q contained the affirmative-response prevalences for Black ≥400% FPL, White ≥400% FPL, Black <400% FPL, and White <400% FPL, respectively. Rows 2, 5, 8, 11, 14, 17, 20, and 23 represented 2017 through 2024. The following row contained the corresponding 95% confidence intervals. The “has not had problems” and “total” sections were not separate observations in this analysis.
Each numeric fraction was multiplied by 100; text values such as “4.0% *” were read as 4.0 percentage points while retaining the instability flag. For each year, the Black absolute contrast was column L minus column C, and the White absolute contrast was column Q minus column G. The White minus Black contrast was the difference between those two results. A positive value was classified as consistent with MDRs on the absolute scale. The Black relative reduction was the Black absolute contrast divided by column L, multiplied by 100; the White relative reduction used column Q as its denominator.
For the full-period summary, each group’s eight annual percentages was summed and divided by eight. For the sensitivity analysis, percentages for 2019–2024 were summed and divided by six. Period relative reductions used the resulting mean prevalences. As an example, the full-period Black means were 14.5875% and 7.6250%, giving an absolute contrast of 6.9625 percentage points and a relative reduction of 47.7292%. White means were 14.3000% and 6.0125%, giving an absolute contrast of 8.2875 percentage points and a relative reduction of 57.9545%. The difference between the absolute contrasts was 1.3250 percentage points. Display rounding was applied only after calculation.
For the second outcome, Sheet1 of “CHIS med not beig able to pay by race and poverty in CA.xlsx” contains affirmative percentages in columns C (Black <400% FPL), G (White <400% FPL), L (White ≥400% FPL), and P (Black ≥400% FPL), at rows 2, 5, 8, 11, 14, 17, 20, and 23. Its eligible totals match the first item’s affirmative-response population counts. In 2024 the higher-income Black total appears separately in cell P67 as 34,000. The suppressed 2017 affirmative estimate was retained as unavailable, without reconstructing it from the negative category. For 2019–2024, mean prevalences were 41.7500% and 25.8000% among Black adults and 35.9833% and 20.3833% among White adults. Relative reductions were 38.2036% and 43.3534%; absolute reductions were 15.9500 and 15.6000 points. For 2018–2024, corresponding relative reductions were 42.5711% and 42.6602%. All calculations use conditional prevalences, not zeros assigned to ineligible adults.
Institutional Review Board Statement
This analysis used only existing aggregate CHIS estimates and no identifiable participant records.
Informed Consent Statement
No new participants were recruited and no consent was obtained specifically for this aggregate-data analysis.
Data Availability Statement
The underlying survey estimates are available through AskCHIS at https://healthpolicy.ucla.edu/our-work/askchis. Table 1 reproduces all affirmative-response estimates used here. Appendix A specifies the source mapping and calculation rules.
Acknowledgments
ChatGPT (OpenAI) was used to edit the manuscript draft, source identification, and preparation of figures from the supplied estimates.
Conflicts of Interest
None.
Abbreviations
CHIS, California Health Interview Survey; FPL, federal poverty level; MDRs, Minorities’ Diminished Returns; pp, percentage points.
References
- Himmelstein, D.U.; Dickman, S.L.; McCormick, D.; Bor, D.H.; Gaffney, A.; Woolhandler, S. Prevalence and Risk Factors for Medical Debt and Subsequent Changes in Social Determinants of Health in the US. JAMA Netw. Open 2022, 5, e2231898. [Google Scholar] [CrossRef]
- Kluender, R.; Mahoney, N.; Wong, F.; Yin, W. Medical Debt in the US, 2009–2020. JAMA 2021, 326, 250–256. [Google Scholar] [CrossRef]
- Yabroff, K.R.; Zhao, J.; Han, X.; Zheng, Z. Prevalence and Correlates of Medical Financial Hardship in the USA. J. Gen. Intern. Med. 2019, 34, 1494–1502. [Google Scholar] [CrossRef]
- Banegas, M.P.; Guy, G.P., Jr.; de Moor, J.S.; Ekwueme, D.U.; Virgo, K.S.; Kent, E.E.; Nutt, S.; Zheng, Z.; Rechis, R.; Yabroff, K.R. For Working-Age Cancer Survivors, Medical Debt and Bankruptcy Create Financial Hardships. Health Aff. 2016, 35, 54–61. [Google Scholar] [CrossRef]
- Zheng, Z.; Jemal, A.; Han, X.; Guy, G.P., Jr.; Li, C.; Davidoff, A.J.; Banegas, M.P.; Ekwueme, D.U.; Yabroff, K.R. Medical Financial Hardship among Cancer Survivors in the United States. Cancer 2019, 125, 1737–1747. [Google Scholar] [CrossRef]
- Link, B.G.; Phelan, J. Social Conditions as Fundamental Causes of Disease. J. Health Soc. Behav. 1995, Extra Issue, 80–94. [Google Scholar] [CrossRef]
- Williams, D.R.; Mohammed, S.A.; Leavell, J.; Collins, C. Race, Socioeconomic Status, and Health: Complexities, Ongoing Challenges, and Research Opportunities. Ann. N. Y. Acad. Sci. 2010, 1186, 69–101. [Google Scholar] [CrossRef]
- Adler, N.E.; Ostrove, J.M. Socioeconomic Status and Health: What We Know and What We Don’t. Ann. N. Y. Acad. Sci. 1999, 896, 3–15. [Google Scholar] [CrossRef]
- Braveman, P.A.; Cubbin, C.; Egerter, S.; Chideya, S.; Marchi, K.S.; Metzler, M.; Posner, S. Socioeconomic Status in Health Research: One Size Does Not Fit All. JAMA 2005, 294, 2879–2888. Available online: https://pubmed.ncbi.nlm.nih.gov/16352796/.
- Fiscella, K.; Franks, P.; Gold, M.R.; Clancy, C.M. Inequality in Quality: Addressing Socioeconomic, Racial, and Ethnic Disparities in Health Care. JAMA 2000, 283, 2579–2584. [Google Scholar] [CrossRef]
- Assari, S. Health Disparities due to Diminished Return among Black Americans: Public Policy Solutions. Soc. Issues Policy Rev. 2018, 12, 112–145. [Google Scholar] [CrossRef]
- Assari, S. Unequal Gain of Equal Resources across Racial Groups. Int. J. Health Policy Manag. 2018, 7, 1–9. [Google Scholar] [CrossRef]
- Assari, S.; Lapeyrouse, L.M.; Neighbors, H.W. Income and Self-Rated Mental Health: Diminished Returns for High Income Black Americans. Behav. Sci. 2018, 8, 50. [Google Scholar] [CrossRef]
- Bailey, Z.D.; Krieger, N.; Agénor, M.; Graves, J.; Linos, N.; Bassett, M.T. Structural Racism and Health Inequities in the USA: Evidence and Interventions. Lancet 2017, 389, 1453–1463. [Google Scholar] [CrossRef]
- Aladangady, A.; Chang, A.C.; Krimmel, J. Greater Wealth, Greater Uncertainty: Changes in Racial Inequality in the Survey of Consumer Finances. In FEDS Notes; Board of Governors of the Federal Reserve System: Washington, DC, USA, 2023. [Google Scholar] [CrossRef]
- Harawa, N.T.; Ford, C.L. The Foundation of Modern Racial Categories and Implications for Research on Black/White Disparities in Health. Ethn. Dis. 2009, 19, 209–217. Available online: https://pubmed.ncbi.nlm.nih.gov/19537235/.
- Jones, C.P. Levels of Racism: A Theoretic Framework and a Gardener’s Tale. Am. J. Public Health 2000, 90, 1212–1215. [Google Scholar] [CrossRef]
- Phelan, J.C.; Link, B.G. Is Racism a Fundamental Cause of Inequalities in Health? Annu. Rev. Sociol. 2015, 41, 311–330. [Google Scholar] [CrossRef]
- Williams, D.R.; Lawrence, J.A.; Davis, B.A. Racism and Health: Evidence and Needed Research. Annu. Rev. Public Health 2019, 40, 105–125. [Google Scholar] [CrossRef]
- Williams, D.R.; Lawrence, J.A.; Davis, B.A.; Vu, C. Understanding How Discrimination Can Affect Health. Health Serv. Res. 2019, 54 (Supplement 2), 1374–1388. [Google Scholar] [CrossRef]
- UCLA Center for Health Policy Research. Access CHIS Data. Available online: https://healthpolicy.ucla.edu/our-work/california-health-interview-survey-chis/access-chis-data (accessed on 7 October 2026).
- UCLA Center for Health Policy Research. 2019–2020 Redesign. Available online: https://healthpolicy.ucla.edu/our-work/california-health-interview-survey-chis/chis-design-and-methods/chis-design/chis-2019-2020-redesign (accessed on 7 October 2026).
- May, J.H.; Cunningham, P.J. Tough Trade-Offs: Medical Bills, Family Finances and Access to Care. Issue Brief. Cent. Stud. Health Syst. Change 2004, 85, 1–4. Available online: https://pubmed.ncbi.nlm.nih.gov/15259178/.
- Knol, M.J.; VanderWeele, T.J. Recommendations for Presenting Analyses of Effect Modification and Interaction. Int. J. Epidemiol. 2012, 41, 514–520. [Google Scholar] [CrossRef]
- Wiltshire, J.C.; Elder, K.; Kiefe, C.; Allison, J.J. Medical Debt and Related Financial Consequences Among Older African American and White Adults. Am. J. Public Health 2016, 106, 1086–91. [Google Scholar] [CrossRef]
- Wiltshire, J.C.; Elder, K.; Allison, J.J. Differences in Problems Paying Medical Bills between African Americans and Whites from 2007 and 2009: the Underlying Role of Health Status. J. Racial Ethn. Health Disparities 2016, 3, 381–8. [Google Scholar] [CrossRef]
- Adia, A.C.; Guadamuz, J.S.; Hsuan, C.; Rodriguez, H.P. Trends in medical debt in the United States by imputed borrower race and ethnicity, 2016-2022. Health Aff. Sch. 2026, 4, qxag091. [Google Scholar] [CrossRef]
- Marmot, M. The influence of income on health: views of an epidemiologist. Health Aff. (Millwood) 2002, 21, 31–46. [Google Scholar] [CrossRef]
- Ross, C.E.; Mirowsky, J. Explaining the social patterns of depression: control and problem solving--or support and talking. J. Health Soc. Behav. 1989, 30, 206–19. Available online: https://pubmed.ncbi.nlm.nih.gov/2738367/. [CrossRef]
- Ross, C.E.; Mirowsky, J. Does medical insurance contribute to socioeconomic differentials in health. Milbank Q. 2000, 78(291-321), 151–2. [Google Scholar] [CrossRef]
- Zajacova, A.; Lawrence, E.M. The Relationship Between Education and Health: Reducing Disparities Through a Contextual Approach. Annu Rev. Public Health 2018, 39, 273–289. [Google Scholar] [CrossRef]
- Treffeisen, E.R.; Aziz-Bose, R.; Gundewar, A.U.; Hammad, N.M.; Leung, C.W. The Association between Medical Debt and Food Insecurity among United States Families with Children. J. Pediatr. 2025, 283, 114631. [Google Scholar] [CrossRef]
- Sweet, E. Debt-Related Financial Hardship and Health. Health Educ. Behav. 2021, 48, 885–891. [Google Scholar] [CrossRef]
- Batty, M.; Gibbs, C.; Ippolito, B. Health insurance, medical debt, and financial well-being. Health Econ. 2022, 31, 689–728. [Google Scholar] [CrossRef]
- Markossian, T.W.; Classen, T. The Financial Burden of Inadequate Health Insurance Coverage. Am. J. Kidney Dis. 2021, 78, 627–629. [Google Scholar] [CrossRef]
- Kielb, E.S.; Rhyan, C.N.; Lee, J.A. Comparing Health Care Financial Burden With an Alternative Measure of Unaffordability. Inquiry 2017, 54, 46958017732960. [Google Scholar] [CrossRef]
- Abramowitz, J.; O'Hara, B. The financial burden of medical spending: estimates and implications for evaluating the impact of ACA reforms. Med. Care Res. Rev. 2015, 72, 187–99. [Google Scholar] [CrossRef]
- Yabroff, K.R.; Zhao, J.; Halpern, M.T.; Fedewa, S.A.; Han, X.; Nogueira, L.M.; Zheng, Z.; Jemal, A. Health Insurance Disruptions and Care Access and Affordability in the U.S. Am. J. Prev. Med. 2021, 61, 3. [Google Scholar] [CrossRef]
- Novak, P.J.; Ali, M.M.; Sanmartin, M.X. Disparities in Medical Debt Among U.S. Adults with Serious Psychological Distress. Health Equity 2020, 4, 549–555. [Google Scholar] [CrossRef]
- Moon, K.J.; Becker, N.V.; Miller, K.E.M.; Ettman, C.K. Medical Debt and Deferred Care for Physical Health, Mental Health, and Dental Needs Among U.S. Adults. J. Gen. Intern Med. 2026, 41, 3133–3141. [Google Scholar] [CrossRef]
- Linde, S.; Egede, L.E. Trends in charges and association with defaults on medical payments in uninsured Americans: a disproportionate burden in ethnic minorities - a retrospective observational study. BMJ Open 2022, 12, e054494. [Google Scholar] [CrossRef]
- Yabroff, K.R.; Doran, J.F.; Zhao, J.; Chino, F.; Shih, Y.T.; Han, X.; Zheng, Z.; Bradley, C.J.; Bryant, M.F. Cancer diagnosis and treatment in working-age adults: Implications for employment, health insurance coverage, and financial hardship in the United States. CA Cancer J. Clin. 2024, 74, 341. [Google Scholar] [CrossRef]
- Moniz, M.H.; Stout, M.J.; Kolenic, G.E.; Carlton, E.F.; Scott, J.W.; Miller, M.M.; Becker, N.V. Association of Childbirth With Medical Debt. Obstet. Gynecol. 2024, 143, 11. [Google Scholar] [CrossRef]
- Dobkin, C.; Finkelstein, A.; Kluender, R.; Notowidigdo, M.J. The Economic Consequences of Hospital Admissions. Am. Econ. Rev. 2018, 108, 308–352. [Google Scholar] [CrossRef]
- Baicker, K.; Taubman, S.L.; Allen, H.L.; Bernstein, M.; Gruber, J.H.; Newhouse, J.P.; Schneider, E.C.; Wright, B.J.; Zaslavsky, A.M.; Finkelstein, A.N.; et al. The Oregon Experiment—Effects of Medicaid on Clinical Outcomes. N. Engl. J. Med. 2013, 368, 1713–1722. [Google Scholar] [CrossRef]
- Hu, L.; Kaestner, R.; Mazumder, B.; Miller, S.; Wong, A. The Effect of the Affordable Care Act Medicaid Expansions on Financial Wellbeing. J. Public Econ. 2018, 163, 99–112. [Google Scholar] [CrossRef]
- Sommers, B.D.; Blendon, R.J.; Orav, E.J.; Epstein, A.M. Changes in Utilization and Health among Low-Income Adults after Medicaid Expansion or Expanded Private Insurance. JAMA Intern. Med. 2016, 176, 1501–1509. Available online: https://pubmed.ncbi.nlm.nih.gov/27532694/. [CrossRef]
- Long, Z.; Zhao, Y. Functional Limitations and Medical Bill Payment Problems among US Adults: A National Study, 2014–2023. Public Health Online ahead of print. 2026, 260, 106512. [Google Scholar] [CrossRef]
- Williams, D.R.; Collins, C. Racial Residential Segregation: A Fundamental Cause of Racial Disparities in Health. Public Health Rep. 2001, 116, 404–416. [Google Scholar] [CrossRef]
- Diez Roux, A.V.; Mair, C. Neighborhoods and Health. Ann. N. Y. Acad. Sci. 2010, 1186, 125–145. [Google Scholar] [CrossRef]
- Bailey, Z.D.; Feldman, J.M.; Bassett, M.T. How Structural Racism Works—Racist Policies as a Root Cause of U.S. Racial Health Inequities. N. Engl. J. Med. 2021, 384, 768–773. [Google Scholar] [CrossRef]
- Callison, K.; Walker, B. Medicaid Expansion and Medical Debt: Evidence From Louisiana, 2014-2019. Am. J. Public Health 2021, 111, 1523. [Google Scholar] [CrossRef]
- Becker, N.V.; Levy, H.; Hirth, R.A.; Clark, S.J.; Tipirneni, R.; Ayanian, J.Z. Financial Outcomes Among Medicaid Expansion Enrollees. JAMA Netw. Open 2026, 9, e269328. [Google Scholar] [CrossRef]
- Santos, T.; Lindrooth, R.C.; Young, G.J.; Lee, S.Y. Financial Assistance Policy, Hospital Charity Care, and Medical Debt in Collections. JAMA Netw. Open 2026, 9, e2555698. [Google Scholar] [CrossRef]
- Han, X.; Hu, X.; Zheng, Z.; Shi, K.S.; Yabroff, K.R. Associations of Medical Debt With Health Status, Premature Death, and Mortality in the US. JAMA Netw. Open 2024, 7, e2354766. [Google Scholar] [CrossRef]
- Chen, F.; Nipp, R.D.; Han, X.; Zheng, Z.; Yabroff, K.R.; Jiang, C. Association of Medical Financial Hardship and Mortality Risk among US Adults. J. Gen. Intern Med. 2025, 40, 1211. [Google Scholar] [CrossRef]
- Himmelstein, D.U.; Thorne, D.; Warren, E.; Woolhandler, S. Medical bankruptcy in the United States, 2007: results of a national study. Am. J. Med. 2009, 122, 741–6. [Google Scholar] [CrossRef]
- Ford, C.L.; Harawa, N.T. A New Conceptualization of Ethnicity for Social Epidemiologic and Health Equity Research. Soc. Sci. Med. 2010, 71, 251–258. [Google Scholar] [CrossRef]
- Read, J.G.; Emerson, M.O. Racial Context, Black Immigration and the U.S. Black/White Health Disparity. Soc. Forces 2005, 84, 181–199. Available online: https://academic.oup.com/sf/article-abstract/84/1/181/2234861. [CrossRef]
- Hamilton, T.G.; Hummer, R.A. Immigration and the Health of U.S. Black Adults: Does Country of Origin Matter? Soc. Sci. Med. 2011, 73, 1551–1560. [Google Scholar] [CrossRef]
- Bowleg, L. The Problem with the Phrase Women and Minorities: Intersectionality—An Important Theoretical Framework for Public Health. Am. J. Public Health 2012, 102, 1267–1273. [Google Scholar] [CrossRef]
- Bauer, G.R. Incorporating Intersectionality Theory into Population Health Research Methodology: Challenges and the Potential to Advance Health Equity. Soc. Sci. Med. 2014, 110, 10–17. [Google Scholar] [CrossRef]
- Altman, D.G.; Bland, J.M. Interaction Revisited: The Difference between Two Estimates. BMJ 2003, 326, 219. [Google Scholar] [CrossRef]
- Jenkins, W.D.; Miller, K.W.; Tillewein, H.; Walters, S.; Weatherly, T.; Wickham, H.; Luckey, G.; Fenner, E. Healthcare Experiences and Health Outcomes among Rural LGBTQ+ Individuals. Am. J. Health Promot. 2024, 38, 954–959. [Google Scholar] [CrossRef]
- Krieger, N. Methods for the Scientific Study of Discrimination and Health: An Ecosocial Approach. Am. J. Public Health 2012, 102, 936–944. [Google Scholar] [CrossRef]
Figure 1.
Annual prevalence by race and income, with item 1 on the left (A and C) and item 2 on the right (B and D). A and B show income below 400% FPL; C and D show income at or above 400% FPL. Item 1 is medical bill payment difficulties; item 2 is inability to afford basic necessities due to medical bills, conditional on reporting payment difficulties. Item 1 panels use a 2.5–17.5% vertical range, and item 2 panels use 0–60%. The 2019 lower-income Black estimate of 20.4% exceeds the item 1 axis and is identified by a labeled triangle at the upper boundary; its position does not represent its numeric value. The 2017 higher-income Black estimate for item 2 is unavailable. Lines connect observations without smoothing. Source confidence intervals and instability flags appear in Table 1; apparent differences are not significance tests.
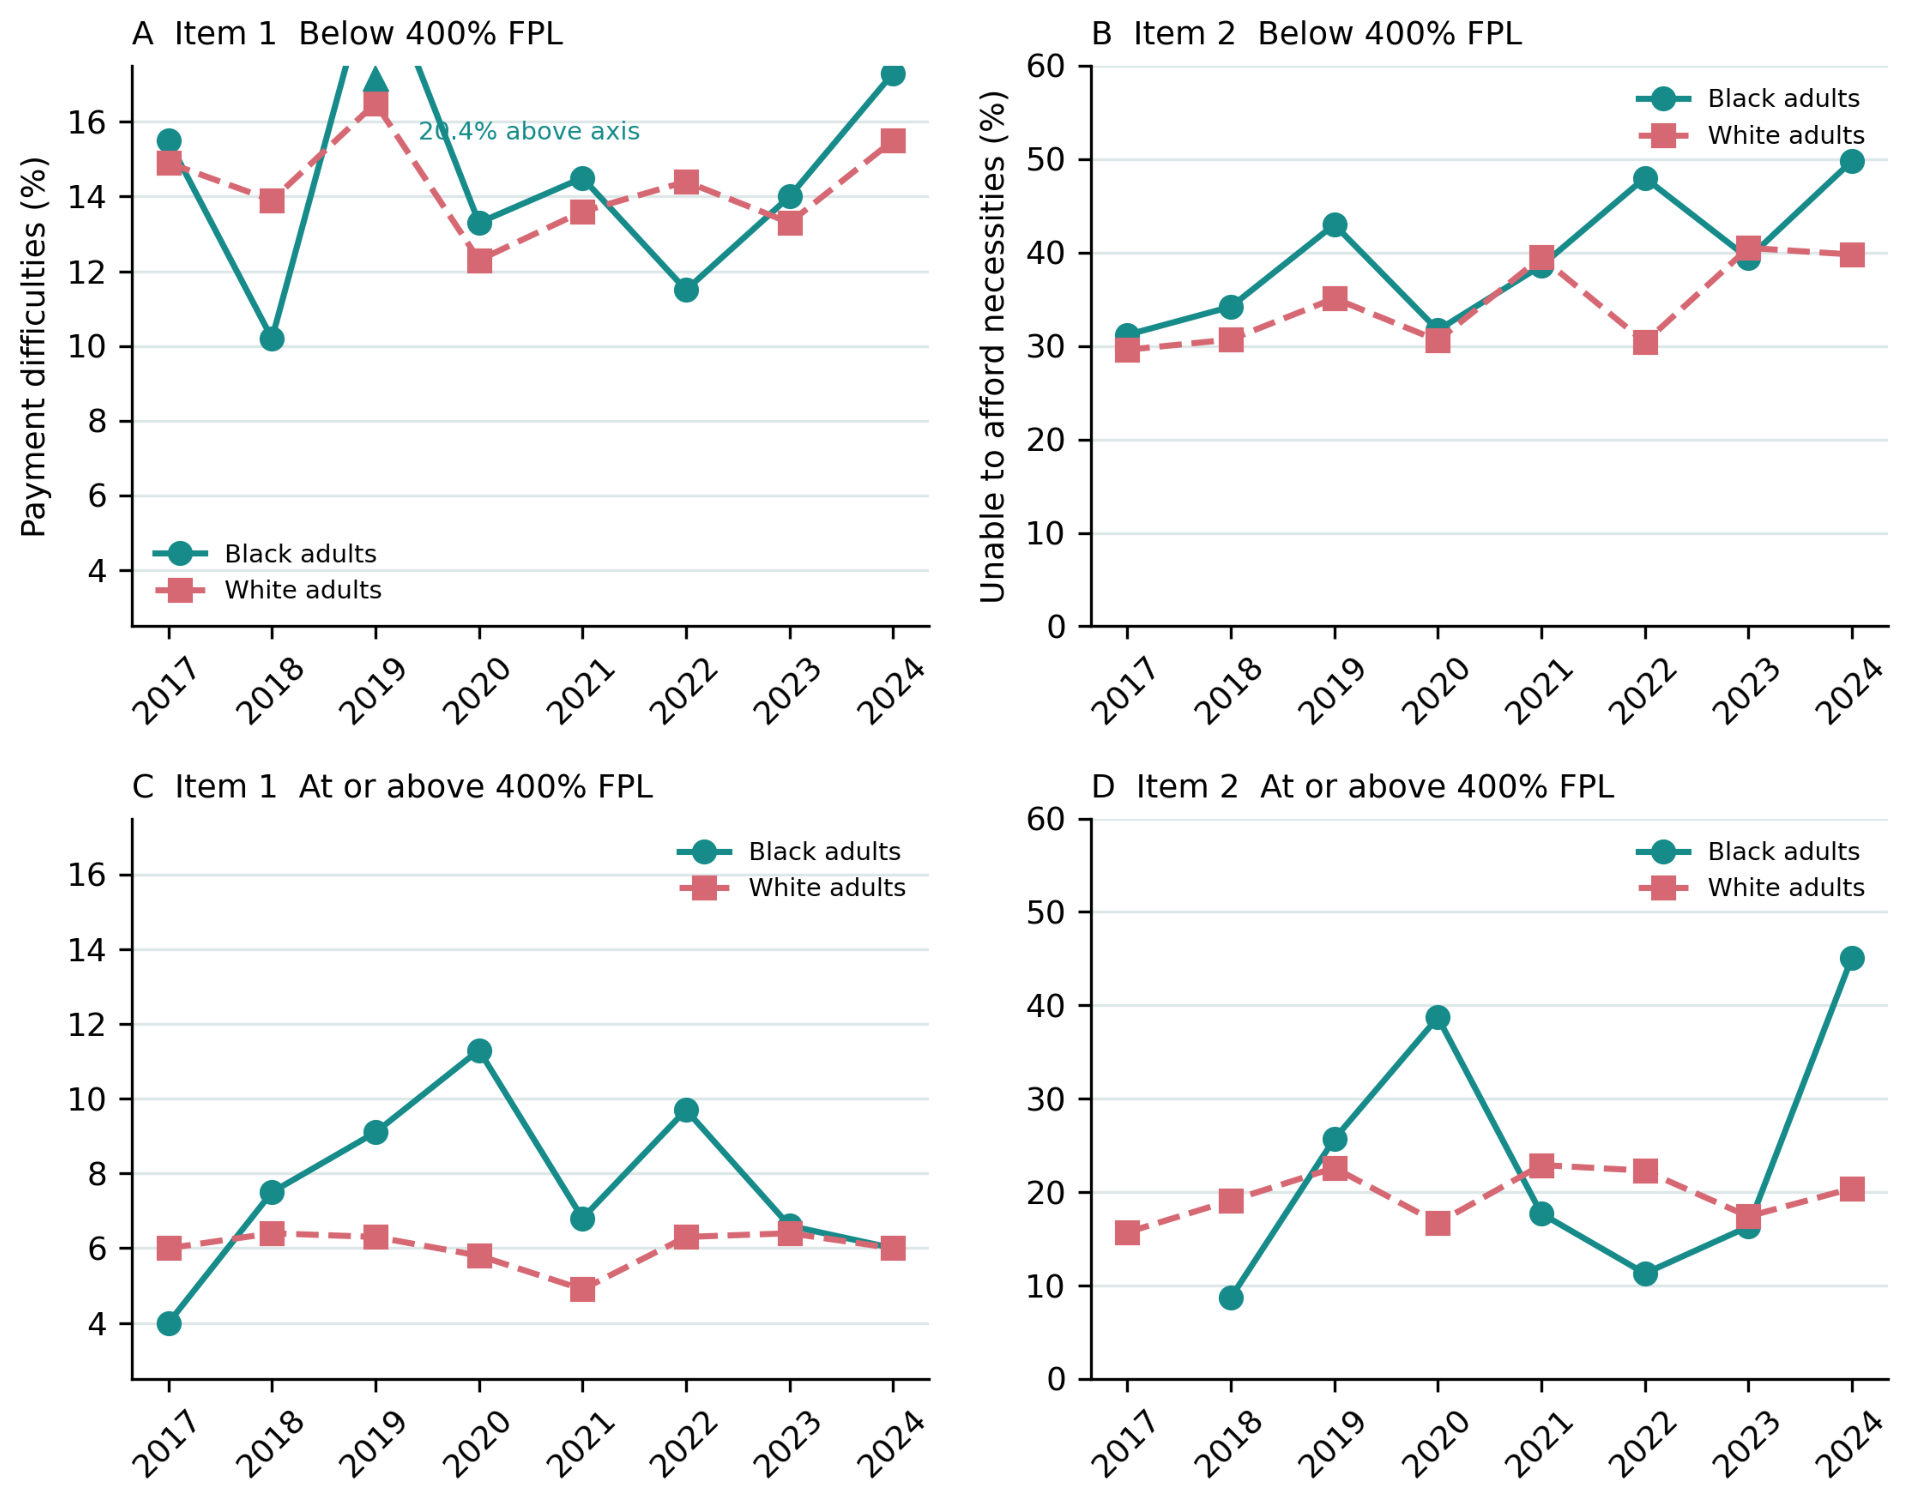
Figure 2.
Mean annual prevalence and absolute income contrasts, with item 1 on the left (A and C) and item 2 on the right (B and D). A summarizes item 1 for 2017–2024; B summarizes conditional item 2 for 2019–2024. Panel B uses a 15–45% vertical range. Lines connect income categories rather than a continuous income model. C and D show annual White minus Black absolute contrasts. Positive values indicate smaller absolute reductions among Black adults. Dashed lines mark the period summary differences: 1.33 pp for item 1 and −0.35 pp for item 2. The 2017 item 2 contrast is unavailable. Relative reductions are presented first in Table 2 and the results text; these panels provide complementary absolute comparisons. Derived contrasts have no estimated confidence intervals.
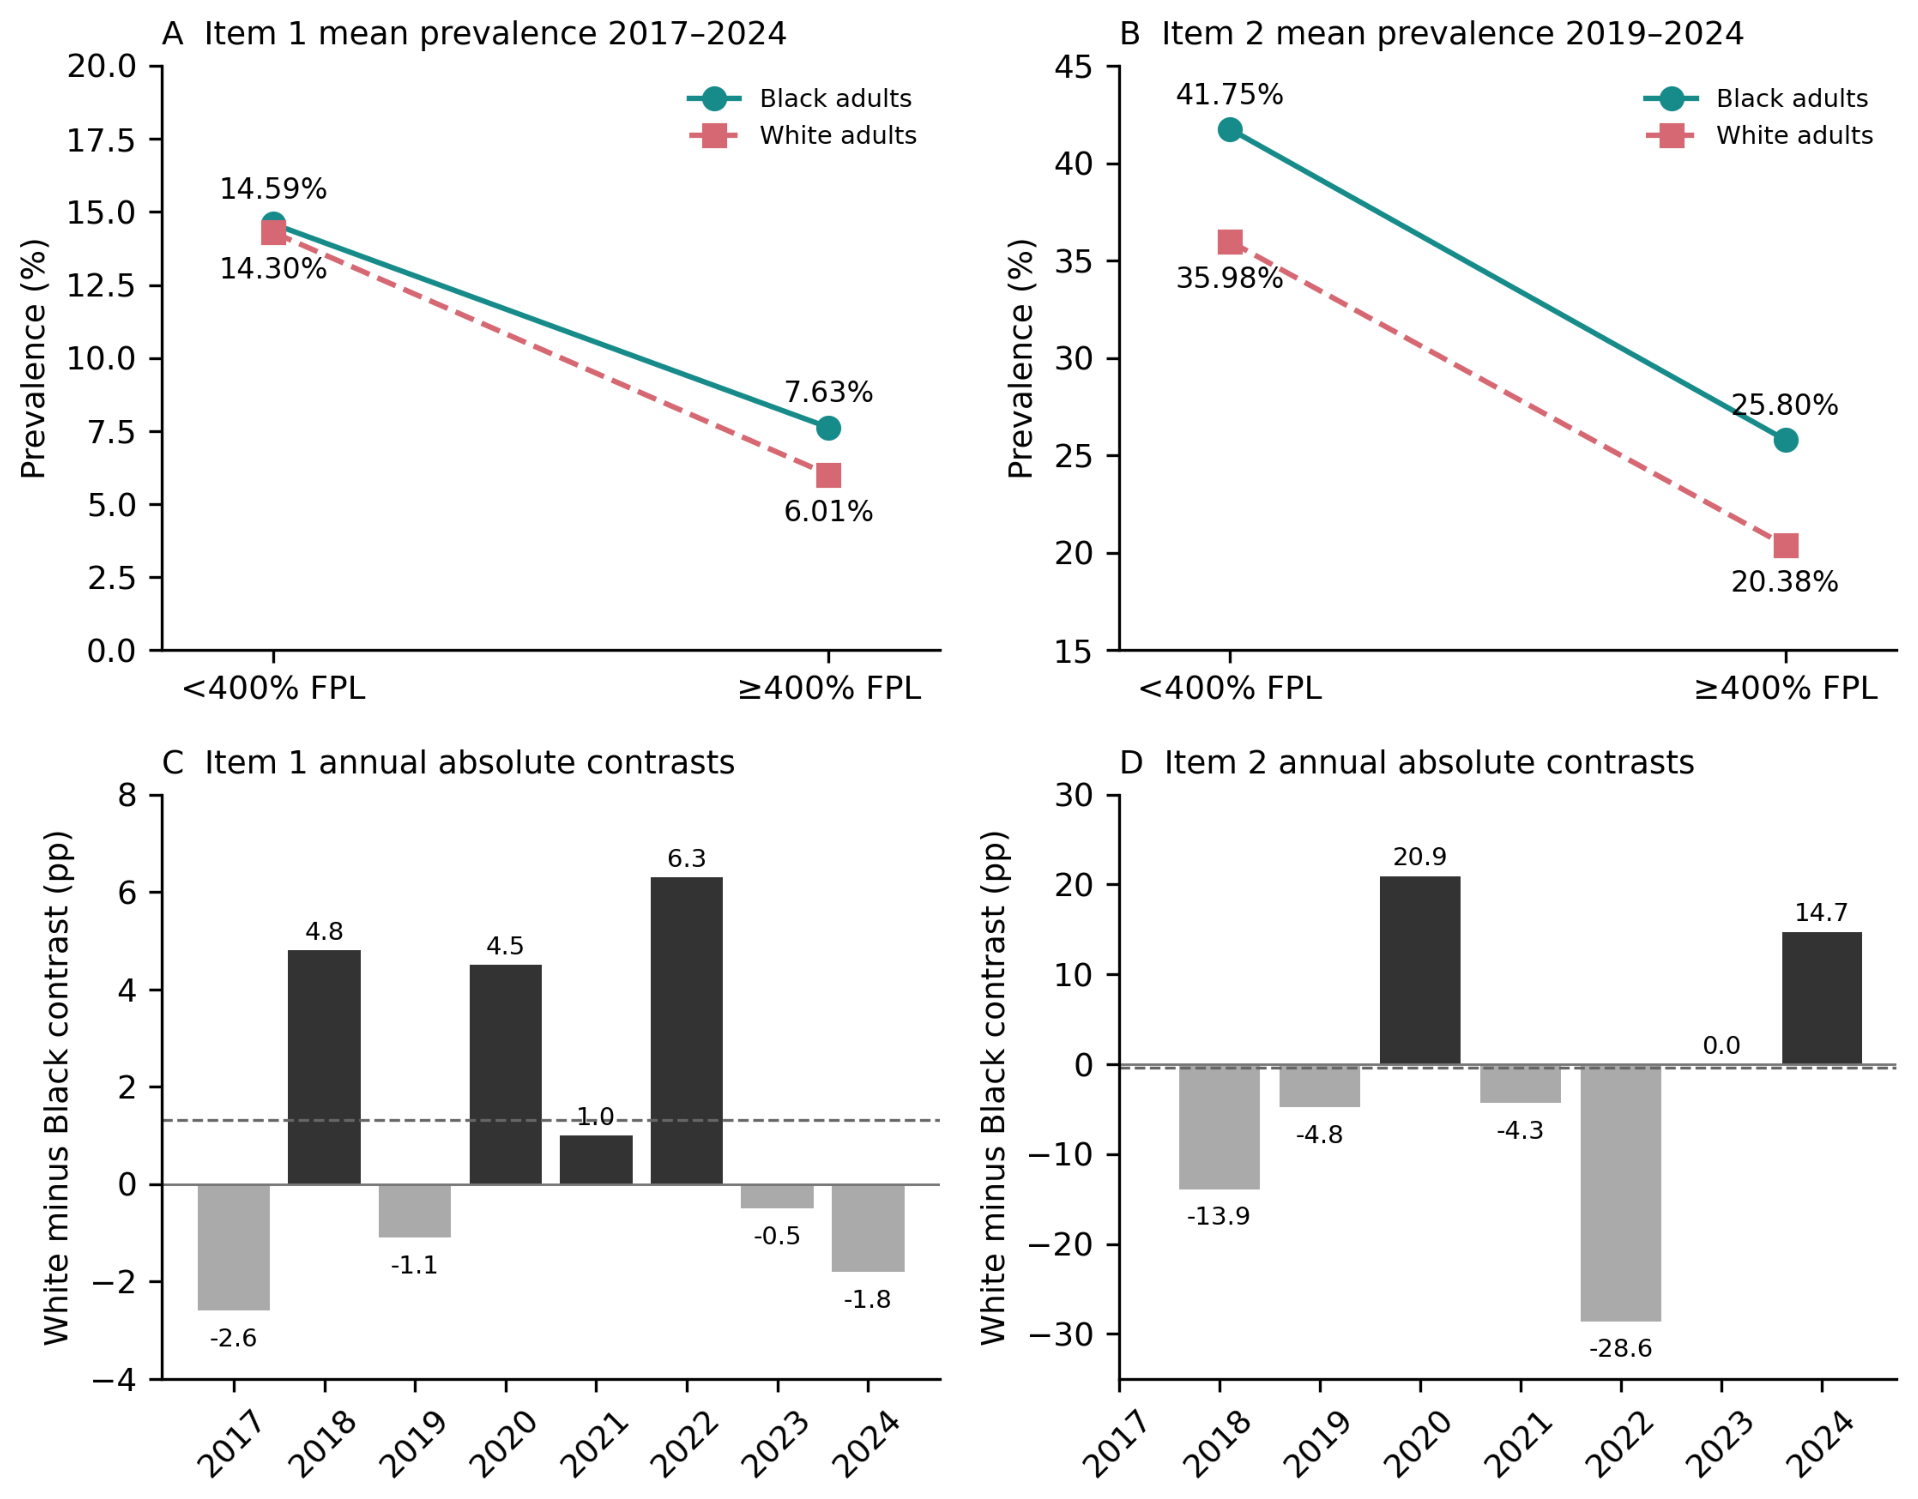
Figure 3.
Annual absolute income contrasts by race for item 1 on the left (A) and item 2 on the right (B), 2017–2024. Each point is lower-income minus higher-income prevalence within race. Item 2 is conditional on reporting medical bill payment difficulties. Lower Black than White values indicate smaller absolute reductions among Black adults. Negative values indicate higher prevalence in the higher-income category. The Black item 2 contrast is unavailable in 2017. Lines connect annual observations without smoothing. Source instability flags appear in Table 1; derived contrasts have not been tested for significance. pp: percentage points.
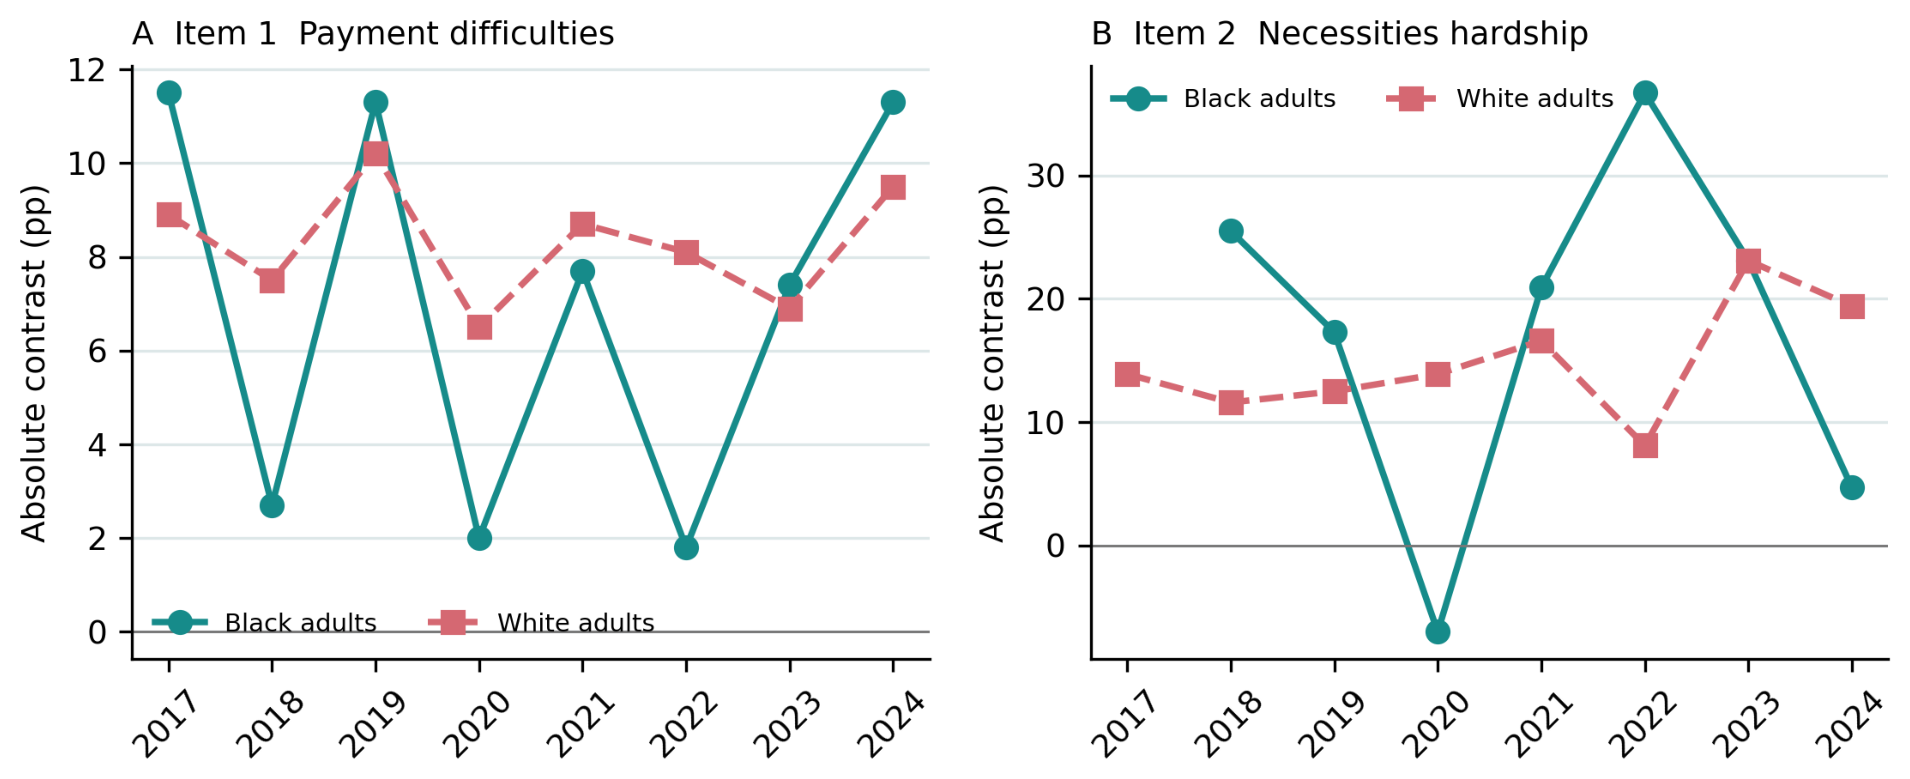

Table 1.
Annual prevalence by race and income for item 1 on the left and item 2 on the right.
| Item 1 Payment difficulties | Item 2 Necessities hardship | |||||||
|---|---|---|---|---|---|---|---|---|
| Year | Black <400% |
Black ≥400% |
White <400% |
White ≥400% |
Black <400% |
Black ≥400% |
White <400% |
White ≥400% |
| 2017 | 15.5 (7.8–23.3) |
4.0* (0.8–7.1) |
14.9 (12.1–17.8) |
6.0 (4.7–7.4) |
31.2* (10.8–51.7) |
— | 29.6 (20.2–39.1) |
15.7* (4.2–27.3) |
| 2018 | 10.2 (5.8–14.7) |
7.5* (1.8–13.3) |
13.9 (11.4–16.3) |
6.4 (4.9–7.9) |
34.2 (16.4–52.1) |
8.7* (0.0–24.8) |
30.7 (22.2–39.2) |
19.1 (8.8–29.3) |
| 2019 | 20.4 (14.7–26.0) |
9.1 (4.2–14.0) |
16.5 (14.9–18.2) |
6.3 (5.3–7.2) |
43.0 (23.1–62.8) |
25.7* (2.3–49.0) |
35.1 (29.7–40.5) |
22.6 (17.1–28.0) |
| 2020 | 13.3 (9.6–16.9) |
11.3 (8.1–14.5) |
12.3 (11.0–13.7) |
5.8 (5.0–6.6) |
31.7 (15.6–47.8) |
38.7 (22.5–54.8) |
30.6 (24.6–36.7) |
16.7 (12.6–20.8) |
| 2021 | 14.5 (11.1–17.9) |
6.8 (2.9–10.7) |
13.6 (12.3–15.0) |
4.9 (4.2–5.7) |
38.6 (23.8–53.5) |
17.7* (0.0–41.9) |
39.5 (33.2–45.7) |
22.9 (16.8–29.0) |
| 2022 | 11.5 (7.6–15.3) |
9.7 (5.6–13.7) |
14.4 (12.6–16.1) |
6.3 (5.4–7.1) |
48.0 (24.8–71.2) |
11.3* (1.4–21.1) |
30.4 (24.2–36.5) |
22.3 (15.5–29.2) |
| 2023 | 14.0 (9.3–18.7) |
6.6 (4.3–8.8) |
13.3 (11.9–14.8) |
6.4 (5.5–7.4) |
39.4 (20.0–58.8) |
16.3* (6.0–26.7) |
40.5 (34.7–46.4) |
17.4 (12.8–22.0) |
| 2024 | 17.3 (13.4–21.3) |
6.0 (2.9–9.0) |
15.5 (14.3–16.8) |
6.0 (5.2–6.8) |
49.8 (36.7–62.9) |
45.1 (22.5–67.8) |
39.8 (35.4–44.1) |
20.4 (15.6–25.2) |
Values are percentages with source-reported 95% confidence intervals in parentheses. * Statistically unstable in the source. Outcome: problems paying medical bills for self or household family in the past 12 months. Source: investigator-supplied AskCHIS export, CHIS 2017–2024. Item 2 percentages are conditional on reporting payment difficulties; its 2017 higher-income Black estimate is unavailable, not zero. The item 2 denominator excludes adults without payment difficulties.
Table 2.
Mean annual prevalence and relative then absolute income contrasts for item 1 on the left and item 2 on the right.
Table 2.
Mean annual prevalence and relative then absolute income contrasts for item 1 on the left and item 2 on the right.
| Item 1 Payment difficulties | Item 2 Necessities hardship | |||||||
|---|---|---|---|---|---|---|---|---|
| Period and race |
<400% (%) |
≥400% (%) |
Relative (%) |
Abs. (pp) |
<400% (%) |
≥400% (%) |
Relative (%) |
Abs. (pp) |
| Full period Black |
14.59 | 7.63 | 47.7 | 6.96 | 40.67 | 23.36 | 42.6 | 17.31 |
| Full period White |
14.30 | 6.01 | 58.0 | 8.29 | 35.23 | 20.20 | 42.7 | 15.03 |
| 2019–2024 Black |
15.17 | 8.25 | 45.6 | 6.92 | 41.75 | 25.80 | 38.2 | 15.95 |
| 2019–2024 White |
14.27 | 5.95 | 58.3 | 8.32 | 35.98 | 20.38 | 43.4 | 15.60 |
Relative reduction = (lower-income mean minus higher-income mean) divided by lower-income mean × 100. Absolute contrast = lower-income mean minus higher-income mean. White minus Black absolute contrasts were 1.33 pp for item 1 in 2017–2024 and 1.40 pp in 2019–2024; corresponding item 2 differences were −2.29 pp in 2018–2024 and −0.35 pp in 2019–2024. Item 2 means are conditional on reporting payment difficulties. These are summaries of annual weighted estimates, not pooled survey estimates. pp: percentage points. Full period means 2017–2024 for item 1 and 2018–2024 for item 2, whose 2017 higher-income Black affirmative estimate is unavailable.
Table 3.
Annual relative then absolute income contrasts for item 1 on the left and item 2 on the right.
Table 3.
Annual relative then absolute income contrasts for item 1 on the left and item 2 on the right.
| Item 1 Payment difficulties | Item 2 Necessities hardship | |||||||
|---|---|---|---|---|---|---|---|---|
| Year | Black relative (%) |
White relative (%) |
Black absolute (pp) |
White absolute (pp) |
Black relative (%) |
White relative (%) |
Black absolute (pp) |
White absolute (pp) |
| 2017 | 74.2 | 59.7 | 11.5 | 8.9 | — | 47.0 | — | 13.9 |
| 2018 | 26.5 | 54.0 | 2.7 | 7.5 | 74.6 | 37.8 | 25.5 | 11.6 |
| 2019 | 55.4 | 61.8 | 11.3 | 10.2 | 40.2 | 35.6 | 17.3 | 12.5 |
| 2020 | 15.0 | 52.8 | 2.0 | 6.5 | -22.1 | 45.4 | -7.0 | 13.9 |
| 2021 | 53.1 | 64.0 | 7.7 | 8.7 | 54.1 | 42.0 | 20.9 | 16.6 |
| 2022 | 15.7 | 56.2 | 1.8 | 8.1 | 76.5 | 26.6 | 36.7 | 8.1 |
| 2023 | 52.9 | 51.9 | 7.4 | 6.9 | 58.6 | 57.0 | 23.1 | 23.1 |
| 2024 | 65.3 | 61.3 | 11.3 | 9.5 | 9.4 | 48.7 | 4.7 | 19.4 |
Relative reductions divide lower-income minus higher-income prevalence by lower-income prevalence × 100. Absolute contrasts are lower-income minus higher-income prevalence. Positive White minus Black contrasts indicate smaller absolute reductions among Black adults. Item 1 is payment difficulties; item 2 is conditional inability to afford necessities. The em dash indicates an unavailable contrast, not zero. Instability flags for the input estimates appear in Table 1. Derived contrasts have not been tested for significance.
Disclaimer/Publisher’s Note: The statements, opinions and data contained in all publications are solely those of the individual author(s) and contributor(s) and not of MDPI and/or the editor(s). MDPI and/or the editor(s) disclaim responsibility for any injury to people or property resulting from any ideas, methods, instructions or products referred to in the content. |
© 2026 by the author. Licensee MDPI, Basel, Switzerland. This article is an open access article distributed under the terms and conditions of the Creative Commons Attribution (CC BY) license.
Copyright: This open access article is published under a Creative Commons CC BY 4.0 license, which permit the free download, distribution, and reuse, provided that the author and preprint are cited in any reuse.