

Submitted:
06 October 2026
Posted:
09 October 2026
You are already at the latest version
Abstract
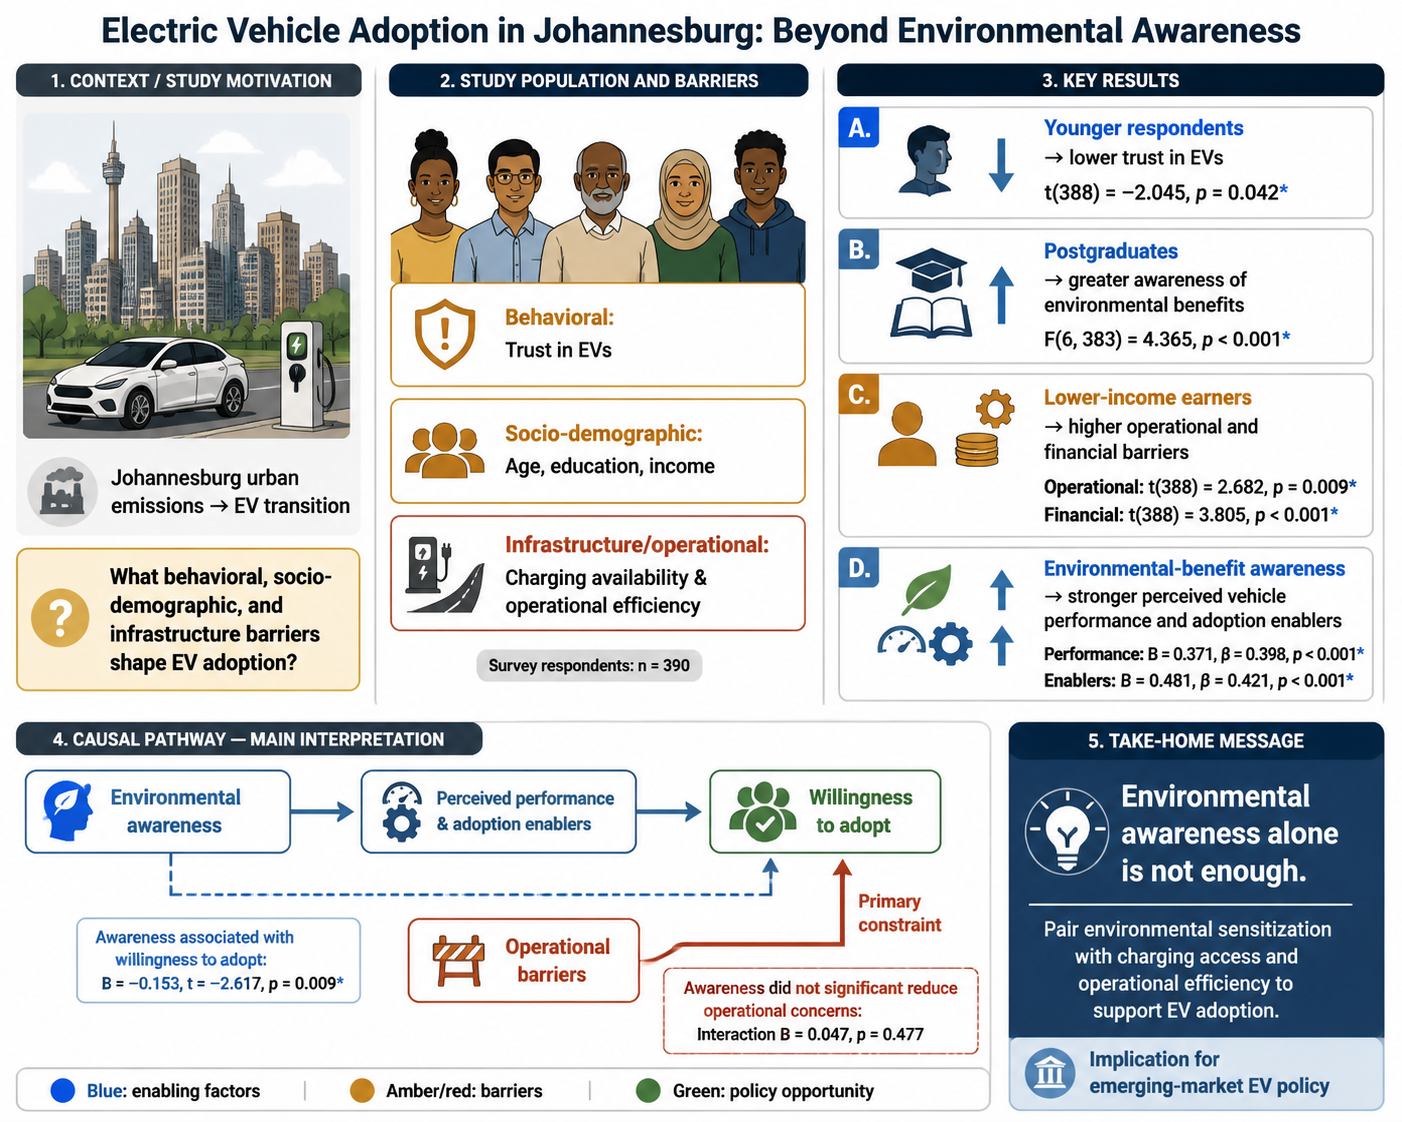
One potential solution to reduce urban emissions in Johannesburg is to transition to electric vehicles (EVs). However, research support is needed to understand the behavioral, socio-demographic, and infrastructural barriers that may hinder the adoption of EVs, hence this study. The results showed that younger respondents had lower trust in EVs (t(388) = -2.045, p = 0.042), and postgraduates were significantly more aware of environmental benefits (F(6, 383) = 4.365, p < 0.001). Lower-income earners reported higher operational (t(388) = 2.682, p = 0.009) and financial barriers (t(388) = 3.805, p < 0.001). Awareness of environmental benefits strongly predicted perceptions of vehicle performance (B = 0.371, β = 0.398, p < 0.001) and adoption enablers (B = 0.481, β = 0.421, p < 0.001). Ultimately, awareness of environmental benefits (B = -0.153, t = -2.617, p = 0.009) was crucial, yet it did not subdue concerns about operational barriers (Interaction: B = 0.047, p = 0.477), indicating that operational efficiency primarily influenced willingness to adopt. In conclusion, this study showed that in some emerging market contexts, EV transition might not be solely and significantly supported by environmental sensitization but rather coupled with addressing pressing operational limitations like charging station availability.
Keywords:
environmental awareness
; EV perceptions
; willingness to adopt
; pro-environmental behavior
; Johannesburg
1. Introduction
While it is projected that by 2040, 33% of road vehicles worldwide will be electric, road vehicles are presently a major source of greenhouse gas (GHG) emissions in the transportation sector, accounting for 60% of energy consumption and 17% of global emissions (Okoh & Onuoha, 2024; Msosa & Khuboni, 2026). In Africa, air pollution is the second leading cause of death, with vehicular emissions being the primary source of particulate matter (PM2.5) (Ayetor et al., 2023). In South Africa, increased pressure on public transport, exacerbated by population growth, has contributed to GHG emissions and has also led to congestion, unreliability, and air pollution (Ngcobo et al., 2024a; Ngcobo et al., 2024b). Consequently, the urgent need to reduce carbon emissions is a key driver of e-vehicle (EV) adoption in the country and beyond (Harmse, 2023). Transitioning to electric vehicles in Africa could significantly reduce carbon emissions, by up to about 50% (Ayetor et al., 2023; Oni & Longe, 2024).
However, in South Africa, the impact of EVs on reducing GHG emissions is not expected to increase significantly until 2040, largely because the ESKOM power supply system primarily relies on fossil fuels and needs to be decarbonized (Tongwane & Moeletsi, 2021). Environmentally informed individuals would thus realize that EV adoption would merely shift emissions from car fuels to the coal used to power most ESKOM power stations. Despite the reduced fuel cost associated with EVs, which makes them an attractive option for consumers, the socio-economic divide in South Africa is likely to also limit affordability (Mandys, 2021, Sachs et al., 2022; Alanazi, 2023; Javadnejad et al. 2024). While falling battery and EV costs worldwide are making e-mobility more accessible, high upfront costs and energy challenges can still limit adoption (Longe, 2022). Some studies have reported challenges such as frequent power outages, increasing energy demand, limited public charging infrastructure, and consumer misconceptions about EVs (Okoh & Onuoha 2024; Aden & Zheng, 2026; Emodi et al., 2023; Gicha et al., 2024; Mlindelwa, 2024; Farinloye et al., 2024; Ka et al., 2026). Navigating these issues might require legislative and regulatory reforms, along with standards compliance, to support both vehicle manufacturers and consumers in adopting EVs. (Cartwright et al., 2018; Mphahlele, 2023; Gebremariam, 2024; Nwokolo et al., 2023; Kimuli & Kirabira, 2025; Nnene et al., 2026).
EV Consumer Acceptance, Perceptions, and Willingness to Adopt in South Africa
Assessing consumer readiness for sustainable transportation requires moving beyond traditional behavioral models to understand how technological trust, cultural, and environmental values apply to South Africa's local population. Cultural values can moderate the influence of perceived usefulness, social factors, and infrastructural support on eco-friendly behavior (Bao, 2026). A study by Kayambazinthu (2023) involving 150 South Africans found that respondents not only highly valued the cost-effectiveness (µ=3.14, σ=1.20, t = 31.94, p < 0.001) and environmental benefits of EVs (µ=3.93, σ=1.08, t = 44.41, p <0.001), but also showed a strong willingness to adopt them in the future (µ=3.92, σ=1.02, t = 47.07, p < 0.001) and to accept higher initial purchase costs if operational costs were lower (µ=3.67, σ=1.09, t = 40.88, p <0.001). Dilotsotlhe (2022) also conducted research involving 504 millennials in the Gauteng province and found that emotional values, which pertain to how a purchase would make them feel (µ=3.60, σ=0.972, ᵝ=0.299, p<0.05), as well as conditional factors such as financial standing or subsidies (µ=3.45, σ=1.082, ᵝ=0.281, p<0.05), and social values regarding how owning the vehicle would affect their perception among peers (µ=2.99, σ=1.060, ᵝ=0.312, p<0.05), significantly influenced the respondents' willingness to adopt. Additionally, a survey of 150 South African university workers and final-year students also found that the cost of electric vehicles (EVs) did not significantly affect respondents' intentions to adopt them (p>0.05) (Msosa & Khuboni, 2026). However, individuals with positive attitudes toward EVs (r=0.752, p < 0.001), a higher perception of their usefulness (r=0.611, p < 0.001), and a higher belief in their ease of use (r=0.607, p < 0.001) were more likely to express a desire to adopt EVs (Msosa & Khuboni, 2026). Moreover, a study conducted by Hull et al. (2024) on 4452 paratransit drivers and owners in Cape Town showed that not only do EV perceptions like perceived cost (µ=2.01, σ=0.83, ᵝ=-.11, p<0.001), vehicle reliability (µ=3.45, σ=0.85, ᵝ=-0.49, p<0.001), and social norms (µ=3.52, σ=0.86, ᵝ=0.44, p<0.001) significantly influence intention to adopt EVs, but so do socio-demographic factors like age (ᵝ=-0.13, p<0.001), and education (ᵝ=-0.10, p<0.001). Mashabaa & Mdakab (2024) further supported these findings using the Theory of Planned Behavior, showing that environmental awareness (β = 0.314, p < 0.001) and social factors (β = 0.376, p < 0.001) significantly shape consumer behavior towards EVs.
Enablers for EV Adoption in South Africa
In a study involving 150 South Africans, a consensus emerged (µ = 3.67, σ = 1.09, t = 40.88,p< 0.001) indicating that, to promote EV adoption in South Africa, the government should incentivize their purchase (Kayambazinthu, 2023). In another study with 504 millennials, Dilotsotlhe (2022) also showed that respondents were more willing to adopt EVs if subsidies were provided (µ = 3.61, σ = 1.030). Msosa and Khuboni (2026) also supported the view that the government should implement supportive policies to enhance the affordability and accessibility of EVs. Hull et al. (2024) and Mateko et al. (2026) further specified that policies likely to increase EV adoption include those that promote EV transition, reduce initial costs, and increase the availability of charging infrastructure. A study on EV users' experiences with EV charging stations identified charging infrastructure accessibility, urban congestion, and rural unavailability as key challenges to EV use (Manu, 2025).
Some studies suggest that educational awareness can drive adoption. Moreover, beyond educational campaigns that sensitize people to the environmental benefits of EVs, research should understand customers' EV concerns before implementing strategies to ensure they are effective (Hull et al., 2024; Priyam et al., 2024). This study therefore aimed to model the relationships between environmental awareness, e-mobility perceptions, and City of Johannesburg residents' willingness to adopt e-vehicles (EVs). The objectives set were:
- To evaluate the socio-demographic variations in e-mobility perceptions and environmental awareness among CoJ residents,
- To evaluate environmental awareness as a predictor of e-mobility perceptions (benefits and barriers) in CoJ, and
- To examine how environmental awareness and perceived barriers interact to predict residents' willingness to adopt e-mobility vehicles.
2. Materials and Methods
2.1. Description of the Study Area
The study area is Johannesburg in Gauteng province, South Africa (Figure 1). Johannesburg is the largest city with a population of about 6 million people over an area of 1 643 km² (Ajikah et al., 2023; Magagula et al., 2022; Makgato, 2024).
2.1.1. Sampling and Sample Size
In this study, the researchers used convenience sampling. Convenience sampling is a common non-probability sampling technique in which participants are selected based on their availability and willingness to take part in the research (Abrahams & Everatt, 2019, Obilor, 2023; Stratton, 2023). This approach is especially effective for reaching a large number of respondents efficiently, given time and resource constraints (Giri, 2024). Although convenience sampling has limitations, such as potential selection bias, it suits exploratory research where the primary goal is to gain insights and understanding rather than make broad generalizations (Obilor, 2023; Tin & Bui, 2024). Only individuals aged 18 years or older were eligible to participate. Due to time and resource constraints, 399 people participated in the study.
2.1.2. Data Collection
A semi-structured online questionnaire was conducted using Google Forms to collect primary data. The questions were designed to gather insights into respondents' perceptions and willingness to participate in e-mobility, as well as their levels of environmental awareness. Data collection took place from July 21 to September 30, 2024.
2.1.3. Data Processing and Analysis
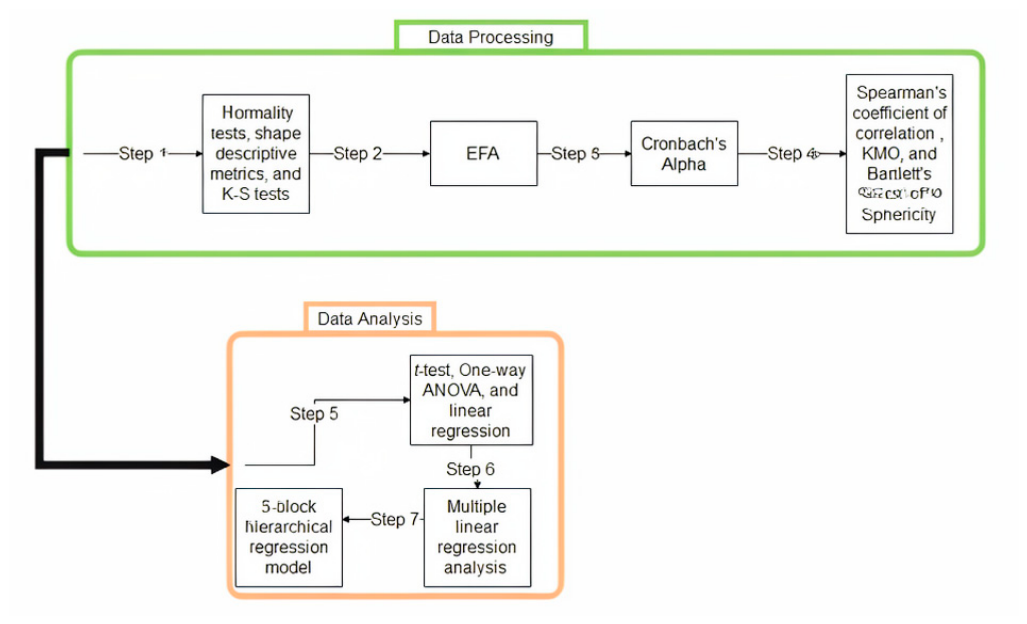
Figure 3 illustrates how the data were processed to ensure the statistical validity of the research findings. It also presents the sequence in which inferential statistics were used to answer the hypothesis during data analysis.
Figure 2.
Steps followed for data processing and analysis.
2.1.3.1. Questionnaire Statements
Table 1 presents grouped statements that captured positive and negative perceptions of electric vehicles (EVs) used in this study. These were classified as Factor 1, ‘Perceived Vehicle Performance’, which described the usability, reliability, or performance of e-mobile vehicles, and Factor 2, ‘Perceived Adoption Enablers’, which related to financial enablers and institutional support. Perceived barriers were simultaneously categorized into Factor 3, ‘Perceived Operational Barriers’, which addressed infrastructural and operational constraints, and Factor 4,’ Perceived Financial Barriers’, which confronted financial and economic perceptions. One construct item was reverse-coded to ensure that all statements consistently represented an increase in their intended effect on the Likert scale, ranging from 1 to 5. Statements that reflected perceived environmental benefits were categorized into two groups. Factor 1, 'Perceived Environmental and Health Benefits,' which included statements about how EVs reduce the environmental impacts associated with traditional non-electric vehicles. Factor 2, 'Perceived Battery Lifecycle and Natural Resource Concerns,' described the indirect environmental risks associated with EVs.
2.1.3.2. Conceptual Framework
Figure 3 shows the conceptual framework that guided the study. It details the variables considered and the hypotheses tested.
The hypotheses tested were formulated in line with specific research objectives:
Objective 1:
H1: Residents' environmental awareness significantly varies based on their socio-demographic characteristics.
H2: Residents' EV perceptions significantly vary based on their socio-demographic characteristics.
Objective 2:
H3a: Higher levels of awareness of EV environmental benefits positively predict residents' perceptions of EV benefits.
H3b: Higher awareness of EV environmental barriers significantly increases residents' perceptions of EV barriers.
Objective 3:
H4: Perceived EV barriers significantly and negatively predict residents' willingness to adopt EVs.
H5: Awareness of the environmental benefits of EVs significantly and positively moderates the negative relationship between perceived EV barriers and residents' willingness to adopt EVs.
2.1.3.3. Normality Testing (Data Shape Descriptive Metrics and Kolmogorov-Smirnov (K-S) Test)
The mean, standard deviation, skewness, kurtosis, and the Kolmogorov-Smirnov (K-S) test (since the sample size n >50=390) were used to assess normality (Table 1). Respondents rated all constructs above the scale midpoint of 3 (on a 5-point Likert scale), ranging from a minimum of 3.03 (σ = 0.90) for perceived financial barriers (EV_PFB_Average) to a maximum of 3.63 (σ = 0.82) for environmental benefits awareness (EA_Be_Average), indicating generally high EA and EV perceptions across the sample. Standard deviations ranged from 0.71 to 0.90, thus reflecting a consistent pattern of response dispersion around the means.
Across all 6 EV and EA perception constructs, the skewness remained within the acceptable range of ±1.0, ranging from -0.422 (Perceived vehicle performance) to +0.077 (Perceived battery lifecycle and natural resource concerns) (Demir, 2022; Aziz et al., 2025). Similarly, kurtosis values ranged from -0.506 (Perceived operational barriers) to +0.460 (Perceived vehicle performance), thereby falling within the ±2.0 criteria, indicating little deviation from normality. However, the Kolmogorov-Smirnov test showed statistically significant results (p<0.001) across all constructs. This suggests that the data are significantly skewed and deviate from normality. Nonetheless, this outcome may reflect the K-S test’s sensitivity to small deviations in large data sets (Sayili & Gunver, 2025). Overall, because the descriptive statistics suggested a normal distribution, this study assumed the data met the distributional assumptions required for Pearson correlation and multiple linear regression (MLR) for hypothesis testing.

Table 2.
Normality test parameters tested across the 6 perception constructs.
| Mean (μ) | Standard Deviation (σ) | Skewness | Kurtosis | K-S Statistic (p-value) | |
|---|---|---|---|---|---|
| Perceived Adoption Enablers | 3.46 | 0.876 | -0.159 | -0.28 | <0.001 |
| Perceived Vehicle Performance | 3.53 | 0.714 | -0.422 | 0.46 | <0.001 |
| Perceived Operational Barriers | 3.56 | 0.791 | -0.183 | -0.506 | <0.001 |
| Perceived Financial Barriers | 3.03 | 0.895 | -0.102 | -0.044 | <0.001 |
| Perceived Environmental and Health Benefits | 3.63 | 0.824 | -0.394 | 0.058 | <0.001 |
| Perceived Battery Lifecyle and Natural Resource Concerns | 3.41 | 0.789 | 0.077 | 0.288 | <0.001 |
2.1.3.4. Construct Validity Testing (Exploratory Factor Analysis-EFA)
Exploratory Factor Analysis (EFA) was used to confirm whether the items within each construct reliably measured the variables under test. Applying the Guttman-Kaiser criterion (Eigenvalue (E) >1.0), single factors were extracted (EPerceived environmental & health benefits= 3.969; EPerceived operational barriers = 2.490; EPerceived vehicle performance = 1.910; EPerceived financial barriers = 1.193; EPerceived battery lifecycle and waste = 2.072; EPerceived adoption enablers = 1.617), which accounted for 47.8%- 59.6% of the total variance across all 6 constructs, namely ‘perceived environmental and health benefits’ (7 items); ‘perceived operational barriers’ (5 items), ‘perceived vehicle performance’ (4 items); ‘perceived financial barriers (2 items); ‘perceived battery lifecycle & e-waste’ (4 items); ‘perceived adoption enablers’ (3 items) as shown in Table 3 (Akama & Husnaqilati, 2022; Ruengvirayudh & Brooks 2022). Extracting a single dominant factor from each construct confirmed that the items captured the construct reliably.
2.1.3.5. Construct Internal Consistency Reliability Testing (Cronbach’s Alpha)
While the EFA tested the validity of the constructs, the internal consistency reliability / how the items in each construct reliably measured the construct was determined using Cronbach’s alpha. The findings, presented in Table 3, revealed that most constructs reliably measured the intended variables (α>0.60). However, ‘perceived financial barriers’ (α=0.323) and ‘perceived adoption enablers’ (α=0.569) had low alpha values, probably because both constructs were made up of fewer than 4 items/ statements. However, we retained these in the regression model because, for example, although the two-item scale for perceived financial barriers showed low internal consistency, the inter-item Pearson correlation was positive though weak (r = 0.193, p < 0.001, N = 390), resulting in a Spearman–Brown coefficient of 0.324. Given the low reliability coefficient, the two items showed limited consistency in measuring a common underlying construct (Eisinga et al., 2012).
2.1.3.6. Bivariate Correlation Analysis (Spearman Rho Correlation)
The Spearman rho coefficient of correlation was used as an exploratory step to test associations between environmental awareness (benefits and barriers) and e-mobility perceptions (benefits and barriers) in CoJ. Multiple linear regression using the same significant variables was then used as a confirmatory step to quantify the independent variables' role in predicting EV perceptions. Table 4 reveals that perceptions of ‘environmental and health benefits’ were moderately associated with perceptions of ‘EV benefits’ (p<0.001). In contrast, perceived environmental barriers showed only a weak statistical association with perceived adoption enablers (p<0.05) and did not correlate with perceived vehicle performance (p>0.05). Furthermore, perceptions of ‘environmental and health benefits’ did not associate with perceived EV barriers (p>0.05), while perceived environmental barriers were only weakly associated with perceived operational barriers (p<0.001).
2.1.3.7. Suitability of Data for Factor Analysis
Sampling adequacy was assessed using the Kaiser-Meyer-Olkin (KMO) method, which produced scores greater than the recommended threshold of 0.60 across all constructs (except for ‘perceived financial barriers,’ which was represented by only 2 survey items, which is likely why a lower KMO value was obtained), as shown in Table 4 (Jusoh et al., 2022; Wahab, 2022). Bartlett’s Test of Sphericity was also statistically significant (p < 0.001), indicating that the items within the constructs effectively measured the intended variables and thus had correlations appropriate for factor extraction.
Table 5.
Suitability of the data using the KMO method and Bartlett’s test of Sphericity.
| Kaiser-Meyer-Olkin (KMO) | Bartlett’s Test of Sphericity | ||
|---|---|---|---|
| Perceived EV Benefits | Perceived Adoption Enablers | 0.598 | χ² = 107.998, df = 3, p < 0.001 |
| Perceived Vehicle Performance | 0.650 | χ² = 201.167, df = 6, p < 0.001 | |
| Perceived EV Barriers | Perceived Operational Barriers | 0.753 | χ² = 427.246, df = 10, p < 0.001 |
| Perceived Financial Barriers | 0.500 | χ² = 14.703, df = 1, p < 0.001 | |
| Environmental and Health Benefits | 0.885 | χ² = 1229.913, df = 21, p < 0.001 | |
| Environmental Barriers | 0.630 | χ² = 363.158, df = 6, p < 0.001 | |
2.1.3.8. Socio-Demographic Influences (Linear Regression, T-Tests, ANOVA)
Linear regression
Linear regression was used to evaluate the influence of age on respondents' perceptions of EV (barriers and benefits) and EA (barriers and benefits).
t-tests
Since the categories included in the income question in the questionnaire were uneven, the responses were converted from 6 categories to only 2 categories, i.e lower-to-middle income group (<R40 000) and high-income group (> R40 000). t-tests were run to determine differences in EA and EV perceptions by binary variables of residents’ income, employment status (i.e., employed vs unemployed), and categorical age.
One-way ANOVA
To understand the influence of multi-categorical education level and employment status on EA and EV perceptions, the study used one-way ANOVA.
2.1.3.9. Predicting Willingness to Adopt E-Mobility (3-Block Hierarchical Regression Analysis – 3B_HRA)
To examine how environmental benefits awareness and perceived EV barriers interact to predict residents' willingness to adopt EVs, the study adopted a systematic predictive framework to simulate residents’ perceptions, using a 3-block hierarchical multiple regression model. The model aimed to account for the potentially repelling effect of perceived EV barriers on willingness to adopt. The 3 model blocks were:
- Block 1: which assessed socio-demographic factors (monthly income, level of education, and employment status),
- Block 2: which introduced the predictor variables identified in Objective 2 (environmental benefits awareness, environmental barriers awareness, perceived vehicle performance, perceived adoption enablers, and perceived operational barriers), and
- Block 3: represented the moderation effect of the interaction between mean-centered environmental benefits and perceived operational barriers (i.e. an interaction between EA_Be_Centered_x_EV_POB_Centered)
3. Results and Discussions
To evaluate socio-demographic variations in perceptions of e-vehicles (EVs) and environmental awareness (EA) among respondents sampled in the City of Johannesburg (CoJ), descriptive and frequency analyses were conducted (Table 6). Over 40% of the sample were male (42.8%) or female (49.5%). Most individuals interviewed were in the youth category, with 32.4% between the ages of 18 and 24, and 28.7% in the 25-34 age group. Because most of the sample consisted of working-age individuals, most were either employed full-time (50.8%) or students (23.3%). While 60% had either an undergraduate or postgraduate degree and 42.1% lived in private residences, most were low- to medium-income earners (82.1%).
3.1. Socio-Demographic Variations in E-Mobility Perceptions and Environmental Awareness Among CoJ Residents
To evaluate the socio-demographic variations in e-mobility perceptions and environmental awareness among CoJ residents, linear regression, t-tests, and ANOVA were conducted on age, monthly income, highest educational level, and employment status against the EA and EV constructs (Table 7).
3.1.1. Age3.1.2. Age on Environmental Awareness (EA)
Linear regression was used to determine if age was a significant predictor of the sample’s level of awareness of the environmental benefits (EA_Be_Average) and barriers of EVs (EA_Ba_Average) among the respondents (Table 7). The models were not statistically significant, with age explaining less than 0.4% and 0.8% of the variance in awareness of the environmental benefits (F(1, 388) = 1.735, p = 0.189; R2=0.004) and barriers of e-vehicles, respectively (F(1, 388) = 3.032, p = 0.082, R2=0.008). Coefficient analysis also showed that age was not a significant predictor of EA_Be_Average (p = 0.189) and EA_Ba_Average (p = 0.082). t-tests splitting respondents into 2 distinct generational groups (i.e., <35 years and > 35 years) also showed no significant associations (p>0.05). These findings indicated that age did not significantly influence environmental awareness scores within this sample group, thus suggesting that the environmental consciousness of EVs among CoJ respondents was transgenerational and relatively similar, as no significant differences in awareness were observed between younger and older individuals or in year-by-year changes in age. Overall, residents were generally all aware of the environmental benefits (µ=3.659, σ=0.766) and barriers (µ=3.310, σ=0.665) associated with EV use regardless of age.
3.1.3. Age on E-Vehicles (EV) Perceptions
Table 7 revealed that generational age did not significantly influence residents’ perceptions of performance capabilities, adoption enablers, and operational limitations of e-mobility (p>0.05). However, there was a significant negative relationship between age as a continuous variable and perceived financial barriers (EV_PFB_Average) associated with EVs (B = -0.009, β = -0.144, t = -2.860, p = .004), suggesting that for every yearly increase in age, the perceived EV_PFB_Average of the individual decreases by 0.009 Likert scale units. Therefore, younger individuals saw purchasing power as a significant barrier to EV adoption, likely because they have lower disposable income or asset stability than older counterparts. Age was thus a significant predictor of perceived financial barriers (PFB), accounting for approximately 2.1% of the variation in perceptions per unit year. While this study acknowledged the impact of socioeconomic factors on financial perceptions, one study conducted in Germany, suggested that age did not always significantly shape perceptions of alternative-fueled vehicles like EVs (Gimpel & Arning, 2025).
Another important result, a t-test in which age was instead categorized into 2 distinct generational groups (<35 years and > 35 years), showed that younger residents (<35 years), who are probably more in touch with international technological innovations, exhibit lower trust in the performance and maintenance of EVs (t(388)=-2.045, p=0.042) when compared to older participants. Younger respondents scored on average 0.193 points lower on EV_PVP statements than the older generation (MD=-0.19308). This may reflect skepticism driven by information overload from online and social media platforms, or financial constraints that may limit the age group's access to higher-end EVs offering better performance.
3.1.4. Income
3.1.4.1. Income on EA
High-income earners showed greater awareness of the environmental benefits (µ = 3.81) of EVs (EA_Be_Average) but lower awareness of the (EA_Ba_Average) environmental barriers (µ = 3.22), and gave more similar responses (σ = 0.63) compared to lower- to middle-income earners (Table 8). However, environmental awareness between these 2 economic groups regarding the benefits (t(388)=-1.932, p = 0.054) and barriers (t(388)=1.284, p =0.200) of EVs did not differ significantly at the 95% confidence level.
3.1.4.2. Income on EV
EV readiness among respondents appeared to be more influenced by financial and operational factors than by age. Table 7 revealed that income significantly shaped residents’ (EV_POB_Average) perceptions of the operational (t(388)=2.682, p = 0.009) and (EV_PFB_Average) financial barriers (t(388)=3.805, p = <0.001) of EV usage. This outcome aligns with Kayambazinthu (2023), who found that EVs are, on average, 30% more expensive than conventional vehicles. As a result, perceptions of the costs of purchasing, running, and maintaining EVs may discourage adoption. Financial limitations are more prominent among people in lower- to medium-income groups (Zantvoort, 2024). The South African EV market needs support from government interventions, such as initial purchase subsidies, to alleviate socioeconomic discrepancies among citizens (Pilay, 2018; Moeletsi, 2021; Kayambazinthu, 2023). Kukowski & Garnett (2024) argue that to effect impactful behavioral change toward low-carbon alternatives like EVs, the country's socioeconomic inequality needs to be addressed.
Lower-to-middle-income (<R40000) respondents reported significantly higher financial (µ<R40000=3.34; µ>R40000=2.98) and operational barriers (µ<R40000=3.61; µ>R40000=3.31) than the higher-income respondents (Table 9). While younger individuals may have limited financial capacity to invest in EVs, the operational readiness might also be driven by economic conditions. For instance, higher-income households are more likely to invest in private solar systems or home charging infrastructure, helping them overcome some operational barriers that lower-income households may face when adopting EVs. As a result, policies can address infrastructural and socio-economic disparities within CoJ to significantly improve perceptions of EV adoption barriers. Additionally, some jobless young individuals are taking up e-hailing services like Bolt and Uber. However, they may be concerned about charging infrastructure availability when they need to recharge, the downtime required for charging, or battery durability.
3.1.5. Level of Education
3.1.5.1. Level of Education on EA
As shown in Table 7, EA_Be_Average (F(6, 383) = 4.365, p < 0.001) and EA_Ba_Average (F(6, 383) = 3.593, p = .002) differed significantly across the seven educational groups. Post-hoc comparisons using the Tukey HSD test indicated that residents holding a postgraduate degree (i.e. Honours/Masters/PhD) reported significantly higher levels of awareness of the environmental benefits of EVs than diploma holders (MD = 0.591, p < 0.001) and Undergraduate Bachelor's degree holders (MD = 0.377, p = 0.003). This may be because, although climate change and environmental discussions may not improve incrementally with higher educational levels, they can be enhanced through exposure to postgraduate research. Similarly, the Adult Basic Education and Training (ABET) group scored significantly lower on perceived environmental barriers compared to those with some high school education (MD = -1.472, p = 0.014), high school matriculants (MD = -0.748, p = 0.022), and postgraduate degree holders (MD = -0.703, p = 0.033). This may indicate limited exposure to environmental discussions in ABET.
3.1.5.2. Level of Education on EV
Non-significant results were obtained for EV_PVP_Average (F(6, 383) = 1.243, p = 0.283), EV_POB_Average (F(6, 383) = 0.665, p = 0.678), and EV_PAE_Average (F(6, 383) = 1.955, p = 0.071), demonstrating that perceptions on vehicle performance, operational barriers and adoption enablers did not differ with level of education. Conversely, financial anxieties (EV_PFB_Average) decreased with higher academic attainment (F(6, 383) = 3.619, p = 0.002). Respondents holding Adult Basic Education and Training (ABET) reported the highest perceived financial hurdles (µ = 4.05, σ = 0.76), whereas residents holding undergraduate bachelor's degrees (µ = 3.21, σ = 0.70) and postgraduate degrees (µ = 3.16, σ = 0.71) exhibited the lowest sensitivity to financial constraints. This suggested that higher formal education acted as a significant buffer against perceived financial limitations regarding EV adoption. One of the primary barriers to EV adoption stems from respondents' purchasing capabilities, as highlighted in section 3.2.2. Individuals with higher education levels tend to have higher earning potential and likely more disposable income compared to those without tertiary education. These findings align with a study by Lashram & Alkabaa (2024) in Saudi Arabia, which also found that individuals with higher education are willing to pay more for EVs because they value them highly.
3.1.6. Employment Status
3.1.6.1. Employment Status on EA
As with income, we also applied a dual analytical framework to evaluate the relationship between employment status and EA perceptions. At the macro level, the t-test results revealed no statistically significant differences in EA_Be_Average (p = 0.306) and EA_Ba_Average (p = 0.519) between employed and unemployed CoJ residents. This showed that employment status did not meaningfully influence environmental awareness levels within this study. However, at the micro-level, to determine whether the multi-categorical distribution of residents’ employment status influenced EA, a one-way ANOVA was run. The results demonstrated that while EA_Be_Average scores were similar across the different categories (F(6, 383) = 0.680, p = 0.666), a statistically significant difference was uncovered regarding EA_Ba_Average (F(6, 383) = 2.377, p = 0.029). However, Tukey's post hoc tests did not reveal significant differences between specific categories. Unemployed individuals (µ = 3.02) and self-employed individuals (µ = 3.12) reported the lowest perceived barriers to adopting EVs compared to working individuals and students (Figure 4). This is likely due not only to their limited exposure to sustainability discussions but also to their financial capacity and earning potential.
3.1.6.2. Employment Status on EV
The same dual analytical framework was applied to evaluate the relationship between employment status and EV perceptions. The t-test analysis revealed that binary employment classification does not influence EV_PVP_Average (p = 0.843), EV_PAE_Average (p = 0.619), or EV_POB_Average (p = 0.988). However, EV_PFB_Average differed significantly (t(388) = 2.708, p = 0.007), indicating significant differences in financial concern between the 2 groups. At the micro level, a one-way ANOVA confirmed that multiple employment categories do not predict EV_PVP (p = 0.892) or EV_PAE (p = 0.746). Conversely, employment categories exerted a significant effect on EV_POB (F(6, 383) = 2.205, p = 0.042), and EV_PFB (F(6, 383) = 3.434, p = 0.003). Sengar & Singh (2024) reported that employed individuals, like high-income earners, may have better access to EV-supportive infrastructure, such as chargers, which could enhance their perceptions of financial and operational limitations. Pairwise comparisons using the Games-Howell post-hoc test showed that students reported significantly higher financial barrier scores than self-employed and full-time employed professionals (MD = 0.304, p = 0.026), likely due to limited income. Although pairwise comparisons of operational barrier scores showed no significant differences, descriptive statistics indicated that pensioners (µ = 4.4) reported greater operational anxieties than other employment categories (Figure 5).
3.2. EA Influence on EV Perceptions
EV perception constructs that showed significant associations in Spearman’s correlation in Section 2.4.6 were analyzed using multiple linear regression (MLR) to determine EA's predictive contribution to EV perceptions. MLR model 1 evaluated EA_Be as a predictor of EV_PVP and revealed statistically significant findings (F(1, 388) = 72.833, p < .001) and explained 15.8% of the variance (R2 = 0.158) in EV_PVP due to EA_Be (Table 10). EA_Be is a strong, positive predictor of vehicle performance perceptions (B = 0.371, β = 0.398, t = 8.534, p < 0.001), suggesting that individuals who are more aware of the environmental benefits of EVs tend to have greater confidence in the EV’ performance. This outcome is supported by Al Shurideh et al. (2025), who suggested that education on EVs' environmental benefits can develop positive attitudes toward them. Knowledge is essential in shaping consumer intentions and perceptions (Kayambazinthu, 2023). MLR model 2 measured EA_Be and EA_Ba as predictors of EV_PAE (F(2, 387) = 41.777, p < 0.001), accounting for 17.8% of the total explained variance (R2 = 0.178). However, only EA_Be was a significant positive predictor of adoption enabler perceptions (B = 0.481, β = 0.421, t = 9.094, p < 0.001), and EA_Ba was non-significant (B = 0.010, β = 0.008, t = 0.172, p = 0.863). These findings suggest that CoJ residents with higher levels of awareness of the environmental benefits of EVs reflected better EV adoption enabler perceptions. Lastly, MLR 3 tested EA_Ba as a predictor of EV_POB (F(1, 388) = 9.606, p = 0.002), explaining 2.4% of the variance (R2 = 0.024). EA_Ba is a significant positive driver of vehicle operational anxiety in respondents (B = 0.185, β = 0.155,t = 3.099, p = 0.002). This means that a one-unit increase in the environmental barrier Likert scores among residents is associated with a 0.185-unit increase in EV_POB_Average scores.
3.3. Influence of EA and EV Barriers on Willingness to Adopt EVs
The 3-phase hierarchical model consisted of 3 layers: Block 1, 2, and 3, as shown in Table 1. Block 1, controlling for socio-economic factors, was statistically significant (F(3, 386) = 4.707, p = 0.003) and explained 3.5% of the total variance in respondents’ willingness to adopt EVs (R2 = 0.035). Level of education (B = -0.124, t = -2.273, p = 0.024) and income profiling (B = -0.126, t = -2.344, p = 0.020) were significant negative predictors of EV adoption, while employment status was not (p = 0.414). This outcome suggests that individuals with higher education and income initially hesitated to adopt EVs. This finding contrasts with a study by Pamidimukkala et al. (2024) conducted in Texas, USA, which found that men with higher education and income were more keen to adopt EVs. However, when EA and EV perceptions were factored in, none of these socio-demographic factors predicted adoption willingness (p > 0.05), as shown in Block 2 (Table 11).
Adding the influence of EA and EV perceptions of CoJ residents to the modelling framework in Block 2 added explanatory power to the model by 8.6% (ΔR2 = .086, ΔF(5, 381) = 7.468, p < .001), bringing the total explained variance of the model to 12.1% (R2 = 0.121). However, EV_POB_Average (B = 0.107, β= 0.104, t = 2.067, p = 0.039) and EA_Be_Average were the only significant predictors of EV adoption willingness (B = -0.153, β = -0.143, t = -2.617, p = 0.009). A 1-unit increase in Likert scores on perceptions of EV operational barriers and awareness of environmental benefits results in a 10.7% increase and 15.3% decrease in adoption willingness, respectively. This means respondents with greater concerns about EV operational aspects showed higher willingness to adopt them. In contrast, individuals with higher awareness of the environmental benefits of EVs showed stronger anxiety about adopting them. Although seemingly counterintuitive, the latter might be because environmentally conscious people are likely to look at EVs beyond their immediate contributions to greater sustainability and support, such as the availability of the energy to support such vehicles, given, e.g., the current energy woes in South Africa vs the increase in energy supply required to support e-mobility (Dane et al., 2019; Rafiq et al., 2023).
Lastly, including the interaction between EA_Ba_Average and EV_POB_Total did not significantly improve the model's explanatory power (ΔR2 = 0.001, ΔF(1, 380) = 0.506, p = 0.477). The interaction parameter was also not significant (B = 0.047, β = 0.036, t = 0.711, p = 0.477), showing that while awareness of the environmental barriers of EVs was important, it did not buffer or moderate residents’ operational anxieties about infrastructure and usability barriers. This suggests that perceptions of operational barriers played a substantial role in shaping residents' willingness to adopt EVs, regardless of their awareness of EVs' environmental barriers. Respondents in this study were therefore more concerned about EV limitations than about their potential negative environmental impacts. These findings reflect literature that highlights operational limitations, such as limited infrastructure and energy supplies, that impair EV adoption rates in emerging economies (Agyekum et al., 2023; Ka et al., 2026). In South Africa, these challenges are worsened by load-shedding, deteriorating distribution and transmission facilities, and dependence on the national grid for power (Ntombela, 2026). Since vehicle functionality is important for daily mobility, EV users prioritize both the availability of charging infrastructure and charging speed (Anderson et al., 2018, Globisch et al., 2019). This not only minimizes congestion but also allows charging sessions to be seamlessly integrated into their daily routines. In support of this point, one study in New Zealand revealed that the EV battery warranty as the major factor determining customer decisions (Jose Mundaplackal, 2024).
5. Conclusions
This study systematically explores the socio-technical factors that influence City of Johannesburg residents’ willingness to adopt e-vehicles (EVs). The results indicate that willingness to adopt EVs is not a function of the socio-demographic characteristics or environmental barrier beliefs. Instead, it is more determined by economic factors, the environmental benefits of EVs, and the operational reliability of EVs compared with conventional fuel-powered vehicles currently in use. Overall, policymakers could thus prioritize making EVs financially accessible and reduce perceived operational barriers by, for example, providing more public charging infrastructure to improve the willingness to adopt them
To assess the socio-demographic differences in perceptions of EVs and environmental awareness (EA) among residents, t-tests, ANOVA, and linear regression analyses were conducted. The results indicated that, aside from the perceived financial barriers (B = -0.009, β = -0.144, t = -2.860, p = .004), the levels of EA, perceived benefits of EVs, and perceptions of operational barriers remained consistent across different generations (p > 0.05) when age was taken as a continuous variable. The data showed that for every 1-year increase in age, economic anxiety about EVs decreased slightly by 0.9%. However, when age was categorized into two distinct generational groups (under 35 years and over 35 years), younger respondents exhibited lower trust in the performance and maintenance of EVs (t(388) = -2.045, p = 0.042). Educational level significantly predicted environmental benefits awareness (F(6, 383) = 4.365, p < 0.001). Individuals with postgraduate degrees showed significantly higher awareness than those with diploma and undergraduate degrees. Similarly, educational level also predicted awareness of environmental barriers (F(6, 383) = 3.593, p = 0.002). Individuals with Adult Basic Education and Training (ABET) had significantly lower awareness than some high school graduates, those with matric, and postgraduate degree holders. This suggests that individuals in ABET may have limited exposure to sustainability discussions. Regarding perceived financial barriers, educational level also differed significantly (F(6, 383) = 3.619, p = 0.002), although no significant pairwise differences were observed. However, respondents with Adult Basic Education and Training reported the highest perceived financial hurdles (µ = 4.05, σ = 0.76), while those with postgraduate degrees demonstrated the lowest sensitivity to financial constraints (µ = 3.16, σ = 0.71). Respondents' awareness of environmental barriers differed significantly by employment status (F(6, 383) = 2.377, p = 0.029). Part-time employed individuals exhibited the highest awareness of these barriers (µ = 3.51), while unemployed individuals had the lowest awareness (µ = 3.02). Additionally, there were statistically significant differences in perceived operational and financial barriers based on employment status (EV_POB_Average: F(6, 383) = 2.205, p = 0.042; EV_PFB_Average: F(6, 383) = 3.434, p = 0.003) and binary income groups (EV_POB_Average: t(388) = 2.682, p = 0.009; EV_PFB_Average: t(388) = 3.805, p < 0.001). As expected, students reported significantly higher perceptions of financial barriers than full-time and self-employed individuals. This is likely because students typically lack a stable income to support car purchases. In contrast, lower- to middle-income earners reported higher perceived operational (µ<R40000=3.62; µ>R40000=3.31) and financial barriers (µ<R40000=3.34; µ>R40000=2.98).
Environmental benefits awareness strongly and positively predicts vehicle performance perceptions (B = 0.371, β = 0.398, t = 8.534, p < 0.001) and adoption enabler perceptions (B = 0.481, β = 0.421, t = 9.094, p < 0.001). This means that individuals who are more aware of the environmental benefits of EVs tend to have greater confidence in EV performance and the enablers that support adoption. In contrast, respondents with higher environmental barrier awareness showed greater anxiety about EV operational efficiency (B = 0.185, β = 0.155, t = 3.099, p = 0.002). Ultimately, the study showed that despite the importance of environmental benefits awareness (B = -0.153, β = -0.143, t = -2.617, p = 0.009) and perceived operational barriers (B = 0.107, β= 0.104, t = 2.067, p = 0.039) in predicting the willingness of respondents to adopt EV, awareness of environmental benefits does not mitigate respondents' perceptions of the operational barriers associated with electric vehicles (EVs), and ultimately, its diminishing effect on their willingness to adopt them (Interaction of EA_Ba_Average and EV_POB_Average: B = 0.047, β = 0.036, t = 0.711, p = 0.477). This means that despite their environmental barrier awareness levels, respondents highly regarded the operational efficiency of EVs in determining their willingness to adopt them for their own mobility.
Funding
This research was funded by UJ PEETS.
Institutional Review Board Statement
Ethical clearance for the research project was obtained, and the approved ethics reference number is 2024-05-06/Botha_Schoeman (Addendum B).
Informed Consent Statement
Informed consent was obtained from all subjects involved in the study.
Data Availability Statement
Data can be made available upon request.
Acknowledgments
We acknowledge UJ PEETS for supporting and funding this research. We would also like to express our gratitude to Dr Tebogo Moloi’s immense support in data analysis and interpretation.
Conflicts of Interest
The authors declare no conflicts of interest. Abbreviations
References
- Abrahams, C.; Everatt, D. City Profile: Johannesburg, South Africa. Environment and Urbanization ASIA 2019, 10(2), 255–270. [Google Scholar] [CrossRef]
- Aden, W. A.; Zheng, J. F. Pioneering Green Pathways: Ethiopia's Leap Forward in Climate-Smart Logistics and Eco-Transportation. Journal of Road and Traffic Engineering 2026, 72(2), 1–12. [Google Scholar] [CrossRef]
- Ajikah, L. B.; Roffe, S. J.; Neumann, F. H.; Bamford, M. K.; Esterhuizen, N.; Berman, D.; Peter, J. Meteorological influences on airborne pollen and spores in Johannesburg (Gauteng), South Africa. Aerobiologia 2023, 39(3), 363–388. [Google Scholar] [CrossRef]
- Akama, Y.; Husnaqilati, A. A dichotomous behavior of Guttman-Kaiser criterion from equi-correlated normal population. arXiv 2022, arXiv:2210.12580. [Google Scholar]
- Alanazi, F. Electric vehicles: Benefits, challenges, and potential solutions for widespread adaptation. Applied sciences 2023, 13(10), 6016. [Google Scholar] [CrossRef]
- Ayetor, G. K.; Mashele, J.; Mbonigaba, I. The progress toward the transition to electromobility in Africa. Renewable and Sustainable Energy Reviews 2023, 183, 113533. [Google Scholar] [CrossRef]
- Aziz, S.; Nayem, H. M.; Kibria, B. G. Sample size requirements for the central limit theorem for skewed distributions: A simulation study. Journal of Statistical Modeling and Analytics (JOSMA) 2025, 7(2). [Google Scholar] [CrossRef]
- Cartwright, A.; Palmer, I.; Taylor, A.; Pieterse, E.; Parnell, S.; Colenbrander, S. Developing prosperous and inclusive cities in Africa-National Urban Policies to the rescue. In London and Washington DC: Coalition for Urban Transitions; 2018. [Google Scholar]
- Demir, S. Comparison of normality tests in terms of sample sizes under different skewness and kurtosis coefficients. International Journal of Assessment Tools in Education 2022, 9(2), 397–409. [Google Scholar] [CrossRef]
- Dilotsotlhe, N. Factors influencing consumers’ intentions towards the adoption of environmentally friendly cars. Multidisciplinary business review 2022, 15(1), 63–76. [Google Scholar] [CrossRef]
- Eisinga, R.; te Grotenhuis, M.; Pelzer, B. The reliability of a two-item scale: Pearson, Cronbach or Spearman-Brown? International Journal of Public Health 2012, 1–12. [Google Scholar] [CrossRef]
- Emodi, N. V.; Akuru, U. B.; Dioha, M. O.; Adoba, P.; Kuhudzai, R. J.; Bamisile, O. The role of Internet of Things on electric vehicle charging infrastructure and consumer experience. Energies 2023, 16(10), 4248. [Google Scholar] [CrossRef]
- Farinloye, T.; Oluwatobi, O.; Ugboma, O.; Dickson, O. F.; Uzondu, C.; Mogaji, E. Driving the electric vehicle agenda in Nigeria: The challenges, prospects and opportunities. Transportation Research Part D: Transport and Environment 2024, 130, 104182. [Google Scholar] [CrossRef]
- Gebremariam, M. B. Challenges and opportunities of electric mobility in East Africa: review and recommendations. 2024 IEEE PES/IAS PowerAfrica 2024, 1–5. [Google Scholar] [CrossRef]
- Gicha, B. B.; Tufa, L. T.; Lee, J. The electric vehicle revolution in Sub-Saharan Africa: Trends, challenges, and opportunities. Energy Strategy Reviews 2024, 53, 101384. [Google Scholar] [CrossRef]
- Gimpel, R.; Arning, K. Public perceptions and acceptance of alternative fuel vehicles: An empirical analysis on the role of age, gender, and climate change awareness. Energy Reports 2025, 14, 648–656. [Google Scholar] [CrossRef]
- Giri, O. P. Choosing sampling techniques and calculating sample size. Indonesian Journal of Teaching in Science 2024, 4(2), 165–176. [Google Scholar] [CrossRef]
- Güler, H. Drivers of electric mobility: the influence of sociodemographic factors and environmental attitudes on electric vehicle adoption. Dissertation towards a bachelor’s program in Social Science, Lappeenranta–Lahti University of Technology LUT. Finland, 2025. [Google Scholar]
- Harmse, S. An analysis of the regulatory framework required for electric vehicles towards climate change mitigation action in South Africa. Master of Law in Perspectives on Law dissertation, North-West University (South Africa), 2023. [Google Scholar]
- Hull, C.; Giliomee, J. H.; Visser, M.; Booysen, M. J. Electric vehicle adoption intention among paratransit owners and drivers in South Africa. Transport Policy 2024, 146, 137–149. [Google Scholar] [CrossRef]
- Javadnejad, F.; Jahanbakh, M.; Pinto, C. A.; Saeidi, A. Analyzing incentives and barriers to electric vehicle adoption in the United States. Environment Systems and Decisions 2024, 44(3), 575–606. [Google Scholar] [CrossRef]
- Jose Mundaplackal, R. What factors influence individual buyers' decisions to adopt electric vehicles (EV) in New Zealand, and to what extent do these factors contribute to the current state of EV Uptake? Dissertation towards a Master of Applied Management, Otago Polytechnic Dunedin Campus, New Zealand, 2024. [Google Scholar]
- Jusoh, N.; Ali, M. W.; Abdullah, T. A. T.; Husain, A. Validation construct items for the measurement model of permit to work using exploratory factor analysis. International Journal of Business and Globalisation 2022, 30(3-4), 462–477. [Google Scholar] [CrossRef]
- Ka, I.; Djité, A. N.; Chimére Diop, S. A.; Ayetor, G. K.; Diouf, B. The Electric Vehicle Transition in Emerging Economies. Vehicles 2026, 8(2), 37. [Google Scholar] [CrossRef]
- Kimuli, I.; Kirabira, J. B. Research perspectives for improving regulation and policy development for energy efficiency and sustainable mobility in Uganda. Iscience 2025, 28(7). [Google Scholar] [CrossRef]
- Lashram, Y.; Alkabaa, A. S. Navigating challenges in the transition to green transportation: A perception study exploring factors influencing drivers’ intentions for electric vehicle adoption. AIP Advances 2024, 14(3). [Google Scholar] [CrossRef]
- Longe, O. M. A Review on the Motivations, Challenges and Adoption Strategies for Electromobility in Africa. The Institute of Electrical and Electronics Engineers, Inc. (IEEE) Conference Proceedings. The Institute of Electrical and Electronics Engineers, Inc. (IEEE), 2022. [Google Scholar]
- Magagula, B. K.; Rampedi, I. T.; Yessoufou, K. Household pharmaceutical waste management practices in the Johannesburg Area, South Africa. International journal of environmental research and public health 2022, 19(12), 7484. [Google Scholar] [CrossRef]
- Makgato, S. S. Analysis of municipal solid waste in Soweto, Johannesburg Municipality, South Africa: Implications for sustainable waste management practices. Chemical Engineering Transactions 2024, 109, 37–42. [Google Scholar]
- Mandys, F. Electric vehicles and consumer choices. Renewable and Sustainable Energy Reviews 2021, 142, 110874. [Google Scholar] [CrossRef]
- Manu, B. K. User Requirements for Electric Vehicle (EV) Charging Infrastructure in South Africa. Dissertation towards a Master's degree in logistics and transport management, University of Gothenburg, Sweden, 2025. [Google Scholar]
- Mlindelwa, S.; Chowdhury, S. D.; Lencwe, M. J. Overview of the challenges, developments, and solutions for electric vehicle charging infrastructure. In 2024 32nd Southern African Universities Power Engineering Conference (SAUPEC); IEEE, January 2024; pp. 1–6. [Google Scholar]
- Mphahlele, D. N. Exploring the views and roles of municipal officials engaged in the transition towards electric vehicles, a case of the City of Tshwane; University of Johannesburg (South Africa), 2023. [Google Scholar]
- Msosa, S. K.; Khuboni, T. C. Customer Attitudes and Intentions to Purchase Electric Vehicles in South Africa. Calitatea 2026, 27(210), 1–9. [Google Scholar] [CrossRef]
- Ngcobo, N.; Akinradewo, O.; Mokoena, P. Challenges to sustainable transport infrastructure integration in Johannesburg, South Africa. Journal of Sustainable Development of Transport and Logistics 2024a, 9(2), 92–108. [Google Scholar] [CrossRef]
- Ngcobo, N.; Akinradewo, O.; Mokoena, P. Evaluating the measures to promote sustainable transport infrastructure: A case of city of Johannesburg, South Africa. Journal of Engineering 2024b, 2024(1), 6372226. [Google Scholar] [CrossRef]
- Nnene, O. A.; Oyelohunnu, I. I.; Zuidgeest, M. H. Availability of electric mobility policy and its potential for adoption in Africa. Transportation Research Part D: Transport and Environment 2026, 151, 105151. [Google Scholar] [CrossRef]
- Nwokolo, S. C.; Eyime, E. E.; Obiwulu, A. U.; Ogbulezie, J. C. Africa's path to sustainability: harnessing technology, policy, and collaboration. Trends in Renewable Energy 2023, 10(1), 98–131. [Google Scholar] [CrossRef]
- Obilor, E. I. Convenience and purposive sampling techniques: Are they the same. International Journal of Innovative Social & Science Education Research 2023, 11(1), 1–7. [Google Scholar]
- Okoh, A. S.; Onuoha, M. C. Immediate and future challenges of using electric vehicles for promoting energy efficiency in Africa’s clean energy transition. Global Environmental Change 2024, 84, 102789. [Google Scholar] [CrossRef]
- Oni, O. E.; Longe, O. M. A study on electric vehicle footprint in South Africa. Energies 2024, 17(23), 60–86. [Google Scholar] [CrossRef]
- Ruengvirayudh, P.; Brooks, G. P. Sample size for parallel analysis and not-so-common criteria for dimensions in factor analysis: modifying the. General Linear Model Journal 2022, 46(1), 20–34. [Google Scholar] [CrossRef]
- Sachs, J. D.; Toledano, P.; Dietrich Brauch, M.; Mebratu-Tsegaye, T.; Uwaifo, E.; Sherrill, B. M. Roadmap to zero-carbon electrification of Africa by 2050: The green energy transition and the role of the natural resource sector (minerals, fossil fuels, and land). 2022. Available online: https://papers.ssrn.com/sol3/papers.cfm?abstract_id=4042193.
- Sayili, U.; Gunver, M. G. A novel modification approach for the one sample Kolmogorov-Smirnov test in large sample size. Scandinavian Journal of Clinical and Laboratory Investigation 2025, 85(4), 287–298. [Google Scholar] [CrossRef]
- Stratton, S. J. Population sampling: Probability and non-probability techniques. Prehospital and Disaster Medicine 2023, 38(2), 147–148. [Google Scholar] [CrossRef]
- Tin, N. T.; Bui, H. P. Sampling, generalizability, and reliability. In Applied linguistics and language education research methods: Fundamentals and innovations; IGI Global Scientific Publishing, 2024; pp. 103–121. [Google Scholar]
- Tongwane, M. I.; Moeletsi, M. E. Status of electric vehicles in South Africa and their carbon mitigation potential. Scientific African 2021, 14, e00999. [Google Scholar] [CrossRef]
- Wahab, N. J. A. The use of exploratory factor analysis (EFA) for testing the validity of knowledge sharing instruments. Journal of Business Innovation 2022, 7(1), 28. [Google Scholar]
Figure 1.
Southern African map, showing South Africa, its provinces, and the location of Johannesburg in Gauteng (Magagula et al., 2022).
Figure 1.
Southern African map, showing South Africa, its provinces, and the location of Johannesburg in Gauteng (Magagula et al., 2022).
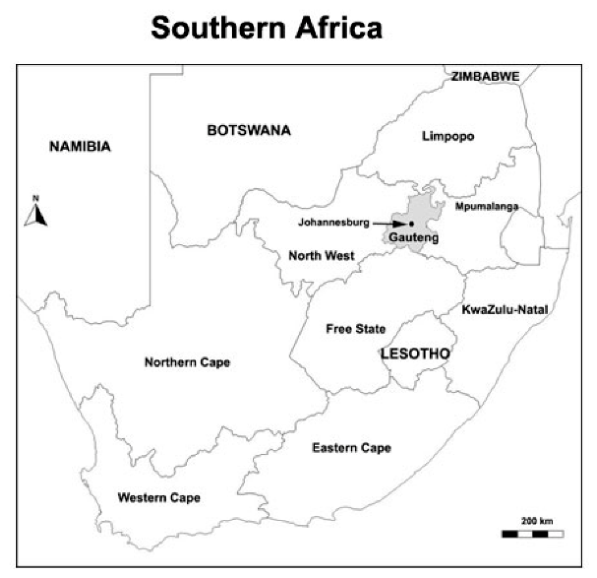
Figure 3.
The conceptual framework.
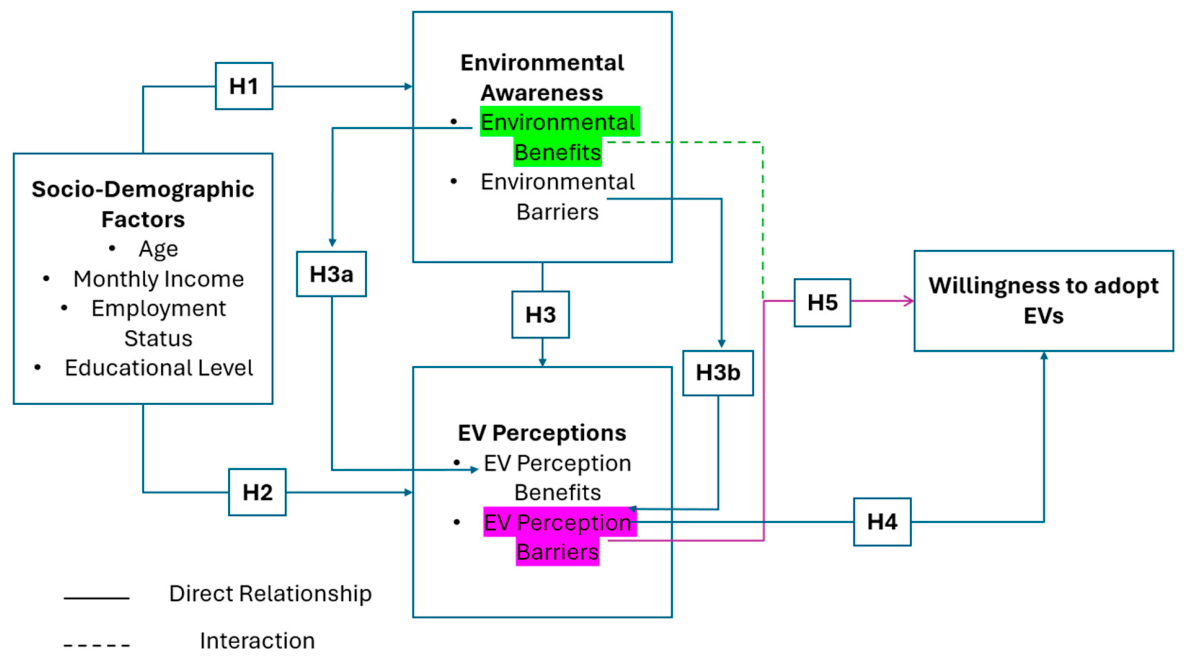
Figure 4.
Mean responses of COJ residents to environmental benefits of EVs according to their employment status.
Figure 4.
Mean responses of COJ residents to environmental benefits of EVs according to their employment status.
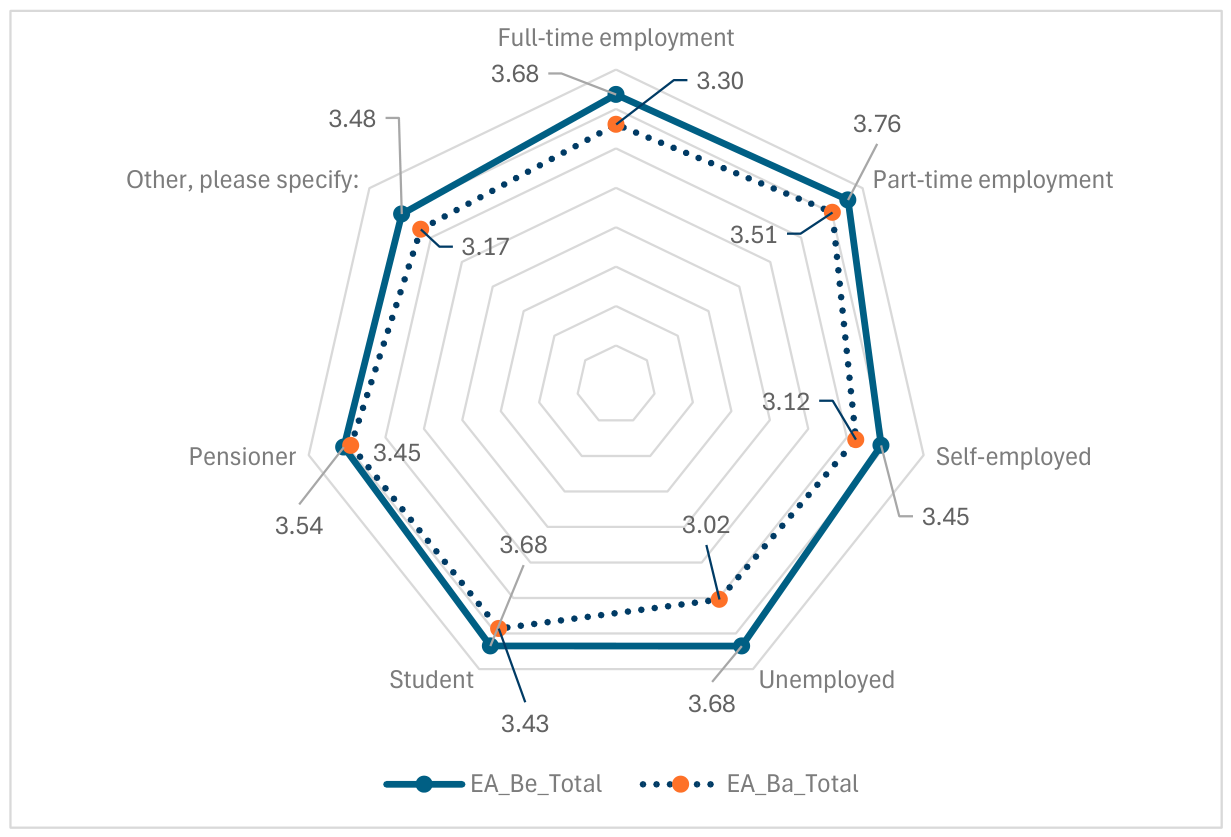
Figure 5.
Mean responses of CoJ respondents reflecting their average perceptions on EVs according to their employment status.
Figure 5.
Mean responses of CoJ respondents reflecting their average perceptions on EVs according to their employment status.
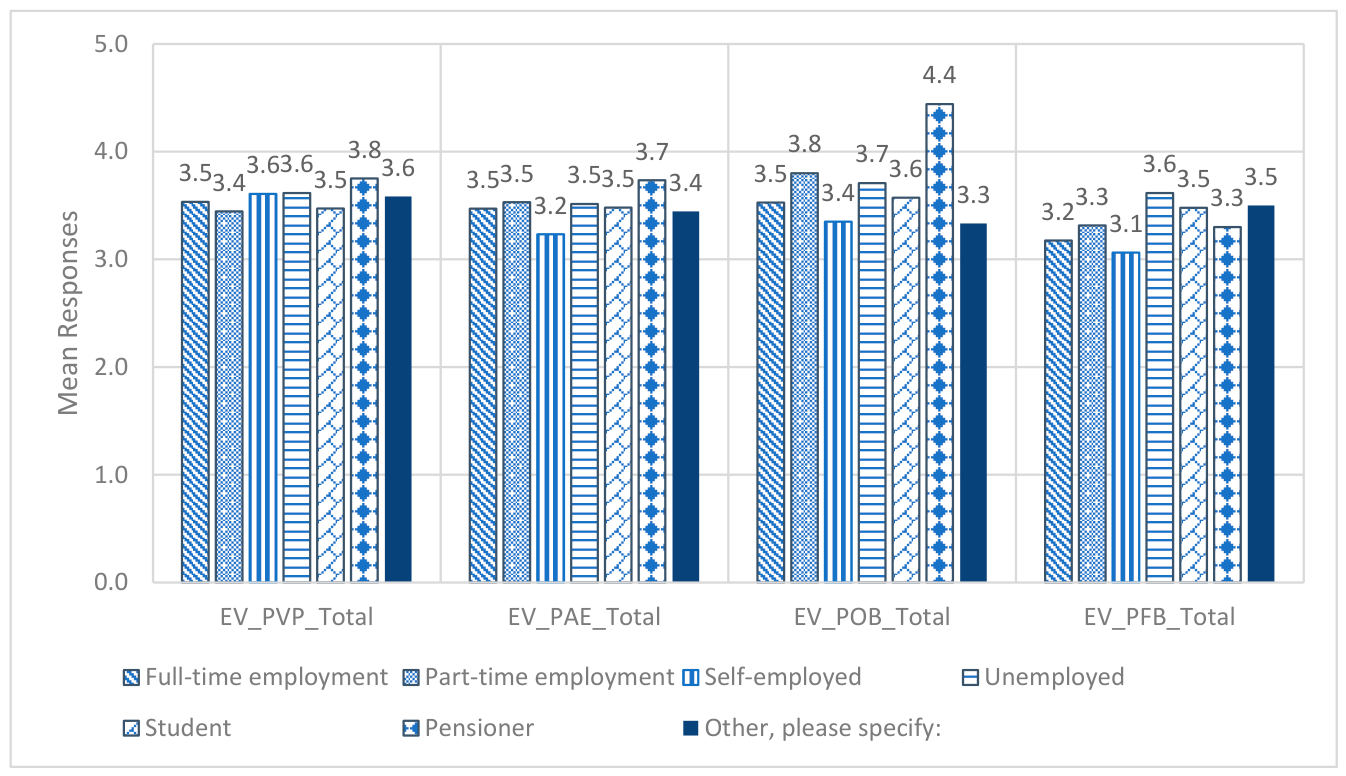
Table 1.
Constructs according to the variables they are intended to measure.
| Environmental Awareness (EA) Perceptions | E-Vehicle (EV)Perceptions | |
|---|---|---|
| Perceived EA Benefits | Perceived EV Benefits | |
| Factor 1: Perceived Environmental and Health Benefits | Factor 1: Perceived Vehicle Performance | |
|
|
|
| Perceived EA Barriers | Factor 2: Perceived Adoption Enablers | |
| Factor 2: Perceived Battery Lifecyle and Natural Resource Concerns |
|
|
|
||
|
Perceived EV Barriers Factor 3: Perceived Operational Barriers
|
||
| Factor 4: Perceived Financial Barriers | ||
|
Table 3.
Summary of EFA Factor Loadings and Extracted Constructs.
| Factor/ Construct | Factor Loadings (λ) | Eigenvalue | Variance (%) | Cronbach’s (α) |
|---|---|---|---|---|
| Perceived Environmental & Health Benefits | 0.697-0.809 | 3.969 | 56.703 | 0.885 |
| Perceived Operational Barriers | 0.497-0.697 | 2.490 | 49.793 | 0.746 |
| Perceived Vehicle Performance | 0.495-0.631 | 1.910 | 47.760 | 0.634 |
| Perceived Financial Barriers | 0.439 | 1.193 | 59.648 | 0.323 |
| Perceived Battery Lifecycle & E-Waste | 0.520-0.926 | 2.072 | 51.805 | 0.764 |
| Perceived Adoption Enablers | 0.451-0.778 | 1.617 | 53.885 | 0.569 |
Table 4.
Spearman rho coefficients of correlation measuring EA as a predictor of EV perceptions.
| Environmental Awareness (EA) | ||||
|---|---|---|---|---|
| Perceived Environmental and Health Benefits | Perceived Battery Lifecyle and Natural Resource Barriers | |||
| Perceived EV Benefits | Perceived Adoption Enablers | rs | .429*** | .125* |
| p | <0.001 | 0.014 | ||
| Perceived Vehicle Performance | rs | .383*** | 0.056 | |
| p | <0.001 | 0.268 | ||
| Perceived EV Barriers | Perceived Operational Barriers | rs | -0.076 | .200*** |
| p | 0.136 | <0.001 | ||
| Perceived Financial Barriers | rs | -0.010 | 0.032 | |
| p | 0.839 | 0.529 | ||
Table 6.
Socio-demographic profile of respondents.
| Socio-Demographic Factor | Frequency (n) | Percentage (%) | |
|---|---|---|---|
| Gender | Female | 193 | 49.5 |
| Male | 167 | 42.8 | |
| LGBTQAI++ | 30 | 7.7 | |
| Age | 18 - 24 years | 127 | 32.6 |
| 25 - 34 years | 112 | 28.7 | |
| 35 - 44 years | 82 | 21.0 | |
| 45 - 54 years | 51 | 13.1 | |
| 55 years or older | 18 | 4.6 | |
| Employment Status | Full-time employment | 198 | 50.8 |
| Part-time employment | 27 | 6.9 | |
| Self-employed | 40 | 10.3 | |
| Unemployed | 26 | 6.7 | |
| Student | 91 | 23.3 | |
| Pensioner | 5 | 1.3 | |
| Other, please specify: | 3 | 0.8 | |
| Highest Level of Education | Some high school | 3 | 0.8 |
| High school (matric) | 70 | 17.9 | |
| Adult Basic Education and Training (ABET) | 9 | 2.3 | |
| Post-matric certificate | 27 | 6.9 | |
| Diploma | 47 | 12.1 | |
| Undergraduate degree (Bachelors) | 124 | 31.8 | |
| Postgraduate degree (Honours/Masters/PhD) | 110 | 28.2 | |
| Monthly Income | <R40 000 | 320 | 82.1 |
| >R40 000 | 70 | 17.9 | |
| Province | Gauteng | 389 | 99.7 |
| Limpopo | 1 | 0.3 | |
| Type of residence | Commune | 16 | 4.1 |
| Flat/apartment | 70 | 17.9 | |
| Private house | 164 | 42.1 | |
| Retirement village/home | 5 | 1.3 | |
| Townhouse | 24 | 6.2 | |
| Student accommodation | 37 | 9.5 | |
| Informal settlement | 3 | 0.8 | |
| RDP house | 22 | 5.6 | |
| Other, please specify: | 48 | 12.3 |
Table 7.
Sociodemographic influences on environmental awareness (EA) and e-mobility (EV) perceptions.
Table 7.
Sociodemographic influences on environmental awareness (EA) and e-mobility (EV) perceptions.
| Linear Regression | |||||||
|---|---|---|---|---|---|---|---|
| Predictor Variable | Dependent Variable | B | ᵦ | t-statistic | P | Model Fit | R2 |
| Age | EA_Be_Average | -0.005 | -0.067 | -1.317 | 0.189 | F(1,388)=1.735, p=0.189 | 0.004 |
| EA_Ba_Average | -0.005 | -0.088 | -1.741 | 0.082 | F(1,388)=3.032, p=0.082 | 0.008 | |
| EV_PVP_Average | 0.003 | 0.051 | 1.010 | 0.313 | F(1,388)=1.021, p=0.313 | 0.003 | |
| EV_PAE_Average | -0.005 | -0.070 | -1.389 | 0.166 | F(1,388)=1.930, p=0.166 | 0.005 | |
| EV_POB_Average | 0.002 | 0.032 | 0.635 | 0.526 | F(1,388)=0.403, p=0.526 | 0.001 | |
| EV_PFB_Average | -0.009 | -0.144 | -2.860 | 0.004 | F(1,388)=8.181, p=0.004 | 0.021 | |
| One-way ANOVA | |||||||
| Statistic | Significant Pairwise Comparisons (Tukey HSD) | Mean Difference (I-J), p | |||||
| Highest level of education | EA_Be_Average | F(6, 383)=4.365, p<0.001 | Diploma – Postgraduate degree | -0.59119, p < 0.001 | |||
| Undergraduate degree – postgraduate degree | -0.37673, 0.003 | ||||||
| EA_Ba_Average | F(6, 383)=3.593, p=0.002 | Some high school – ABET | 1.47222, 0.014 | ||||
| Matric – ABET | 0.74841, 0.022 | ||||||
| Postgraduate degree – ABET | 0.70328, 0.033 | ||||||
| EV_PVP_Average | F(6, 383)=1.243, p=0.283 | ||||||
| EV_PAE_Average | F(6, 383)=1.955, p=0.071 | ||||||
| EV_POB_Average | F(6, 383)=0.665, p=0.678 | ||||||
| EV_PFB_Average | F(6, 383)=3.619, p=0.002 | - | - | ||||
| Employment status | EA_Be_Average | F(6, 383)=0.680, p=0.666 | |||||
| EA_Ba_Average | F(6, 383)=2.377, p=0.029 | - | - | ||||
| EV_PVP_Average | F(6, 383)=0.380, p=0.892 | ||||||
| EV_PAE_Average | F(6, 383)=0.580, p=0.746 | ||||||
| EV_POB_Average | F(6, 383)=2.205, p=0.042 | - | - | ||||
| EV_PFB_Average | F(6, 383)=3.434, p=0.003 | Full-time employment – student | -0.30378, 0.026 | ||||
| Self-employed – student | -0.41552, 0.012 | ||||||
| t-test | |||||||
| Test statistic | Mean Difference | ||||||
| Monthly Income | EA_Be_Average | t(388)=-1.932, p=0.054 | -0.19471 | ||||
| EA_Ba_Average | t(388)=1.284, p=0.200 | 0.11261 | |||||
| EV_PVP_Average | t(388)=-1.888, p=0.060 | -0.17734 | |||||
| EV_PAE_Average | t(388)=-0.692, p=0.489 | -0.08006 | |||||
| EV_POB_Average | t(388)=2.682, p=0.009 | 0.30705 | |||||
| EV_PFB_Average | t(388)=3.805, <0.001 | 0.36362 | |||||
Table 8.
Centrality and dispersion of responses of respondents to statements measuring awareness levels of environmental benefits and barriers to EVs.
Table 8.
Centrality and dispersion of responses of respondents to statements measuring awareness levels of environmental benefits and barriers to EVs.
| N | Mean (µ) | Std. Deviation (σ) | ||
|---|---|---|---|---|
| EA_Be_Average | Lower-to-Middle Income | 320 | 3.6237 | 0.74777 |
| High Income | 70 | 3.8184 | 0.83368 | |
| EA_Ba_Average | Lower-to-Middle Income | 320 | 3.3305 | 0.67243 |
| High Income | 70 | 3.2179 | 0.62688 |
Table 9.
Descriptive and t-test findings showing the influence of monthly income on EV perceptions.
| N | Mean (µ) | Std. Deviation (σ) | t(388) | p | ||
|---|---|---|---|---|---|---|
| EV_PVP_Average | <R40000 | 320 | 3.4977 | .68672 | -1.888 | 0.06 |
| >R40000 | 70 | 3.6750 | .81910 | |||
| EV_PAE_Average | <R40000 | 320 | 3.4437 | .86796 | -0.692 | 0.489 |
| >R40000 | 70 | 3.5238 | .91783 | |||
| EV_POB_Average | <R40000 | 320 | 3.6156 | .75874 | 2.682 | 0.009 |
| >R40000 | 70 | 3.3086 | .88967 | |||
| EV_PFB_Average | <R40000 | 320 | 3.3422 | .73382 | 3.805 | <0.001 |
| >R40000 | 70 | 2.9786 | .67800 |
Table 10.
Multiple linear regression showing EA as a predictor of EV perceptions.
| Model | ANOVA | Coefficients | ||||||
|---|---|---|---|---|---|---|---|---|
| Model Predictor Variables | R2 | F(2,387) | P | Unstandardized B | Standardized β | t-statistic | p-value | Independent Variables |
| EV_PVP | 0.158 | 72.833 | <0.001 | 0.371 | 0.398 | 8.534 | <0.001 | EA_Be |
| EV_PAE | 0.178 | 41.777 | <0.001 | 0.481 | 0.421 | 9.094 | <0.001 | EA_Be |
| 0.010 | 0.008 | 0.172 | 0.863 | EA_Ba | ||||
| EV_POB | 0.024 | 9.606 | 0.002 | 0.185 | 0.155 | 3.099 | 0.002 | EA_Ba |
Table 11.
Influence of socio-economic, EA, and EV barriers on the willingness to adopt, as shown in the 3-phase hierarchical model.
Table 11.
Influence of socio-economic, EA, and EV barriers on the willingness to adopt, as shown in the 3-phase hierarchical model.
| Block | Unstandardized Coefficients | Standardized Coefficients | T | P | Collinearity Statistics | |||
|---|---|---|---|---|---|---|---|---|
| B | Std. Error | Β | Tolerance | VIF | ||||
| 1 | (Constant) | 2.121 | 0.208 | 10.209 | <0.001 | |||
| Highest level of education. | -0.056 | 0.025 | -0.124 | -2.273 | 0.024 | 0.834 | 1.200 | |
| Your employment status. | -0.021 | 0.025 | -0.045 | -.818 | 0.414 | 0.830 | 1.204 | |
| Q5_LowerToMiddle_Income | -0.268 | 0.114 | -0.126 | -2.344 | 0.020 | 0.866 | 1.155 | |
| 2 | (Constant) | 2.832 | 0.387 | 7.322 | <0.001 | |||
| Highest level of education. | -0.043 | 0.024 | -0.095 | -1.795 | 0.073 | 0.820 | 1.220 | |
| Your employment status. | -0.014 | 0.024 | -0.031 | -.593 | 0.554 | 0.828 | 1.208 | |
| Q5_LowerToMiddle_Income | -0.186 | 0.112 | -0.088 | -1.669 | 0.096 | 0.839 | 1.192 | |
| EA_Be_Total | -0.153 | 0.058 | -0.143 | -2.617 | 0.009 | 0.772 | 1.296 | |
| EA_Ba_Total | 0.019 | 0.060 | 0.016 | .322 | 0.747 | 0.960 | 1.042 | |
| EV_PVP_Total | -0.103 | 0.073 | -0.090 | -1.421 | 0.156 | 0.570 | 1.754 | |
| EV_PAE_Total | -0.104 | 0.061 | -0.111 | -1.706 | 0.089 | 0.543 | 1.842 | |
| EV_POB_Total | 0.107 | 0.052 | 0.104 | 2.067 | 0.039 | 0.915 | 1.093 | |
| 3 | (Constant) | 2.820 | 0.387 | 7.280 | <0.001 | |||
| Highest level of education. | -0.044 | 0.024 | -0.097 | -1.826 | 0.069 | 0.818 | 1.222 | |
| Your employment status. | -0.014 | 0.024 | -0.030 | -.574 | 0.566 | 0.827 | 1.209 | |
| Q5_LowerToMiddle_Income | -0.182 | 0.112 | -0.086 | -1.631 | 0.104 | 0.837 | 1.195 | |
| EA_Be_Total | -0.152 | 0.058 | -0.142 | -2.599 | 0.010 | 0.771 | 1.296 | |
| EA_Ba_Total | 0.025 | 0.061 | 0.020 | .410 | 0.682 | 0.944 | 1.059 | |
| EV_PVP_Total | -0.098 | 0.073 | -0.086 | -1.338 | 0.182 | 0.564 | 1.773 | |
| EV_PAE_Total | -0.103 | 0.061 | -0.111 | -1.696 | 0.091 | 0.543 | 1.842 | |
| EV_POB_Total | 0.100 | 0.053 | 0.097 | 1.900 | 0.058 | 0.885 | 1.130 | |
| Interaction_EA_x_EV | 0.047 | 0.067 | 0.036 | 0.711 | 0.477 | 0.924 | 1.082 | |
| a. Dependent Variable: If access to public e-vehicles is made available in your area, will you consider using electric vehicles over the usual internal combustion engine vehicles? | ||||||||
Disclaimer/Publisher’s Note: The statements, opinions and data contained in all publications are solely those of the individual author(s) and contributor(s) and not of MDPI and/or the editor(s). MDPI and/or the editor(s) disclaim responsibility for any injury to people or property resulting from any ideas, methods, instructions or products referred to in the content. |
© 2026 by the authors. Licensee MDPI, Basel, Switzerland. This article is an open access article distributed under the terms and conditions of the Creative Commons Attribution (CC BY) license (http://creativecommons.org/licenses/by/4.0/).
Copyright: This open access article is published under a Creative Commons CC BY 4.0 license, which permit the free download, distribution, and reuse, provided that the author and preprint are cited in any reuse.