

Submitted:
07 October 2026
Posted:
09 October 2026
You are already at the latest version
Abstract
Hepatitis B virus (HBV) infection remains a significant global public health concern. Data suggest that HBV genotypes/sub-genotypes and virulence-associated mutations can influence the natural history and treatment outcomes of HBV infection. However, the dearth of full-length HBV genome sequences in Kenya limits complete understanding of emerging variants and recombination events. Here, we sequenced and analyzed 165 HBV DNA whole-genome sequences from HBsAg-positive serum samples of voluntary blood donors across different geographic regions of Kenya between 2019 and 2023 to provide deeper insights into the virus’s genomic diversity, virulence-associated mutations, recombinations, and drug resistance profiles. Genomic analysis revealed a predominance of HBV genotype A in Kenya (77.0%), followed by genotype D (19.4%) and genotype E (3.6%) during the study period. Within genotype A, sub-genotype A1 predominated (99%), while A2 was a minority. Among genotype D, sub-genotype D7 was most common (97%), followed by D1 (3%). Recombination was detected in 4.2% of the sequenced isolates and involved genotype A/D, A/E, D/A, and D/E recombinant forms. None of the sequenced isolates harbored mutations linked to resistance to approved nucleos(t)ide analogues in the reverse transcriptase region of the polymerase gene. However, genetic variation associated with a higher risk of hepatocellular carcinoma (HCC), vaccine immune escape, and occult hepatitis B virus infection (OBI) were detected across genomic regions, including HCC-linked mutations G1896A in 81.3% (26/32; 95% CI: 63.6–92.8) of genotype D and 50% (3/6; 95% CI: 11.8–88.2) of genotype E isolates (FDR-adjusted p < 0.001); and G1899A in 17.0% (28/165; 95% CI: 11.6–23.6, FDR-adjusted p < 0.05) in the precore gene region of all isolates. Additionally, those present in the basal core promoter region included C1773T in 80.0% (132/165; 95% CI: 73.1–85.8, FDR-adjusted p < 0.001) and A1762T/G1764-double mutation in 29.1% (48/165; 95% CI: 22.3–36.7) of all isolates. Immune escape-linked amino acid variation within the “a” determinant of the major hydrophilic region (MHR) in the S gene region, included T131N in 99.2% (126/127; 95% CI: 95.7–100, FDR-adjusted p < 0.001) of genotype A and T126A/S in 16.7% (1/6; 95% CI, 0.4–64.1, FDR-adjusted p > 0.05) of genotype E isolates, while those related to occult-HBV infection (OBI) included P127H/L in 3.6% (6/165; 1.3–7.7, FDR-adjusted p < 0.001) of all isolates. Overall, our findings indicate that HBV genotype A (sub-genotype A1) predominates in Kenya, followed by genotypes D (sub-genotype D7) and E. Moreover, the detection of HBV variants harboring genetic markers associated with immune escape, occult hepatitis B (OBI), and liver disease complications highlights the need for public health countermeasures such as immunization of infants and scaling up of adult vaccination to reduce infections. Furthermore, wider integration of molecular real-time PCR testing into the national blood screening algorithm is advised to reduce the risk of horizontal transmission from asymptomatic HBV blood donors harboring occult HBV infection mutations and ensure the safety of blood and blood products.
Keywords:
hepatitis B virus (HBV)
; whole-genome sequencing
; immune escape mutations
; HBV genotypes
; asymptomatic carriers
; Kenya
1. Introduction
Despite the availability of effective vaccines and other therapeutic interventions, hepatitis B Virus (HBV) infection remains a significant worldwide health problem [1,2]. Globally, an estimated two billion people have been exposed to HBV, with > 350 million living with a chronic infection [1,3], responsible for > 600,000 deaths each year, largely due to liver disease complications [3]. The African continent accounts for more than 20% of the global chronic HBV disease burden, with a prevalence rate of approximately 6.1% (95% CI 4.6 to 8.5), and consequently about 100,000 deaths annually [4,5,6]. HBV is transmitted vertically (mother-to-child) through blood and body fluids, or horizontally (via blood transfusion and sexual transmission), and can cause both acute and chronic infections [7]. Acute infection is typically short-term; however, if the body’s immune system fails to clear the infection within 6 months, it may become chronic and progress to end-stage liver disease complications, such as liver cirrhosis (LC) and hepatocellular carcinoma (HCC) [1,3,8]. Chronic HBV carriers are believed to be the reservoirs for viral evolution [1]. During prolonged chronic HBV infection, the virus may undergo adaptive selection under immune or antiviral drug therapy pressure, resulting in the emergence of variants [1,5,9]. In addition, other viral factors, including the lack of reverse transcriptase (RT) proofreading during genome replication and recombination events, also contribute to its genetic diversity [1,9].
HBV belongs to the family Hepadnaviridae, genus Orthohepadnavirus, and is composed of a loosely circular, partly double-stranded DNA genome of approximately 3.2 kb in length, organized into four overlapping structural genes, referred to as open reading frames (ORFs): the polymerase (Pol) ORF, the pre-surface/surface (PreS/S) ORF, the pre-core/core (PreC/C) ORF, and the protein X (X) ORF [8,10]. It also contains regulatory elements, including direct repeats 1 and 2 (DR1 and DR2), enhancer regions 1 and 2 (En1 and En2), promoters I and II, and the basic core promoter (BCP) [8,10]. Replication of the HBV genome involves a pregenomic RNA intermediate (pgRNA) transcribed from covalently closed circular DNA (cccDNA) using an encoded reverse transcriptase (RT), deficient in 5’-3’ exonuclease proofreading function. This results in error-prone replication at a mutation rate of approximately 1.4 to 3.2 × 10⁻⁵ base substitutions per site per year [1,2,10]. Accordingly, based on its genetic divergence, HBV is grouped into 10 genotypes, viz. HBV-A to HBV-J segregated by >7.5% genome-wide nucleotide sequence divergence, and 44 sub-genotypes, separated by >4% genome-wide nucleotide sequence divergence [1,10,11,12].
The HBV genotypes and sub-genotypes exhibit variations in geographic distribution, transmission routes, disease progression, response to therapy, and clinical outcomes [2,4,9,10,13]. The natural history of infection depends on diverse factors, including age at infection, genotype/subgenotype, virulence-associated mutations, and viral load [9,13]. Case in point, HBV-A is characterized by early HBeAg seroconversion and better outcomes than HBV-D [14]. Besides, HBV-A and HBV-B show a greater response to interferon-alpha therapy than HBV-C and HBV-D [14]. Moreover, HBV-A and HBV-D are commonly associated with horizontal transmission [4,13]. Previous studies have associated the occurrence of certain mutations in the HBV PreS/S1 gene region with immune escape, therapy escape, occult HBV infection (OBI), and HCC [13]. Similarly, genetic markers in the basal core promoter (BCP) and precore (PC) genes have been linked to increased risk of liver disease complications, including HCC and LC [9].
Kenya is classified as having intermediate HBV endemicity, with an HBsAg prevalence of 2% to 8% [4,15]. Most of the existing information on HBV is mainly from serologic and gene-specific molecular studies conducted in low- and high-risk groups [4,16,17,18,19]. However, data on molecular epidemiology based on whole-genome sequencing is sparse [4]. Genomic characterization of HBV is important for providing comprehensive insights into emerging virus variants that may influence transmission dynamics, therapeutic options, and clinical outcomes [4,20,21]. The World Health Organization (WHO) set a goal of eliminating HBV infection by the year 2030 [22]. Achieving this target requires curative therapy, which is dependent on a deeper understanding of the virus’s evolutionary dynamics to guide treatment options and the development of newer diagnostics and therapies [23]. In the current study, we describe the genomic diversity, recombination events, and virulence-associated genetic markers among HBV strains circulating in Kenya.
2. Materials and methods
2.1. Study Sites and Sampling
The study utilized 798 HBsAg-positive serum samples from voluntary blood donations collected between 2019 and 2023 at six Regional Blood Transfusion Centers (RBTCs), fourteen satellite centers, and the National Testing Laboratories (NTL) across Kenya. The serum samples were aliquoted from HBsAg-positive blood donations at the Kenya National Blood Transfusion Service (KNBTS) laboratories in Nairobi, following screening, in accordance with the KNBTS testing algorithm [2] and archived at -80 °C for research purposes. The screening was performed using a chemiluminescent immunoassay (Lorne Laboratories, UK), in accordance with the manufacturer’s instructions.
2.2. Ethical Considerations
The study was conducted in accordance with the Declaration of Helsinki, and ethical approval for the research protocol was granted by the Jomo Kenyatta University of Agriculture and Technology Institutional Scientific and Ethics Review Committee (JKUAT-ISEREC), approval number JKU/IERC/02316/0189, and the Kenyatta National Hospital - University of Nairobi - Ethics and Research Committee (KNH-UoN ERC), approval number P558/06/2023. Further approvals were from the Kenya National Blood Transfusion Service (KNBTS) and the National Council for Science, Technology, and Innovation (NACOSTI), approval number 620469.
2.3. Nucleic Acid Extraction, Real-Time PCR Assay, and Nested PCR Amplification
We extracted viral DNA from 200 µl of HBsAg-positive serum using the QIAamp viral DNA kit (QIAGEN, Germany) according to the manufacturer’s instructions. The extracted nucleic acid was screened for HBV DNA by a real-time PCR assay as previously described elsewhere [24]. The HBV genome was amplified by nested PCR using four sets of overlapping primers, published elsewhere [25]. Briefly, the first round of PCR reaction mixture comprised 5 µl of DNA template, 0.5 µl of each of the forward and reverse outer primers (20 pmol/µl), 12.5 µl of MyTaq Red Mix, 2x (Bioline, United Kingdom), and nuclease-free water (Thermo Fisher Scientific, Waltham, MA, USA) in a final volume of 25 µl. We used a similar reaction mixture composition for the second PCR, but added 2 µl of template from the first-round PCR product. PCR thermocycling conditions were as previously described [25]. The PCR products were electrophoresed on a 1% agarose gel (Sigma-Aldrich Co., USA) and visualized using the E-box gel imaging system (Vilber Lourmat, France).
2.4. Oxford Nanopore Technology Library Preparation and Sequencing
The PCR products generated from individual samples were pooled in equal volumes and quantified using the Qubit double-strand DNA (dsDNA) High Sensitivity (HS) assay kit on a Qubit 3.0 Fluorometer (Thermofischer Scientific, USA), according to the manufacturer’s protocol. The pooled products were next purified with Agencourt AMPure XP beads (Beckman Coulter Life Sciences, USA) and quantified using the Qubit dsDNA HS assay kit. DNA library preparation was done using the SQK-RBK110.96 rapid barcoding kit (Oxford Nanopore Technologies) and transferred onto an R.10.4.1 flow cell (Oxford Nanopore Technologies) for sequencing on the MinION 1KB instrument (Oxford Nanopore Technologies), according to the manufacturer’s instructions.
2.5. Raw-read Processing and Genotyping
Base-calling of the raw sequencing files (FAST5) into FASTQ files and demultiplexing were performed using Guppy v3.4.5 software (Oxford Nanopore Technologies). Quality control checks of individual samples’ reads were performed using fastQC software [26]. Adapter removal, filtering, and trimming of low-quality ends were done using Porechop and Chopper software [27,28]. De novo assembly, nucleotide query sequence BLAST search (Basic Local Alignment Search Tool analyses) against the National Center for Biotechnology Information (NCBI) nucleotide database for candidate reference sequences, reference mapping, building of consensus sequence, and variant calling were performed using Canu, BLASTn (Nucleotide BLAST), minimap2, samtools, and bcftools software [29,30,31,32]. Polishing of the sequences was carried out using Medaka software [33] and the sequences were deposited in the GenBank database under accession numbers PZ495688-PZ495886. Subsequently, well-annotated whole-genome reference sequences of all known human HBV genotypes and sub-genotypes were retrieved from GenBank for phylogenetic analyses, alongside those obtained in the study. Multiple sequence alignment was performed using the MAFFT software v7 [34]. The best-fit substitution model for phylogenetic analyses was determined using the ModelFinder software [35]. Maximum-likelihood trees were reconstructed with IQ-TREE v1.6.12 using the (GTR + G + I) model [35]. Branch support was assessed using the ultrafast bootstrap approximation (UFBoot) and the SH-like approximate likelihood ratio test (SH-aLRT), each with 1000 replicates. The phylogenetic trees were visualized and annotated using the ggtree package in R [36].
2.6. Recombination Analysis
All sequences generated in the study were analyzed for probable recombination using RDP5 v5.74 software [37]. Any recombination event identified by at least five of the seven algorithms (RDP, GENECONV, MaxChi, Bootscan, Chimaera, SiScan, and 3Seq) was considered to be true. Default settings were used for all programs, except Bootscan and SiScan, whose window and step sizes were adjusted to 300 bp and 30, respectively. Details of the recombination events, including type, breakpoints, size of the recombinant fragment, and genomic regions involved in recombination, are presented in Supplementary file 1.
2.7. Mutation and Statistical Analysis
The HBV polymerase reverse transcriptase (RT) domain was investigated for the presence of known nucleos(t)ide analogue (NA) resistance (NAr) mutations [38,39]. The PreS/S gene was analyzed for mutations reported to be associated with HCC, immune escape, and detection failure using anti-HBs diagnostic commercial kits targeting HBsAg/Occult hepatitis B virus infection (OBI). Similarly, the basal core promoter (BCP), Precore (Pre/C), and X genes were analyzed for mutations reported to be associated with HCC, LC, and CHB [9,13,39,40]. All statistical analyses were done using R version 4.5.3 [41]. Fisher’s exact test was used to compare categorical variables, including genotype mutations, via the base R function fisher.test ()). The 95% confidence intervals were calculated using the Clopper-Pearson exact method [42] via the binom.test (), and p-values across multiple comparisons were adjusted to control the false discovery rate (FDR) using the Benjamini-Hochberg procedure [43] implemented in the base R function p.adjust(…, method = “BH”). FDR-adjusted p-values (q-values) < 0.05 were considered to be statistically significant.
3. Results
Overall, 221 (27.7%) of 798 HBsAg-positive serum samples had detectable HBV DNA by real-time PCR assay (threshold cycle (Ct) values ranged from 17 to 40). Of these, 168 (76.0%) were successfully amplified by nested PCR, and upon sequencing, 165 (98.2%) yielded usable genome sequences. The genomes were sequenced at a median depth of 1941 (IQR: 859-2864), with ≥99.0% genome coverage (median,100%; range: 99.0 to 100%). The sequence lengths were 3221 base pairs (bp) for genotype A, 3182 bp for genotype D, and 3212 bp for genotype E. Regarding gender distribution, a majority of the 165 participants whose samples were sequenced successfully were male (58.8%, 97/165; 95% CI: 50.9–66.4), and the median age for the group was 28 years (range: 18–50) (Table 1). Phylogenetic analysis revealed that a majority of the sequences belonged to HBV genotype A (77.0%,127/165; 95% CI: 69.8–83.2%) while 19.4% (32/165; 95% CI: 13.6 - 26.3%) genotype D and 3.6% (6/165; 95% CI: 1.3–7.7) genotype E (Table 1, Figure 1).
Among genotype A, 99.2% (n = 126) were sub-genotype A1, and 0.8% (n = 1) were sub-genotype A2 (Figure 2). For genotype D isolates, 97% (n = 31) were sub-genotype D7, while 3% (n = 1) were sub-genotype D1 (Figure 3).
Recombination analysis detected events in 4.2% (7/165; 95% CI: 1.7 - 8.6%) of the HBV genome sequences: 2.4% (3/127; 95% CI: 0.5–6.7%) in genotype A, 12.5% (4/32; 95% CI: 3.5 - 29.0%) in genotype D, and 0.0% (0/6; 95% CI: 0.0–45.9%) in genotype E (p < 0.01). They included recombinant forms of genotypes A/D (1/7), A/E (2/7), D/A (2/7), and D/E (2/7), as shown in Figure 4. None of the sequenced isolates harboured mutations associated with resistance to approved nucleos(t)ide analogues in the RT region of the polymerase gene. In the preS1 gene region, the HCC-linked amino acid variations A60V/E and N38K were observed in 98.4% (125/127; 95% CI: 94.4–99.8%) of genotype A and 100% (32/32; 95% CI: 89.1 - 100%) of genotype D isolates, respectively (FDR-adjusted p < 0.001; Table 2). In the preS2 gene region, further susbstitutions were noted including, the start codon mutation M1V/T/I, exclusive to genotype A (15.7%, 20/127; 95% CI: 10.0–23.3%; FDR-adjusted p < 0.05), together with F22L (24.8%, 41/165; 95% CI: 18.5.0–32.2%) and A39V (1.8%, 3/165; 95% CI: 0.02–3.3%) of all isolates, (FDR-adjusted p > 0.05; Table 2).
Additional HCC-linked substitutions were detected in the S gene, including V184A (3.6%, (6/165; 95% CI: 1.3–7.7%; FDR-adjusted p < 0.001), R24K (4.2%,7/165; 95% CI: 1.7–8.6%; FDR-adjusted p > 0.05), 3S (2.4%, 4/165; 95% CI: 0.7–6.1%; FDR-adjusted p < 0.001), 126T (99.4%, 164/165; 95% CI: 96.7–100%; FDR-adjusted p > 0.05), S204R (2.4%, 4/165; 95% CI: 0.7–6.1%; FDR-adjusted p > 0.05), P62L (0.6%, 1/165; 95% CI: 0.01–3.3%; FDR-adjusted p > 0.05), and V168A (1.2%, 2/165; 95% CI: 0.1–4.3%; FDR-adjusted p > 0.05) of all isolates. The 126T substitution was prevalent across genotypes (Table 2). Besides, those linked to vaccine immune escape (VEM) within the “a” determinant of the major hydrophilic region (MHR) of the S gene region included T131N (99.2%, 126/127; 95% CI: 95.5–100%) and134F (100.0%, 127/127; 95% CI: 97.1–100%) in genotype A (FDR-adjusted p- < 0.001), together with F134L/I (2.5%, 4/165; 95% CI: 0.7–6.1%; FDR-adjusted p > 0.05), T126A/S (0.6%, 1/165; 95% CI: 0.02–3.3%; FDR-adjusted p > 0.05), P127H/L (3.6%, 6/165; 95% CI: 1.3–7.7%; FDR-adjusted p < 0.001), G130N/R (0.6%, 1/165; 95% CI: 0.02–3.3%; FDR-adjusted p > 0.05), M133T (2.4%, 4/165; 95% CI: 0.7–6.1; FDR-adjusted p > 0.05), and Q129R/H (1.8%, 3/165; 95% CI: 0.4–5.2%; FDR-adjusted p > 0.05) of all isolates. The P127H/L, M133T, and Q129R/H variations are also OBI-linked (Table 3). Moreover, VEM-linked substitutions outside the “a” determinant region but within the MHR included K122N/R (28.5%, 47/165; 95% CI: 21.7–36.0%; FDR-adjusted p < 0.001), M103I (1.8%, 3/165; 95% CI: 0.4–5.2%; FDR-adjusted p > 0.05) were detected, together with Q101R (0.6%, 1/165; 95% CI: 0.02–3.3%; FDR-adjusted p > 0.05), S167L (1.2%, 2/165; 95% CI: 0.1–4.3%; FDR-adjusted p > 0.05), I110L in 1.2% (2/165; 95% CI: 0.1–4.3%; FDR-adjusted p > 0.05) of all isolates, in addition to 114T (100%, 127/127; 95% CI: 97.1–100%; FDR-adjusted p < 0.001; genotype A) and Y100C (0.6%, 1/165; 95% CI: 0.02–3.3%; FDR-adjusted p > 0.05; of all isolates) which are linked to OBI (Table 3). Further substitutions outside the MHR of the S gene region, included L94S (0.5%, 1/165; 95% CI: 0.02–3.3%; FDR-adjusted p > 0.05), which is linked to OBI, along with I68V (0.6%, 1/165; 95% CI: 0.02–3.3%; FDR-adjusted p > 0.05), V96A (0.6%, 1/165; 95% CI: 0.02–3.3%; FDR-adjusted p > 0.05), M198I (0.6%, 1/165; 95% CI: 0.02–3.3%; FDR-adjusted p > 0.05), L175S (1.2%, 2/165; 95% C1, 0.1–4.3%; FDR-adjusted p > 0.05), V190A (2.4%, 4/165; 95% CI: 0.7–6.1%; FDR-adjusted p > 0.05), and S193L (1.2%, 2/165; 95% CI: 0.1–4.35; FDR-adjusted p > 0.05) of all isolates, which are related to VEM (Table 3).
In the BCP gene region, mutations linked to HCC included, T1768A (22.8%, 29/127; 95% CI: 15.9–31.1%; FDR-adjusted p < 0.01) in genotype A, along with T1753C (13.3%, 22/165; 95% CI: 8.5–19.5%; FDR-adjusted p > 0.05), G1757A (17.6%, 29/165; 95% CI: 12.1–24.3%; FDR-adjusted p < 0.001), A1762T (29.1%, 48/165; 95% CI: 22.3–36.7%; FDR-adjusted p > 0.05), G1764A (46.1%, 76/165; 95% CI: 38.3 - 54.0%; FDR-adjusted p > 0.05), A1762T/G1764A (29.1%, 48/165; 95% CI: 22.3 - 36.7%; FDR-adjusted p > 0.05), C1766T (18.2%, 30/165; 95% CI: 12.6–24.9%; FDR-adjusted p < 0.01), C1773T (80.0%, 132/165; 95% CI: 73.1–85.8%; FDR-adjusted p < 0.001), and C1799G (77.0%, 127/165; 95% CI: 69.8–83.2%; FDR-adjusted p < 0.001) of all isolates, Table 4. The G1757A mutation was prevalent in genotypes D and E, while C1766T, T1768A, C1773T, and C1799G were more common in genotype A (FDR-adjusted p < 0.01; Table 4). Further HCC-linked mutations were detected in the precore gene region, including G1896A in 17.6% (29/165, 95% CI: 12.1 to 24.3%; FDR-adjusted p < 0.001) and G1899A in 17.0% (28/165, 95% CI: 11.6 to 23.6%; FDR-adjusted p < 0.05) of all isolates. The G1896A mutation was more common in genotypes D (81.3%, 26/32; 95% CI: 63.6–92.8%) and E (50.0%, 3/6; 95% CI: 11.8–88.2) (FDR-adjusted p < 0.001), whereas G1899A was common across genotypes (FDR-adjusted p < 0.05; Table 4).
Additionally, HCC-linked mutations in the core gene region, included T2121G (2.4%, 4/165; 95% CI: 0.7–6.1%; FDR-adjusted p > 0.05), A2159G (1.8%, 3/165; 95% CI: 0.4–5.2%; FDR-adjusted p < 0.05), A2189C (2.4%, 4/165; 95% CI: 0.7–6.1%; FDR-adjusted p > 0.05), G2203A (1.8%, 3/165; 95% CI: 0.4–5.2%; FDR-adjusted p > 0.05), and C2289A (3.0%, 5/165; 95% CI: 1.0–6.9%; FDR-adjusted p > 0.05) of all isolates, while those which are associated with chronic disease included A2092T (10.3%, 17/165; 95% CI: 6.1–16.0%), G2129C (19.4%, 32/165; 95% CI: 13.7–26.3%), and G2138A (1.2%, 2/165; 95% CI: 0.1–4.3%) (Table 4). Lastly, in the X gene region, mutations associated with CHB and LC included T1449C (80.0%, 132/165; 95% CI: 73.1–85.8%; FDR-adjusted p < 0.001), T1464C (1.2%, 2/165; 95% CI: 0.1–4.3%; FDR-adjusted p > 0.05), C1509T (0.6% 1/165; 95% CI: 0.02–3.3%; FDR-adjusted p > 0.05), C1678T (1.8%, 3/165; 95% CI: 0.4–5.2%; FDR-adjusted p > 0.05), and A1762T (29.1%, 48/165; 95% CI: 22.3–36.7%; FDR-adjusted p > 0.05) of all isolates, while those reported to be associated with HCC, CHB, and LC included T1768A (22.8%, 29/127; 95% CI: 15.9–31.1%; FDR-adjusted p < 0.05; genotype A), along with A1479T (7.9%,13/165; 95% CI: 4.3–13.1%) and C1653T (9.1%, 15/165; 95% CI: 5.2–14.6%) (FDR-adjusted p-value > 0.05) of all isolates. The T1449C mutation was more prevalent in genotype A (98.4%, 125/127; 95% CI: 94.4–99.8; FDR-adjusted p <0.001) than other genotypes (Table 5).
4. Discussion
Full-genome characterization of HBV is clinically relevant since it provides deep insights into the virus’s genetic variation, which may impact disease progression, treatment options, transmission, diagnostics, and infection outcomes [20,44,45]. In the present study, we analyzed 165 HBV DNA genome sequences from HBsAg-positive serum samples obtained from voluntary blood donations between 2019 and 2023 across different geographic regions of Kenya. Our analysis revealed that HBV genotype A predominated (77.0%) in Kenya during the study period, followed by genotypes D (19.4%) and E (3.6%). This finding aligns with previously published data from Kenya and other regions of Africa [2,4,16,17,18,46,47,48,49,50]. HBV genotypes A, D, and E have been reported to commonly circulate in Africa, with genotype A predominating in southern and eastern Africa, genotype D in northern Africa, and genotype E widespread from western Africa to Namibia and eastward to the Central African Republic and the Democratic Republic of Congo (DRC) [15,46,51]. Phylogenetic clustering revealed that the majority (99.0%) of genotype A isolates belonged to subgenotype A1, while a minority (1.0%) belonged to A2. This result corroborates findings from previous studies [2,4]. Subgenotype A1 viruses are prevalent in Eastern and Southern Africa, including Kenya, Uganda, Tanzania, Somalia, the DRC, Malawi, and South Africa [15,46]. Subgenotype A2 viruses have previously been detected in Kenya [50] but are reported to mainly circulate in Botswana, South Africa, Europe, and Brazil [15,46,52]. Among genotype D isolates, subgenotype D7 was the most common (97.0%), while subgenotype D1 represented a minority (3.0%). This result both mirrors and contrasts with previous findings that reported the circulation of subgenotypes D1, D3, D4, and D6 in Kenya [4,18]. Subgenotype D7 virus was first detected in Tunisia in 2009 [51]. Overall, genotype D viruses have a wider global distribution, with subgenotypes D1 and D7 being most prevalent in Northern Africa [15,46,51,53].
Burgeoning evidence suggests that HBV genotypes and subgenotypes are associated with distinct geographic distributions, transmission routes, disease progression, response to therapy, and clinical outcomes [46,51,54]. A high proportion (96.4%) of HBV isolates analyzed here belonged to genotypes A and D, which are transmitted mainly via horizontal routes [13,51]. This result aligns with findings by Ochwoto et al. (2026) [19], who reported transmission within households, exposure to infected persons through sharing of sharp objects like razors, unsafe sex, among others; unsafe drug injectables; and traditional and cultural practices, including circumcision, as key contributors to HBV transmission in Kenya. Transmission through blood and blood products is still believed to occur in some areas of sub-Saharan Africa [15]. HBV genotypes A (subgenotype A1) and D are associated with a higher risk of chronic disease than other genotypes [4,13]. Likewise, patients infected with genotype D have a higher risk of severe outcomes (e.g., hepatocellular carcinoma (HCC) and liver cirrhosis (LC)) than those with genotype A [13,46]; however, genotype A viruses are more responsive to interferon therapy [55,56]. In addition to being associated with HCC development at a much younger age, HBV subgenotype A1 infection is also characterized by early HBeAg seroconversion [51]. The risk of HBV vertical transmission is higher in HBeAg-positive mothers than in their HBeAg-negative counterparts [51]. Regarding infection frequencies by gender, infections were slightly more common in males than females. This finding is consistent with other studies [19,57]. This may be attributable to a stronger immune response in females than in males [19].
Recombination analysis revealed that 4.2% of HBV isolates were recombinant viruses, including 2.4% of genotype A and 12.5% of genotype D, involving inter-genotype A/D, A/E, D/A, and D/E recombination events. Recombination breakpoints were within the P, S, X, and preC/C genes. This result is not surprising, as previous findings have reported inter-genotype recombinants in Kenya (D/E recombinants) and in other African countries [4,15,58,59,60]. In agreement, the detected recombination breakpoints are consistent with those previously reported [13,14,61]. Recombination events, which occur as a result of co-infection or infection by a recombinant strain, may trigger greater virulence, thereby exacerbating patients’ clinical status [13,14,62]. Mutational analysis of the RT region did not reveal any nucleos(t)ide analogue (NA) resistance (NAr) mutations among the isolates, contrasting with previous findings in Kenya [16,63,64,65] but echoing those of similar studies reported elsewhere [10,22,40,66,67]. The failure to detect antiviral drug resistance mutations among the study participants suggests that, by virtue of being treatment-naïve, with no selection pressure from NAs that would confer NAr, transmission of HBV drug-resistant variants is uncommon in Kenya [9,68].
Subsequently, none of the HBV isolates harbored an 18-bp preS1 deletion mutation, which is believed to result from long-term HBV infection and is associated with a high risk of HCC [69]. Conversely, A60V/E and N38K mutations were significantly more frequent among genotype A and D isolates, respectively [9]. The V184A mutation in the S gene, also associated with a higher risk for HCC, was significantly more common in genotype E isolates, and 126T was ubiquitous across all isolates. These mutations have been reported in studies from Bangladesh and Vietnam, and V184A has also been reported in Kenya [2,9,13]. Generally, mutations in the preS/S gene have been reported to increase the risk of HCC development by instigating synthesis of truncated large-surface proteins which accumulate over time in the endoplasmic reticulum of hepatocytes, activating multiple oncogenic pathways [70]. Analysis of the S gene “a” determinant region within the MHR revealed the presence of K122N/R mutation in all genotype D isolates; T131N and 134F in more than 90% of genotype A isolates; and P127H/L in more than 83% of genotype E isolates. Additionally, all genotype A isolates harbored a 114T mutation in the MHR region. The amino acid variations K122N/R, T131N, and 134F have been associated with immune escape; P127H/L and 114T are linked to occult HBV infection [9,13,71]. Amino acid variations within and outside the “a” determinant can cause conformational changes or introduce N-glycosylation in the S protein, altering antigenic properties of HBsAg. Consequently, this may lead to escape of vaccine-induced immunity, false-negative results when using anti-HBs commercial diagnostic kits that target HBsAg during screening, and evasion of anti-HBV immunoglobulin treatment [13,70,71,72]. HBsAg escape mutants harboring mutations in the MHR have been reported globally, including in Kenya [2,73,74]. These mutants are prevalent in areas with HBV endemicity and in those with universal immunization programs [75].
In the BCP region, HCC-linked mutations were correspondingly widespread among the isolates. These included G1757A in 81.3% of genotype D isolates and 50% of genotype E isolates; C1766T in 22.8% of genotype A isolates and 16.7% of genotype E isolates; T1768A in 22.8% of genotype A isolates; C1799G and C1773T in more than 98% of genotype A isolates; and the double mutation A1762T/G1764A in 29.1% of all isolates. Similarly, in the precore/core regions, the HCC-linked mutations G1896A and G1899A were common among the isolates. Previous studies have reported A1762T, G1764A, and G1896A mutations in the BCP/PC region of HBV in Kenya [18]. Mutations in the BCP and precore/core regions have been shown to affect HBeAg expression; loss of HBeAg leads to evasion of immune clearance, thereby increasing the risk of liver disease [40,76,77]. The isolates also carried mutations in the X-gene reported to suppress HBeAg synthesis, increasing the risk of liver damage. These included T1449C, T1464C, A1479T, C1509T, C1653T, C1678T, A1752C, A1762T, and T1768A [40,78]. All of these X-gene mutations were found among genotype A isolates, with frequencies ranging from 0.6% to 97.5%, and T1449C was the most prevalent.
The study had some shortcomings. The failure to include viral load and biochemical liver function assays hindered the evaluation of the clinical and pathological importance of the detected mutations, as well as their potential influence on infectivity and disease progression. Despite these limitations, the study’s contribution of 165 HBV full-genome sequences to GenBank - which previously had only 25 genomes from Kenya is a great effort. Additionally, the study has affirmed that HBV genotype A predominates in Kenya, followed by genotypes D and E. Within genotype A, subgenotype A1 predominates, while A2 is a minority. Among genotype D, subgenotype D7 is more prevalent than D1. The study has also highlighted the circulation of HBV variants carrying genetic markers associated with immune escape, occult hepatitis B infection (OBI), and a higher risk of liver disease complications in the country. As a public health countermeasure, infant immunization and the scaling up of adult vaccination are needed to reduce infections. Furthermore, wider integration of molecular real-time PCR testing into the national blood screening algorithm is advised to diminish the risk of horizontal transmission from asymptomatic HBV blood donors harboring occult HBV infection mutations to ensure the safety of blood and blood products.
Supplementary Materials
The following supporting information can be downloaded at the website of this paper posted on Preprints.org.
Acknowledgments
The authors thank the Kenya National Blood Transfusion Service (KNBTS) in Nairobi for granting access to HBsAg-positive serum samples from voluntary blood donors for use in the study.
Author Contributions
Conceptualization of the study: S. Opanda, W. Bulimo, G. Gachara, F. Wamunyokoli. Supervision: W. Bulimo, F. Wamunyokoli, G. Gachara. Genome sequencing: S. Opanda. Methodology: S. Opanda, E. Kitangala, M. Wakwabubi, T. Mwasia, K. Muchui. Data analysis: S. Opanda, W. Bulimo, G. Gachara. Draft manuscript preparation: S. Opanda. Manuscript review and editing: W. Bulimo, G. Gachara, F. Wamunyokoli, M. Wakwabubi.:.
Funding
The authors funded this study.
Availability of data and materials
All HBV genomes reported in this work have been deposited in the GenBank database under the accession numbers: PZ495688 to PZ495886.
Competing interests
The authors declare no competing interests.
References
- Lago, B.V.; et al. Genetic diversity of the hepatitis B virus subgenotypes in Brazil. Viruses 2019, 11(9), 860. [Google Scholar] [CrossRef] [PubMed]
- Langat, B.K.; et al. Genetic diversity, haplotype analysis, and prevalence of Hepatitis B virus MHR mutations among isolates from Kenyan blood donors. PLoS ONE 2023, 18(11), e0291378. [Google Scholar] [CrossRef] [PubMed]
- Jayalakshmi, M.; Kalyanaraman, N.; Pitchappan, R. Hepatitis B virus genetic diversity: disease pathogenesis. Viral Replication 2013, 69–82. [Google Scholar]
- Downs, L.O.; et al. A systematic review of hepatitis B virus (HBV) prevalence and Genotypes in Kenya: data to inform clinical care and health policy. PLoS Glob. Public Health 2023. 3, 1, e0001165. [Google Scholar]
- Ajuwon, B.I.; et al. Hepatitis B virus infection in Nigeria: a systematic review and meta-analysis of data published between 2010 and 2019. BMC Infect. Dis. 2021, 21, 1–15. [Google Scholar] [CrossRef] [PubMed]
- Tshiabuila, D.; et al. An oxford nanopore technology-based Hepatitis B virus sequencing protocol suitable for genomic surveillance within clinical diagnostic settings. Int. J. Mol. Sci. 2024, 25(21), 11702. [Google Scholar] [CrossRef] [PubMed]
- Sedohara, A.; et al. Characterization of mutations in hepatitis B virus DNA isolated from Japanese HBsAg-positive blood donors in 2021 and 2022: Sedohara et al. Arch. Virol. 2024, 169(5), 103. [Google Scholar] [CrossRef] [PubMed]
- He, C.; et al. Evaluation of genotype characteristics and drug resistance mutations in patients with chronic hepatitis B. Sci. Rep. 2024, 14(1), 27575. [Google Scholar] [CrossRef] [PubMed]
- Thi Ton Taht Bui, T.T.T.B.; et al. Molecular characterization of hepatitis B virus in Vietnam. 2017.
- Mlewa, M.; et al. The pattern change of hepatitis B virus genetic diversity in Northwestern Tanzania. Sci. Rep. 2025, 15(1), 8021. [Google Scholar] [CrossRef] [PubMed]
- McNaughton, A.L.; et al. Analysis of genomic-length HBV sequences to determine genotype and subgenotype reference sequences. J. General. Virol. 2020, 101(3), 271–283. [Google Scholar] [CrossRef] [PubMed]
- do Lago, B.V.; et al. Genetic diversity of hepatitis B virus quasispecies in different biological compartments reveals distinct genotypes. Sci. Rep. 2023, 13(1), 17023. [Google Scholar] [CrossRef] [PubMed]
- Munshi, S.U.; et al. Molecular characterization of hepatitis B virus in Bangladesh reveals a highly recombinant population. PLoS ONE 2017, 12(12), e0188944. [Google Scholar] [CrossRef] [PubMed]
- Tshiabuila, D.; et al. Conserved recombination patterns across hepatitis B genotypes: a retrospective study. Virol. J. 2025, 22(1), 220. [Google Scholar] [CrossRef] [PubMed]
- Zampino, R.; et al. Hepatitis B virus burden in developing countries. World J. Gastroenterol. 2015, 21(42), 11941. [Google Scholar] [CrossRef] [PubMed]
- Aluora, P.O.; Muturi, M.W.; Gachara, G. Seroprevalence and genotypic characterization of HBV among low risk voluntary blood donors in Nairobi, Kenya. Virol. J. 2020, 17, 1–9. [Google Scholar] [CrossRef] [PubMed]
- Kwange, S.O.; et al. Hepatitis B virus subgenotype A1, occurrence of subgenotype D4, and S gene mutations among voluntary blood donors in Kenya. Virus Genes 2013, 47(3), 448–455. [Google Scholar] [CrossRef] [PubMed]
- Ochwoto, M.; et al. Genotyping and molecular characterization of hepatitis B virus in liver disease patients in Kenya. Infect. Genet. Evol. 2013, 20, 103–110. [Google Scholar] [CrossRef] [PubMed]
- Ochwoto, M.; et al. Predictors and Trends of Hepatitis B Virus Transmissions in Selected Regions of Kenya. LabMed 2026, 3(1), 5. [Google Scholar] [CrossRef]
- Chotiyaputta, W.; Lok, A.S. Hepatitis B virus variants. Nat. Rev. Gastroenterol. Hepatol. 2009, 6(8), 453–462. [Google Scholar] [CrossRef] [PubMed]
- Rodríguez Lay, L.A.; et al. Genetic diversity of the hepatitis B virus strains in Cuba: absence of West-African genotypes despite the Transatlantic Slave Trade. PLoS ONE 2015, 10(5), e0125052. [Google Scholar] [CrossRef] [PubMed]
- Cremer, J.; et al. Characterization of Hepatitis B virus based complete genome analysis improves molecular surveillance and enables identification of a recombinant C/D strain in the Netherlands. Heliyon 2023, 9(11). [Google Scholar] [CrossRef] [PubMed]
- McNaughton, A.L.; et al. Insights from deep sequencing of the HBV genome—unique, tiny, and misunderstood. Gastroenterology 2019, 156(2), 384–399. [Google Scholar] [CrossRef] [PubMed]
- Weinberger, K.M.; et al. Sensitive and accurate quantitation of hepatitis B virus DNA using a kinetic fluorescence detection system (TaqMan PCR). J. Virol. Methods 2000, 85(1-2), 75–82. [Google Scholar] [CrossRef] [PubMed]
- Chook, J.B.; et al. Universal primers for detection and sequencing of hepatitis B virus genomes across genotypes A to G. J. Clin. Microbiol. 2015, 53(6), 1831–1835. [Google Scholar] [CrossRef] [PubMed]
- Bittencourt, S. FastQC: A quality control tool for high throughput sequence data. Babraham Bioinform. 2010. [Google Scholar] [CrossRef] [PubMed]
- Bonenfant, Q.; Noé, L.; Touzet, H. Porechop_ABI: discovering unknown adapters in Oxford Nanopore Technology sequencing reads for downstream trimming. Bioinform. Adv. 2023, 3(1), vbac085. [Google Scholar] [CrossRef] [PubMed]
- De Coster, W.; Rademakers, R. NanoPack2: population-scale evaluation of long-read sequencing data. Bioinformatics 2023, 39(5), btad311. [Google Scholar] [CrossRef] [PubMed]
- Koren, S.; et al. Canu: scalable and accurate long-read assembly via adaptive k-mer weighting and repeat separation. Genome Res. 2017, 27(5), 722–736. [Google Scholar] [CrossRef] [PubMed]
- Li, H. New strategies to improve minimap2 alignment accuracy. Bioinformatics 2021, 37(23), 4572–4574. [Google Scholar] [CrossRef] [PubMed]
- Danecek, P.; et al. Twelve years of SAMtools and BCFtools. Gigascience 2021, 10(2), giab008. [Google Scholar] [CrossRef] [PubMed]
- Altschul, S.F.; et al. Basic local alignment search tool. J. Mol. Biol. 1990, 215(3), 403–410. [Google Scholar] [CrossRef]
- Wright, C.; Wykes, M. Medaka: sequence correction provided by ONT research. Medaka: sequence correction provided by ONT research. 2023. [Google Scholar] [PubMed]
- Katoh, K.; Standley, D.M. MAFFT multiple sequence alignment software version 7: improvements in performance and usability. Mol. Biol. Evol. 2013, 30(4), 772–780. [Google Scholar] [CrossRef] [PubMed]
- Kalyaanamoorthy, S.; et al. ModelFinder: fast model selection for accurate phylogenetic estimates. Nat. Methods 2017, 14(6), 587–589. [Google Scholar] [CrossRef] [PubMed]
- Yu, G.; et al. ggtree: an R package for visualization and annotation of phylogenetic trees with their covariates and other associated data. Methods Ecol. Evol. 2017, 8(1), 28–36. [Google Scholar] [CrossRef]
- Martin, D.P.; et al. RDP5: a computer program for analyzing recombination in, and removing signals of recombination from, nucleotide sequence datasets. Virus Evol. 2021, 7(1), veaa087. [Google Scholar] [CrossRef] [PubMed]
- Liu, B.-M.; et al. Characterization of potential antiviral resistance mutations in hepatitis B virus reverse transcriptase sequences in treatment-naive Chinese patients. Antivir. Res. 2010, 85(3), 512–519. [Google Scholar] [CrossRef] [PubMed]
- Belaiba, Z.; et al. Whole genome analysis of hepatitis B virus before and during long-term therapy in chronic infected patients: Molecular characterization, impact on treatment and liver disease progression. Front. Microbiol. 2022, 13, 1020147. [Google Scholar] [CrossRef] [PubMed]
- Mamoori, Y.I.; et al. Full-Length Genome Sequencing and Analysis of Hepatitis B Viruses Isolated from Iraqi Patients. Int. J. Microbiol. 2024, 2024(1), 6826495. [Google Scholar] [CrossRef] [PubMed]
- Team, R.C. RA language and environment for statistical computing, R Foundation for Statistical. Computing 2020. [Google Scholar] [CrossRef]
- Clopper, C.J.; Pearson, E.S. The use of confidence or fiducial limits illustrated in the case of the binomial. Biometrika 1934, 26(4), 404–413. [Google Scholar] [CrossRef]
- Ge, Y.; Sealfon, S.C.; Speed, T.P. Some step-down procedures controlling the false discovery rate under dependence. Stat. Sin. 2008, 18(3), 881. [Google Scholar] [PubMed]
- Tanwar, S.; Dusheiko, G. Is there any value to hepatitis B virus genotype analysis? Curr. Gastroenterol. Rep. 2012, 14(1), 37–46. [Google Scholar] [CrossRef] [PubMed]
- Sunbul, M. Hepatitis B virus genotypes: global distribution and clinical importance. World J. Gastroenterol. WJG 2014, 20(18), 5427. [Google Scholar] [CrossRef] [PubMed]
- HUDU, S.A. An Insight into the Epidemiology and Genetic Diversity of Hepatitis B Virus in Africa Hepatit B Virusunun Afrika’daki Epidemiyolojisine ve Genetik Çeşitliliğine Bakış. [PubMed]
- Liu, Z.; et al. Distribution of hepatitis B virus genotypes and subgenotypes: A meta-analysis. Medicine 2021, 100(50), e27941. [Google Scholar] [CrossRef] [PubMed]
- Kurbanov, F.; Tanaka, Y.; Mizokami, M. Geographical and genetic diversity of the human hepatitis B virus. Hepatol. Res. 2010, 40(1), 14–30. [Google Scholar] [CrossRef] [PubMed]
- Ochieng’Kasera, G.; et al. Prevalence and genetic diversity of hav and hbv viruses among jaundice patients at coast general hospital, mombasa county, kenya. Malays. J. Med. Sci. MJMS 2021, 28(3), 56. [Google Scholar] [CrossRef] [PubMed]
- Mwangi, J.; et al. Molecular genetic diversity of hepatitis B virus in Kenya. Intervirology 2009, 51(6), 417–421. [Google Scholar] [CrossRef] [PubMed]
- Chen, J.; et al. A review of epidemiology and clinical relevance of Hepatitis B virus genotypes and subgenotypes. Clin. Res. Hepatol. Gastroenterol. 2023, 47(7), 102180. [Google Scholar] [CrossRef] [PubMed]
- Matthews, P.C.; et al. Prevalence and characteristics of hepatitis B virus (HBV) coinfection among HIV-positive women in South Africa and Botswana. PLoS ONE 2015, 10(7), e0134037. [Google Scholar] [CrossRef] [PubMed]
- Hundie, G.B.; et al. A novel hepatitis B virus subgenotype D10 circulating in Ethiopia. J. Viral Hepat. 2017, 24(2), 163–173. [Google Scholar] [CrossRef] [PubMed]
- Cooksley, W. Do we need to determine viral genotype in treating chronic hepatitis B? J. Viral Hepat. 2010, 17(9), 601–610. [Google Scholar] [CrossRef] [PubMed]
- Seo, Y.; Yano, Y. Short-and long-term outcome of interferon therapy for chronic hepatitis B infection. World J. Gastroenterol. WJG 2014, 20(37), 13284. [Google Scholar] [CrossRef] [PubMed]
- Majid Mahmood, M.M.; et al. Distribution and clinical significance of hepatitis B virus genotypes in Pakistan. 2016. [Google Scholar] [CrossRef] [PubMed]
- Kazmi, S.A.; et al. Hepatitis B among university population: Prevalence, associated risk factors, knowledge assessment, and treatment management. Viruses 2022, 14(9), 1936. [Google Scholar] [CrossRef] [PubMed]
- Kafeero, H.M.; et al. Mapping hepatitis B virus genotypes on the African continent from 1997 to 2021: a systematic review with meta-analysis. Sci. Rep. 2023, 13(1), 5723. [Google Scholar] [CrossRef] [PubMed]
- Tyler, B.; et al. Hepatitis B Virus Genotype E/A Recombinants from Blood Donors in Beira, Mozambique. Microbiol. Resour. Announc. 2023, 12(6), e00182–23. [Google Scholar] [CrossRef] [PubMed]
- Odallo, V.B.; et al. Molecular characterization of hepatitis B virus genotypes A and D among inmates and blood donors in Northeastern Kenya. PLoS ONE 2026, 21(2), e0336726. [Google Scholar] [CrossRef] [PubMed]
- Cento, V.; et al. Overlapping structure of hepatitis B virus (HBV) genome and immune selection pressure are critical forces modulating HBV evolution. J. General. Virol. 2013, 94(1), 143–149. [Google Scholar] [CrossRef] [PubMed]
- Gionda, P.O.; et al. Analysis of the complete genome of HBV genotypes F and H found in Brazil and Mexico using the next generation sequencing method. Ann. Hepatol. 2022, 27, 100569. [Google Scholar] [CrossRef] [PubMed]
- Ochieng’Kasera, G.; et al. Hepatitis B virus genetic heterogeneity and drug resistance among jaundiced patients at Coast General Teaching and Referral Hospital, Mombasa County, Kenya. Int. J. Health Sci. 2021, 15(3), 20. [Google Scholar]
- Onyango, B.W.; Miruka, D.O.; Musyoki, S.K. Hepatitis B virus prevalence and its genotypic association with drug resistance in HBV/HIV co-infected patients in Western Kenya: a cross-sectional study. PAMJ.-One Health 2024, 13(14). [Google Scholar] [CrossRef]
- Kim, H.N.; et al. HBV lamivudine resistance among hepatitis B and HIV coinfected patients starting lamivudine, stavudine and nevirapine in Kenya. J. Viral Hepat. 2011, 18(10), e447–e452. [Google Scholar] [CrossRef] [PubMed]
- Silva, C.; et al. Hepatitis B Virus Genotypes and Subgenotypes Circulating in Infected Residents in a Country with High Vaccination Rate. Viruses 2024, 16(6), 954. [Google Scholar] [CrossRef] [PubMed]
- Mathew, A.; et al. Hepatitis B virus genotypes and drug resistance mutations circulating in blood donors in Beira, Mozambique. PLoS ONE 2023, 18(2), e0281855. [Google Scholar] [CrossRef] [PubMed]
- Gomes-Gouvêa, M.S.; et al. HBV carrying drug-resistance mutations in chronically infected treatment-naive patients. Antivir. Ther. 2015, 20(4), 387–395. [Google Scholar] [CrossRef] [PubMed]
- Qu, L.-S.; et al. Association of hepatitis B virus pre-S deletions with the development of hepatocellular carcinoma in Qidong, China. PLoS ONE 2014, 9(5), e98257. [Google Scholar] [CrossRef] [PubMed]
- Thi Cam Huong, N.; et al. Mutations in the HBV PreS/S gene related to hepatocellular carcinoma in Vietnamese chronic HBV-infected patients. PLoS ONE 2022, 17(4), e0266134. [Google Scholar] [CrossRef] [PubMed]
- Wang, J.; et al. Hepatitis B virus preS/S gene mutations and their clinical implications. Ann. Blood 2017, 2(8). [Google Scholar] [CrossRef]
- Caligiuri, P.; et al. Overview of hepatitis B virus mutations and their implications in the management of infection. World J. Gastroenterol. 2016, 22(1), 145. [Google Scholar] [CrossRef] [PubMed]
- Nzou, S.M.; Irekwa, R.M. Identification and Characterization of Hepatitis B Virus Immune Escape Mutants in Kenya. Am. J. Mol. Biol. 2023, 13, 1–17. [Google Scholar]
- Perazzo, P.; et al. Hepatitis B virus (HBV) and s-escape mutants: From the beginning until now. 2015. [Google Scholar] [CrossRef]
- Lazarevic, I. Clinical implications of hepatitis B virus mutations: recent advances. World J. Gastroenterol. WJG 2014, 20(24), 7653. [Google Scholar] [CrossRef] [PubMed]
- Tseng, T.-C.; et al. Higher proportion of viral basal core promoter mutant increases the risk of liver cirrhosis in hepatitis B carriers. Gut 2015, 64(2), 292–302. [Google Scholar] [CrossRef] [PubMed]
- Rajput, M.K. Mutations and methods of analysis of mutations in Hepatitis B virus. AIMS Microbiol. 2020, 6(4), 401. [Google Scholar] [CrossRef] [PubMed]
- Kumar, R. Review on hepatitis B virus precore/core promoter mutations and their correlation with genotypes and liver disease severity. World J. Hepatol. 2022, 14(4), 708. [Google Scholar] [CrossRef] [PubMed]
Figure 1.
Maximum-likelihood phylogenetic tree showing the assignment of genome sequences analyzed in the study to various HBV genotypes. The tips of the tree are colour-coded by genotype assignment. The red-coloured tree branches indicate the HBV genotype reference strains retrieved from the GenBank database, while black branches show the study strains. The bootstrap numbers at the nodes represent statistical branch support values. The scale bar indicates the number of nucleotide substitutions per site.
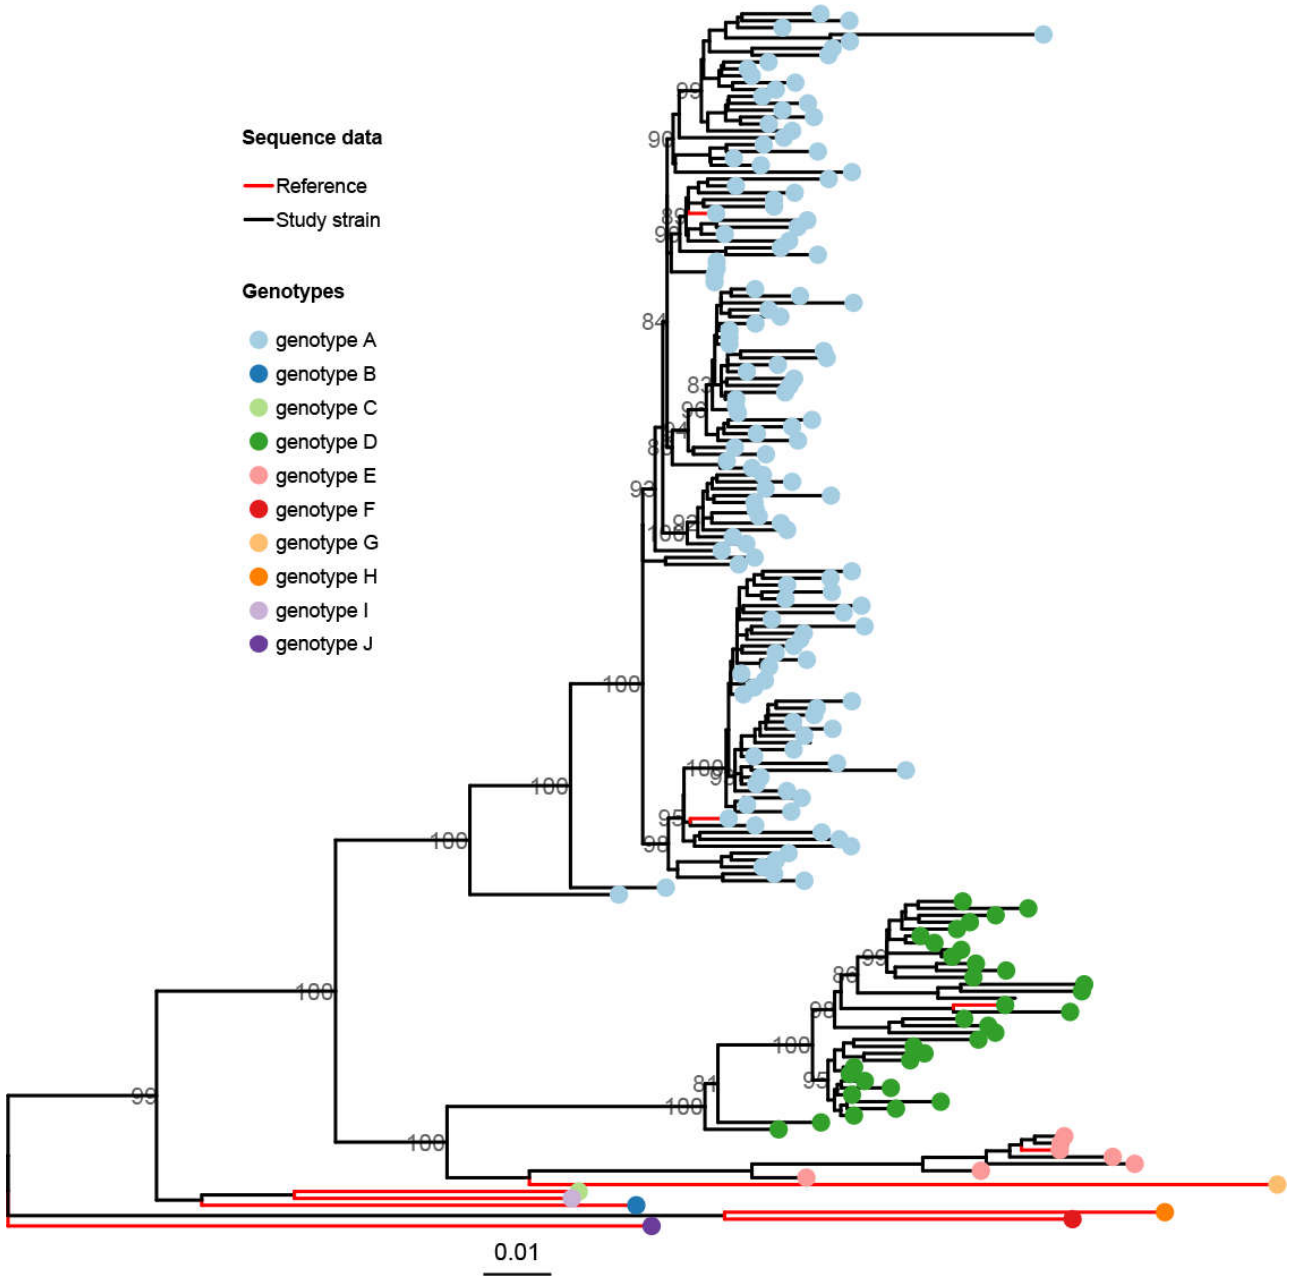
Figure 2.
Maximum-likelihood phylogenetic tree showing the assignment of the study’s HBV genotype A virus genome sequences into subgenotypes. The tips are colour-coded by subgenotype assignment. Red-coloured branches indicate HBV genotype A reference strains retrieved from the GenBank database, while black branches represent the study viruses. The bootstrap numbers at the nodes represent statistical branch support values. The scale bar indicates nucleotide substitutions per site.
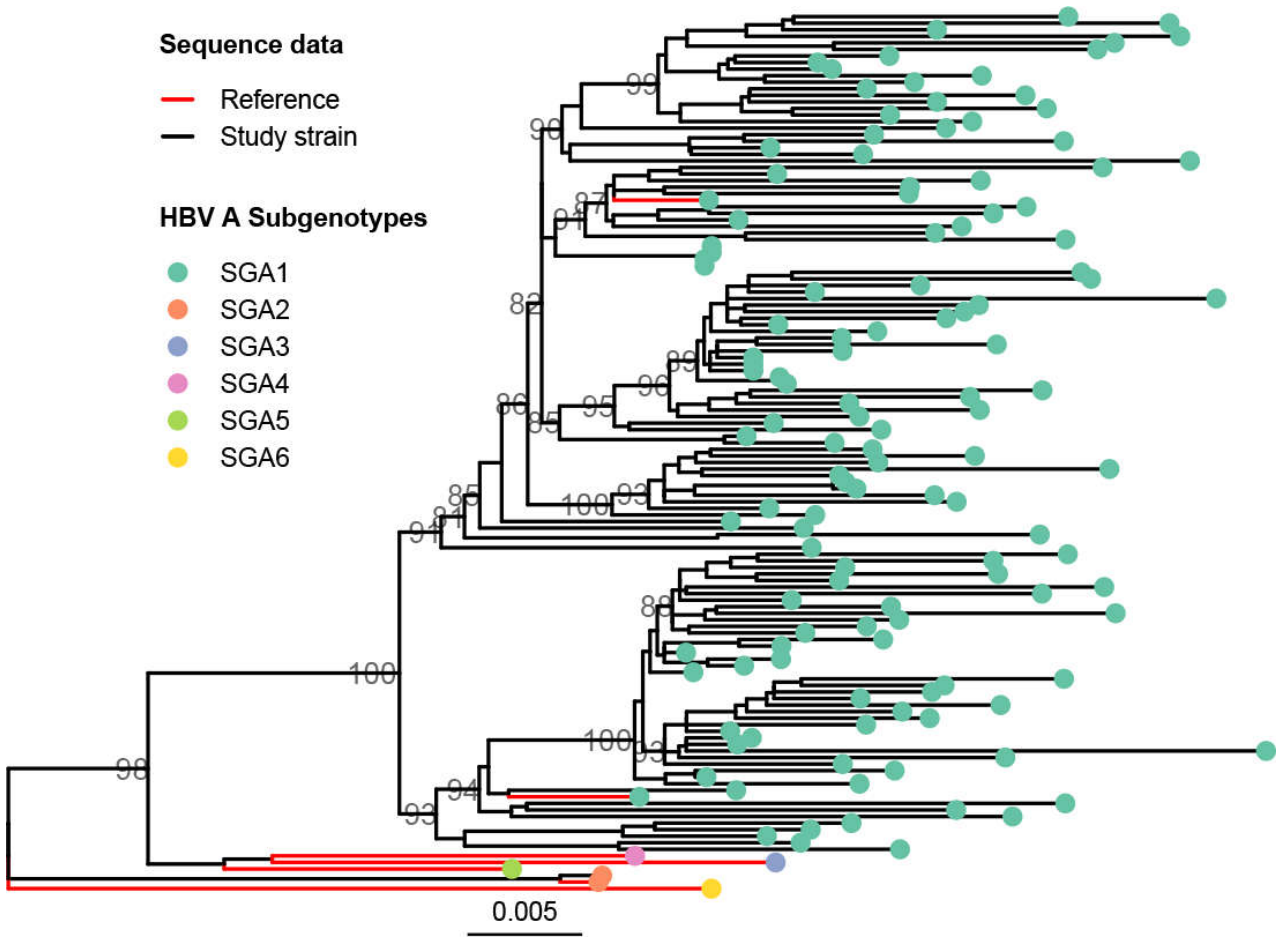
Figure 3.
Maximum-likelihood phylogenetic tree showing the assignment of the study’s HBV genotype D virus genome sequences into subgenotypes. The tips are colour-coded by subgenotype assignment. The red-coloured branches indicate the HBV genotype D reference strains retrieved from the GenBank database, while black branches illustrate the study viruses. The bootstrap numbers at the nodes represent statistical branch support values. The scale bar indicates nucleotide substitutions per site.
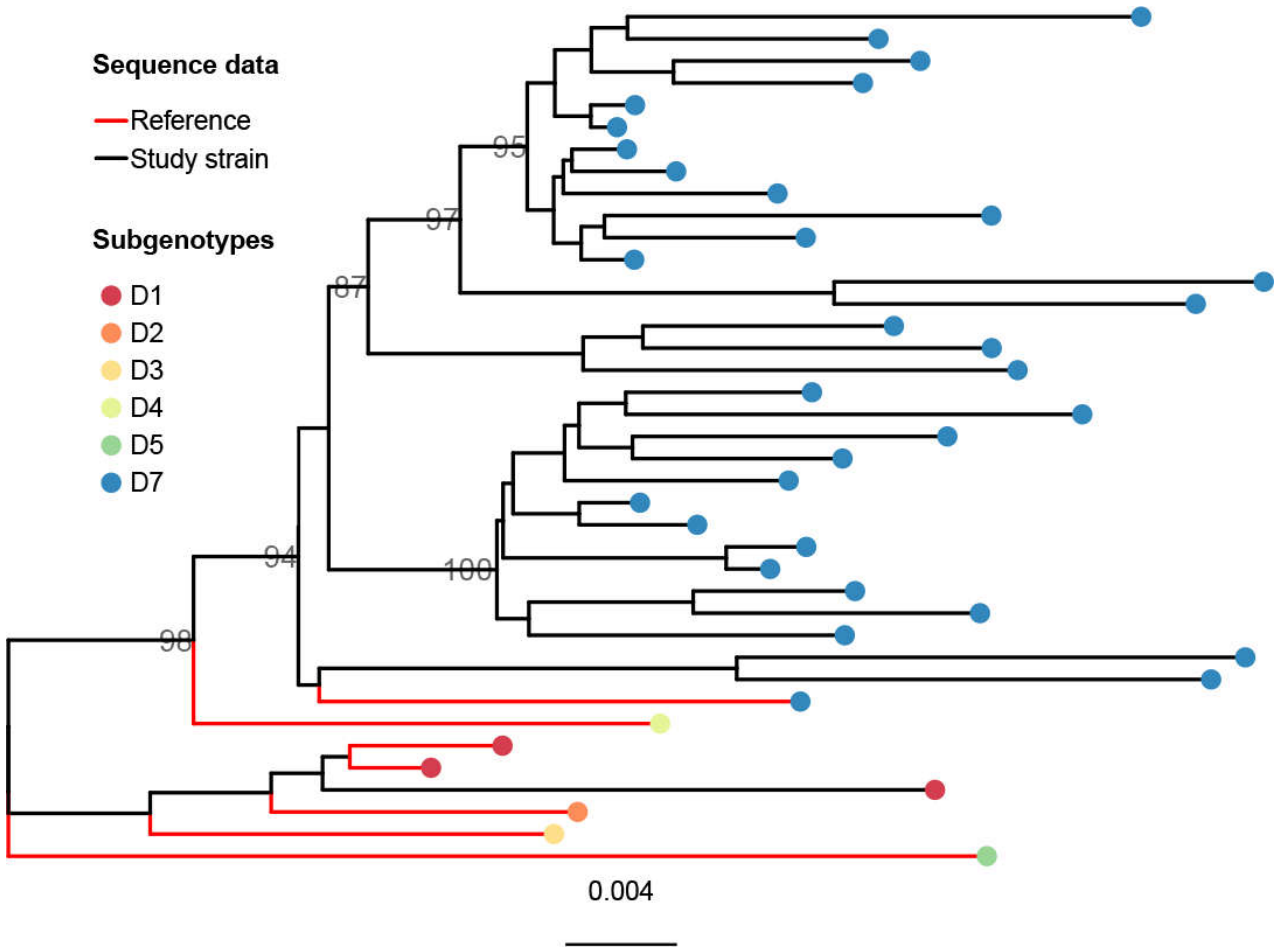
Figure 4.
Schematic illustration of the mosaic structure of the recombination events. Genotype D is presented in blue, genotype A in green, and genotype E in red. Part (A) displays recombinant events in genotype D, while Part (B) displays recombinant events in genotype A. Linear sketches of the HBV genotype D (part A) and A (part B) genomes are depicted, including the positions of various genes.
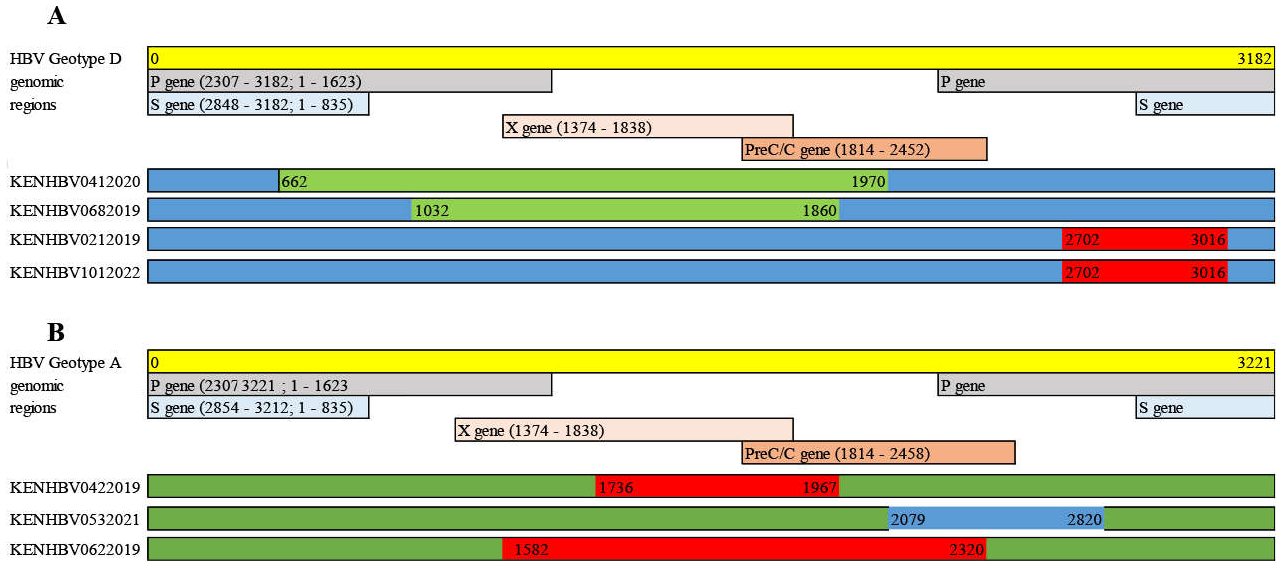

Table 1.
Characteristics of the study participants (n = 165) and genotype distributions ..
| Characteristics | n = 165 |
|---|---|
| Median age in years (range) | 28 (18 - 50) |
| Sex, n (%) | |
| Male | 58.8% (97/165), 95% CI: 50.9 - 66.4 |
| Female | 41.2% (68/165), 95% CI: 33.6 - 49.1 |
| Genotype, n (%) | |
| A | 77.0% (127/165), 95% CI: 69.8 - 83.2 |
| D | 19.4% (32/165), 95% CI: 13.6 - 26.3 |
| E | 3.6% (6/165), 95% CI: 1.3 - 7.7 |
Table 2.
Mutations in the HBV preS1/S2/S gene region reported related to HCC among the isolates.
| Variable | All N = 165 % [95% CI] |
Genotype A n = 127 % [95% CI] |
Genotype D n = 32 % [95% CI] |
Genotype E n = 6 % [95% CI] |
Raw p-value |
FDR-adjusted p-value |
Reference | ||
|---|---|---|---|---|---|---|---|---|---|
| Genome length (bp) | |||||||||
| 3221 | 3182 | 3212 | |||||||
| Gene | Mutation | ||||||||
| Nucleotide | Amino acid | ||||||||
| PreS1 gene | |||||||||
| C3026A/T | A60V/E | 75.8 (125/165) [68.5–82.1] | 98.4 (125/127) [94.4–99.8] | 0.0 (0/32) [0.0–10.9] | 0.0 (0/6) [0.0–45.9] | 0.000 | 0.000** | [9] | |
| C2964A | N38K | 19.4 (32/165) [13.7–26.3] | 0.0 (0/127) [0.0–2.9] | 100.0 (32/32) [89.1–100] | 0.0 (0/6) [0.0–45.9] | 0.000 | 0.000** | [9] | |
| PreS2 gene | |||||||||
| Start codon | M1V/T/I | 12.1 (20/165) [7.6–18.1] | 15.7 (20/127) [10.0–23.3] | 0.0 (0/32) [0.0–10.9] | 0.0 (0/6) [0.0–45.9] | 0.019 | 0.046* | [13] | |
| T53C | F22L | 24.8 (41/165) [18.5–32.2] | 26.0 (33/127) [18.6–34.5] | 18.8 (6/32) [7.2–36.4] | 33.3 (2/6) [4.3–77.7] | 0.581 | 0.634 | [13] | |
| C105T | A39V | 1.8 (3/165) [0.02–3.3] | 1.6 (2/127) [0.2–5.6] | 3.1 (1/32) [0.08–16.2] | 0.0 (0/6) [0.0–45.9] | 0.557 | 0.634 | [36] | |
| S gene | |||||||||
| G225A | R24K | 4.2 (7/165) [1.7–8.6] | 3.1 (4/127) [0.9–7.9] | 6.3 (2/32) [0.8–20.8] | 16.7 (1/6) [0.4–64.1] | 0.120 | 0.180 | [13,36] | |
| A706C | V184A | 3.6 (6/165) [1.3–7.7] | 0.8 (1/127) [0.02–4.3] | 0.0 (0/32) [0.0–10.9] | 83.3 (5/6) [35.9–99.6] | 0.000 | 0.000** | [9,13] | |
| T766A | S204R | 2.4 (4/165) [0.7–6.1] | 2.4 (3/127) [0.5–6.7] | 0.0 (0/32) [0.0–10.9] | 16.7 (1/6) [0.4–64.1] | 0.161 | 0.215 | [9,13] | |
| C339T | P62L | 0.6 (1/165) [0.01–3.3] | 0.8 (1/127) [0.02–4.3] | 0.0 (0/32) [0.0–10.9] | 0.0 (0/6) [0.0–45.9] | 1.000 | 1.000 | [13] | |
| T531C | 126T | 99.4 (164/165) [96.7–100] | 100.0 (127/127) [97.1–100] | 100.0 (32/32) [89.1–100] | 83.3 (5/6) [35.9–99.6] | 0.039 | 0.078 | [13,65] | |
| T657C | A168V | 77.0 (127/165) [69.8–83.2] | 99.2 (126/127) [95.7–100] | 0.0 (0/32) [0.0–10.9] | 16.7 (1/6) [0.4–64.1] | 0.000 | 0.000** | [13] | |
** = < 0.001, * = <0.05.
Table 3.
Mutations in the HBV S gene related to immune escape and occult HBV infection (OBI) among the isolates.
Table 3.
Mutations in the HBV S gene related to immune escape and occult HBV infection (OBI) among the isolates.
| Variable | All, N = 165 % [95% CI] |
Genotype A, n = 127 % [95% CI] |
Genotype D, n = 32 % [95% CI] |
Genotype E, n = 6 % [95% CI] |
Clinical effect |
Raw p-value |
FDR-adjusted p-value |
Reference |
|---|---|---|---|---|---|---|---|---|
|
Genome length (base pairs) |
3221 | 3182 | 3212 | |||||
| Mutation | ||||||||
| V96A | 0.6 (1/165) [0.02–3.3] | 0.0 (0/127) [0.0–2.9] | 3.1 (1/32) [0.08–16.2] | 0.0 (0/6) [0.0–45.9] | VEM | 0.123 | 0.287 | [65] |
| T126A/Sab | 0.6 (1/165) [0.02–3.3] | 0.0 (0/127) [0.0–2.9] | 0.0 (0/32) [0.0–10.9] | 16.7 (1/6) [0.4–64.1] | VEM | 0.033 | 0.116 | [65] |
| K122N/Ra | 28.5 (47/165) [21.7–36.0] | 11.8 (15/127) [6.8–18.7] | 100.0 (32/32) [89.1–100] | 0.0 (0/6) [0.0–45.9] | VEM | 0.000 | 0.000** | [7] |
| M133Tab | 2.4 (4/165) [0.7–6.1] | 2.4 (3/127) [0.5–6.7] | 3.1 (1/32) [0.08–16.2] | 0.0 (0/6) [0.0–45.9] | VEM/OBI | 1.000 | 1.000 | [65] |
| G130N/Rab | 0.6 (1/165) [0.02–3.3] | 0.0 (0/127) [0.0–2.9] | 3.1 (1/32) [0.08–16.2] | 0.0 (0/6) [0.0–45.9] | VEM | 0.231 | 0.485 | [65] |
| P127H/Lab | 3.6 (6/165) [1.3–7.7] | 0.8 (1/127) [0.02–4.3] | 0.0 (0/32) [0.0–10.9] | 83.3 (5/6) [35.9–99.6] | VEM/OBI | 0.000 | 0.000** | [65] |
| Q129R/Hab | 1.8 (3/165) [0.4–5.2] | 1.6 (2/127) [0.2–5.6] | 3.1 (1/32) [0.08–16.2] | 0.0 (0/6) [0.0–45.9] | VEM/OBI | 0.547 | 0.884 | [65] |
| T131Nab | 76.3 (126/165) [69.1–82.6] | 99.2 (126/127) [95.7–100] | 0.0 (0/32) [0.0–10.9] | 0.0 (0/6) [0.0–45.9] | VEM | 0.000 | 0.000** | [65] |
| M198I | 0.6 (1/165) [0.02–3.3] | 0.8 (1/127) [0.02–4.3] | 0.0 (0/32) [0.0–10.9] | 0.0 (0/6) [0.0–45.9] | VEM | 0.114 | 0.287 | [65] |
| M103Ia | 1.8 (3/165) [0.4–5.2] | 1.6 (2/127) [0.2–5.6] | 0.0 (0/32) [0.0–10.9] | 16.7 (1/6) [0.4–64.1] | VEM | 0.113 | 0.287 | [65] |
| L175S | 1.2 (2/165) [0.1–4.3] | 0.8 (1/127) [0.02–4.3] | 3.1 (1/32) [0.08–16.2] | 0.0 (0/6) [0.0–45.9] | VEM | 0.408 | 0.719 | [65] |
| I68V | 0.6 (1/165) [0.02–3.3] | 0.8 (1/127) [0.02–4.3] | 0.0 (0/32) [0.0–10.9] | 0.0 (0/6) [0.0–45.9] | VEM | 1.000 | 1.000 | [65] |
| V190A | 2.4 (4/165) [0.7–6.1] | 3.1 (4/127) [0.9–7.9] | 0.0 (0/32) [0.0–10.9] | 0.0 (0/6) [0.0–45.9] | VEM | 0.640 | 0.960 | [65] |
| 134Fab | 77.0 (127/165) [69.8–83.2] | 100.0 (127/127) [97.1–100] | 0.0 (0/32) [0.0–10.9] | 0.0 (0/6) [0.0–45.9] | VEM | 0.000 | 0.000** | [65] |
| S193L | 1.2 (2/165) [0.1–4.3] | 1.6 (2/127) [0.2–5.6] | 0.0 (0/32) [0.0–10.9] | 0.0 (0/6) [0.0–45.9] | VEM | 1.000 | 1.000 | [65] |
| Q101Ra | 0.6 (1/165) [0.02–3.3] | 0.8 (1/127) [0.02–4.3] | 0.0 (0/32) [0.0–10.9] | 0.0 (0/6) [0.0–45.9] | OBI | 1.000 | 1.000 | [65] |
| S167La | 1.2 (2/165) [0.1–4.3] | 1.6 (2/127) [0.2–5.6] | 0.0 (0/32) [0.0–10.9] | 0.0 (0/6) [0.0–45.9] | OBI | 1.000 | 1.000 | [65] |
| L94S | 0.6 (1/165) [0.02–3.3] | 0.8 (1/127) [0.02–4.3] | 0.0 (0/32) [0.0–10.9] | 0.0 (0/6) [0.0–45.9] | OBI | 1.000 | 1.000 | [65] |
| I110La | 1.2 (2/165) [0.1–4.3] | 0.8 (1/127) [0.02–4.3] | 3.1 (1/32) [0.8–16.2] | 0.0 (0/6) [0.0–45.9] | OBI | 0.411 | 0.719 | [65] |
| 114Ta | 77.0 (127/165) [69.8–83.2] | 100.0 (127/127) [97.1–100] | 0.0 (0/32) [0.0–10.9] | 0.0 (0/6) [0.0–45.9] | OBI | 0.000 | 0.000** | [65] |
| Y100Ca | 0.6 (1/165) [0.02–3.3] | 0.8 (1/127) [0.02–4.3] | 0.0 (0/32) [0.0–10.9] | 0.0 (0/6) [0.0–45.9] | OBI | 1.000 | 1.000 | [13] |
a MHR region (amino acid positions 99 to 169), b “a” determinant region (amino acid position 124 to 147), ** = < 0.001.
Table 4.
Mutations in the HBV BCP and PreC/C gene regions related to HCC and CHB among the isolates.
Table 4.
Mutations in the HBV BCP and PreC/C gene regions related to HCC and CHB among the isolates.
| Variable | All, N = 165 % [95% CI] |
Genotype A, n = 127 % [95% CI] |
Genotype D, n = 32 % [95% CI] |
Genotype E, n = 6 % [95% CI] |
Raw p-value |
FDR- adjusted p-value |
Reference |
|---|---|---|---|---|---|---|---|
| Genome length | . | ||||||
| (base pairs) | 3221 | 3182 | 3212 | ||||
| BCP region | |||||||
| T1753C1 | 13.3 (22/165) [8.5–19.5] | 11.8 (15/127) [6.8–18.7] | 21.9 (7/32) [9.3–40] | 0.0 (0/6) [0.0–45.9] | 0.244 | 0.375 | [9,13] |
| G1757A1 | 17.6 (29/165) [12.1–24.3] | 0.0 (0/127) [0.0–2.9] | 81.3 (26/32) [63.6–92.8] | 50.0 (3/6) [11.8–88.2] | 0.000 | 0.000*** | [9,13] |
| A1762T1 | 29.1 (48/165) [22.3–36.7] | 29.9 (38/127) [22.1–38.7] | 28.1 (9/32) [13.7–46.7] | 16.7 (1/6) [0.42–64.1] | 0.944 | 0.996 | [9,36] |
| G1764A1 | 46.1 (76/165) [38.3–54.0] | 49.6 (63/127) [40.6–58.6] | 37.5 (12/32) [21.1–56.3] | 16.7 (1/6) [0.42–64.1] | 0.169 | 0.292 | [9,13] |
| A1762T/G1764A1 | 29.1 (48/165) [22.3–36.7] | 29.9 (38/127) [22.1–38.7] | 28.1 (9/32) [13.7–46.7] | 16.7 (1/6) [0.42–64.1] | 0.944 | 0.996 | [9,13] |
| C1766T1 | 18.2 (30/165) [12.6–24.9] | 22.8 (29/127) [15.9–31.1] | 0.0 (0/32) [0.0–10.9] | 16. 7 (1/6) [0.42–64.1] | 0.003 | 0.009* | [36] |
| T1768A1 | 17.6 (29/165) [12.1–24.3] | 22.8 (29/127) [15.9–31.1] | 0.0 (0/32) [0.0–10.9] | 0.0 (0/6) [0.0–45.9] | 0.002 | 0.008** | [9,13,36] |
| C1773T1 | 80.0 (132/165) [73.1–85.8] | 99.2 (126/127) [95.7–100] | 15.6 (5/32) [5.3–32.8] | 16.7 (1/6) [0.42–64.1] | 0.000 | 0.000*** | [36] |
| C1799G1 | 77.0 (127/165) [69.8–83.2] | 100.0 (127/127) [97.1–100] | 0.0 (0/32) [0.0–10.9] | 0.0 (0/6) [0.0–45.9] | 0.000 | 0.000*** | [36] |
| PC/Core | |||||||
| G1896A1 | 17.6 (29/165) [12.1–24.3] | 0.0 (0/127) [0.0–2.9] | 81.3 (26/32) [63.6–92.8] | 50.0 (3/6) [11.8–88.2] | 0.000 | 0.000*** | [9,13] |
| G1899A1 | 17.0 (28/165) [11.6–23.6] | 12.6 (16/127) [7.4–19.7] | 34.4 (11/32) [18.6–53.2] | 16.7 (1/6) [0.42–64.1] | 0.017 | 0.040* | [9,13,36] |
| A2092T2 | 10.3 (17/165) [6.1–16.0] | 11.8 (15/127) [6.8–18.7] | 3.1 (1/32) [0.08–16.2] | 16.7 (1/6) [0.42–64.1] | 0.242 | 0.357 | [36] |
| T2121G1 | 2.4 (4/165) [0.7–6.1] | 1.6 (2/127) [0.2–5.6] | 6.2 (2/32) [0.8–20.8] | 0.0 (0/6) [0.0–45.9] | 0.298 | 0.404 | [36] |
| G2138A2 | 1.2 (2/165) [0.1–4.3] | 0.0 (0/127) [0.0–2.9] | 6.2 (2/32) [0.8–20.8] | 0.0 (0/6) [0.0–45.9] | 0.050 | 0.095 | [36] |
| G2129C2 | 19.4 (32/165) [13.7–26.3] | 23.6 (30/127) [16.5–32] | 6.2 (2/32) [0.8–20.8] | 0.0 (0/6) [0.0–45.9] | 0.039 | 0.082 | [36] |
| A2159G1 | 1.8 (3/165) [0.4–5.2] | 0.0 (0/127) [0.0–2.9] | 6.2 (2/32) [0.8–20.8] | 16.7 (1/6) [0.42–64.1] | 0.007 | 0.019* | [9,13] |
| A2189C1 | 2.4 (4/165) [0.7–6.1] | 3.1 (4/127) [0.9–7.9] | 0.0 (0/32) [0.0–10.9] | 0.0 (0/6) [0.0–45.9] | 0.649 | 0.771 | [9,13] |
| G2203A1 | 1.8 (3/165) [0.4–5.2] | 2.4 (3/127) [0.5–6.7] | 0.0 (0/32) [0.0–10.9] | 0.0 (0/6) [0.0–45.9] | 1.000 | 1.000 | [9] |
| C2289A1 | 3.0 (5/165) [1.0–6.9] | 2.4 (3/127) [0.5–6.7] | 6.2 (2/32) [0.8–20.8] | 0.0 (0/6) [0.0–45.9] | 0.404 | 0.512 | [36] |
1HCC 2CHB, * = < 0.05, ** = < 0.01, *** = < 0.001.
Table 5.
Mutations in the HBV X gene region related to HCC, CHB, and LC among the isolates.
| Variable | All, N = 165 % [95% CI] |
Genotype A, n = 127 % [95% CI] |
Genotype D, n = 32 % [95% CI] |
Genotype E, n = 6 % [95% CI] |
Raw p value |
FDR adjusted p-value |
Reference | |
|---|---|---|---|---|---|---|---|---|
|
Genome length (base pairs) |
3221 | 3182 | 3212 | |||||
| Mutation | ||||||||
| Nucleotide | Amino acid | |||||||
| T1449C23 | C26R | 80.0 (132/165) [73.1–85.8] | 98.4 (125/127) [94.4–99.8] | 18.7 (6/32) [7.2–36.4] | 16.7 (1/6) [3.0–56.3] | 0.000 | 0.000** | [36] |
| T1464C23 | 31P | 1.2 (2/165) [0.1–4.3] | 1.6 (2/127) [0.2–5.6 ] | 0.0 (0/32) [0.0–10.9] | 0.0 (0/6) [0.0–45.9] | 1.000 | 1.000 | [36] |
| A1479T3 | T36S | 7.9 (13/165) [4.3–13.1] | 10.2 (13/127) [5.6–16.9] | 0.0 (0/32) [0.0–10.9] | 0.0 (0/6) [0.0–45.9] | 0.152 | 0.342 | [36] |
| C1509T23 | P46S | 0.6 (1/165) [0.02–3.3] | 0.8 (1/127) [0.02–4.3] | 0.0 (0/32) [0.0–10.9] | 0.0 (0/6) [0.0–45.9] | 1.000 | 1.000 | [36] |
| C1653T123 | H94Y | 9.1 (15/165) [5.2–14.6] | 11.0 (14/127) [6.2–17.8] | 3.1 (1/32) [0.08–16.2] | 0.0 (0/6) [0.0–45.9] | 0.440 | 0.660 | [36] |
| C1678T23 | A102V | 1.8 (3/165) [0.4–5.2] | 0.8 (1/127) [0.02–4.3] | 6.2 (2/32) [0.8–20.8] | 0.0 (0/6) [0.0–45.9] | 0.205 | 0.369 | [36] |
| A1752C23 | I127L | 3.6 (6/165) [1.3–7.7] | 1.6 (2/127) [0.2–5.6] | 12.5 (4/32) [3.5–29.0] | 0.0 (0/6) [0.0–45.9] | 0.038 | 0.114 | [36] |
| A1762T23 | K130M | 29.1 (48/165) [22.3–36.7] | 29.1 (37/127) [21.4–37.9] | 31.2 (10/32) [16.1–50.0] | 16.7 (1/6) [0.42–64.1] | 0.834 | 1.000 | [36] |
| T1768A3 | F132Y | 17.6 (29/165) [12.1–24.3] | 22.8 (29/127) [15.9–31.1] | 0.0 (0/32) [0.0–10.9] | 0.0 (0/6) [0.0 -45.9] | 0.002 | 0.009* | [36] |
1HCC 2CHB 3LC, * = < 0.01, ** = < 0.001.
Disclaimer/Publisher’s Note: The statements, opinions and data contained in all publications are solely those of the individual author(s) and contributor(s) and not of MDPI and/or the editor(s). MDPI and/or the editor(s) disclaim responsibility for any injury to people or property resulting from any ideas, methods, instructions or products referred to in the content. |
© 2026 by the authors. Licensee MDPI, Basel, Switzerland. This article is an open access article distributed under the terms and conditions of the Creative Commons Attribution (CC BY) license (http://creativecommons.org/licenses/by/4.0/).
Copyright: This open access article is published under a Creative Commons CC BY 4.0 license, which permit the free download, distribution, and reuse, provided that the author and preprint are cited in any reuse.