

Submitted:
07 October 2026
Posted:
09 October 2026
You are already at the latest version
Abstract
Prolonged spaceflight is associated with skeletal muscle atrophy, but the molecular mechanisms linking immune dysregulation, circadian disruption, and metabolic remodeling remain poorly understood. This study performed RNA-seq transcriptomic profiling of tibialis anterior muscle from mice flown on the International Space Station for 38 days, using data from NASA's Rodent Research-23 mission (OSD-576). Comparing flight mice with habitat ground controls, 311 genes were differentially expressed (FDR < 0.05, |log2FC| > 1.5). Flight mice showed an elevated expression of acute phase and stress response genes, including Lcn2 (log2FC = +3.65), Orm1 (+3.87), Pnmt (+3.07), and Cdkn1a (+2.39), and reduced expression of metabolic, circadian, and chemokine genes, including Nmrk2 (−3.90), Dbp (−1.96), Cxcl10 (−2.34), Ccl2 (−2.68), S100a8 (−2.61), and S100a9 (−2.97). Overrepresentation analysis identified shared gene membership (not directional concordance) with published gene sets for idiopathic pulmonary fibrosis, acute myocardial infarction, dilated cardiomyopathy, and colitis. Several overlapping genes moved in opposite directions relative to the disease reference sets. The findings are consistent with immunometabolic transcriptional remodeling of skeletal muscle, characterized by acute phase activation along with suppression of chemokine signaling, circadian control, and energy metabolism.
Keywords:
microgravity
; skeletal muscle atrophy
; transcriptomics
; immunometabolism
; circadian rhythm
; disease signature association
Introduction
Long-term exposure to the microgravity environment can cause a range of changes in mammalian physiology, with muscular atrophy being the most prominent. Astronauts who participate in long-term space missions normally experience muscle mass loss, decreased strength, and decreased functional capabilities, especially in lower limb muscles. Research consistently demonstrates that in short flights, astronauts lose about 5-15% of their muscle mass, and in prolonged flights lasting longer than six months, up to 24% (Akima et al., 2000; Narici and de Boer, 2011). The tibialis anterior muscle, a mixed-fiber-type dorsiflexor muscle known for its sensitivity to mechanical unloading, rapidly atrophies when exposed to microgravity and can be used as a model in studies of space-induced muscle adaptations (Fitts et al., 2000; Riley et al., 2002). Atrophy can lead to limitations in mobility, increased chances of injuries, and poses challenges for planning future astronaut health care programs. Current exercise-based countermeasures partially mitigate muscle loss during extended flight, but the problem has not completely been solved, despite decades of research.
Despite the extensive knowledge of structural and functional consequences of spaceflight for the skeleton, analysis of transcriptional adaptation under space conditions is not well represented in the literature. Previous research has found molecular alterations, such as protein synthesis and degradation impairment, mitochondrial dysfunction, oxidative stress, and inflammation as factors underlying spaceflight-induced muscle atrophy (Fitts et al., 2010; Desplanches, 1997). There is emerging evidence that immunometabolic changes, separate from mechanical unloading, may also play a role in muscle atrophy. Specifically, immune response, circadian rhythms, and metabolic homeostasis alterations were described for various tissues under spaceflight conditions (Garrett-Bakelman et al., 2019; da Silveira et al., 2020); however, no information about spaceflight-induced alterations of immune and circadian rhythms and metabolic functions is provided concerning the tibialis anterior muscle. It is also unknown whether space-related transcriptomic changes are similar to the transcriptomic patterns seen in diseases involving muscular atrophy.
Using OSD-576, a transcriptomics dataset made publicly available through the NASA Open Science Data Repository, this study analyzed tibialis anterior muscle gene expression from the Rodent Research-23 mission, in which mice were exposed to the spaceflight environment for 37-38 days, along with habitat and vivarium ground controls. Differential gene expression analysis (DGEA), gene set enrichment analysis (GSEA), and overrepresentation analysis (ORA) were applied to identify alterations at the gene and pathway levels. Comparison of these transcriptomic profiles with publicly available datasets from various muscle wasting diseases enabled identification of spaceflight-related expression changes that resemble disease states.
In this study, the OSD-576 dataset was used to profile spaceflight-induced transcriptomic adaptations in tibialis anterior muscles of mice. The first hypothesis tested was that spaceflight activates inflammatory signaling pathways including IL-17, TNF, and chemokine pathways. The second was that circadian rhythm and lipid metabolism pathways become inhibited by spaceflight. The third was that, since chronic inflammatory responses, metabolic alterations, and extracellular matrix remodelling are involved in many muscle wasting diseases, spaceflight transcriptional signature might be similar to some disease states.
Materials and Methods
Dataset Description
The transcriptomic data used for this study is from the NASA Open Science Data Repository (OSD-576). Specifically, the data was from the Rodent Research-23 (RR-23) experiment onboard the International Space Station (NASA Open Science Data Repository, 2023). Transcriptomic analysis was performed on tibialis anterior muscle tissue from male C57BL/6J mice aged 16-17 weeks at the time of mission launch. The tibialis anterior was selected for this analysis because it is a mixed-fiber-type dorsiflexor muscle whose established sensitivity to mechanical unloading makes it a well-characterized model for detecting spaceflight-induced atrophic and transcriptional change. In total, the dataset has nine samples, each for three experimental groups: Flight (n = 9), which spent 37-38 days on board the ISS within a rodent habitat module; Habitat Ground Control (HGC, n = 9), which stayed on Earth in identical habitat hardware under equal environmental conditions; and Vivarium Ground Control (VGC, n = 9), which was housed in normal vivarium cages.
After the 38-day flight, Flight mice were euthanized on January 14, 2021, within 24 hours following splashdown and landing of the ISS, with HGC mice euthanized on January 17, 2021 and VGC mice following on January 20, 2021. Tibialis anterior muscles were dissected immediately after the mice were euthanized and they were flash frozen in liquid nitrogen to preserve RNA integrity. Total RNA extraction, library preparation, and sequencing were done using established procedures, with paired-end RNA sequencing yielding 151 base pair reads using the Illumina NovaSeq 6000 sequencer. Quality control parameters showed that all the RNA samples had high integrity (RINe score 8.1-10.0) with little rRNA content (between 0.67% and 19.34%, with less than 2% in the majority of samples) and sequencing depth between 91 million and 148 million reads per sample. This study analyzed publicly available, de-identified RNA-seq data from NASA OSD-576 and did not involve new experiments on human participants or live animals; therefore, institutional ethics approval and informed consent were not required.
Data Acquisition and Quality Control
RNA sequencing data sets are from the NASA Open Science Data Repository (GeneLab accession GLDS-570) and preprocessed by the GeneLab research team according to the RNA-seq data processing pipeline of GeneLab (GL-DPPD-7101-F). Raw FASTQ files were preprocessed using Trim Galore (v0.6.7), which was supported by Cutadapt (v3.7) to filter out any adapters and low quality sequences. Reads after trimming were aligned to the Ensembl GRCm39 genome (release 107) appended with ERCC spike-in sequences using STAR (v2.7.10a). Gene-level raw count quantification was generated directly from STAR's alignment output (STAR --quantMode GeneCounts) as provided by GeneLab, and this STAR-derived unnormalized count matrix was used as the input for downstream differential expression analysis. FastQC (v0.11.9) and MultiQC (v1.12) reports were used to assess data quality provided by GeneLab. To determine sample clustering and the presence of potential batch effects, principal component analysis (PCA) was conducted. The PCA results showed that Flight samples were clearly different from the two control samples, indicating that spaceflight was the primary factor that influenced transcriptional differences. Dispersion and MA plots were generated to make sure normalization was proper and that the datasets were bias-free. For PCA visualization specifically, variance-stabilizing transformation (VST) counts precomputed by the GeneLab standard RNA-seq pipeline (GLDS-570_rna_seq_VST_Counts_GLbulkRNAseq.csv) were used in place of raw or DESeq2 median-of-ratios normalized counts, since VST better accounts for the mean-variance relationship inherent to RNA-seq count data and reduces the influence of technical variance across samples with differing library sizes. Because GeneLab's VST file reflects the platform's own filtering criteria, it comprises a slightly different gene set (11,589 genes) than the CV- and low-count-filtered matrix used for differential expression testing (12,633 genes); this distinction affects only the PCA visualization and not the DGEA results reported below.
Differential Gene Expression Analysis
For analyzing differentially expressed genes, the pyDESeq2 Python package was used under Python 3.12 environment on Google Colab. The data included in the analysis was the STAR-derived unnormalized gene count matrix obtained from NASA Open Science Data Repository (OSD-576/GLDS-570). The data had information on 57,278 genes with 27 samples and was filtered for better statistical power by removing 92 ERCC spike-in controls, genes that had less than 50 counts across all samples, and coefficient of variation equal or greater than 0.5 for reducing the influence of highly variable low abundance genes. After doing these steps, the number of genes came down to 12,633.
The DESeqDataSet was built up with a single experimental variable, which was "Group", with three levels: Flight, Ground Control, and Vivarium Control. Counts normalization was done using the median of ratios (DESeq2) to normalize data because of the sequencing depth and RNA composition. The Wald test was performed for determining differential expression between groups. The p-values were corrected for multiple comparisons using the Benjamini-Hochberg correction for false discovery rate (FDR). A gene was considered significantly differentially expressed when an adjusted p-value was < 0.05 and the absolute log2 fold change > 1.5. A Volcano plot was drawn to show the relationship between the effect size and significance of the differentially expressed genes. The differential expression output data was saved in a table for pathway enrichment analysis. To evaluate whether housing conditions confounded the Flight-vs-HGC comparison, a secondary DESeq2 contrast was performed directly between Habitat Ground Control (HGC) and Vivarium Ground Control (VGC) groups (n = 9 per group), using the same significance thresholds (FDR < 0.05, |log2FC| > 1.5).
Targeted Gene Panel Analysis
To evaluate whether spaceflight-associated transcriptional changes extended to canonical muscle atrophy, mitochondrial/metabolic, and immune gene panels beyond the top DEGs highlighted above, we examined the differential expression status of curated gene sets for these three domains. Among immune/inflammatory genes, chemokine and DAMP-associated transcripts (Ccl2, Ccl7, Il1b, S100a8, S100a9, Cxcl10, Cxcr2) were significantly downregulated (FDR < 0.05, |log2FC| > 1.5), while general macrophage and cytokine markers (Cd68, Nos2, Itgam, Tnf, Il6) were not significantly altered, indicating a chemokine/DAMP-specific rather than broadly immunosuppressive transcriptional signature. Among mitochondrial and metabolic regulatory genes, Nmrk2 and Ppargc1a were significantly downregulated, consistent with impaired NAD⁺ salvage and mitochondrial biogenesis signaling; however, core oxidative phosphorylation, TCA cycle, and glycolytic structural genes (including Cs, Sdha, Sdhb, Cox4i1, Ndufa1, Hk2, Cpt1b, and Acox1) did not reach significance, suggesting the metabolic signature is concentrated in upstream regulatory genes rather than reflecting broad suppression of oxidative metabolism machinery. Among canonical muscle atrophy genes, none reached statistical significance at the prespecified thresholds; Fbxo32 (Atrogin-1) showed a highly significant adjusted p-value (padj = 6.6 × 10⁻⁶) but a log2 fold change (+1.35) below the 1.5 threshold, representing a near-threshold trend rather than a confirmed effect. Trim63, Foxo1, and Mstn showed no significant change. This indicates that the observed transcriptional signature does not resemble a classical ubiquitin-proteasome-mediated atrophy program, and instead reflects a more targeted immune-chemokine and metabolic-regulatory response.
Pathway Enrichment Analysis
Pathway enrichment analysis was done using gseapy (v1.1.8). The Ensembl IDs were translated into gene symbols using mygene (v3.2.2), and gene symbols were capitalized to match with Enrichr’s gene set library notation.
The gene set enrichment analysis (GSEA) was done using the gseapy GSEA function based on the expression matrix containing 12,633 genes × 27 samples, ranked by signal to noise ratio of genes across Flight and Ground Control phenotypes. Phenotype permutations were applied 1,000 times with the random seed (seed = 7). Gene set enrichment analysis involved calculating family wise error rate (FWER) p-value thresholds at < 0.05 based on the gene set libraries GO Molecular Function 2025, GO Biological Process 2025, GO Cellular Component 2025, Disease perturbations from GEO Up, and Disease perturbations from GEO Down. No significantly enriched pathways were obtained in GO or GEO libraries with an FWER cut off p-value of < 0.05, because of small sample sizes (n = 9).
The overrepresentation analysis (ORA) was done by gseapy, using the Enrichr pathway database. The 311 genes that were differentially expressed genes (FDR < 0.05 and |log2FC| > 1.5) were used to identify significantly enriched gene sets. Five gene set libraries, which were the same as the ones used in GSEA, were analyzed. Overrepresentation analysis used a Benjamini Hochberg adjusted p-value < 0.05 for gene enrichment significance. Dot plots and Lollipop plots were created for the top 10 enriched per library respectively.
Results
Data Quality and Sample Clustering
Inclusion criteria for all 27 samples in the quality control assessment were met for downstream analyses. RINe values were measured using Agilent 4200 TapeStation, and they were between 8.1 to 10.0, which suggests that the RNA was high quality in all experimental groups. Ribosomal RNA contamination levels were between 0.67% to 19.34%, with most samples less than 2%. One replicate in the Flight condition (TAFLTF2) had the highest rRNA percentage (19.34%). This was far from the main Flight cluster on PCA, but no bias caused by rRNA levels was there for the groups. The average read counts of each sample in the analysis were between 91 million and 148 million paired end reads. All 27 samples met quality control requirements and therefore were used.
PCA performed on VST-normalized expression values across all 27 samples showed clear separation of Flight samples from both control groups along PC1, which explained 51.1% of overall variance; PC2 explained an additional 10.5% of variance but did not separate samples by group (Figure 1). The Flight samples formed a distinct cluster relative to Habitat and Vivarium Ground Control samples, which showed greater similarity to one another. One Vivarium Ground Control sample (V1) diverged from the rest of its group along PC1 despite normal RNA integrity, rRNA contamination, and sequencing depth; this divergence persisted across raw, DESeq2-normalized, and VST-transformed representations of the data, suggesting individual biological variability rather than a technical artifact (see Limitations).
Differential Gene Expression Analysis
Differentially expressed gene analysis (DGEA) between Flight and Habitat Ground Control found that 311 genes pass the cut off criteria (FDR < 0.05 and |log2 fold change| > 1.5) from a dataset of 12,633 expressed genes (Figure 2). These genes were upregulated and downregulated and affected various functions.
The gene with the highest significance of differential expression is Pnmt (log2FC = +3.07, FDR = 6.4 x 10⁻⁴⁸), which encodes phenylethanolamine N-methyltransferase, an enzyme in the biosynthesis pathway of catecholamines and upregulated in Flight samples. Other significantly upregulated genes were Lcn2 (log2FC = +3.65, FDR = 5.5 x 10⁻²⁶), lipocalin-2 coding gene; Slc43a1 (log2FC = +2.56, FDR = 7.5 x 10⁻²¹), a large neutral amino acid transporter; Sesn1 (log2FC = +1.96, FDR = 2.5 x 10⁻¹⁷), a stress response regulator of metabolic homoeostasis; Cdkn1a (log2FC = +2.39, FDR = 5.7 x 10⁻¹⁶), cyclin-dependent kinase inhibitor and cell cycle control molecule; and Orm1 (log2FC = +3.87, FDR = 5.9 x 10⁻¹⁴), an acute-phase reactant. The full list of top differentially expressed genes is summarized in Table 1.
The gene with the highest level of downregulation was Nmrk2 (log2FC = -3.90, FDR = 9.2 x 10⁻³⁶), whose product is nicotinamide riboside kinase 2, a protein in the NAD⁺ salvage pathway that plays a vital role in the energy metabolism of skeletal muscles. Another downregulated gene is Dbp (log2FC = -1.96, FDR = 9.9 x 10⁻¹⁷), the seventh most significantly regulated gene overall, which is a circadian output gene and is followed by another circadian repressor, Ciart (log2FC = -1.99, FDR = 1.6 x 10⁻⁵). Other important downregulated genes were Ppargc1a (log2FC = -2.36, FDR = 2.3 x 10⁻¹⁰), a mitochondrial biogenesis regulator; Hspa1a (log2FC = -3.45, FDR = 2.4 x 10⁻¹⁵) and Hspa1b (log2FC = -3.36, FDR = 7.2 x 10⁻¹⁰), two heat shock protein encoding genes; Atf3 (log2FC = -3.43, FDR = 1.8 x 10⁻⁹), a stress-related transcription factor; and Nr4a3 (log2FC = -4.06, FDR = 7.7 x 10⁻⁸), a nuclear receptor. The immune and chemokine genes such as Cxcl10 (log2FC = -2.34), Ccl2 (log2FC = -2.68), S100a8 (log2FC = -2.61), and S100a9 (log2FC = -2.97) were all downregulated in Flight samples, which shows suppression of chemokine and damage-associated molecular pattern signaling in this tissue. Direct comparison of HGC and VGC groups identified 287 significantly differentially expressed genes. Of the 311 genes differentially expressed between Flight and HGC, 49 overlapped with the HGC-vs-VGC gene set, indicating that a modest portion of the Flight-vs-HGC signature may be influenced by housing or environmental differences between control groups rather than spaceflight itself.
Pathway Enrichment Analysis
There were no results from applying GSEA to the filtered expression matrix in GO Molecular Function, GO Biological Process, and GO Cellular Component gene set libraries at a family-wise error rate (FWER) < 0.05, and the output for GO GSEA was an empty set. Although no gene sets survived FWER correction, several lipid metabolism-related GO Biological Process terms showed nominal enrichment toward the Flight phenotype (lipid metabolic process, NES = 1.55, nominal p = 0.019; lipid catabolic process, NES = 1.58, nominal p = 0.022; glycerophospholipid biosynthetic process, NES = 1.60, nominal p = 0.039), consistent with the individual-gene upregulation of Pdk4 and Ucp3 and suggestive of a shift toward fatty acid oxidation as an energy substrate during spaceflight-induced muscle unloading, though this pathway-level trend did not reach statistical robustness after multiple-testing correction. The circadian rhythm GO term did not meet the minimum gene-set size threshold for GSEA testing following expression-based filtering and could not be evaluated at either the nominal or corrected level; the observed downregulation of Dbp and Ciart therefore remains an individual-gene finding without corresponding pathway-level statistical support. Over representation analysis (ORA) using gseapy Enrichr with three GO libraries and two GEO Disease Perturbation libraries was done and found statistically significant enrichment in all five gene set collections (see Figure 3).
For GO libraries, only one term was significant after adjustment (adjusted p < 0.05), and that was Granulocyte Chemotaxis (GO Biological Process 2025, adjusted p = 0.0087). The only GO term passing the significance threshold is shown in Figure 3A. Representative ORA disease and GO enrichment results are summarized in Table 2.
ORA using GEO Disease Perturbations from the GEO Down library showed that DEGs in spaceflight conditions were the most enriched for overlap with genes that are downregulated in idiopathic pulmonary fibrosis (adjusted p = 1.3 × 10⁻⁸, combined score = 149.4). Genes in common were Csrnp1, Orm1, Pfkfb3, Cebpd, Irs2, Cxcr2, Nr4a1, and Nr4a3. Some other statistically significant hits in the GEO Down library included another two gene sets of idiopathic pulmonary fibrosis related genes (adjusted p = 1.1 × 10⁻⁷ and 4.4 × 10⁻5), idiopathic fibrosing alveolitis (adjusted p = 1.2 × 10⁻⁷), cystic fibrosis (adjusted p = 4.3 × 10⁻⁴), and dilated cardiomyopathy (adjusted p = 2.8 × 10⁻³), with dilated cardiomyopathy associated with DEGs Ciart, Ky, Cxcl10, and Cebpd (see Figure 3B).
ORA of the GEO Disease Perturbations from the GEO Up library suggested that the overlap of the spaceflight DEG list with the genes that are upregulated in cases of acute myocardial infarction (adjusted p = 2.4 × 10⁻⁵; combined score = 75.4) and including DEGs such as Cdkn1a, Lcn2, Rcan1, Atf3, Ankrd1, Hspa1b, S100a8, and S100a9. Also, there were some statistically significant overlaps in other diseases in GEO Up library, and they included basal cell carcinoma (adjusted p = 2.4 × 10⁻⁵; combined score = 78.6), colon cancer (adjusted p = 2.4 × 10⁻⁵), colitis (adjusted p = 2.4 × 10⁻⁵), psoriasis (adjusted p = 7.6 × 10⁻⁵), and syndromes associated with glaucoma (adjusted p = 7.6 × 10⁻⁵). ORA found overlap between the DEG list and disease-related gene sets without accounting for fold-change direction; a directional check (Table 2) showed several overlapping genes moved in opposite directions between flight and disease reference sets, so this overlap reflects shared gene membership only, not concordant regulation.
Discussion
Overview of the Transcriptional Response to Spaceflight
This study found that there were 311 differentially expressed genes in the tibialis anterior muscle from the mice in space after 38 days of spaceflight, out of 12,633 total genes. The PCA results showed significant separation between Flight and Ground Control samples in the first principal component, accounting for 54.9% of variance in expression data, which suggests that spaceflight had a large and consistent effect on muscle gene expression on the Flight group. The three hypotheses received varying degrees of support, though none should be read as fully confirmed given the analytical limitations discussed below (see Limitations).
Hypothesis 1 about activation of inflammatory signaling, including IL-17, TNF, and chemokine pathways, is only partially confirmed, because even though acute phase response genes (Lcn2, Orm1) were upregulated in the Flight samples, other chemokine genes (Cxcl10, Ccl2, and Ccl7), as well as proteins involved in tissue damage (S100a8, S100a9), were downregulated, indicating a mixed transcriptional profile. Hypothesis 2, regarding decreased circadian and metabolic gene expression, is supported at the individual-gene level, as Dbp, Ciart, Ppargc1a, and Irs2 were among the most significantly downregulated genes in Flight samples. However, GSEA detected no FWER-significant enrichment in circadian or metabolic gene sets (see Circadian and metabolic suppression below for gene-set testing limitations). Nominal-level GSEA did detect enrichment of several lipid metabolism terms trending toward the Flight phenotype (lipid metabolic process, NES = 1.55, nominal p = 0.019), offering weak, uncorrected support for a metabolic shift, though this did not survive multiple-testing correction. Hypothesis 3, regarding overlap between the spaceflight signature and terrestrial disease gene sets, is hypothesis-generating rather than verified. ORA identified shared gene membership with pulmonary fibrosis, cardiomyopathy, myocardial infarction, and colitis gene sets, but because ORA does not test regulatory direction, and several overlapping genes move in opposite directions relative to the disease references (see Table 2), this overlap should not be interpreted as confirmation of shared disease-like biology.
Acute-Phase Upregulation and Stress Response
The most statistically significant finding is the increased expression of Pnmt (log2 fold change = +3.07, FDR = 6.4 × 10⁻⁴⁸), which codes phenylethanolamine N-methyltransferase, the enzyme responsible for producing epinephrine from norepinephrine during catecholamine biosynthesis. Increased expression of Pnmt in the skeletal muscle during spaceflight could suggest elevated adrenergic signaling, which can be attributed to the stress caused by exposure to microgravity and other factors associated with space travel. Even though Pnmt is associated mainly with the adrenal medulla, elevated expression of this gene has been shown to occur in non-adrenal tissue under sympathetic stress conditions.
In addition to Pnmt, many other upregulated genes are indicative of an acute-phase response and cellular stress response. Lcn2 (log2FC = +3.65) and Orm1 (log2FC = +3.87), which encode lipocalin-2 and orosomucoid, respectively, are acute-phase proteins that increase during systemic or local stress caused by inflammation and injury (Rebalka et al., 2018; Fournier et al., 2000). Cdkn1a (log2FC = +2.39) codes p21, a cell cycle inhibitor upregulated due to cellular stressors, such as DNA damage, oxidative stress, and cellular senescence signals, as well as previously being shown to promote muscle atrophy in animal models of muscle unloading (Lecker et al., 2004). Sesn1 (log2FC = +1.96) codes Sestrin 1, an acute stress-inducible protein that inhibits mTORC1 and stimulates AMPK pathways (Lee et al., 2010).
Together, the upregulation of all the genes above indicates that the stress response occurring in the tibialis anterior during space flight consists of increased adrenergic activity, acute-phase protein production, and cell cycle inhibition. This is corroborated by the overlap found by ORA analysis between the spaceflight DEG set and genes upregulated during myocardial infarction (combined score = 75.4, adjusted p = 2.4 × 10⁻⁵), another stress condition that also features acute phase response, catecholamine release, and tissue remodeling.
Circadian and Metabolic Suppression
Another trend seen in the data is the downregulation of circadian clock genes in the Flight group samples. Dbp (log2FC = −1.96; FDR = 9.9 × 10⁻¹⁷) was the seventh most highly statistically significant gene overall and the highest-ranking circadian gene, followed by Ciart (log2FC = −1.99; FDR = 1.6 × 10⁻⁵). Dbp is responsible for D-box binding protein, which is the main output of the molecular clock and regulates downstream metabolism and physiology (Gachon et al., 2006). Its downregulation during spaceflight fits with research on circadian disruptions experienced by astronauts and rodent studies in space, because of changes in light dark cycle and neuroendocrinological factors that affect circadian gene expression (Garrett-Bakelman et al., 2019).
In addition, the downregulation of metabolic genes suggests that there is poor energy homeostasis in the skeletal muscles in spaceflight. Ppargc1a (log2FC = −2.36; FDR = 2.3 × 10⁻¹⁰) is involved in the transcription of PGC-1α, which is a regulator of mitochondrial biogenesis and oxidative metabolism in the skeletal muscle and is normally downregulated in disuse conditions (Sandri et al., 2006). Nmrk2, the most significantly downregulated gene overall (see Results), is very active in muscles and important in mitochondrial biology and muscle maintenance (Ratajczak et al., 2016). Irs2 (log2FC = −1.77; FDR = 2.1 × 10⁻⁵), coding for insulin receptor substrate 2, was downregulated, which suggests a possible gradual loss of insulin signaling in the Flight muscle tissue.
These processes work together closely, with PGC-1α being an established transcriptional partner of clock proteins, and NAD⁺ availability being critical for proper regulation of SIRT1 activity, an important metabolic/circadian regulator (Asher et al., 2008). Therefore, these findings suggest a breakdown of the circadian metabolic axis in spaceflight muscle. Directional concordance between these pathways is partially supported by ORA, which found overlap with the dilated cardiomyopathy gene set (Ciart, Ky, Cxcl10, Cebpd all downregulated in both flight and disease), though this remains a gene-membership overlap rather than a validated shared mechanism. Nominal GSEA results lend partial, uncorrected support to the metabolic side. Lipid catabolic process (NES = 1.58, nominal p = 0.022) and glycerophospholipid biosynthetic process (NES = 1.60, nominal p = 0.039) both trended toward enrichment in Flight samples, aligning with the individual upregulation of Pdk4 and Ucp3 and suggesting a possible shift toward fatty acid oxidation as an energy substrate under muscle unloading. This is a substrate-preference signal rather than evidence of suppressed metabolism overall, and it did not reach FWER significance. By contrast, the circadian rhythm gene set was excluded from GSEA testing entirely due to insufficient gene-set size after filtering, meaning the circadian component of this hypothesis has no corresponding pathway-level test, supported or otherwise, and relies only on the downregulation of Dbp and Ciart as individual genes.
Immune Dysregulation and Chemokine Suppression
One unexpected finding was the downregulation of immune response genes. Genes like Cxcl10 (log₂FC = −2.34), Ccl2 (log₂FC = −2.68), Ccl7 (log₂FC = −2.65), S100a8 (log₂FC = −2.61), S100a9 (log₂FC = −2.97), Il1b (log₂FC = −2.20), and Cxcr2 (log₂FC = −3.14), which code for chemokines and DAMPs, were repressed in muscle tissue from the flight group. These genes normally signal recruitment of immune cells to damaged tissue, but their repression suggests decreased immune cell infiltration.
This pattern is consistent with growing evidence of impairment of immune responses in microgravity. For example, spaceflight was found to decrease the number and activity of NK cells, impair T-cell responses, and change cytokine profiles during and after space travel (Crucian et al., 2018; Garrett-Bakelman et al., 2019). Furthermore, the suppression of chemokines involved in satellite cell activation and myogenesis, like CCL2 and CXCL10, could be the reason for the decreased capability of muscle cells to heal after injury (Tidball, 2017). At the same time, the simultaneous upregulation of acute phase proteins, LCN2, and ORM1 shows an interesting split in the immune activity, where systemic immune response rose, but local inflammation in muscles was repressed. This has also been found before in models of muscle disuse/immobilization (Peake et al., 2010).
ORA supports this hypothesis, indicating gene set overlap with diseases characterized by aberrant immune responses. Spaceflight DEGs showed significant association with gene sets in colitis (adjusted p-value = 2.4 × 10⁻⁵), psoriasis (adjusted p-value = 7.6 × 10⁻⁵), and pulmonary fibrosis (adjusted p-value = 1.3 × 10⁻⁸). Interestingly, pulmonary fibrosis is associated with chronic immune suppression and poor tissue repair ability leading to fibrosis. Two nuclear receptors significantly repressed in Flight samples, Nr4a1 (log₂FC = −1.67) and Nr4a3 (log₂FC = −4.06), also overlap with the gene list for pulmonary fibrosis and have been shown to regulate anti-inflammatory responses.
Disease Signature Overlap and Translational Implications
ORA showed significant enrichment for spaceflight DEGs in the disease state gene sets. The highest significance came from the GEO Disease Perturbations from GEO Down library, where the spaceflight DEGs were significantly enriched, with genes downregulated in patients with idiopathic pulmonary fibrosis (IPF; adj. p-value = 1.3 × 10⁻⁸, combined score = 149.4), with three out of top 10 ranking sets being related to IPF. The DEGs found in spaceflight conditions were very similar to genes downregulated in fibrosis related tissue remodeling, such as Csrnp1, Orm1, Pfkfb3, Cebpd, Irs2, Nr4a1, and Nr4a3. The overlap with IPF-associated genes is biologically plausible but directionally mixed: Orm1 is upregulated in flight yet annotated as downregulated in IPF, while Csrnp1, Pfkfb3, Cebpd, Irs2, Cxcr2, Nr4a1, and Nr4a3 are concordant. This overlap should be read as shared gene membership, not evidence that spaceflight muscle recapitulates fibrotic biology.
From the GEO Disease Perturbations from GEO Up library, there was a significant association between the spaceflight DEG list and genes upregulated in acute myocardial infarction (AMI; adj. p-value = 2.4 × 10⁻⁵, combined score = 75.4), colitis (adj. p-value = 2.4 × 10⁻⁵), basal cell carcinoma (adj. p-value = 2.4 × 10⁻⁵), and colon cancer (adj. p-value = 2.4 × 10⁻⁵). The AMI-associated genes were Cdkn1a, Lcn2, Ankrd1, Rcan1, Atf3, Hspa1b, S100a8, and S100a9, which can be considered as stress response genes that are members of the same gene set used to define AMI, though Atf3, Hspa1b, S100a8, and S100a9 were downregulated in flight while annotated as upregulated in AMI, which is an opposite-direction relationship that argues against a shared activation mechanism. The number of these kinds of genes suggests the existence of a universal tissue stress transcriptional response rather than any spaceflight muscle specific one.
The conclusion that spaceflight and the diseases share gene sets indicates transcriptional coregulation, but not that spaceflight induces the diseases. However, the consistent association with several different diseases suggests that the spaceflight muscle transcriptional program has parts of disease pathways that might occur in humans on Earth.
Limitations and Future Directions
Several limitations, inherent to secondary analysis of spaceflight omics data, should inform interpretation of these findings. First, this study is a secondary analysis of an existing dataset, and the author had no control over the original mission design, sample collection timing, euthanasia schedule, feeding status, or post-landing handling. Flight mice were euthanized within 24 hours of splashcatch and landing, while HGC and VGC mice were euthanized on staggered later dates; genes related to acute stress, circadian rhythm, and immune signaling (e.g., Dbp, Ciart, Pnmt, Atf3, Hspa1a/b, Lcn2) may reflect landing stress, handling, or timing differences in addition to, or instead of, sustained microgravity exposure. Second, only male C57BL/6J mice were used, which means there is no data on females. Female mice have been found to demonstrate different transcriptional profiles compared to males in skeletal muscle during simulated microgravity conditions (Tsitkanou et al., 2023). It is also unknown whether immune and metabolic transcriptional signatures found here would be the same for female mice. Third, the tibialis anterior was chosen for the study, and only one time point after a 38 day space mission was considered. Whether the differences found correspond to an early, acute change or stable adaptation to conditions of flight still isn’t clear without longitudinal studies. Also, it is unlikely that transcriptional profiles in other muscle types would follow the same dynamics, which means that the soleus and gastrocnemius muscles should also be tested.
Fourth, there were no significant outcomes from GSEA based on the prespecified FWER. This is due to the low statistical power in the context because the sample size (n = 9) for the experimental group was low, and sample size restriction is a big limiting factor for space transcriptomics research. Due to the low sample size, ORA was the only available tool for inferring biological pathways based on differentially expressed genes. Because GSEA returned no significant results, the pathway-level narratives presented in this manuscript (e.g., circadian-metabolic axis disruption, immunometabolic remodeling) rest on individual annotated genes rather than a validated pathway-level statistical test. These narratives should be read as retrospective, literature-informed interpretation and hypothesis generation, not as confirmed systems-level findings. Fifth, gene filtering prior to differential expression testing included removal of genes with coefficient of variation (CV) ≥ 0.5, which could in principle exclude biologically meaningful high-variance transcripts, particularly stress-response and immune genes. To assess this, DEG analysis was repeated without CV-based filtering, retaining all 23,619 genes that passed low-count filtering alone. This yielded 320 DEGs (FDR < 0.05, |log2FC| > 1.5), of which 308 (99.0%) overlapped with the 311 DEGs identified using CV filtering, and all genes emphasized in this manuscript (Pnmt, Lcn2, Orm1, Cdkn1a, Sesn1, Nmrk2, Dbp, Ciart, Ppargc1a, Hspa1a/b, Cxcl10, Ccl2, S100a8/9) remained significant with comparable effect sizes regardless of CV filtering. This indicates that CV-based filtering did not materially influence the study's core conclusions. Sixth, because HGC and VGC groups differed in housing conditions and euthanasia timing, some Flight-vs-HGC DEGs may reflect residual environmental variation rather than spaceflight exposure alone. A direct HGC-vs-VGC comparison found that 49 of the 311 reported genes (16%), including Cdkn1a and Ppargc1a, were also differentially expressed between the two control groups and should be interpreted with some caution. However, the majority of genes emphasized in this study, including Pnmt, Lcn2, Orm1, Nmrk2, Dbp, Ciart, and Cxcl10, were not significant in the HGC-vs-VGC contrast, supporting their interpretation as spaceflight-specific effects. Seventh, this study only includes transcriptional information. Gene expression changes are not always associated with protein changes, so verification should be done through proteomics, immunohistochemistry, or functional studies. Eighth, one Vivarium Ground Control sample (V1) consistently separated from the rest of its group on PCA across multiple normalization approaches (raw log2, DESeq2 median-of-ratios, and variance-stabilizing transformation), despite passing all standard quality-control metrics (RINe = 10, rRNA contamination = 2.03%, sequencing depth = 111.8 million reads). Because this sample met every QC threshold applied to the rest of the dataset, it was retained in all analyses; however, its persistent divergence across normalization methods suggests individual biological variability among vivarium-housed animals rather than a technical artifact, and readers should be aware that this sample contributes some additional variance to the Vivarium Ground Control group in Figure 1 and the HGC-vs-VGC comparison.
Additionally, this study relies on bulk RNA-seq, which cannot distinguish between changes in gene expression within muscle fibers, shifts in the relative abundance of immune or stromal cell populations, or differences in blood contamination across samples. Reduced expression of chemokine- and DAMP-associated transcripts (Ccl2, Cxcl10, Ccl7, S100a8, S100a9) is therefore reported as a transcript-level observation and should not be interpreted as direct evidence of reduced immune cell infiltration; resolving this would require single-cell RNA-seq, deconvolution analysis, or immunohistochemistry.
Furthermore, circadian-output genes such as Dbp and Ciart are highly sensitive to sampling time, light exposure, feeding status, and acute stress, independent of any effect of microgravity itself. OSD-576 metadata confirm that light cycle (12h light/12h dark, lights on at 7:00 GMT), euthanasia method (isoflurane inhalation followed by cardiac puncture and bilateral thoracotomy), and age at euthanasia (22-23 weeks) were standardized across all three groups, ruling these out as differential confounds. However, exact time-of-day of euthanasia and feeding/fasting status at tissue collection were not recorded in the available metadata; because Flight, HGC, and VGC animals were euthanized on different calendar dates (January 14, 17, and 20, 2021, respectively), any within-day circadian phase differences or post-landing recovery timing cannot be fully excluded as contributors to the observed downregulation of circadian genes.
Finally, because the primary Flight vs. Habitat Ground Control comparison involves two groups that were both confined to spaceflight hardware, this analysis cannot fully separate microgravity-specific effects from habitat-confinement effects on its own. The direct HGC vs. VGC comparison reported above partially addresses this by identifying which genes are habitat-sensitive; however, a three-way contrast including Flight vs. VGC would further clarify which effects are attributable specifically to microgravity rather than housing hardware.
For future research, it would be interesting to conduct experiments where different time points and male and female animals are considered. Also, more muscle types, such as the soleus and gastrocnemius, should be used. An increased sample size would allow for the use of other tools that could provide more information, such as GSEA. Combining gene expression changes with proteome and metabolome data obtained in the same individuals would give more information about space flight metabolic adaptation. Finally, the pathways and genes above, specifically, Nmrk2, Ppargc1a, Dbp, and members of the Nr4a family, could be targets for pharmacological intervention to preserve the muscle in space conditions.
Conclusions
Transcriptional response of tibialis anterior muscle was characterized 38 days after spaceflight using RNA-seq data provided by NASA Rodent Research-23 mission (OSD-576). 311 significantly differentially expressed genes were identified, while overrepresentation analysis demonstrated considerable transcriptional overlap of the gene set with the gene sets associated with pulmonary fibrosis, cardiomyopathy, acute myocardial infarction, and colitis. GSEA had no significant results at the prespecified statistical threshold, most likely because of the limited sample size.
Spaceflight was associated with transcriptional changes consistent with an immunometabolic response in skeletal muscles involving upregulation of stress-related and immune-response genes (Pnmt, Lcn2, Orm1, and Cdkn1a) and inhibition of metabolic regulation genes (Nmrk2, Ppargc1a, Irs2), circadian output genes (Dbp, Ciart), and immune recruitment genes (Cxcl10, Ccl2, S100a8, S100a9). This may reflect reduced expression of chemokine- and DAMP-related transcripts. Because bulk RNA-seq cannot resolve immune-cell composition, this should not be interpreted as direct evidence of altered immune cell infiltration.
Genes discovered through this investigation could be used as targets for development of countermeasures. The severe downregulation of Nmrk2 suggests a possible intervention in the NAD⁺ salvage pathway because supplementation with nicotinamide riboside has been capable of increasing NAD⁺ content and restoring muscle functions in animal disuse models (Frederick et al., 2016). Since Ppargc1a and Dbp are also inhibited, intervention strategies targeting the circadian-metabolic axis, including timed exercise, light exposure, and PGC-1α activators, may preserve metabolic muscle homeostasis during long-term space flights. Nuclear hormone receptors Nr4a1 and Nr4a3 found in disease overlap gene sets are severely downregulated in samples from the spaceflight group, and can be another potential target for intervention, especially because of their anti-inflammatory properties and role in muscle metabolism.
Overall, the shared gene membership between spaceflight and terrestrial disease signatures generates hypotheses for future countermeasure research but does not by itself validate any specific disease model. Because GSEA did not find significant coordinated pathway enrichment, the circadian-metabolic and immunometabolic 'axis' framing presented here reflects gene-level, hypothesis-generating observations rather than statistically validated pathway-level effects. Furthermore, because Habitat Ground Control mice were also confined to spaceflight hardware, the present comparison cannot fully separate microgravity-specific effects from habitat-confinement effects; this distinction warrants direct HGC-vs-VGC comparison in future work.
Supplementary Materials
The following supporting information can be downloaded at the website of this paper posted on Preprints.org.
Data Availability Statement
RNA-seq data analyzed in this study are publicly available through the NASA Open Science Data Repository (OSDR) under accession number OSD-576, accessible at https://osdr.nasa.gov/bio/repo/data/studies/OSD-576. No new sequencing data were generated in this study. A complete table of differential expression results for all 12,633 genes tested, including baseMean, log2 fold change, standard error, Wald test statistic, p-value, and Benjamini-Hochberg adjusted p-value, is provided as Supplementary Table S1.
Acknowledgments
The author acknowledges the NASA Ames Research Center and his mentors, Ms. Jennifer Claudio and Dr. Elizabeth Blaber, as well as the Open Science Data Repository for providing access to the OSD-576 data set. The author also acknowledges the research team and staff involved in the RR-23 mission who were responsible for the RNA-seq data used in this project.
Conflicts of Interests
The authors declare no competing interests.
Author Disclosure Statement
Conflicts of interest: The author declares that there are no financial conflicts of interest. Funding sources: None. Dataset: The OSD-576 data set was downloaded from NASA's Open Science Data Repository.
References
- Akima, H; Kawakami, Y; Kubo, K; Sekiguchi, C; Ohshima, H; Miyamoto, A; Fukunaga, T. Effect of short-duration spaceflight on thigh and leg muscle volume. Med Sci Sports Exerc 2000, 32(10), 1743–1747. [Google Scholar] [CrossRef]
- Asher, G; Gatfield, D; Stratmann, M; Reinke, H; Dibner, C; Kreppel, F; Mostoslavsky, R; Alt, FW; Schibler, U. SIRT1 regulates circadian clock gene expression through PER2 deacetylation and BMAL1. Cell 2008, 134(2), 317–328. [Google Scholar] [CrossRef]
- Crucian, BE; Chouker, A; Simpson, RJ; Mehta, S; Marshall, G; Smith, SM; Zwart, SR; Heer, M; Ponomarev, S; Whitmire, A; Frippiat, JP; Douglas, GL; Lorenzi, H; Buchheim, JI; Makedonas, G; Ginsburg, GS; Ott, CM; Pierson, DL; Krieger, SS; Baecker, N; Sams, C. Immune system dysregulation during spaceflight: potential countermeasures for deep space exploration missions. Front Immunol 2018, 9, 1437. [Google Scholar] [CrossRef]
- da Silveira, WA; Fazelinia, H; Rosenthal, SB; Laiakis, EC; Kim, MS; Meydan, C; Kidane, Y; Rathi, KS; Smith, SM; Stear, B; Ying, Y; Zhang, Y; Foox, J; Zanello, S; Crucian, B; Wang, D; Nugent, A; Costa, HA; Zwart, SR; Schrepfer, S; Bhattacharya, S; Meller, R; et al. Comprehensive multi-omics analysis reveals mitochondrial stress as a central biological hub for spaceflight impact. Cell 2020, 183(5), 1185–1201.e20. [Google Scholar] [CrossRef]
- Desplanches, D. Structural and functional adaptations of skeletal muscle to weightlessness. Int J Sports Med 1997, 18 4 Suppl, S259–S264. [Google Scholar] [CrossRef]
- Fitts, RH; Riley, DR; Widrick, JJ. Physiology of a microgravity environment: invited review: microgravity and skeletal muscle. J Appl Physiol 2000, 89(2), 823–839. [Google Scholar] [CrossRef]
- Fitts, RH; Trappe, SW; Costill, DL; Gallagher, PM; Creer, AC; Colloton, PA; Peters, JR; Romatowski, JG; Bain, JL; Riley, DA. Prolonged space flight-induced alterations in the structure and function of human skeletal muscle fibres. J Physiol 2010, 588 Pt 18, 3567–3592. [Google Scholar] [CrossRef]
- Fournier, T; Medjoubi-N, N; Porquet, D. Alpha-1-acid glycoprotein. Biochim Biophys Acta 2000, 1482(1-2), 157–171. [Google Scholar] [CrossRef]
- Frederick, DW; Loro, E; Liu, L; Davila, A, Jr.; Chellappa, K; Baur, JA; et al. Loss of NAD homeostasis leads to progressive and reversible degeneration of skeletal muscle. Cell Metab 2016, 24(2), 269–282. [Google Scholar] [CrossRef]
- Gachon, F; Olela, FF; Schaad, O; Descombes, P; Schibler, U. The circadian PAR-domain basic leucine zipper transcription factors DBP, TEF, and HLF modulate basal and inducible xenobiotic detoxification. Cell Metab 2006, 4(1), 25–36. [Google Scholar] [CrossRef]
- Garrett-Bakelman, FE; Darshi, M; Green, SJ; Gur, RC; Lin, L; Macias, BR; McKenna, MJ; Meylan, C; Mishra, T; Nasrini, J; Piening, BD; Rizzardi, LF; Sharma, K; Simonsen, JB; Souza, ER; Taylor, GN; et al. The NASA Twins Study: a multidimensional analysis of a year-long human spaceflight. Science 2019, 364(6436), eaau8650. [Google Scholar] [CrossRef]
- Lecker, SH; Jagoe, RT; Gilbert, A; Gomes, M; Baracos, V; Bailey, J; Price, SR; Mitch, WE; Goldberg, AL. Multiple types of skeletal muscle atrophy involve a common program of changes in gene expression. FASEB J 2004, 18(1), 39–51. [Google Scholar] [CrossRef]
- Lee, JH; Budanov, AV; Park, EJ; Birse, R; Kim, TE; Perkins, GA; Ocorr, K; Ellisman, MH; Bodmer, R; Bier, E; Karin, M. Sestrin as a feedback inhibitor of TOR that prevents age-related pathologies. Science 2010, 327(5970), 1223–1228. [Google Scholar] [CrossRef]
- Narici, MV; de Boer, MD. Disuse of the musculo-skeletal system in space and on earth. Eur J Appl Physiol 2011, 111(3), 403–420. [Google Scholar] [CrossRef]
- NASA Open Science Data Repository (2023) OSD-576: Rodent Research-23, transcriptional profiling of tibialis anterior muscle. Available online: https://osdr.nasa.gov/bio/repo/data/studies/OSD-576.
- Peake, J; Della Gatta, P; Cameron-Smith, D. Aging and its effects on inflammation in skeletal muscle at rest and following exercise-induced muscle injury. Am J Physiol Regul Integr Comp Physiol 2010, 298(6), R1485–R1495. [Google Scholar] [CrossRef]
- Ratajczak, J; Joffraud, M; Trammell, SAJ; Ras, R; Canela, N; Boutant, M; Kulkarni, SS; Rodrigues, M; Redpath, P; Migaud, ME; Auwerx, J; Yanes, O; Brenner, C; Canto, C. NRK1 controls nicotinamide mononucleotide and nicotinamide riboside metabolism in mammalian cells. Nat Commun 2016, 7, 13103. [Google Scholar] [CrossRef]
- Rebalka, IA; Monaco, CMF; Varah, NE; Berger, T; D'souza, DM; Zhou, S; Mak, TW; Hawke, TJ. Loss of the adipokine lipocalin-2 impairs satellite cell activation and skeletal muscle regeneration. Am J Physiol Cell Physiol 2018, 315(5), C714–C721. [Google Scholar] [CrossRef]
- Riley, DA; Bain, JL; Thompson, JL; Fitts, RH; Widrick, JJ; Trappe, SW; Trappe, TA; Costill, DL. Thin filament diversity and physiological properties of fast and slow fiber types in astronaut leg muscles. J Appl Physiol 2002, 92(2), 817–825. [Google Scholar] [CrossRef]
- Sandri, M; Lin, J; Handschin, C; Yang, W; Arany, ZP; Lecker, SH; Goldberg, AL; Spiegelman, BM. PGC-1α protects skeletal muscle from atrophy by suppressing FoxO3 action and atrophy-specific gene transcription. Proc Natl Acad Sci USA 2006, 103(44), 16260–16265. [Google Scholar] [CrossRef]
- Tidball, JG. Regulation of muscle growth and regeneration by the immune system. Nat Rev Immunol 2017, 17(3), 165–178. [Google Scholar] [CrossRef]
- Tsitkanou, S; Morena da Silva, F; Cabrera, AR; Schrems, ER; Murach, KA; Washington, TA; Rosa-Caldwell, ME; Greene, NP. Biological sex divergence in transcriptomic profiles during the onset of hindlimb unloading-induced atrophy. Am J Physiol Cell Physiol 2023, 325(5), C1276–C1293. [Google Scholar] [CrossRef]
Figure 1.
Principal component analysis of all 27 tibialis anterior RNA-seq samples (Flight n=9, red; Habitat Ground Control n=9, blue; Vivarium Ground Control n=9, green) based on VST-normalized expression values. Flight samples formed a distinct cluster separated from both control groups along PC1 (51.1% variance), consistent with spaceflight as the primary driver of transcriptional differences; PC2 (10.5% variance) showed no clear separation by group. One Vivarium Control sample (V1) consistently diverged from its group across multiple normalization approaches despite normal RNA integrity (RINe=10), rRNA contamination (2.03%), and sequencing depth (111.8M reads), suggesting individual biological variability rather than a technical artifact.
Figure 1.
Principal component analysis of all 27 tibialis anterior RNA-seq samples (Flight n=9, red; Habitat Ground Control n=9, blue; Vivarium Ground Control n=9, green) based on VST-normalized expression values. Flight samples formed a distinct cluster separated from both control groups along PC1 (51.1% variance), consistent with spaceflight as the primary driver of transcriptional differences; PC2 (10.5% variance) showed no clear separation by group. One Vivarium Control sample (V1) consistently diverged from its group across multiple normalization approaches despite normal RNA integrity (RINe=10), rRNA contamination (2.03%), and sequencing depth (111.8M reads), suggesting individual biological variability rather than a technical artifact.
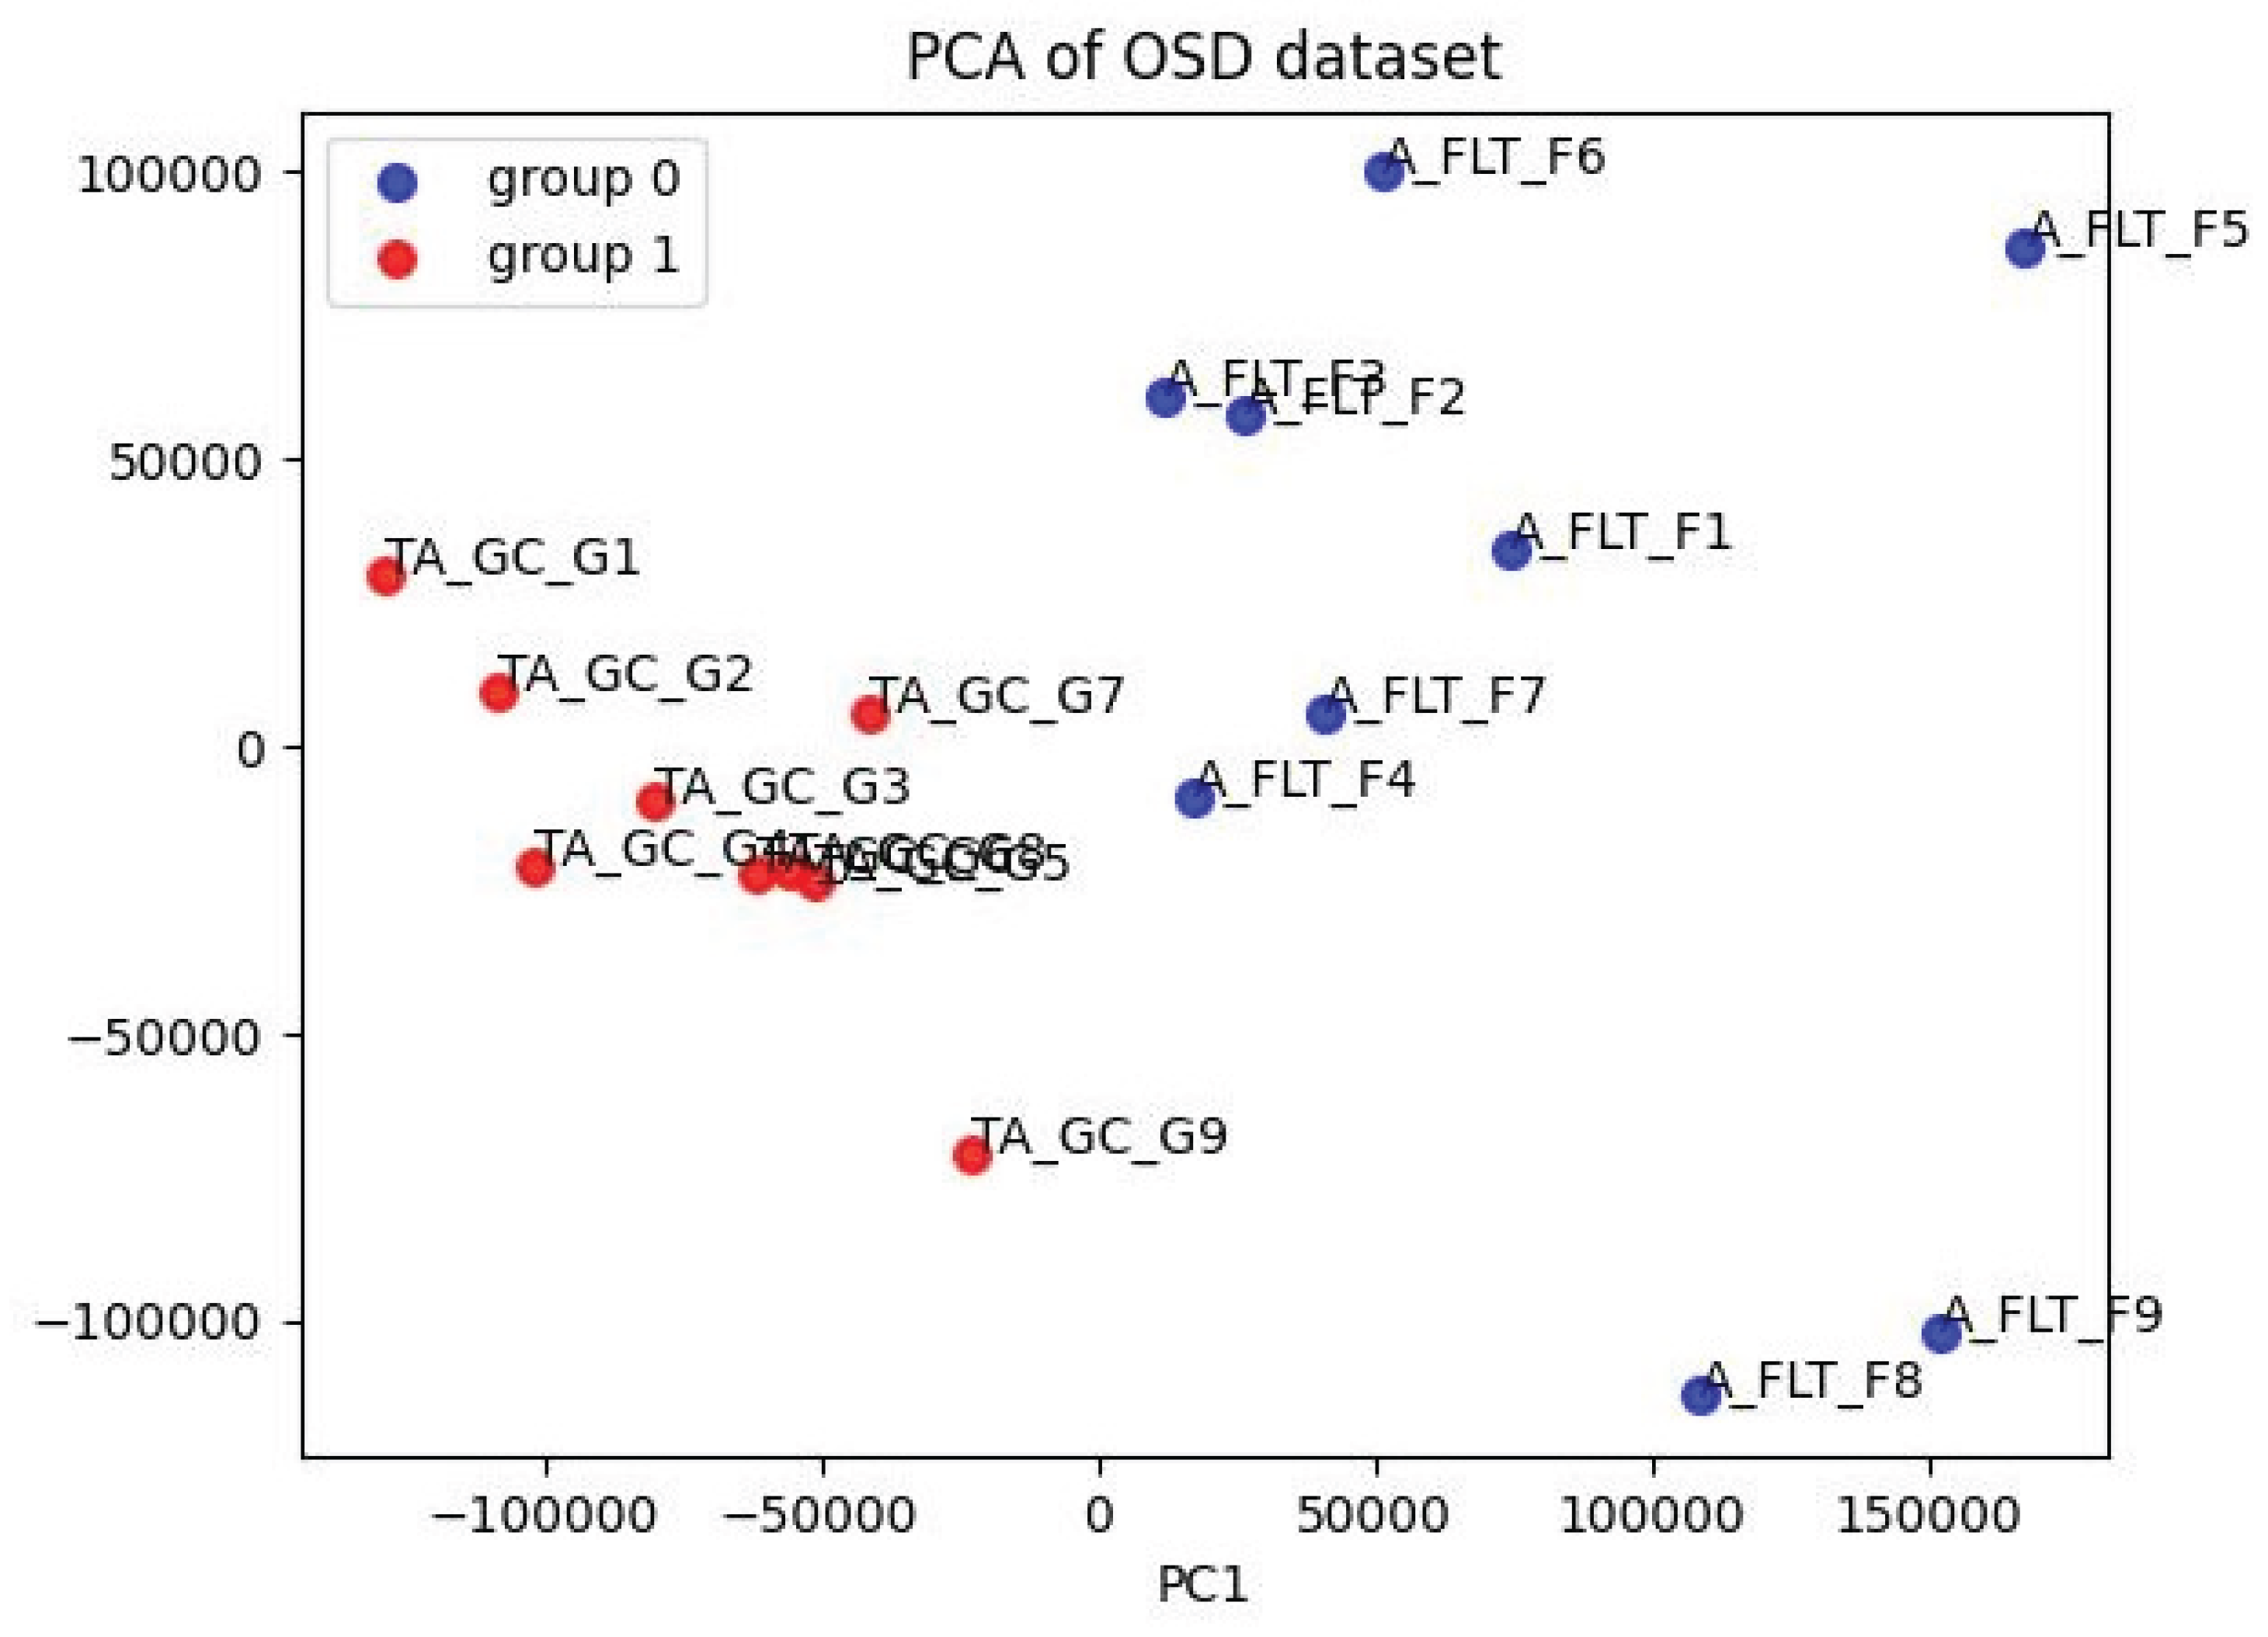
Figure 2.
Volcano plot of differential gene expression (Flight vs. Habitat Ground Control). The scatterplot includes 12,633 genes selected during filtering. The log2 fold change is shown on the x-axis, while the negative logarithm of the adjusted p-value is presented on the y-axis. The dashed vertical lines mark the cutoff point |log2FC| > 1.5, and the dashed horizontal line indicates FDR < 0.05. Colored spots refer to the 311 significant genes. Ten highly significant genes are annotated on the plot.
Figure 2.
Volcano plot of differential gene expression (Flight vs. Habitat Ground Control). The scatterplot includes 12,633 genes selected during filtering. The log2 fold change is shown on the x-axis, while the negative logarithm of the adjusted p-value is presented on the y-axis. The dashed vertical lines mark the cutoff point |log2FC| > 1.5, and the dashed horizontal line indicates FDR < 0.05. Colored spots refer to the 311 significant genes. Ten highly significant genes are annotated on the plot.
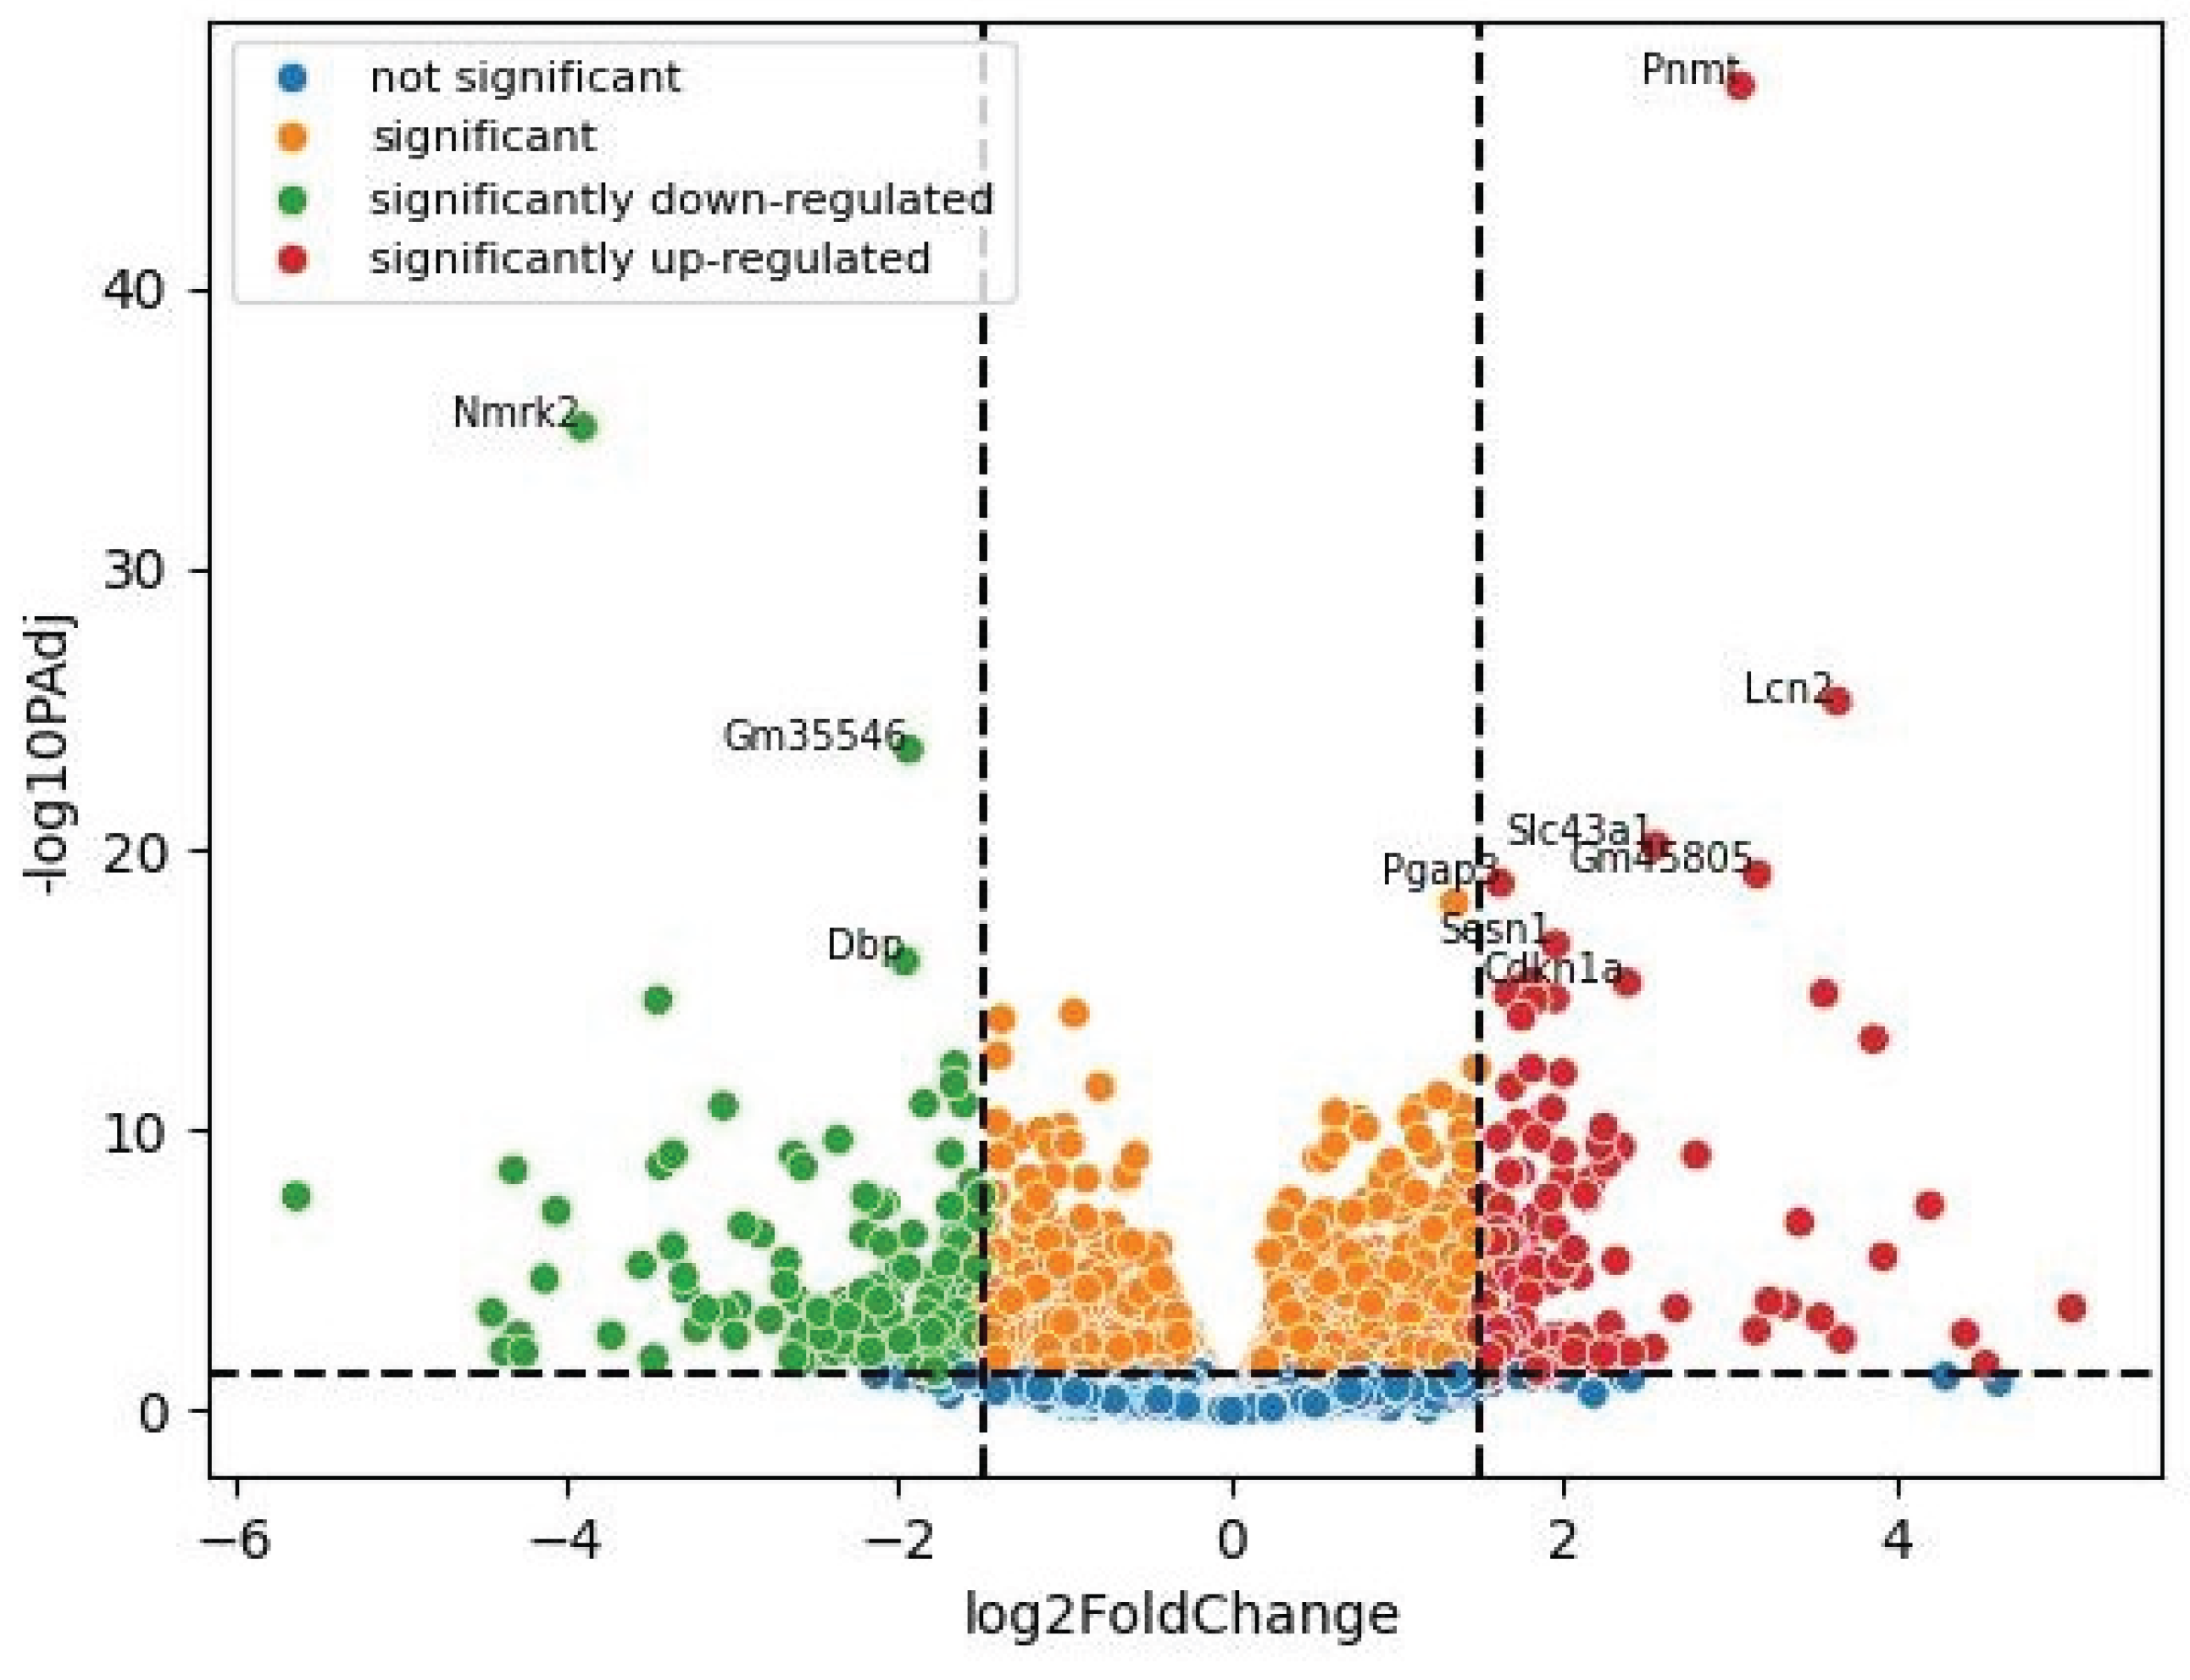
Figure 3.
Results of ORA analysis. (A) The only significantly enriched GO term across the GO Molecular Function 2025, GO Biological Process 2025, and GO Cellular Component 2025 libraries was Granulocyte Chemotaxis (GO Biological Process, adjusted p = 0.0087). (B) Top 10 enriched terms from the GEO Disease Perturbations Down library, where idiopathic pulmonary fibrosis was the most significant term (adjusted p = 1.3 × 10⁻⁸). Dot size is scaled to −log₁₀(adjusted p-value); the x-axis shows the adjusted p-value on a reversed scale (more significant on the right).
Figure 3.
Results of ORA analysis. (A) The only significantly enriched GO term across the GO Molecular Function 2025, GO Biological Process 2025, and GO Cellular Component 2025 libraries was Granulocyte Chemotaxis (GO Biological Process, adjusted p = 0.0087). (B) Top 10 enriched terms from the GEO Disease Perturbations Down library, where idiopathic pulmonary fibrosis was the most significant term (adjusted p = 1.3 × 10⁻⁸). Dot size is scaled to −log₁₀(adjusted p-value); the x-axis shows the adjusted p-value on a reversed scale (more significant on the right).
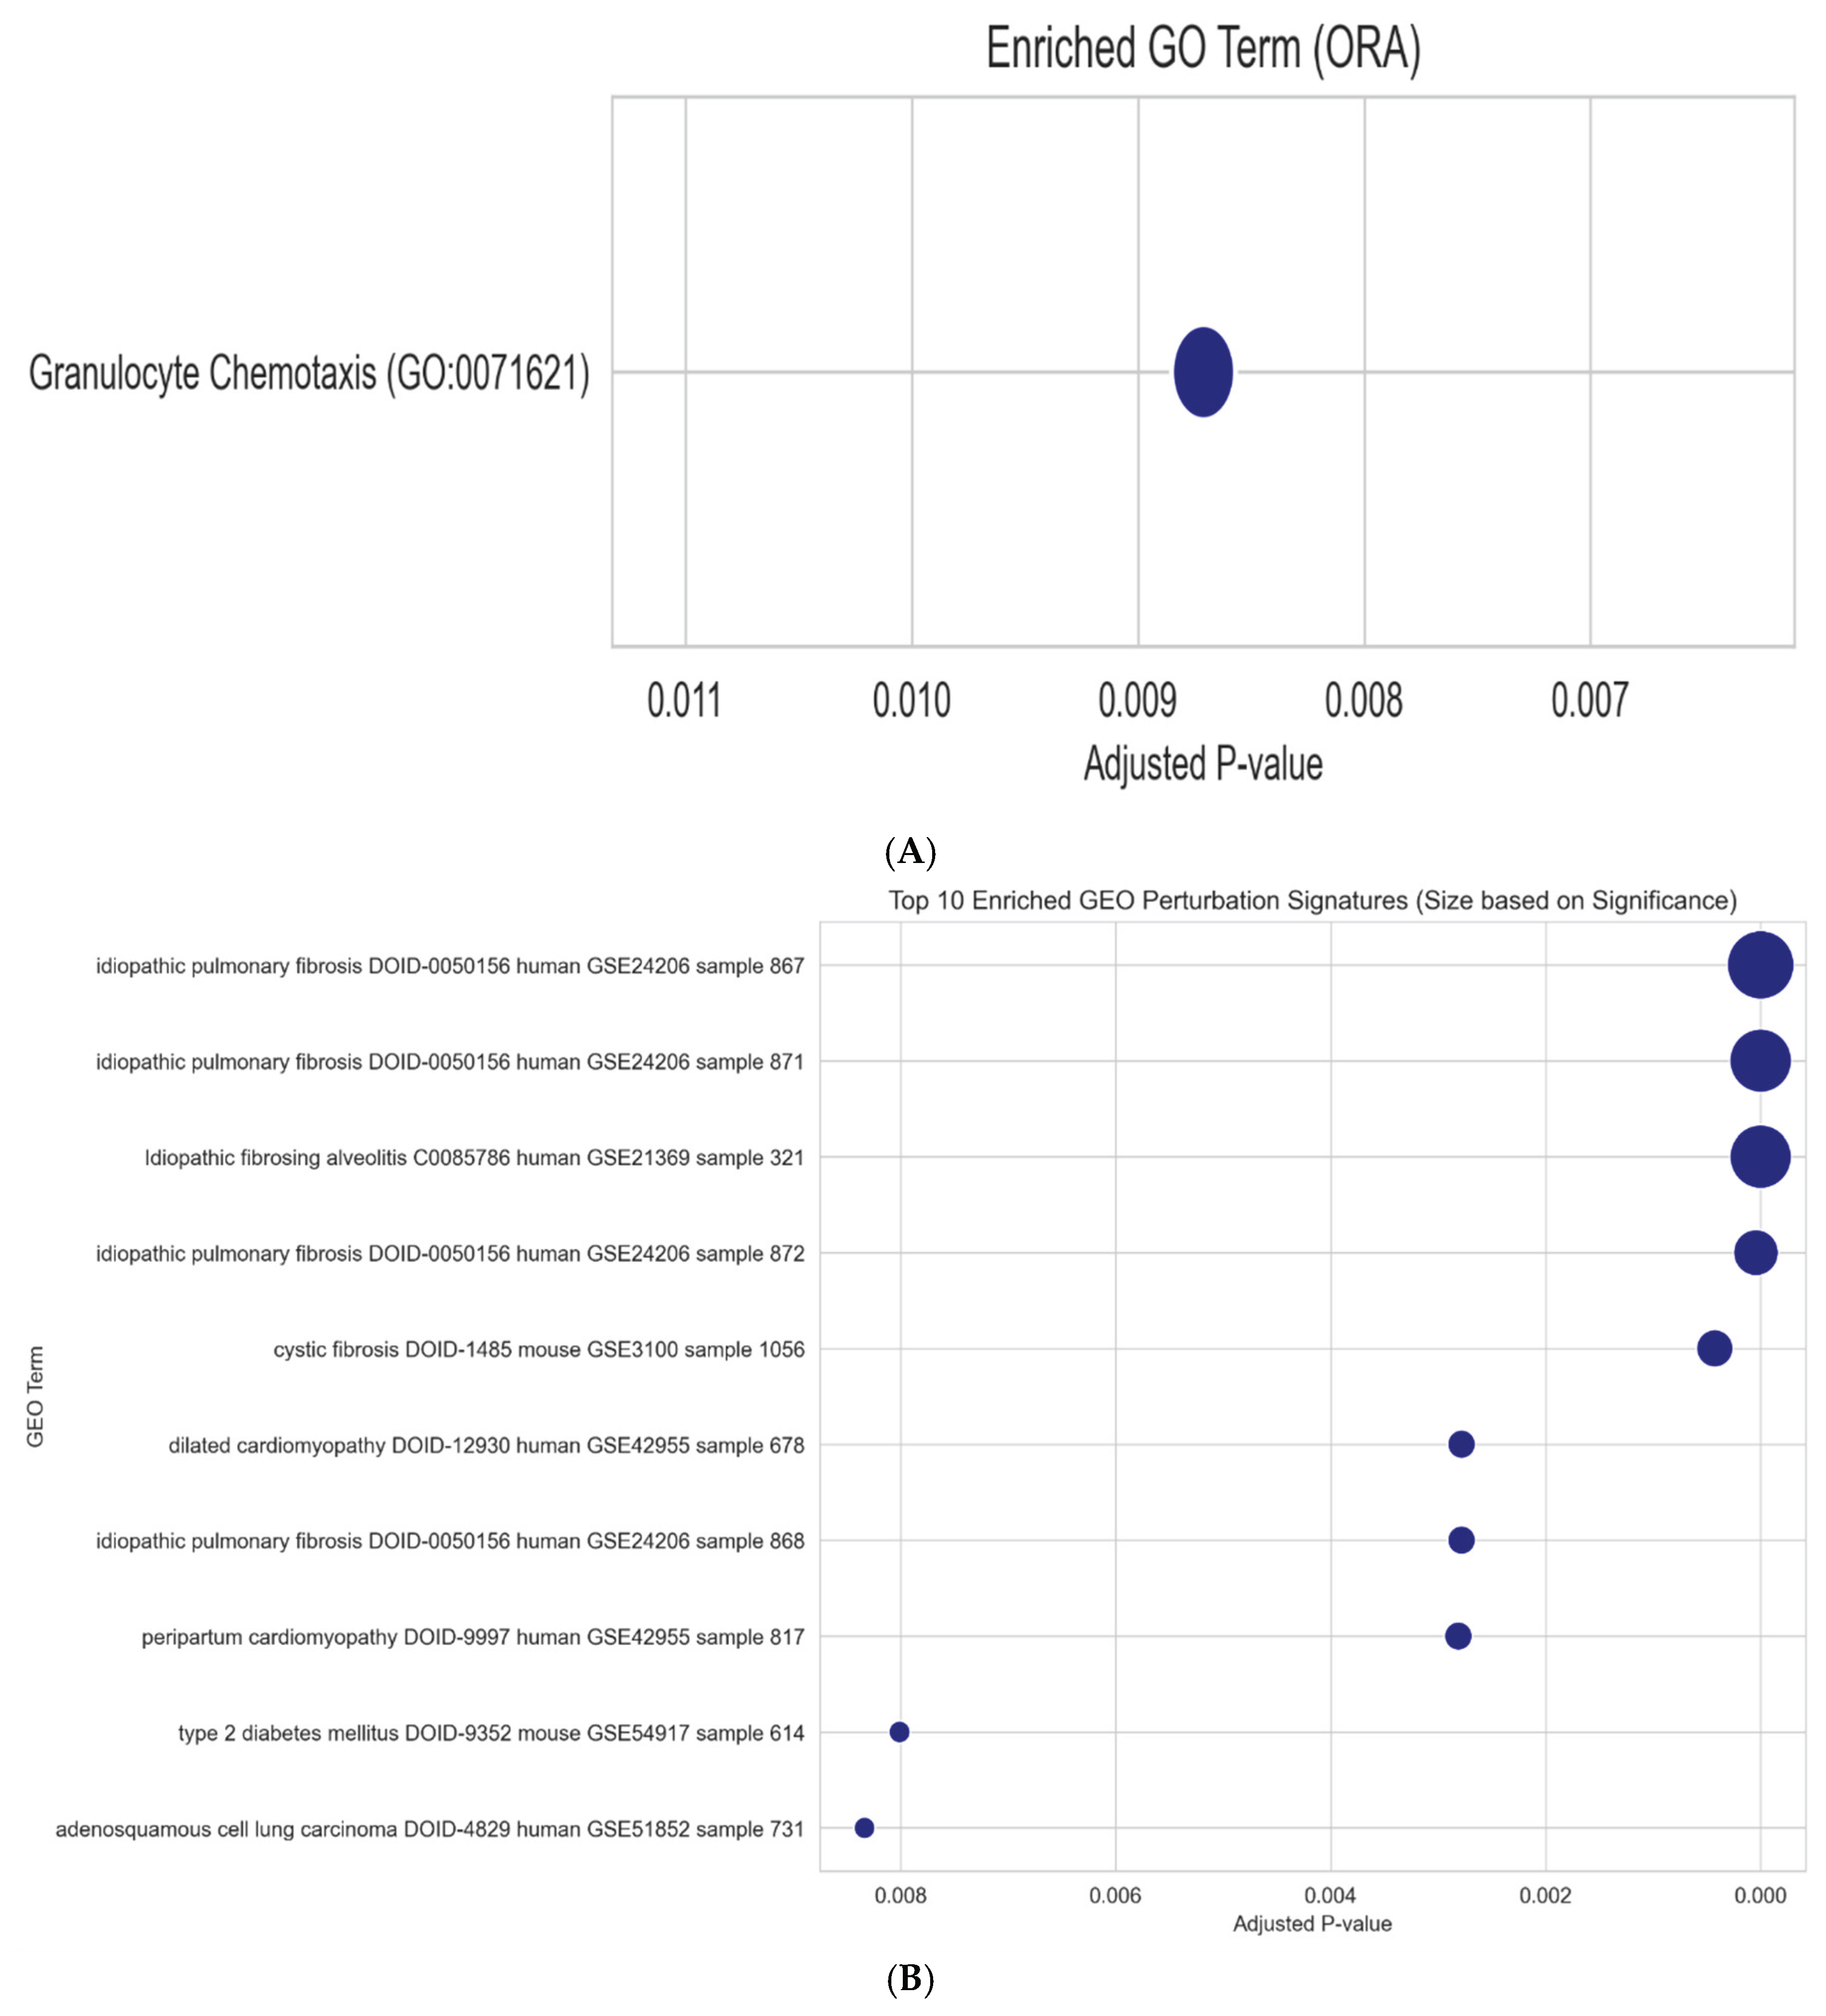

Table 1.
Selected differentially expressed genes in tibialis anterior muscle following 38 days of spaceflight (Flight vs. Habitat Ground Control; FDR < 0.05, |log2FC| > 1.5). Genes listed by statistical significance within upregulated and downregulated categories. baseMean = mean normalized count across all samples; log2FC = log2 fold change; padj = Benjamini-Hochberg adjusted p-value; Direction = Up/Down relative to Habitat Ground Control.
Table 1.
Selected differentially expressed genes in tibialis anterior muscle following 38 days of spaceflight (Flight vs. Habitat Ground Control; FDR < 0.05, |log2FC| > 1.5). Genes listed by statistical significance within upregulated and downregulated categories. baseMean = mean normalized count across all samples; log2FC = log2 fold change; padj = Benjamini-Hochberg adjusted p-value; Direction = Up/Down relative to Habitat Ground Control.
| Gene | baseMean | log2FC | Direction | padj | Function |
| Pnmt | 677.3 | +3.07 | Up | 6.4e-48 | Catecholamine biosynthesis enzyme |
| Lcn2 | 909.4 | +3.65 | Up | 5.5e-26 | Acute-phase inflammatory protein |
| Slc43a1 | 1358.4 | +2.56 | Up | 7.5e-21 | Large neutral amino acid transporter |
| Sesn1 | 3275.0 | +1.96 | Up | 2.5e-17 | Stress-responsive metabolic regulator |
| Cdkn1a | 2777.8 | +2.39 | Up | 5.7e-16 | Cell cycle inhibitor (p21) |
| Orm1 | 35.7 | +3.87 | Up | 5.9e-14 | Acute-phase reactant (orosomucoid) |
| Abhd15 | 38.1 | +1.80 | Up | 5.7e-16 | Alpha/beta hydrolase domain protein |
| Gnmt | 49.6 | +1.95 | Up | 2.1e-15 | Glycine N-methyltransferase |
| Nmrk2 | 7399.0 | -3.90 | Down | 9.2e-36 | NAD+ salvage pathway enzyme |
| Dbp | 963.0 | -1.96 | Down | 9.9e-17 | Circadian clock output gene |
| Ppargc1a | 6796.9 | -2.36 | Down | 2.3e-10 | Mitochondrial biogenesis regulator |
| Hspa1a | 527.9 | -3.45 | Down | 2.4e-15 | Heat shock protein 70 family |
| Hspa1b | 351.9 | -3.36 | Down | 7.2e-10 | Heat shock protein 70 family |
| Atf3 | 1506.0 | -3.43 | Down | 1.8e-9 | Stress-response transcription factor |
| Nr4a3 | 5908.3 | -4.06 | Down | 7.7e-8 | Nuclear receptor (metabolic/immune) |
| Cxcl10 | 10.1 | -2.34 | Down | 1.4e-4 | Chemokine (interferon-gamma induced) |
| Ccl2 | 29.8 | -2.68 | Down | 4.8e-6 | Monocyte chemoattractant protein |
| S100a8 | 84.2 | -2.61 | Down | 1.1e-4 | Damage-associated molecular pattern |
| S100a9 | 108.2 | -2.97 | Down | 1.8e-4 | Damage-associated molecular pattern |
| Ciart | 496.7 | -1.99 | Down | 1.6e-5 | Circadian repressor |
Table 2.
ORA disease signature overlap. Selected significantly enriched disease gene sets from GEO Disease Perturbations libraries (adjusted p < 0.05). Combined score = Enrichr combined score. Key overlapping genes listed where available.
Table 2.
ORA disease signature overlap. Selected significantly enriched disease gene sets from GEO Disease Perturbations libraries (adjusted p < 0.05). Combined score = Enrichr combined score. Key overlapping genes listed where available.
| Library | Disease Term | Adj. p | Comb Score | Key Overlap Genes | Direction Concordance |
| GEO Down | Idiopathic Pulmonary Fibrosis | 1.3e-8 | 149.4 | Csrnp1, Orm1, Pfkfb3, Cebpd, Irs2, Cxcr2, Nr4a1, Nr4a3 | Mixed: Orm1 is upregulated in flight but listed as downregulated in IPF (opposite); others concordant |
| GEO Down | Idiopathic Pulmonary Fibrosis (2) | 1.1e-7 | – | Overlapping set | |
| GEO Down | Idiopathic Pulmonary Fibrosis (3) | 4.4e-5 | – | Overlapping set | |
| GEO Down | Idiopathic Fibrosing Alveolitis | 1.2e-7 | – | Overlapping set | |
| GEO Down | Cystic Fibrosis | 4.3e-4 | – | – | |
| GEO Down | Dilated Cardiomyopathy | 2.8e-3 | – | Ciart, Ky, Cxcl10, Cebpd | Concordant (all downregulated in both) |
| GEO Down | Type 2 Diabetes | 8.0e-3 | – | – | |
| GEO Up | Acute Myocardial Infarction | 2.4e-5 | 75.4 | Cdkn1a, Lcn2, Rcan1, Atf3, Ankrd1, Hspa1b, S100a8, S100a9 | Mixed: Atf3, Hspa1b, S100a8, S100a9 are downregulated in flight but listed as upregulated in MI (opposite); Cdkn1a, Lcn2 concordant |
| GEO Up | Basal Cell Carcinoma | 2.4e-5 | 78.6 | – | |
| GEO Up | Colon Cancer | 2.4e-5 | – | – | |
| GEO Up | Colitis | 2.4e-5 | – | – | |
| GEO Up | Glaucoma-associated syndromes | 7.6e-5 | – | – | |
| GEO Up | Psoriasis | 7.6e-5 | – | – | |
| GEO Up | Type 2 Diabetes | 1.9e-2 | – | – |
Disclaimer/Publisher’s Note: The statements, opinions and data contained in all publications are solely those of the individual author(s) and contributor(s) and not of MDPI and/or the editor(s). MDPI and/or the editor(s) disclaim responsibility for any injury to people or property resulting from any ideas, methods, instructions or products referred to in the content. |
© 2026 by the authors. Licensee MDPI, Basel, Switzerland. This article is an open access article distributed under the terms and conditions of the Creative Commons Attribution (CC BY) license (http://creativecommons.org/licenses/by/4.0/).
Copyright: This open access article is published under a Creative Commons CC BY 4.0 license, which permit the free download, distribution, and reuse, provided that the author and preprint are cited in any reuse.