

Submitted:
06 October 2026
Posted:
08 October 2026
You are already at the latest version
Abstract
Notebook Coding is a multi-dimensional open science software project structured as a modular collection of reactive Observable notebook cells designed to compute and visualize nineteen bibliometric indicators for academic journals managed in Open Journal Systems (OJS) using OpenAlex. Operating across three distinct levels, it functions as: (1) a client-side software architecture querying the OpenAlex REST API via a rate-limited concurrency queue; (2) an embeddable, live bibliometric dashboard for OJS editorial management using responsive <iframe> elements; and (3) a forkable pedagogical tool for hands-on bibliometric training in library and information science (LIS) programs. By shifting from offline data processing to client-side web rendering, it offers editors, librarians, and students an open, inspectable alternative without requiring commercial database subscriptions.
Keywords:
bibliometrics
; open source
; OpenAlex
; observable notebooks
; open journal systems (OJS)
; JavaScript
1. Introduction
Editorial teams of journals hosted on OJS [1] in Latin America and the Caribbean rarely have institutional access to Scopus, Scimago Journal Rank, or Web of Science [2]. This limits their capacity to evaluate and analyze their own production, disproportionately affecting open-access journals not indexed in commercial databases. The native OJS statistics module [1] reports COUNTER-compliant page views and downloads [3] for a specific installation, but these data do not always guarantee historical continuity and do not cover bibliometric indicators such as citation counts or author productivity measures [10]. Consequently, this study proposes using OpenAlex, an emerging bibliographic database that has gained significant traction in recent years. The data source landscape for bibliometric analysis has undergone a remarkable transformation with the emergence of open alternatives to traditional databases. Macêdo, Schiessl, and Shintaku [4] emphasize this phenomenon in their analysis of OpenAlex for bibliometric studies, concluding that the platform constitutes a viable and effective alternative capable of complementing traditional metric sources, particularly for comparative analyses of publications and citations [4].
Editors, librarians, and library and information science (LIS) students seeking to learn applied bibliometrics are often trained on proprietary interfaces or desktop software that require local installation, expensive subscriptions, or intensive data processing training. These tools can be inaccessible to small journals, resource-constrained institutions, or training programs requiring reproducible and inspectable examples.
Currently, no single tool integrates real-time querying, open APIs, and native embedding into an editorial CMS such as OJS. Instead, the ecosystem remains fragmented, with tools covering only one or two of these requirements, such as VOSviewer, Bibliometrix/Biblioshiny, and Publish or Perish [5,6,7,8]. Although these tools are well consolidated in bibliometric practice, their ease of use can also foster the generation of visually appealing results without a sufficient understanding of underlying methodological foundations. As Repiso Caballero and Cabezas Clavijo [9] warn, the user-friendliness of certain software can lead to flashy outputs without an adequate grasp of the bibliometric procedures employed.

Table 1.
This is a table. Tables should be placed in the main text near the first time they are cited.
Table 1.
This is a table. Tables should be placed in the main text near the first time they are cited.
| Feature | Notebook Observable | VOSviewer | Bibliometrix | Biblioshiny | Jupyter Notebook |
| Open bibliographic data | (1) | Partial | Depends | Depends | (1) |
| OpenAlex API integration | (1) | Partial | (1) | (1) | (1) |
| Browser-based | (1) | X | X | (1) | (1)* |
| No local installation | (1) | X | X | (1) | X* |
| Direct OJS embedding | (1) | X | X | X | X |
| Literate programming | (1) | X | Partial | Partial | (1) |
| Executable/interactive cells | (1) | X | X | Partial | (1) |
| Educational orientation | (1) | X | X | Partial | (1) |
| Reusable/forkable code | (1) | X | (1) | (1) | (1) |
| Reproducible execution | (1) | Partial | (1) | Partial | (1) |
| Bibliometric visualization | (1) | (1) | (1) | (1) | (1) |
| Network analysis | Partial | (1) | (1) | (1) | (1) |
| Embeddable as a web component | (1) | X | X | X | Partial |
| Programming knowledge required | Low–Medium | Low | Medium–High | Low | Medium–High |
1 To further position Notebook Coding within the existing bibliometric software ecosystem, Table I compares its main functional characteristics with those of VOSviewer, Bibliometrix, Biblioshiny, and Jupyter Notebook. The comparison focuses on open data access, OpenAlex integration, browser-based execution, reproducibility, executable notebooks, educational use, and integration with OJS. The comparison highlights that Notebook Coding combines characteristics that are typically distributed across different tools.
2. Materials and Methods
2.1. Implementation and Architecture
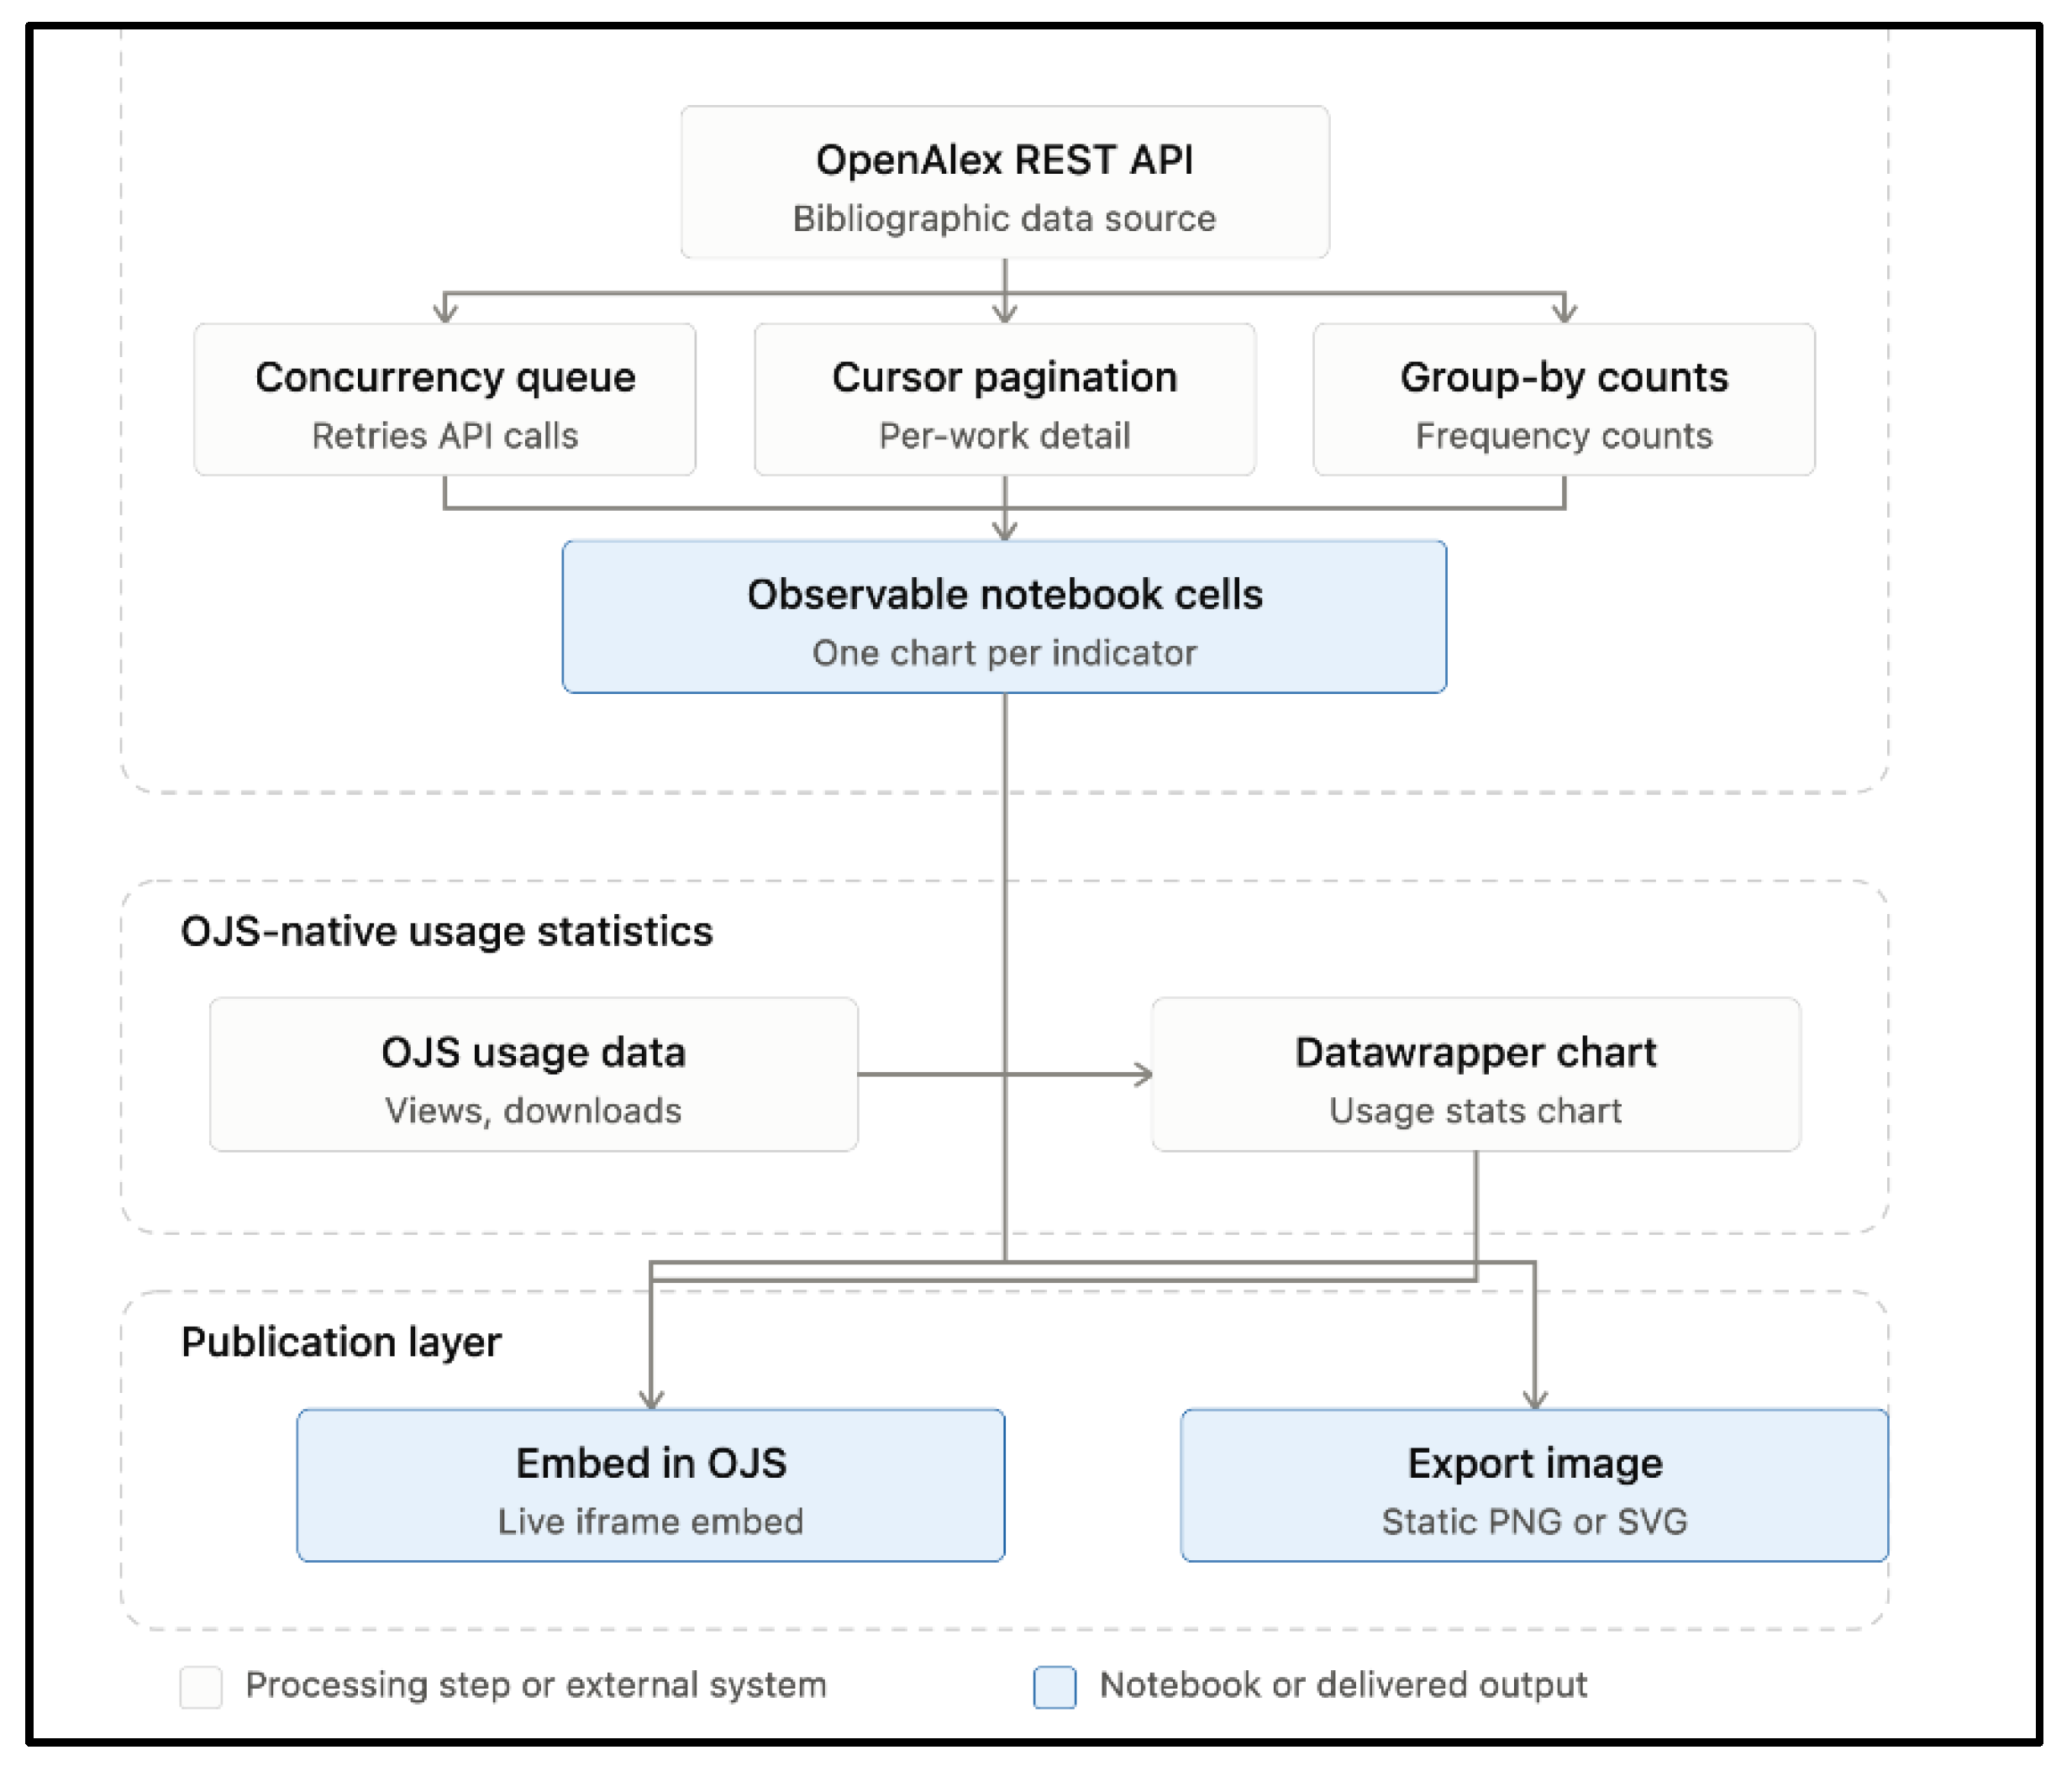
Implementation and architecture Notebook Coding is structured as a set of independent cells within Observable notebooks [13], each corresponding to a single bibliometric indicator and connected to the OpenAlex REST API [11]. Three request patterns are employed depending on indicator requirements:
- A rate-limited concurrency queue with exponential backoff for standard API requests.
- Cursor-based pagination for indicators requiring article-level granular details
- Server-side aggregation using group_by for frequency-only metrics.
Native OJS usage statistics [1] (page views and downloads), which fall outside OpenAlex bibliographic coverage, are visualized separately using Datawrapper [14] based on exported OJS data. Each OpenAlex-based indicator can be embedded into a live OJS instance as a responsive <iframe> pointing to a published Observable cell [13] or exported as a static PNG/SVG image.
Figure 1.
Diagram shows the logical flow.
2.3. Rate-Limited, Fault-Tolerant Access
Requests to OpenAlex are managed through a bounded concurrency queue utilizing a semaphore capped at three concurrent requests (maxConcurrent = 3). Pending requests are held in a FIFO queue, ensuring that total concurrent requests never exceed the threshold even when multiple indicators request data simultaneously.
Every request includes the mailto parameter, identifying the party responsible for API usage and granting access to OpenAlex’s polite pool [15]. Access credentials (mailto and api_key) are managed via environment variables or secrets rather than hardcoded in public scripts.
When OpenAlex returns an HTTP 429 response, the request retries up to six times. Wait time is calculated as:
where k ∈ {0,1,…,5} represents the retry attempt, r is the wait time in seconds specified by Retry-After, and U(0,300) is a uniform random jitter term in milliseconds that prevents retry synchronization.
twait(k) = {1000 ⋅ r if the response carries a Retry − After header r 600 ⋅ 2k + u, u∼U(0,300) ms otherwise
2.4. Exhaustive Corpus Retrieval
Indicators that need per-article detail (author productivity, the most cited works, citation provenance) page through the journal’s entire corpus using OpenAlex’s cursor pagination, starting at cursor = “*”, requesting per_page = 200 works per call, and continuing while meta.next_cursor is present. A journal with N works is retrieved in ⌈N/200⌉ requests, each routed through the same queue and retry logic described above. In general, if a query retrieves N works using a page size of p, the approximate number of requests is
OpenAlex’s current documentation states that per_page=100 is the maximum supported for general list queries, while grouped (group_by) queries can return up to 200 groups per page and can likewise be paginated with a cursor for more (OpenAlex, 2026a; OpenAlex, 2026b). The full-corpus-retrieval cells in this project request per_page=200, a value above the general limit currently documented for listing works; it is recommended to verify the actual meta.per_page value returned by the API before assuming that Q=⌈N/p⌉ holds exactly with p = 200.
Figure 2.
Annual Output and Citations Received for REDC (Source: OpenAlex).
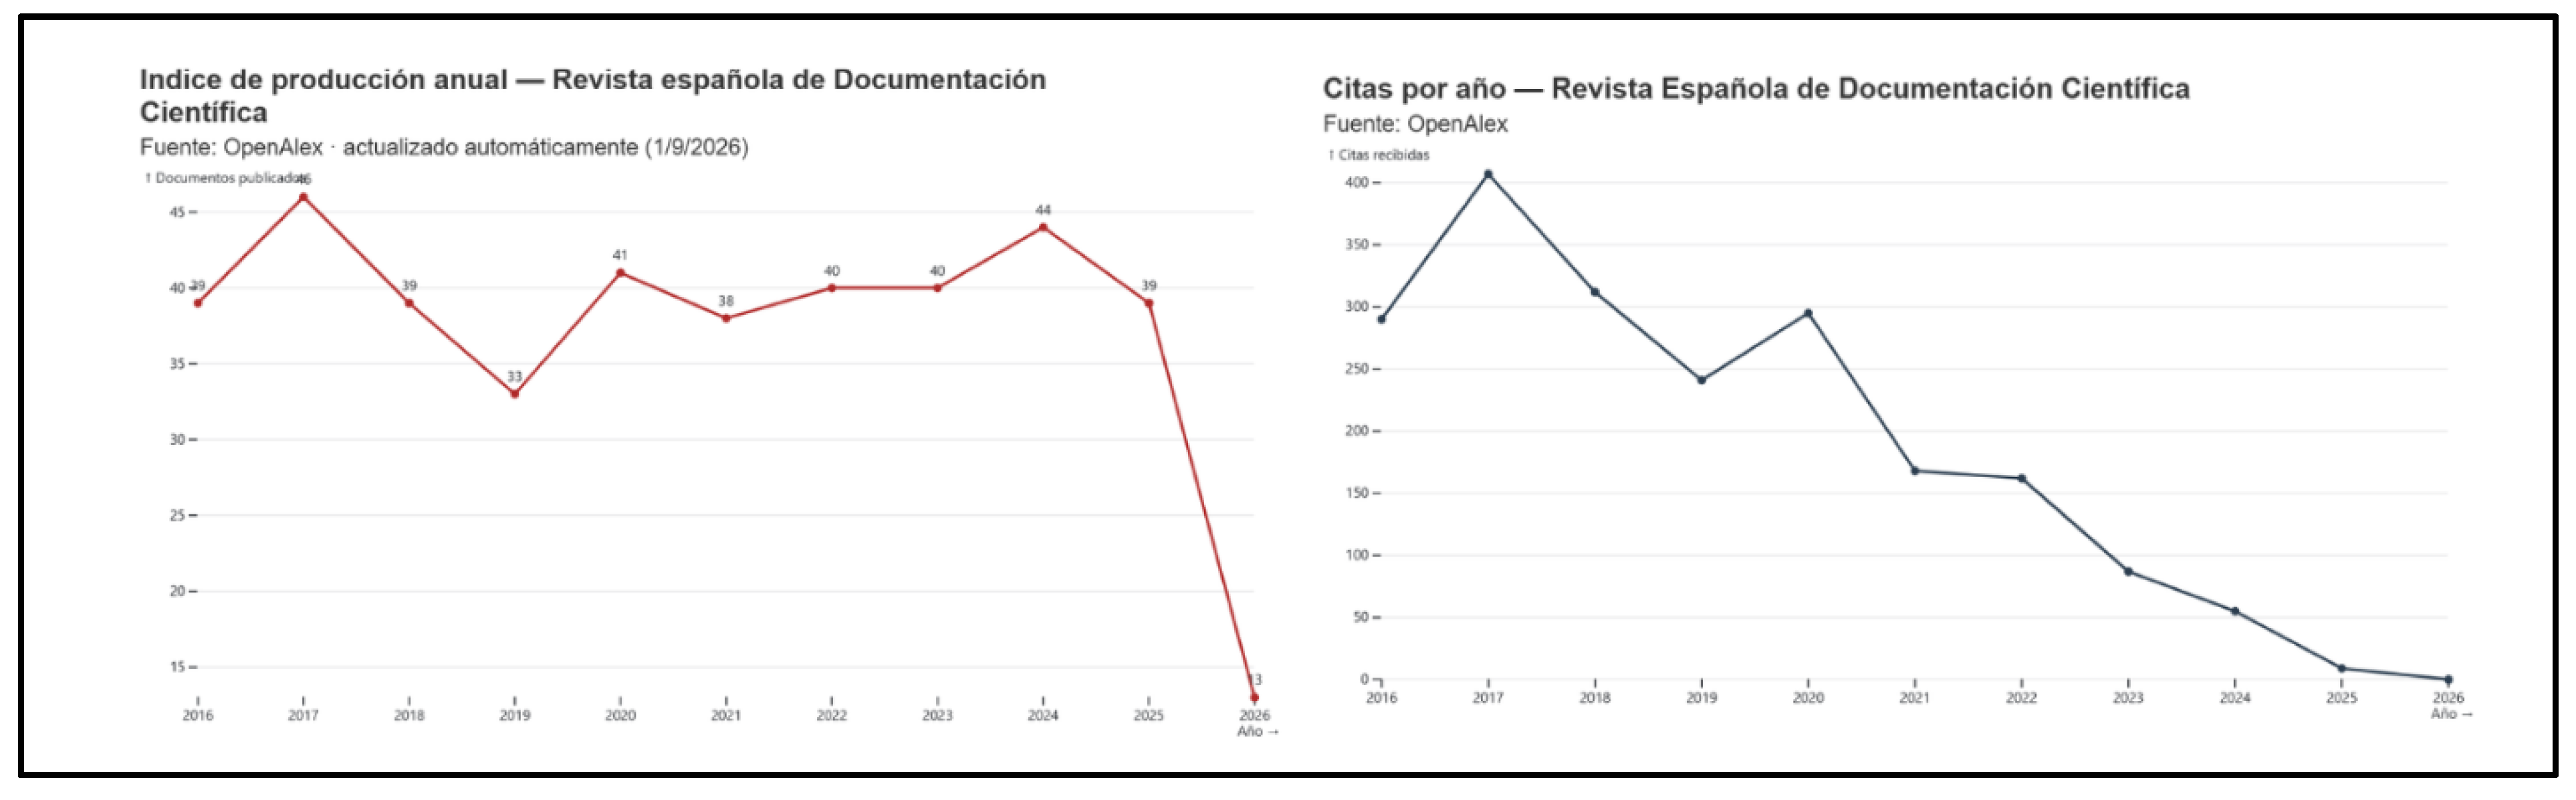
Figure 3.
Top 10 Most Cited Articles in REDC (OpenAlex).
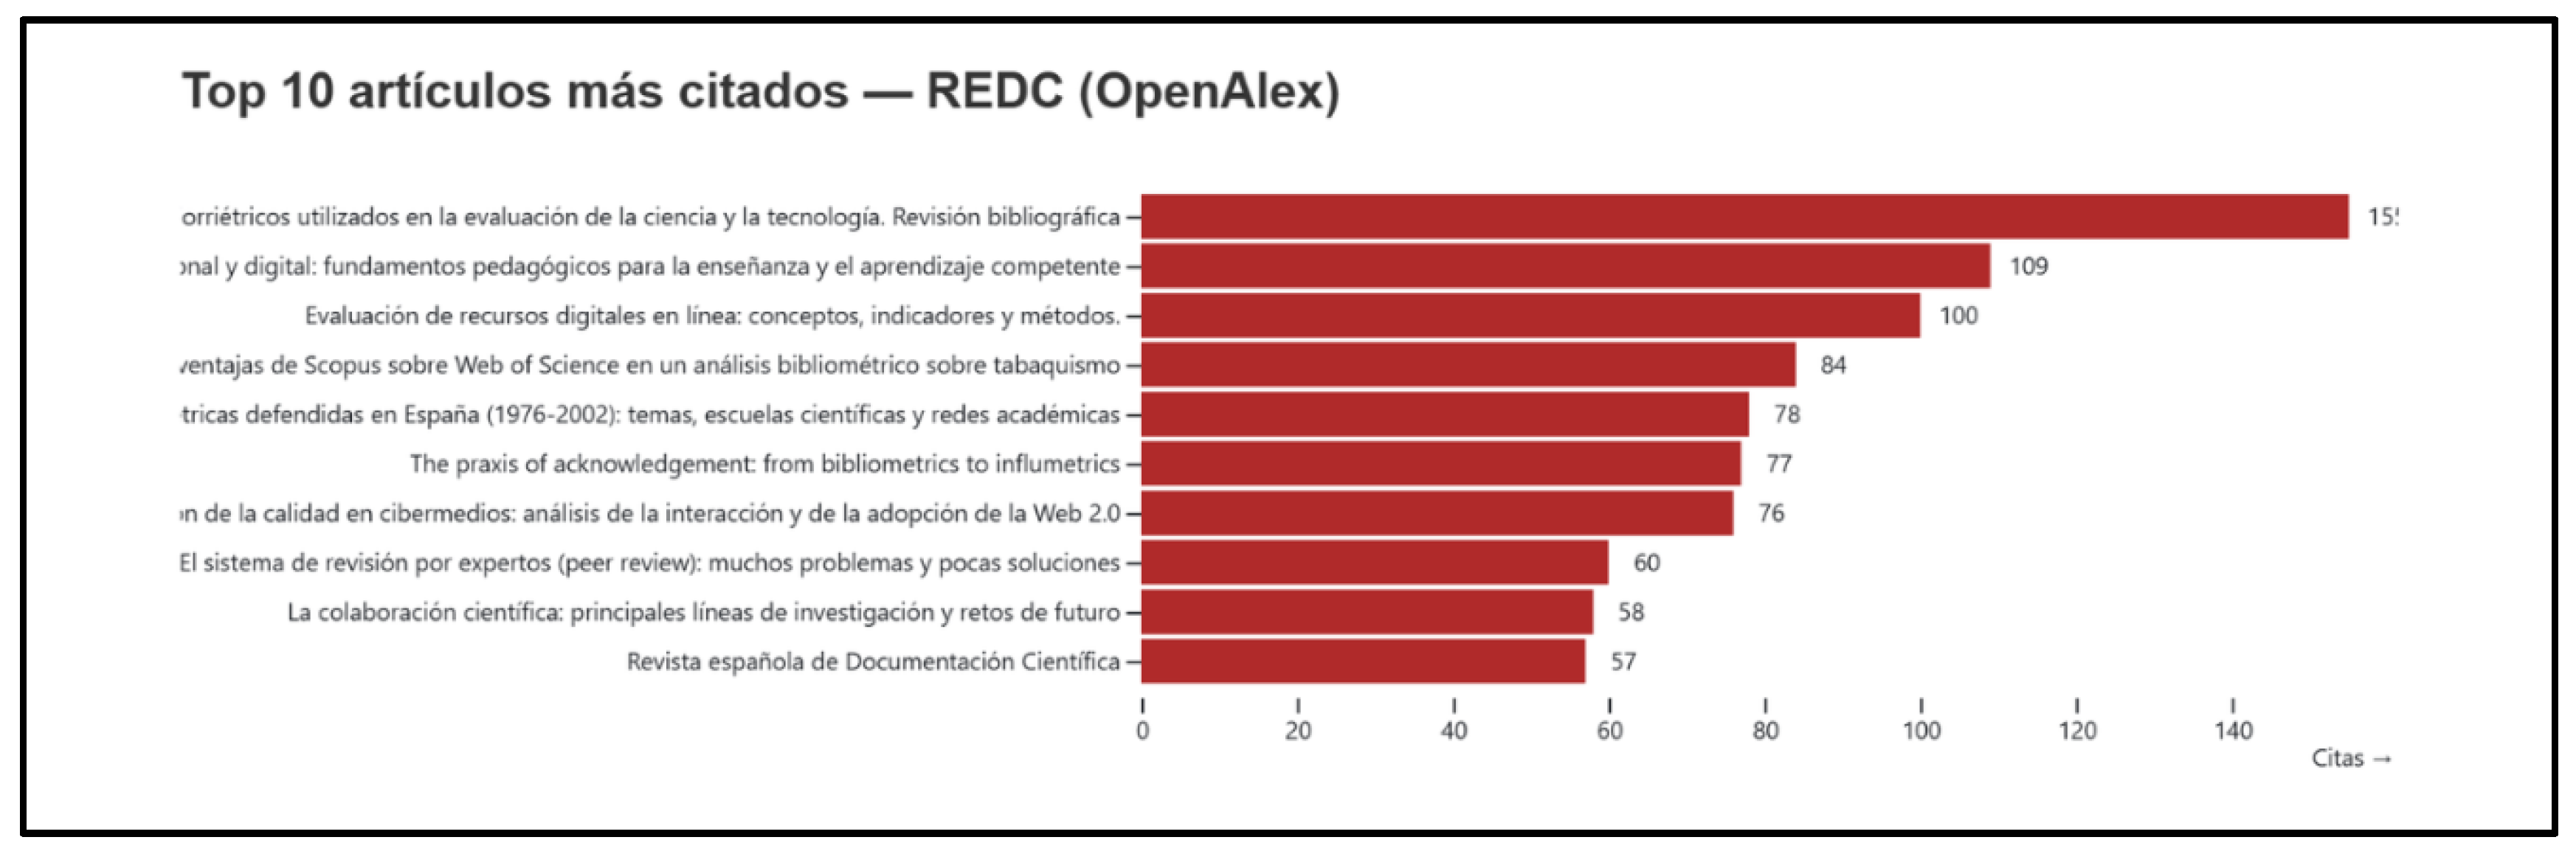
Figure 4.
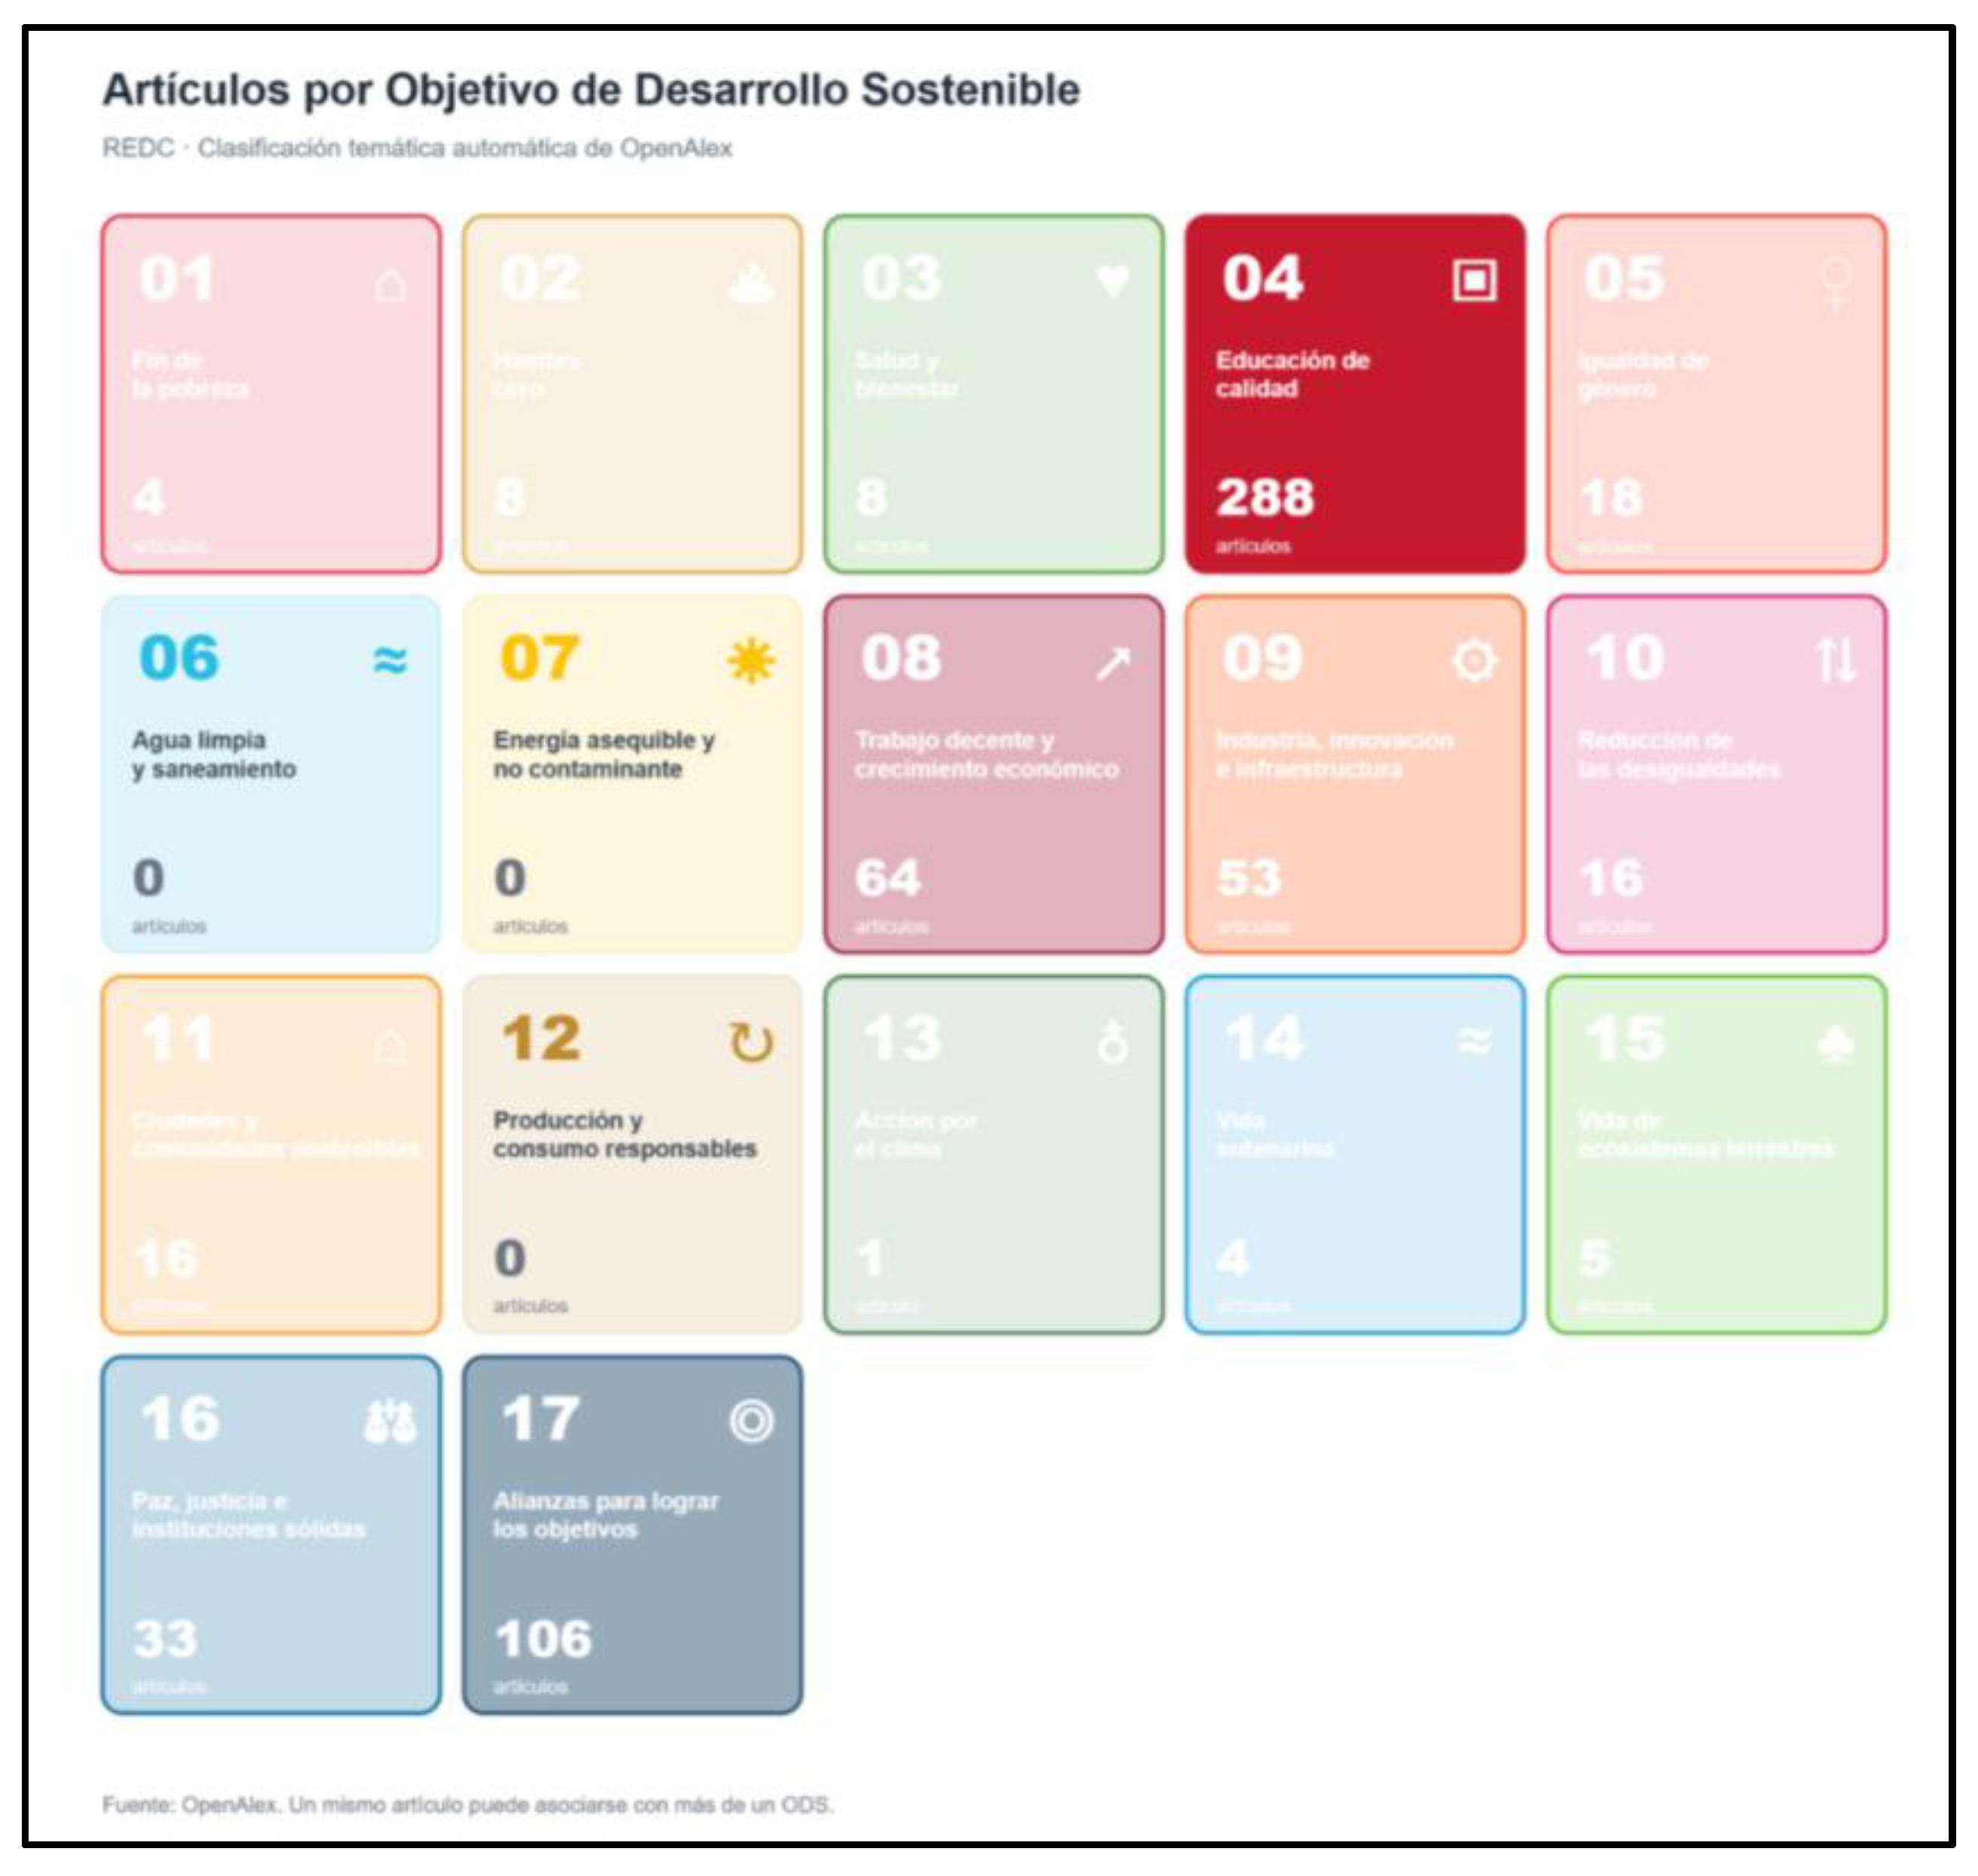
REDC Article Classification by UN Sustainable Development Goals (SDGs).
2.5. Server-Side Aggregation
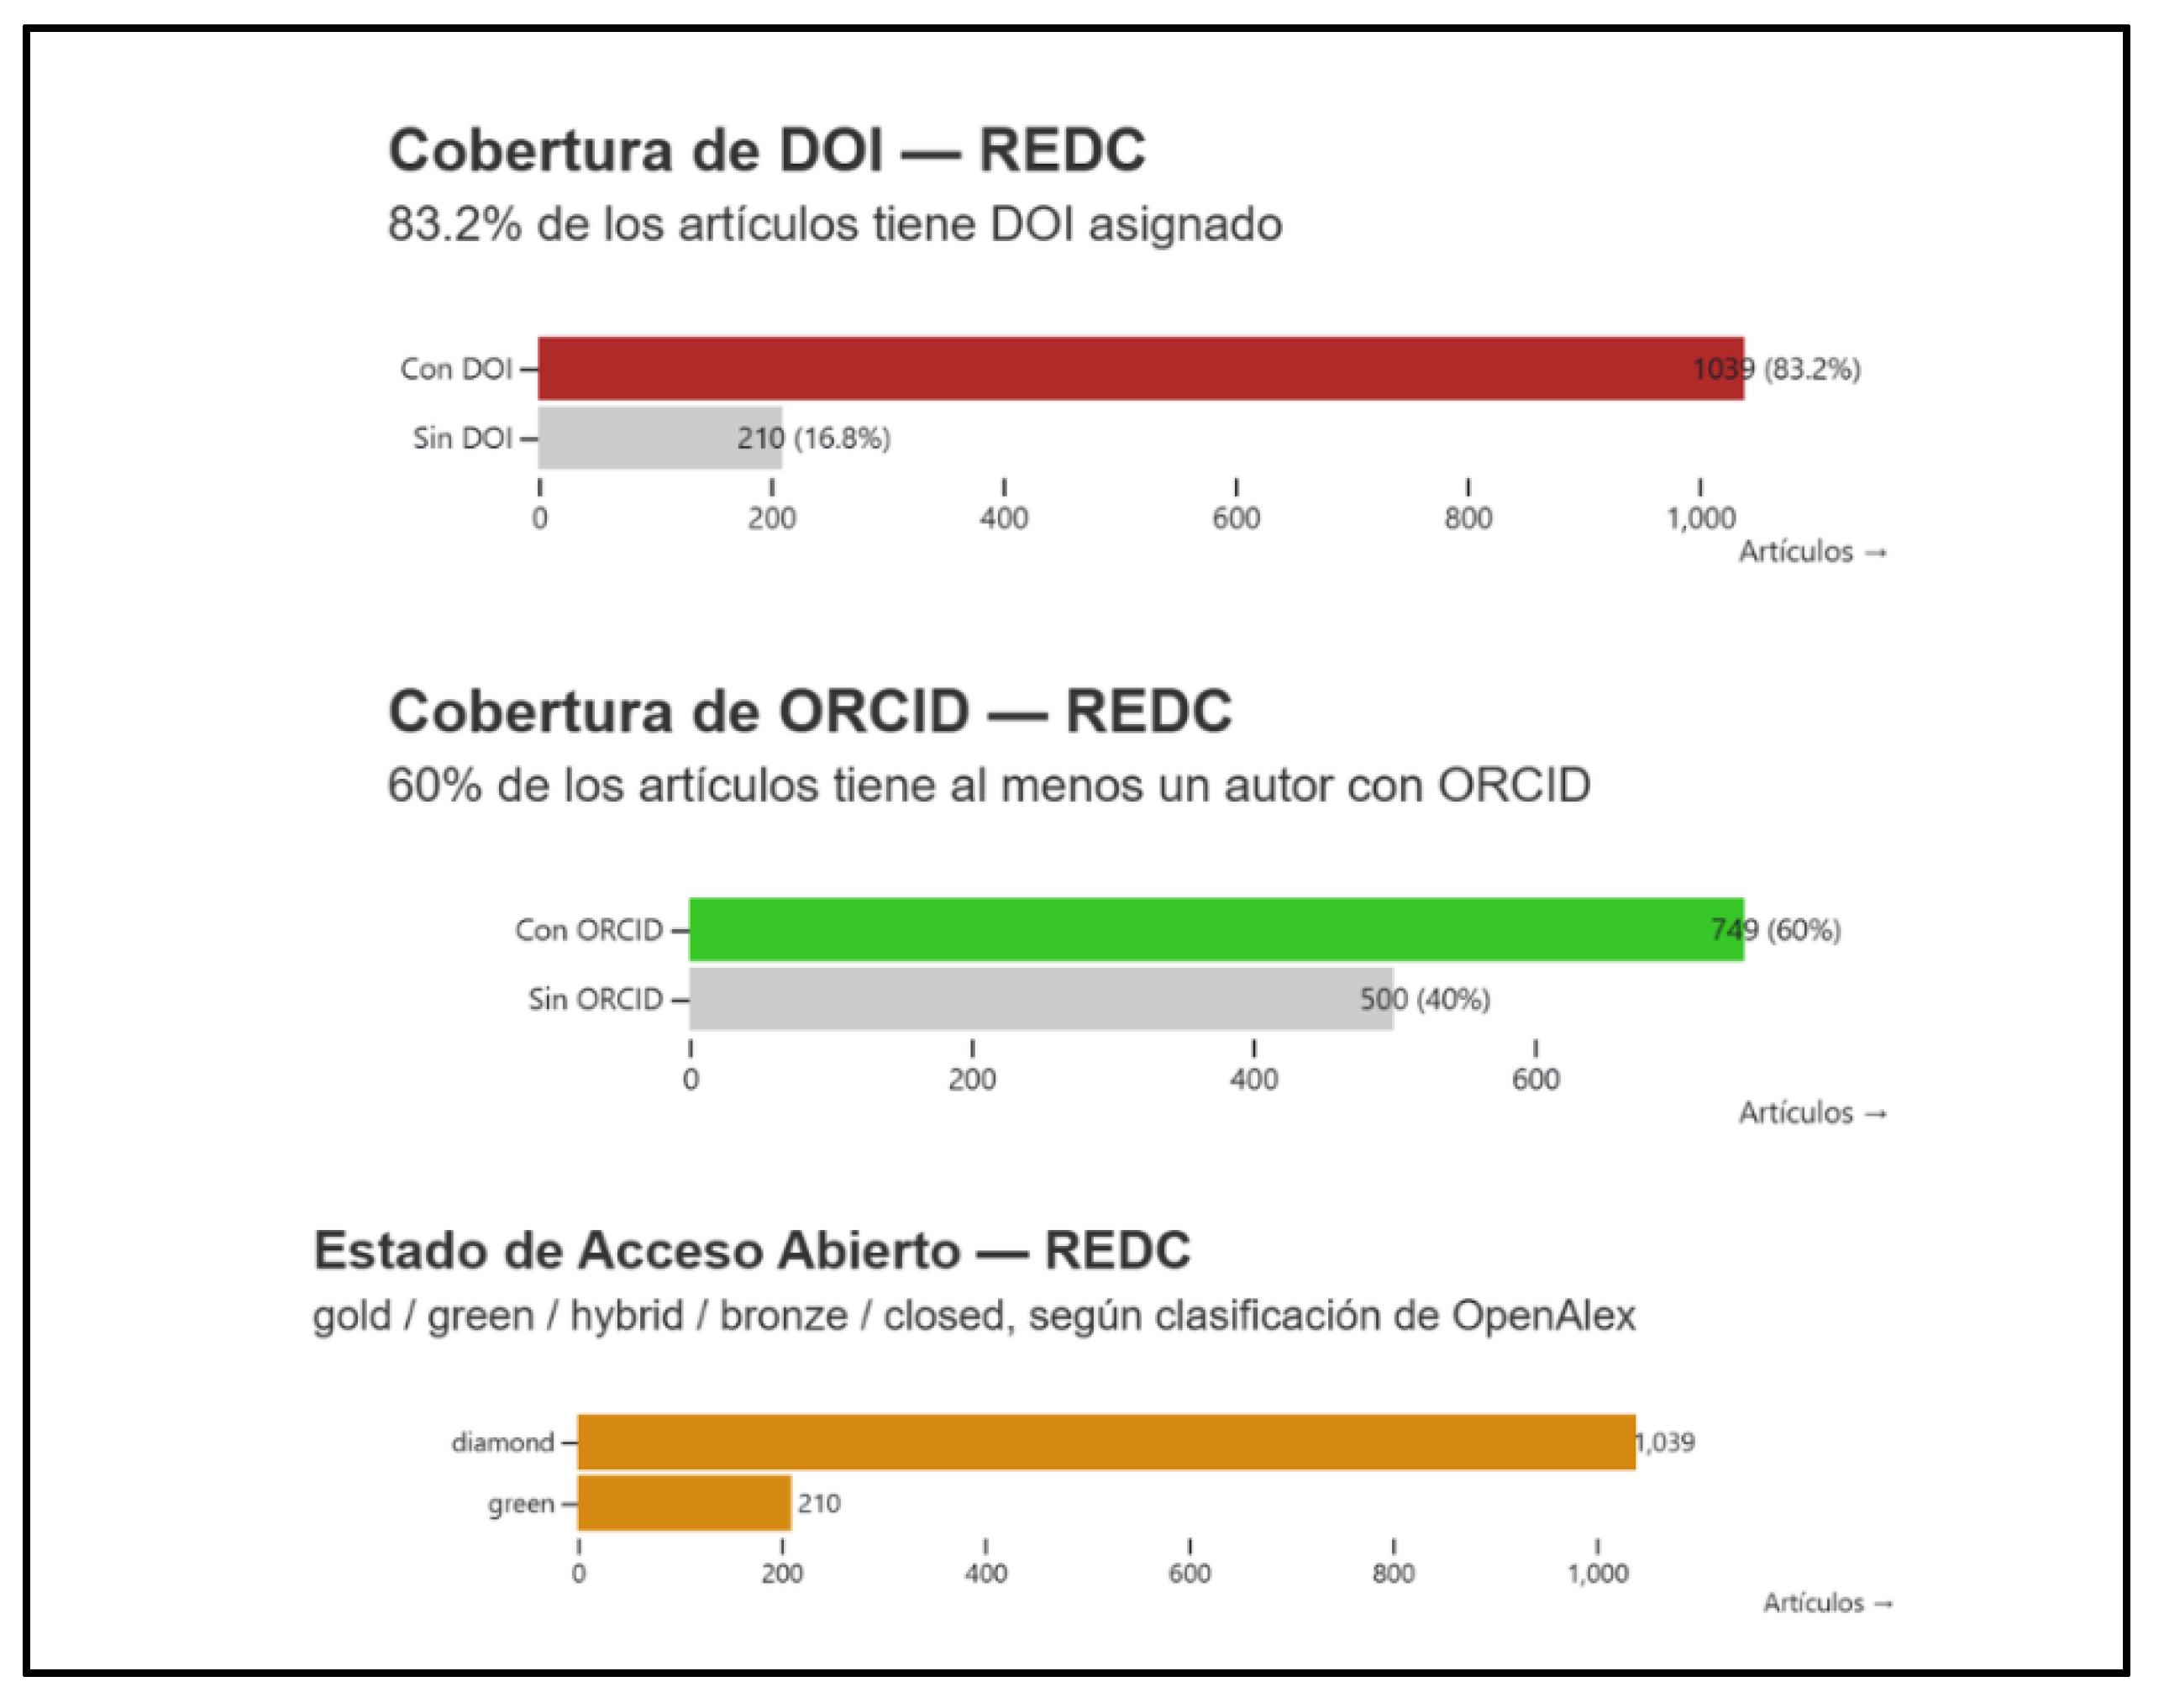
Indicators that only need frequency counts are computed using OpenAlex’s group_by parameter: SDG coverage, DOI coverage [22], ORCID coverage [23], open-access status, author concentration, distribution by country, and institutional concentration. OpenAlex returns groups with their respective counts, which the notebook reshapes into structures suitable for visualization. For a coverage indicator, the proportion is defined as:
This section may be divided by subheadings. It should provide a concise and precise description of the experimental results, their interpretation, and the experimental conclusions that can be drawn.
If ntotal = 0, the indicator is returned as unavailable rather than zero, to avoid confusing an absence of data with an absence of the phenomenon itself.
Figure 5.
Metadata Coverage Indicators (DOI & ORCID); Open Access Status Distribution in REDC.
2.6. Author Productivity and Lotka’s Law
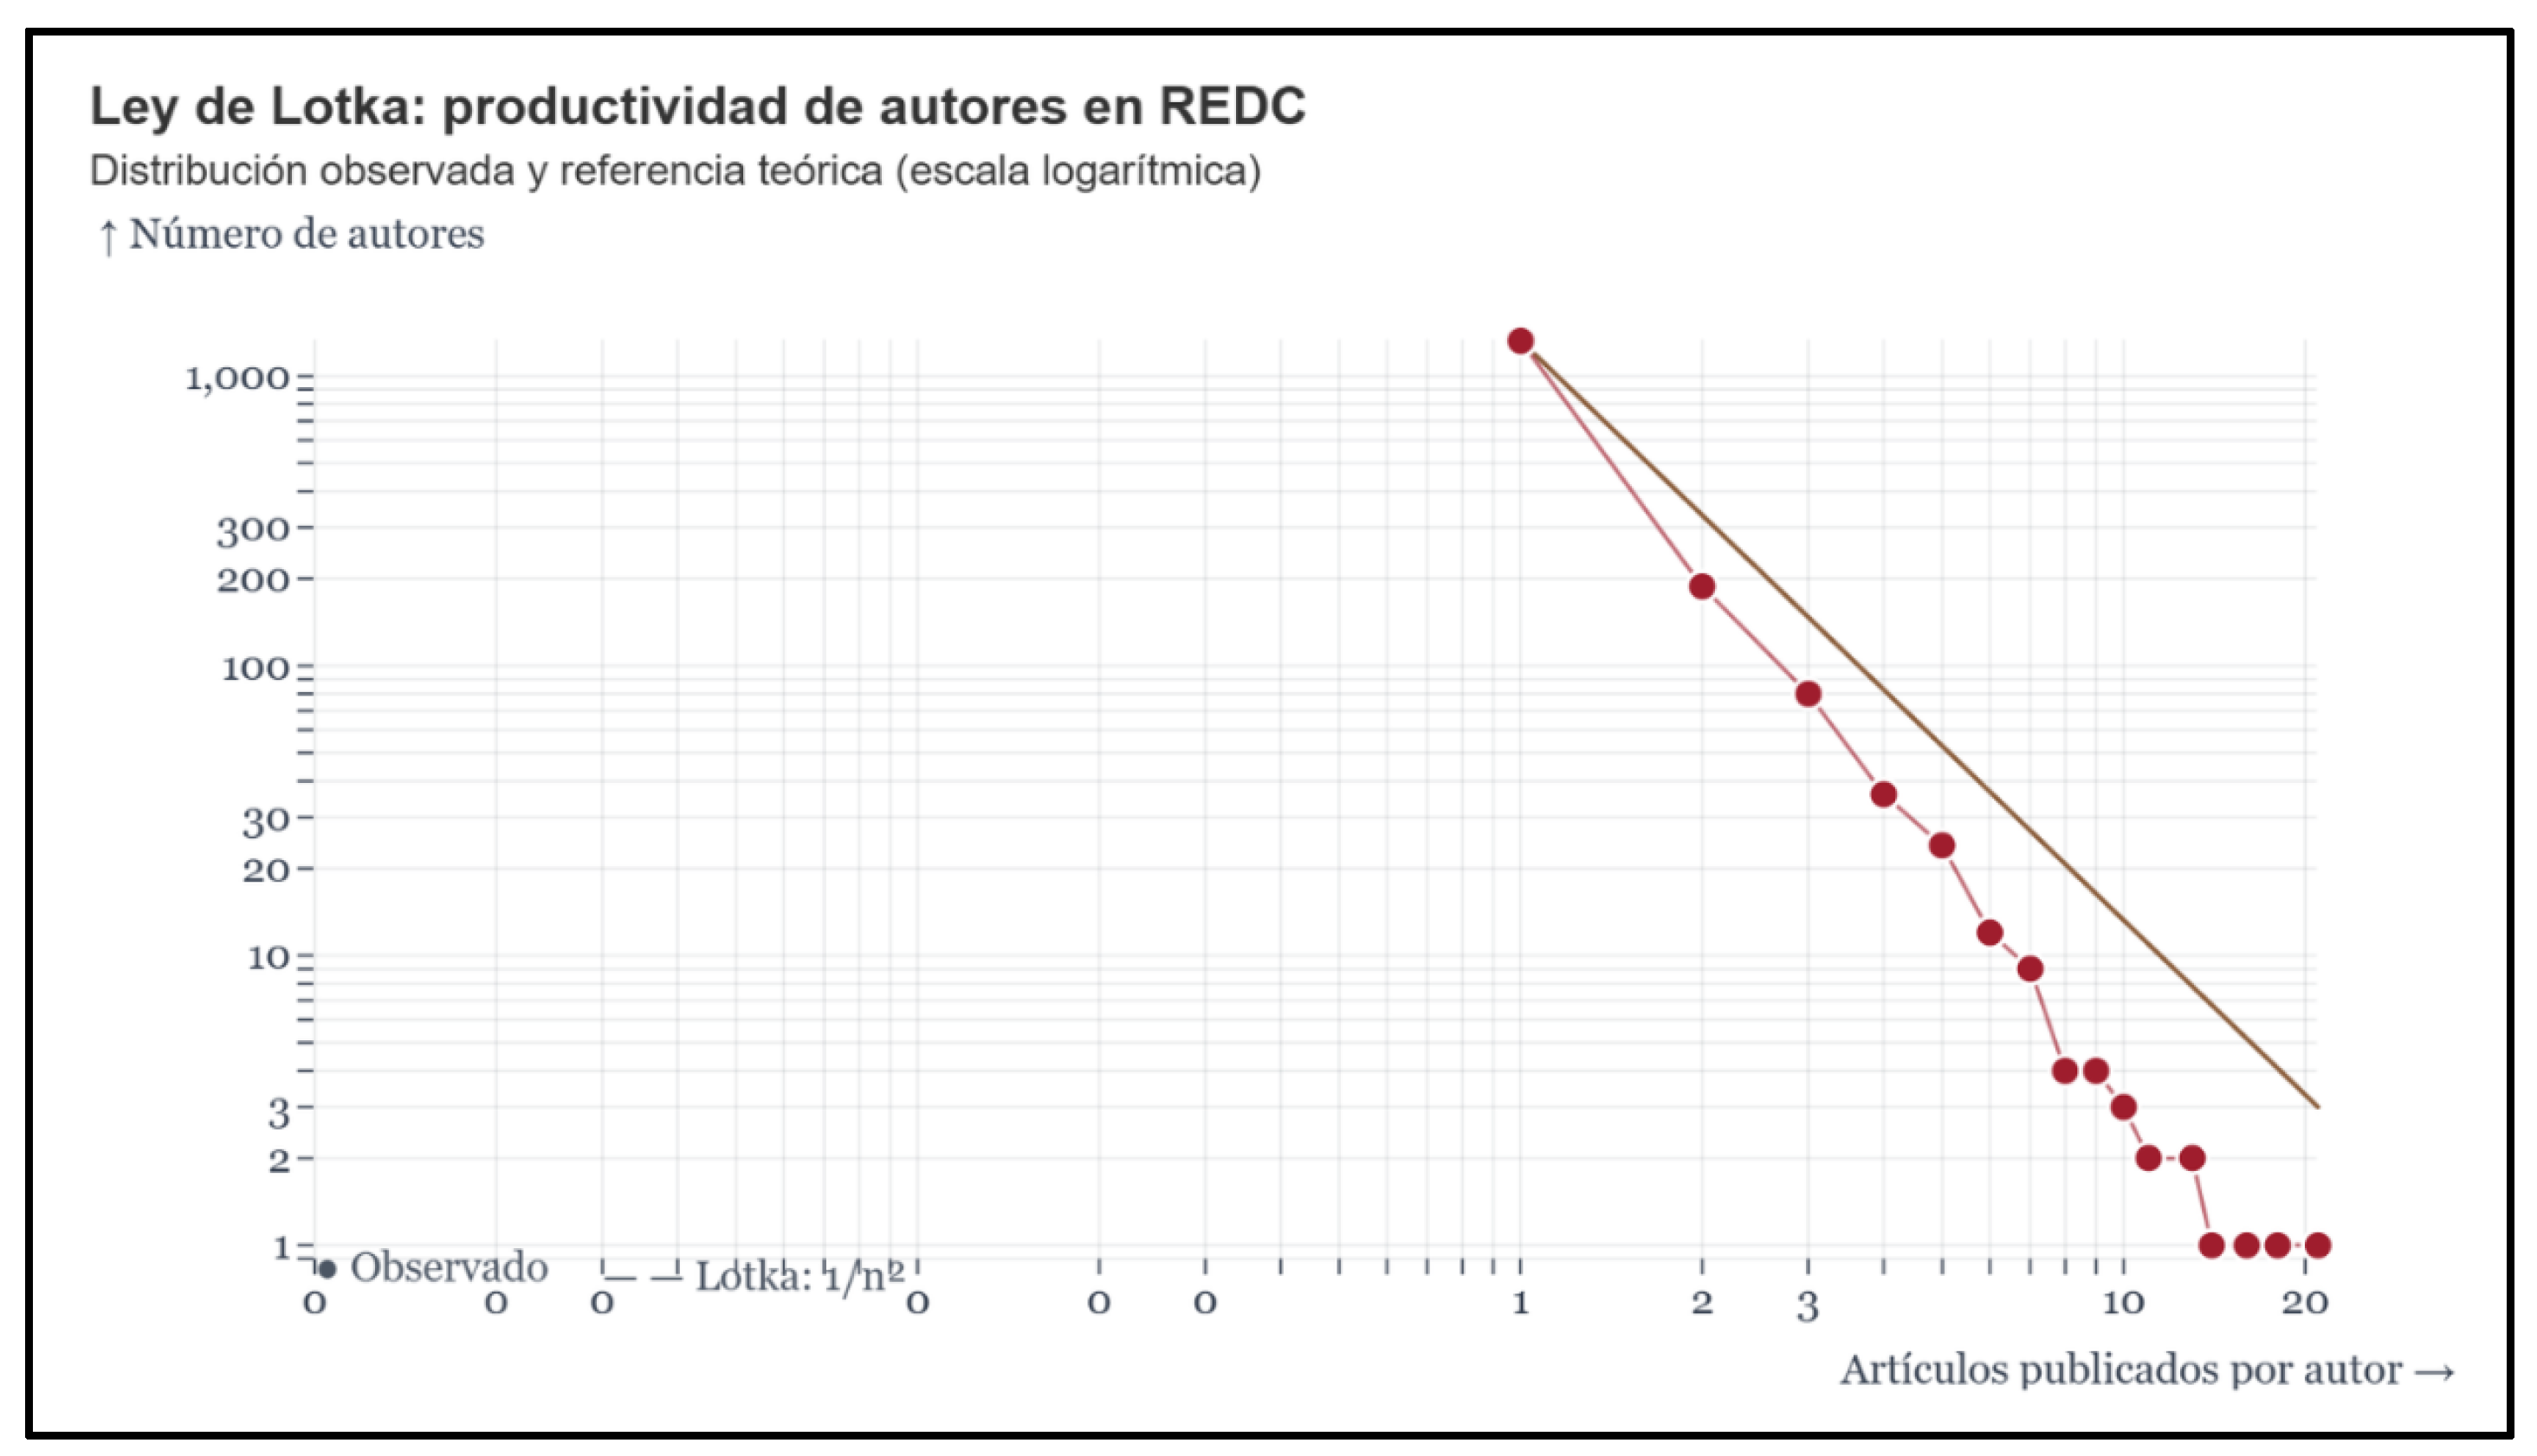
Each author is identified by their persistent OpenAlex identifier, and the notebook counts the number of the journal’s works in which they participate. Let n be the number of works published by an author; the observed distribution is
Aobs(n) = |{a:works(a) = n}|.
The theoretical reference is based on Lotka’s Law (Lotka, 1926) [16]:
where A(1) is the observed number of authors with exactly one publication in the journal. In this project, A(1) is not estimated by regression, and the exponent 2 is not fit to the data; the chart is a pedagogical comparison between the observed distribution Aobs(n) and the reference prediction ALotka(n), not a proof that the journal’s data follows a Lotka distribution [16].
Figure 6.
Author Productivity vs. Lotka’s Law Benchmark (Log-Log Scale).
2.7. Citation Rate
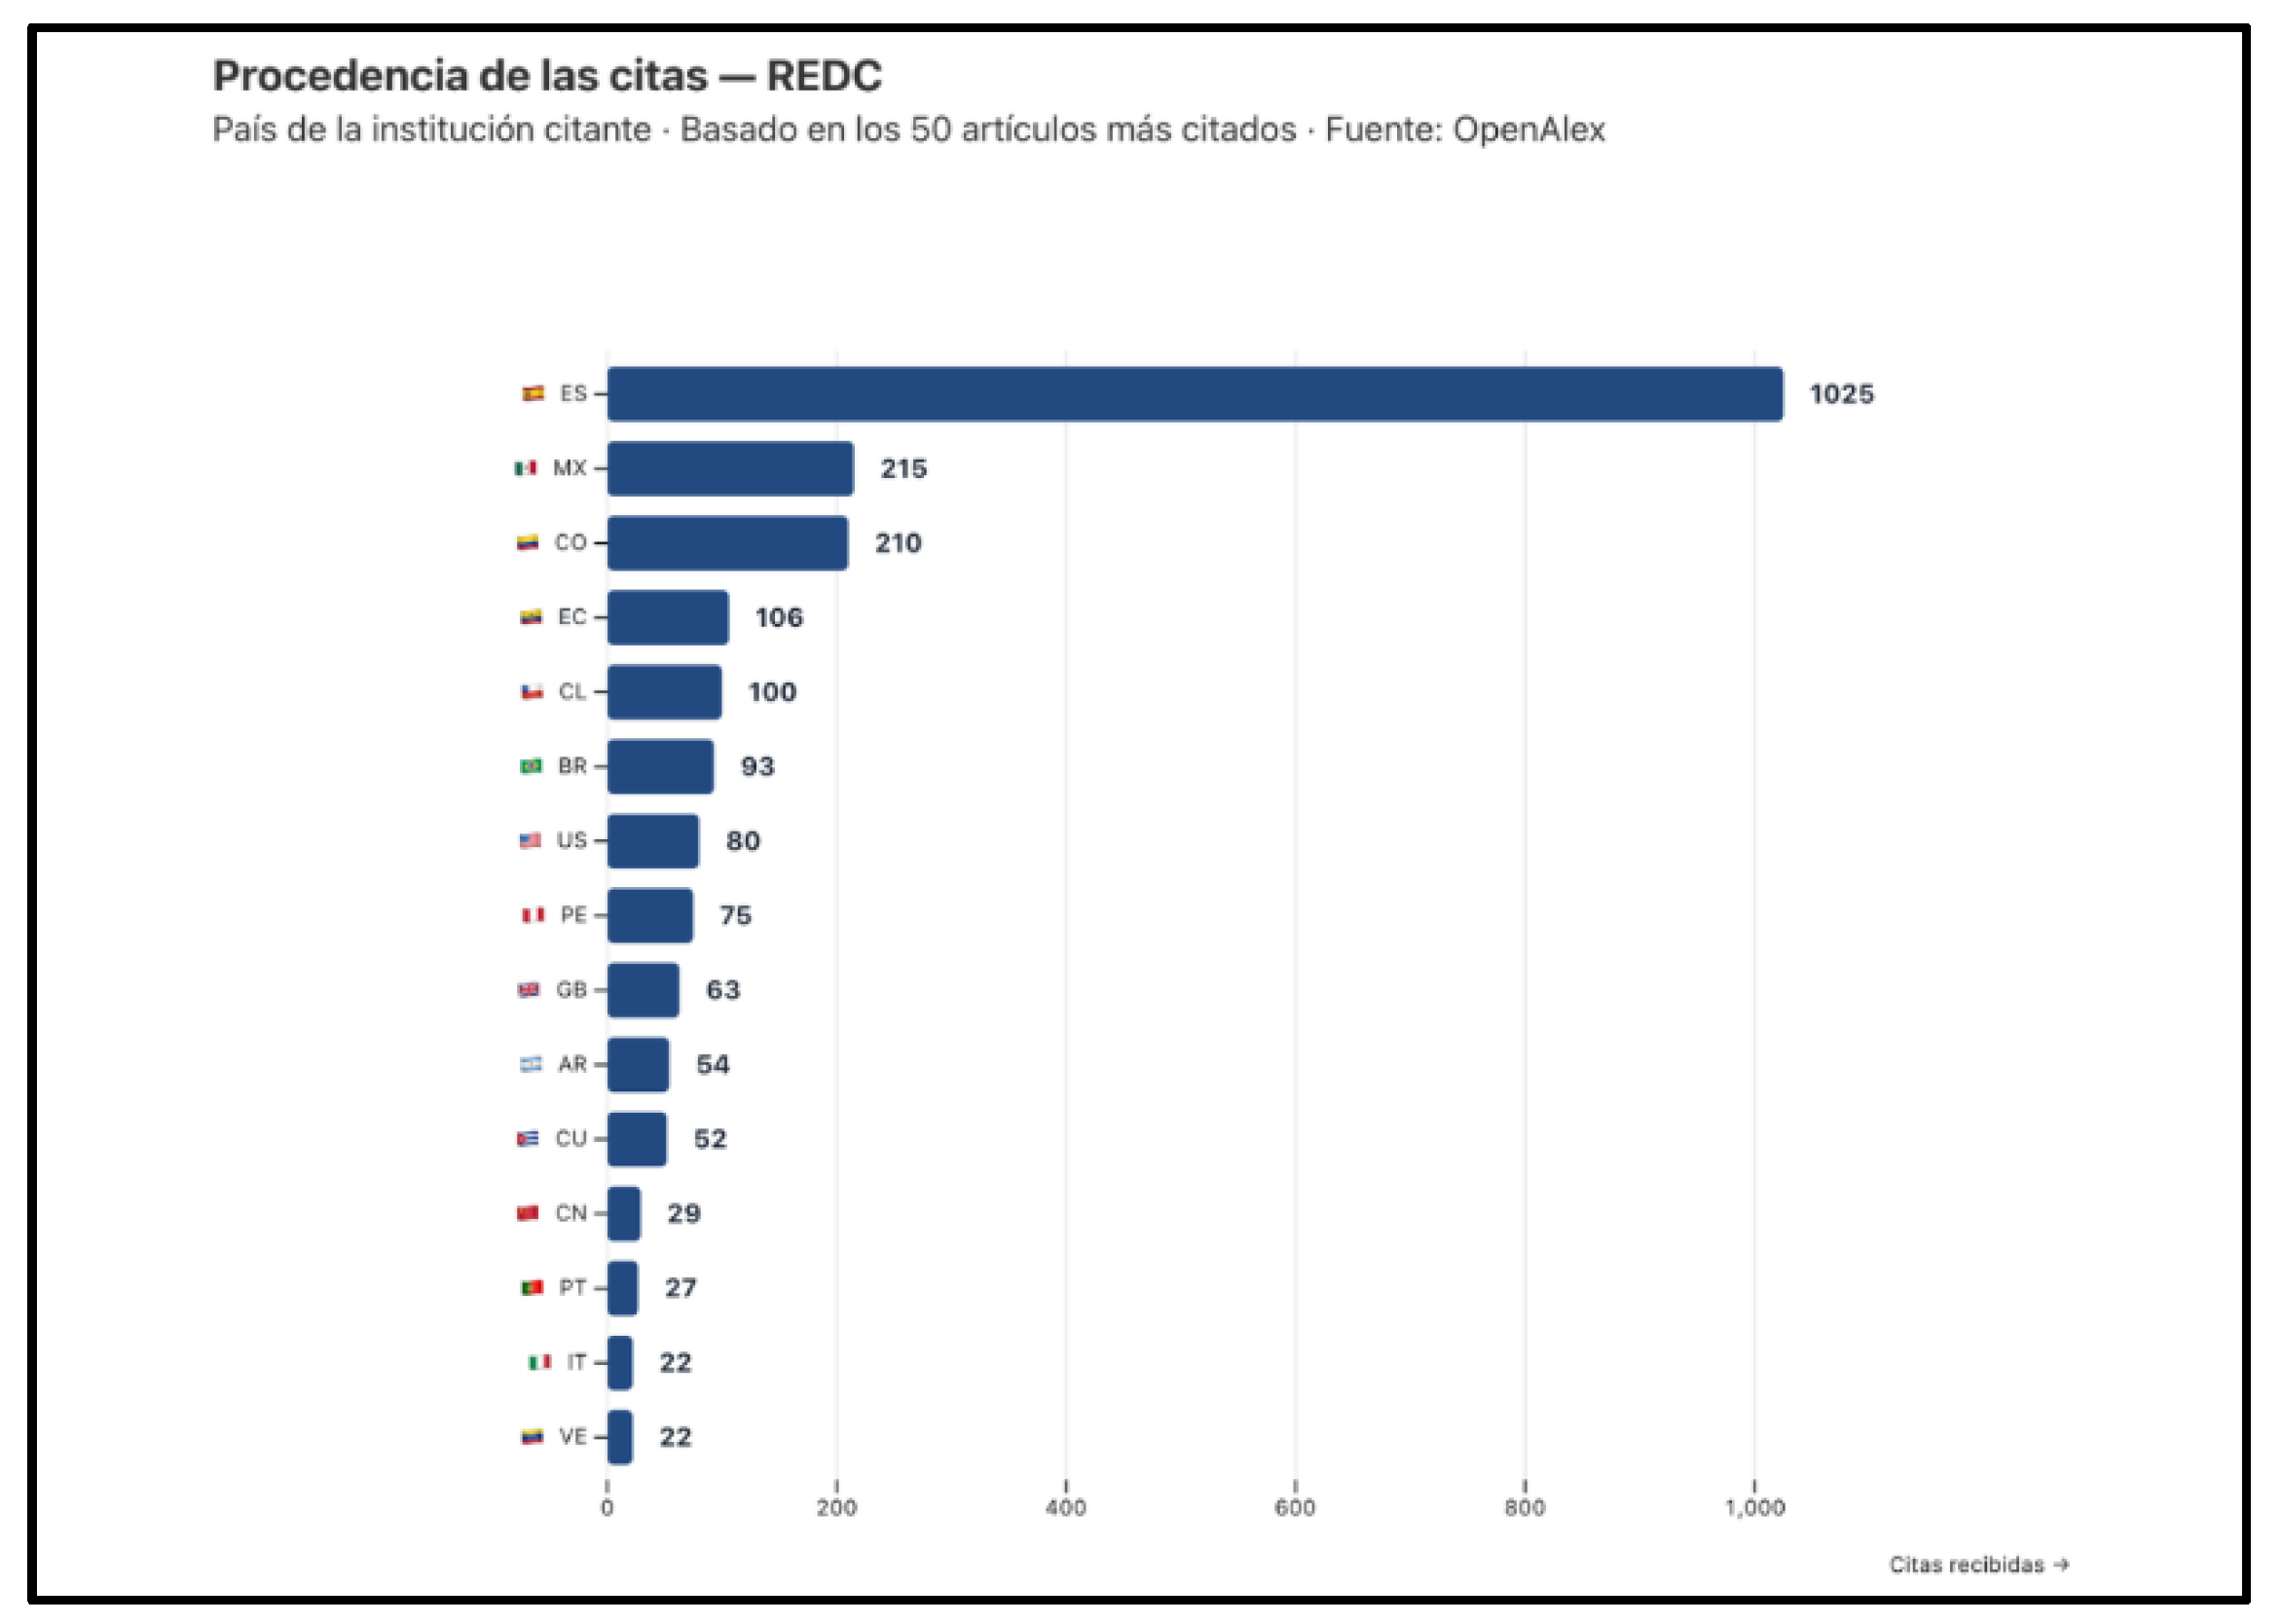
To estimate citation, the notebook selects the journal’s 50 most-cited works and, for each, retrieves every work that cites it, via a query equivalent to
filter = cites:OPENALEX_WORK_ID
A citing work is classified as a journal self-citation if its own primary source identifier matches the identifier of the journal under analysis. Let nself be the number of citations originating from the same journal, and next the number originating from other journals or sources:
If the denominator is zero, the rate is reported as unavailable. This is a rate computed over the subset of the journal’s 50 most-cited works, not its entire corpus; the indicator should be read as an estimate of citation among the journal’s highest-impact works, not as a corpus-wide figure.
Figure 7.
Geographic Citation Provenance (Top 50 Cited Cohort).
2.8. Precomputed Indices
The h-index, i10-index, and two-year mean citedness are read directly from the summary_stats field of the OpenAlex Source record; the notebook does not recompute them from per-work citation counts. Formally,
where w is a work and cw its citation count, and, depending on the field used by the source,
with W2 the set of works considered within the two-year window. Presenting these as OpenAlex-maintained indicators reduces code complexity and facilitates auditing, but it means trusting OpenAlex’s own computation of these three indices rather than independently verifying them against the per-work citation counts already available in the downloaded corpus.
h = max{k ∈ N:#{w:cw ≥ k} ≥ k}, i10=#{w:cw ≥ 10},
2.9. Quality Control
Notebook Coding has been validated primarily through a case-study deployment on a live journal, the Revista Española de Documentación Científica (REDC) [17], together with a technical guide for embedding the panel in an OJS installation. The rate-limited, retrying request queue described above also provides a first line of defense against transient API failures, so that partial or malformed responses do not silently corrupt an indicator’s output; coverage indicators are explicitly marked “unavailable” rather than zero when OpenAlex returns no data for a given filter, which helps surface data-quality problems instead of masking them.
Operating system: None. The notebooks run entirely inside a modern web browser via the Observable Framework [13]; no local installation or specific operating system is required beyond a browser able to run current JavaScript (e.g., a recent release of Chrome, Firefox, Edge, or Safari).
Programming language: JavaScript (ES2020+), executed within the Observable 2.0 reactive runtime environment [13].
Additional system requirements: An active internet connection is required to query the OpenAlex REST API [11] and, where used, to load the Datawrapper embeds. No special hardware is required beyond what is needed to run a modern web browser.
Dependencies: OpenAlex REST API (https://api.openalex.org); the Observable Framework [13] runtime; Datawrapper, for the OJS-native usage-statistics charts (page views and downloads); an Open Journal Systems (OJS) installation, for embedding the panel via <iframe>.
3. Results
Table 2.
Cell Documentation - Notebook Coding.
| Data cell | Endpoint/Key parameter | Base filter | Calculation | chart cell(s) that use(s) it |
| sourceData | GET/sources/{id} | – | Complete source log (summary_stats, counts_by_year) | Annual series (indirect) and _26 (h-index/i10-index/average citation count) |
| serieAnual | (derivada de sourceData) | – | Production and citations by year, year >= 2016 | _7 (Plot: Annual Production) and _8 (Plot: Citations per Year) |
| allWorks | GET/works + cursor | primary_location.source.id:{id} | Complete, paginated corpus | Feeds: Top Citations, Top Cited Works, and Productivity Authors (not plotted directly) |
| topCitados | (derivada de allWorks) | – | Top 10 by cited_by_count | _11 (Plot: Top 10 Most Cited Articles) |
| sdgData | GET/works?group_by=sustainable_development_goals.id |
primary_location.source.id:{id} |
Number of articles by ODS | chartODS (handmade D3 heatmap, official color palette and icons for the 17 SDGs) |
| doiData | GET/works?group_by=has_doi |
primary_location.source.id:{id} |
% with/without DOI |
_16 (Plot: DOI coverage) |
| orcidData | GET/works?group_by=has_orcid |
primary_location.source.id:{id} |
% with/without ORCID |
_18 (Plot: ORCID coverage) |
| oaData | GET/works?group_by=open_access.oa_status | primary_location.source.id:{id} | Gold/Green/Hybrid/Bronze/Closed Distribution |
_20 (Plot: open access status) |
| obrasCitadasTop | (derivada de allWorks) | – | Top 50 by Citation | Feeds into citacionesInfo (not displayed directly) |
| citacionesInfo | GET/works?filter=cites:{workId} x50 | cites:{id} | Citation + country of the citing institution | _23 (Plot: source of citations) and _26 (% self-citation card) |
| productividadAutores | (derivada de allWorks) | – | Number of Authors by Number of Articles | chartLotka (Log-log plot: observed vs. Lotka’s law) |
| authorData | GET/works?group_by=authorships.author.id |
primary_location.source.id:/{id} |
Top Authors by Number of Publications |
chartAuthors (bubble pack D3) |
| countryData | GET/works?group_by=authorships.countries |
primary_location.source.id:/{id} |
Breakdown by Country of Membership | chartCountries (bubble pack D3) |
| data (instituciones) | GET/works?group_by=authorships.institutions.lineage | primary_location.source.id:/{id} | Institutional Consolidation | chartInstitutions (bubble pack D3) |
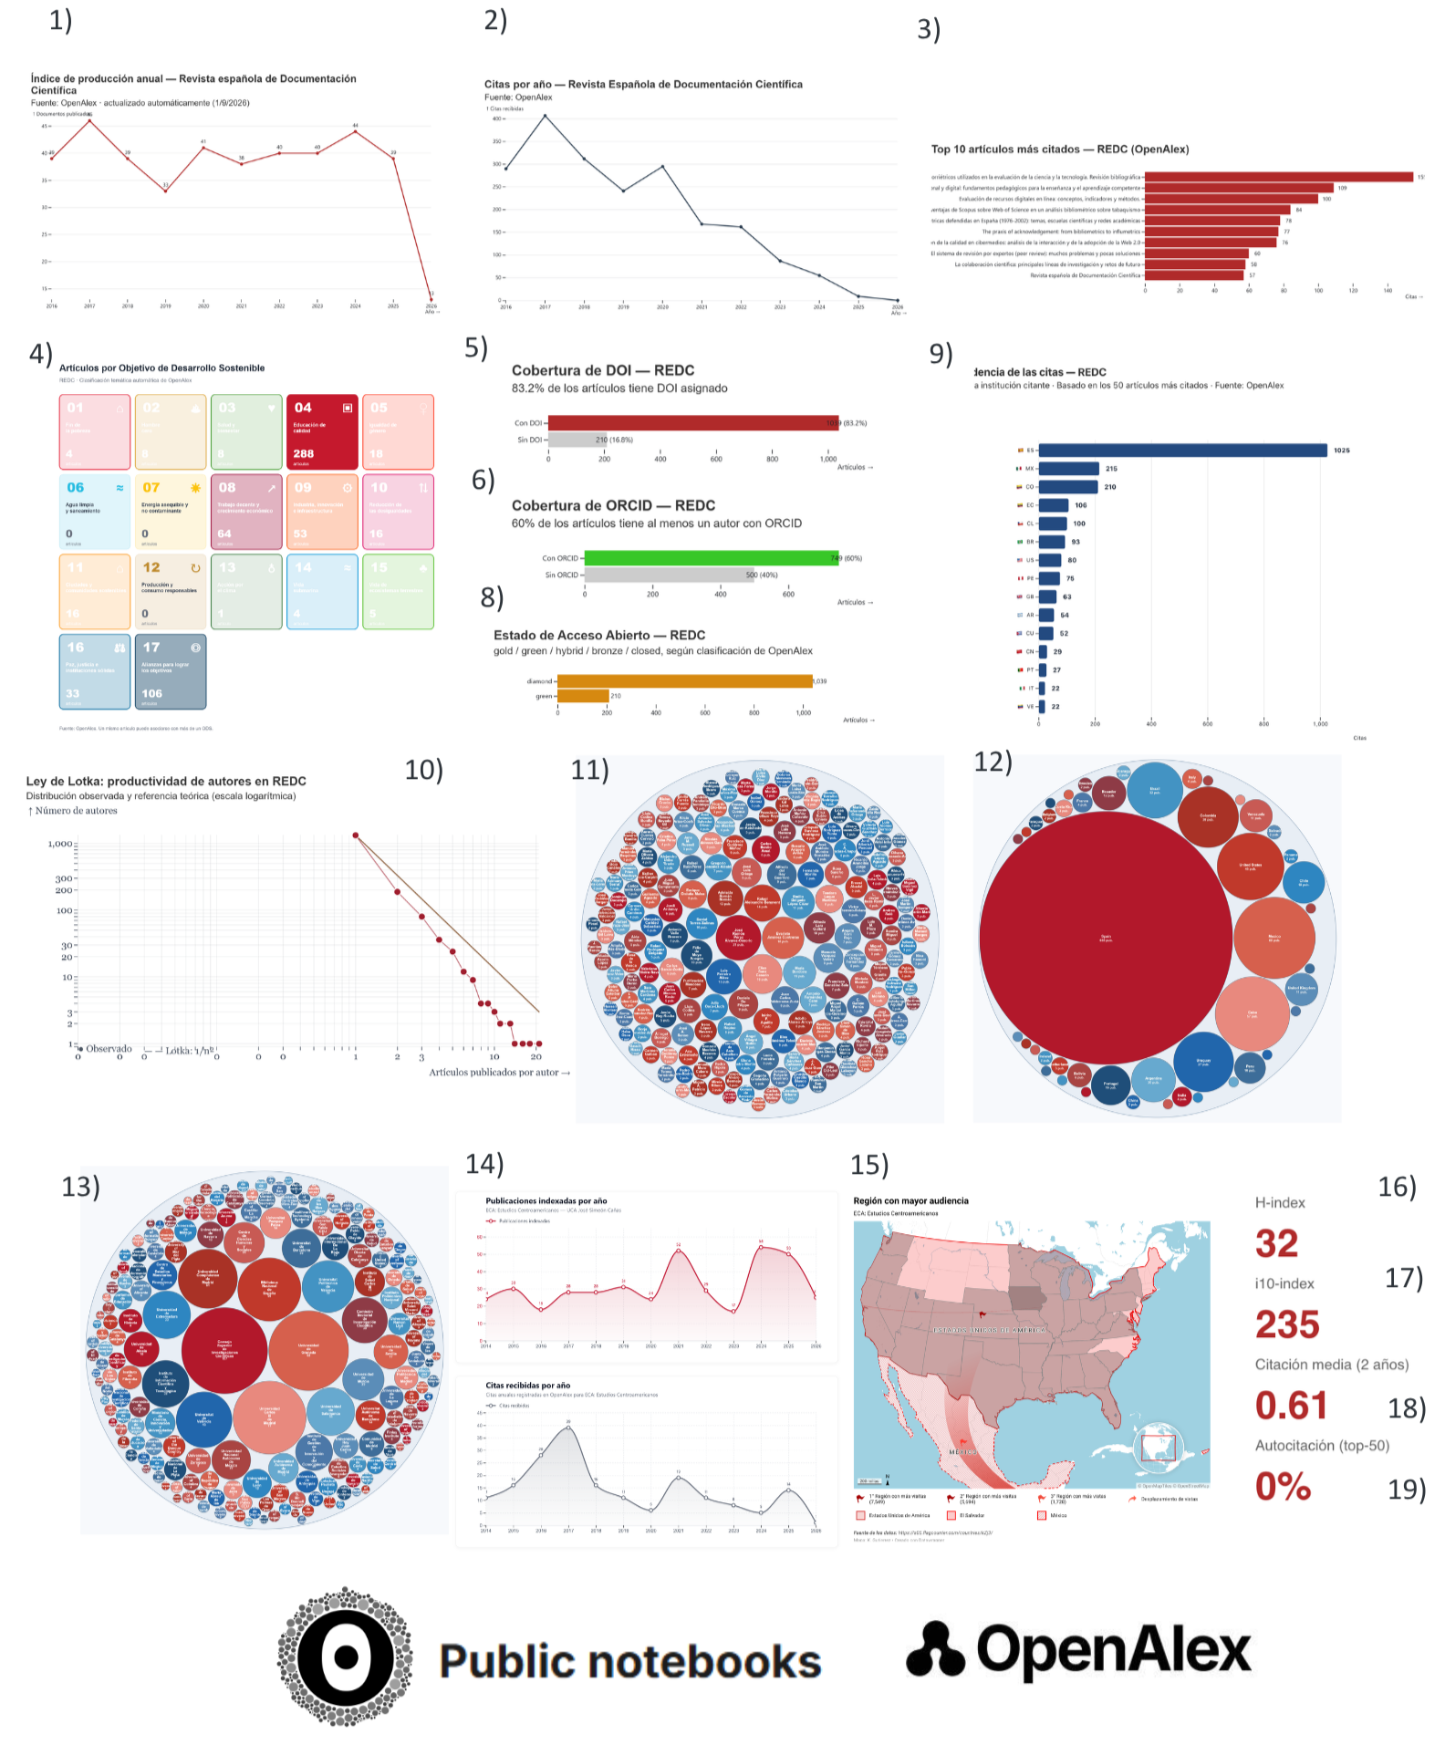
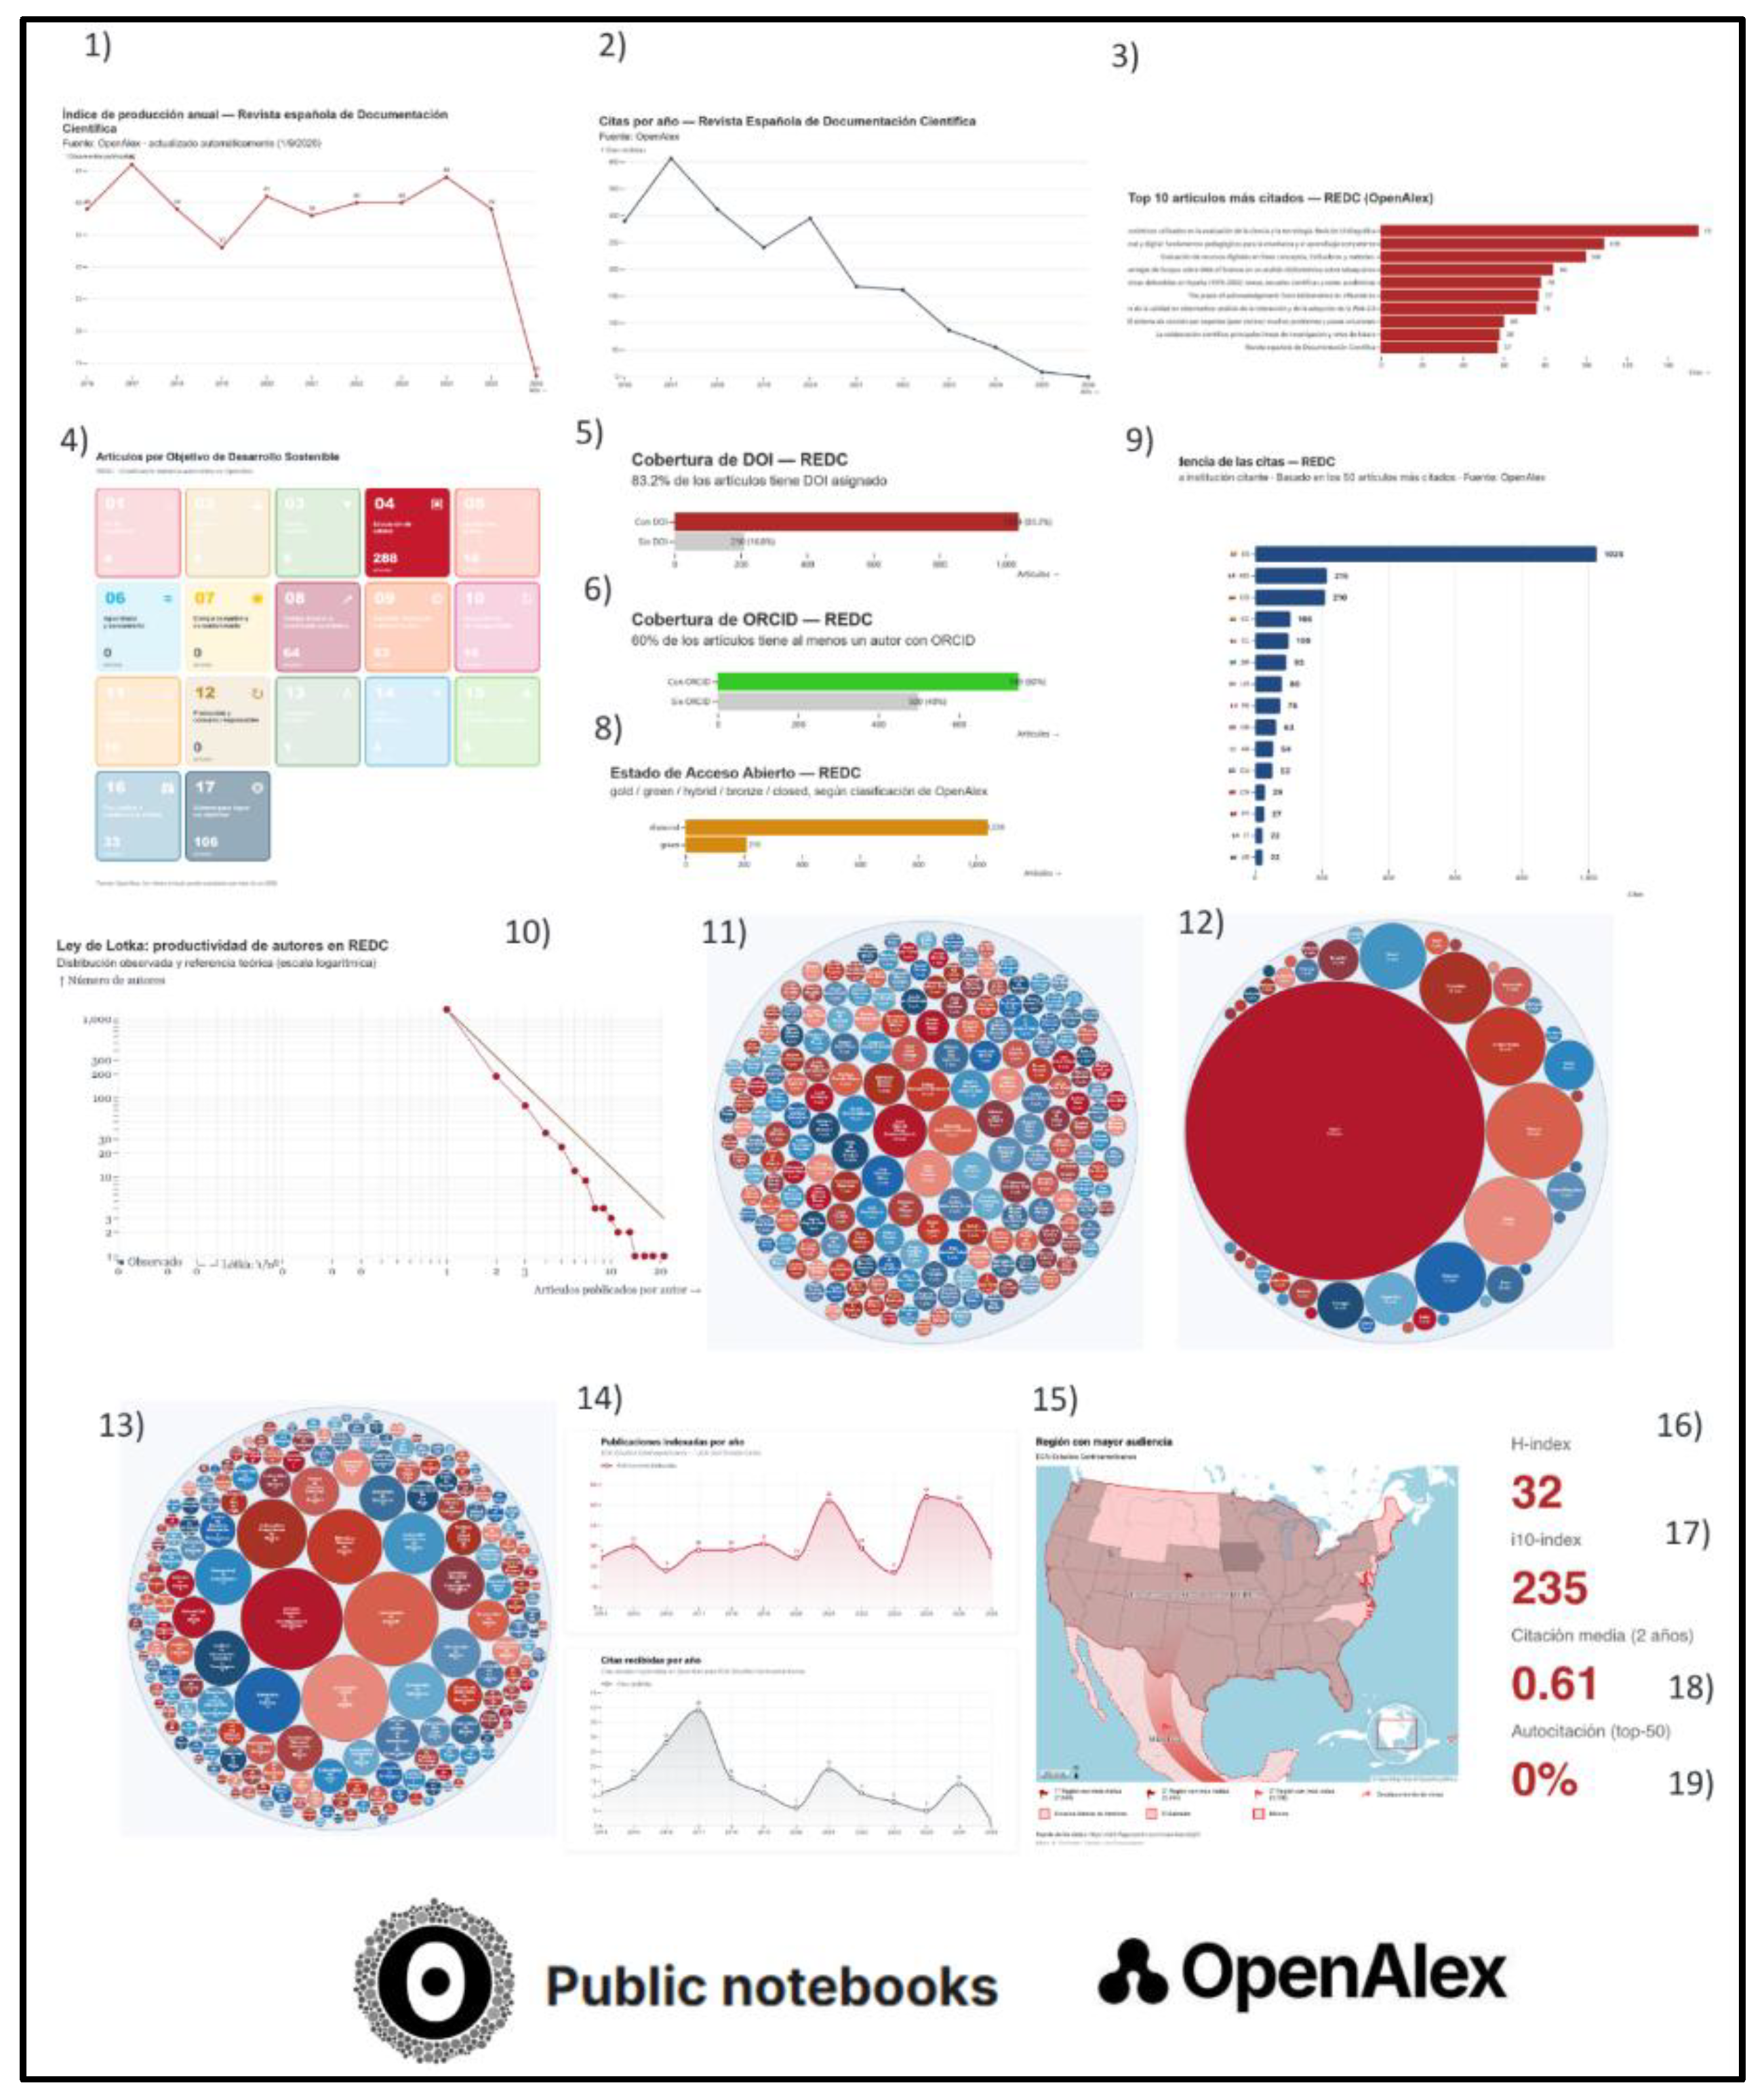
*The table summarizes the computational processing flow and the reactive modular architecture built using Observable. Fourteen primary data cells were structured to connect to the endpoints of the OpenAlex REST API using three query patterns (concurrency queue, cursor pagination, and server-side aggregation via `group_by`). Based on these data cells, computational visualization components (chart cells) were developed using three main technologies: (1) Observable Plot for production/citation time series, bar charts showing metadata coverage (DOI, ORCID), open access (OA) distribution, article rankings, and log-log plots of the Lotka model; (2) D3.js for advanced custom visualizations, including a heatmap for the Sustainable Development Goals (SDGs) and clustered bubble charts (bubble packs) for the density of authors, countries, and institutions; and (3) Synthetic indicator sheets for the h-index, i10-index, average citations, and citation percentage metrics. This separation between calculation cells and chart cells ensures the reusability and independence of each bibliometric indicator.
Figure 8.
Indicators.
3.1. Software Location
Reusing the panel for another journal requires changing three main parameters: (1) the journal’s OpenAlex source identifier; (2) a contact email address; and (3) an OpenAlex API key, where applicable, plus inserting the resulting <iframe> into an OJS code-editor window. A minimal example configuration is:
const config = {
sourceId: “s6910135”,
journalName: “Revista Espanola de Documentacion Cientifica”,
startYear: 2010,
endYear: 2026,
mailto: “institutional-email@example.org”
};
Because OpenAlex is continuously updated, two runs on different dates may produce different results. Reproducibility therefore depends on documenting, for every run, at least the following
- source_id
- query_date
- filter
- mailto
- api_version, if available
- code_version
Because each notebook cell is self-contained, descriptively named, and organized according to its data dependencies, individual indicators can be reused in isolation for example, as standalone classroom exercises in library- and information-science courses without requiring students to understand the full workflow from the start. Editors, librarians, and journal-management teams, particularly at OJS-hosted journals in Latin America and the Caribbean or elsewhere without institutional access to Scopus, the Scimago Journal Rank, or Web of Science, can fork the repository and adapt it to their own OpenAlex source identifier following the technical guide included with the REDC [17] case study.
Table 3.
Software location.
| Product | Details | Persistent identifier: |
| Archive | Name: Figshare Licence: MIT License Publisher: Figshare Version published: v1.0. Date published: 09/2026 |
https://doi.org/10.6084/m9.figshare.33107114 [18] |
| Code repository | Name: GitHub - Notebook-coding-bibliometric Licence: MIT License Date published: 09/2026 |
https://github.com/Kahernandezg/Notebook-coding-bibliometric [19] |
|
Code Notebook Observablehq |
Name: Notebook Coding: cuadernos de indicadores biblométricos para revistas en OJS-OpenAlex [24] Version published: v486 Licence: MIT License Date published: 08/2026 |
https://old.observablehq.com/@kahernandezg/notebook-coding-cuadernos-de-indicadores-biblometr |
| Methodology | Name: Notebook Coding - Bibliometría OJS con OpenAlex Version published: 1.2v Licence: MIT License Date published: 10/2026 |
https://notebook-coding-bibliometr-a-ojs-con-openalex.ai.studio |
*English/Spanish (documentation, code comments, and interface). The case study concerns a Spanish-language journal, the Revista Española de Documentación Científica [17], but the software itself is not language-dependent: it is a reusable template for any journal indexed in OpenAlex, regardless of the journal’s own publication language.
4. Limitations
- OpenAlex does not necessarily represent all content published by a journal, and coverage can vary depending on the recognition of DOIs, authors, affiliations, and sources.
- Author identifiers may be incomplete or duplicated.
- The top-citation rate is computed over the 50 most-cited works, not the entire corpus.
- The Lotka’s Law chart uses the classical exponent 2 without estimating it by regression.
- The summary indices (h-index, i10-index, two-year mean citedness) are read from summary_stats and are not independently recomputed.
- Results can change as OpenAlex updates its records, so two runs on different dates may not agree exactly.
- OJS usage statistics and OpenAlex’s bibliometric indicators measure different phenomena and should not be interpreted as equivalent.
5. Conclusions
Let’s start with the following question:
What is the difference between the Jupyter notebooks from OpenAlex Tutorials and the notebooks from Observable?
While community notebooks and tutorials provided by OpenAlex [25] demonstrate basic data retrieval and API pagination in environments like Jupyter [26], these examples are fundamentally oriented toward offline data processing and developer training. They do not address the challenge of public visualization, web interactivity, or integration with editorial management platforms. Notebook Coding bridges this gap by shifting the focus from data extraction to a client-side publication layer. By leveraging Observable’s reactive JavaScript runtime, each indicator functions as an autonomous, live-querying component that can be seamlessly embedded into Open Journal Systems (OJS) via responsive iframes without intermediate server infrastructure or advanced programming knowledge on the part of editorial teams.
Just as Electronic Laboratory Notebooks Schubotz et al. [20] demonstrated the value of interactive environments for data traceability, and computational training workflows Troupin et al. [21] highlighted their utility for teaching complex domain-specific analysis, Notebook Coding shows that reactive notebooks can shift from private analytical tools into a primary medium for scientific communication. By embedding live OpenAlex queries into OJS, this approach automates real-time editorial transparency while providing an open, forkable framework that streamlines hands-on bibliometric education and ensures computational reproducibility across research workflows.
Supplementary Materials
The following supporting information can be downloaded at the website of this paper posted on Preprints.org. 1). Hernández Gutiérrez, K. A. [@kahernandezg]. (2026). Notebook Coding: cuadernos de indicadores biblométricos para revistas en OJS-OpenAlex (Versión v486) [Cuaderno de código interactivo]. Observable. https://old.observablehq.com/@kahernandezg/notebook-coding-cuadernos-de-indicadores-biblometr. 2). Hernández Gutiérrez, K. A. (2026, octubre). Notebook Coding - Bibliometría OJS con OpenAlex (Versión 1.2v) [Entorno metodológico interactivo]. AI Studio. https://notebook-coding-bibliometr-a-ojs-con-openalex.ai.studio
Funding
This research received no external funding.
Institutional Review Board Statement
Not applicable.
Informed Consent Statement
Not applicable.
Data Availability Statement
1). Gutierrez, Kevin (2026). Notebook Coding: cuadernos de indicadores bibliométricos para revistas en OJS-OpenAlex. figshare. Software. https://doi.org/10.6084/m9.figshare.33107114.v3. 2). Hernández Gutiérrez, K. A. [Kahernandezg]. (2026). Notebook-coding-bibliometric [Repositorio de código fuente]. GitHub. https://github.com/Kahernandezg/Notebook-coding-bibliometric
Acknowledgments
We thank the OpenAlex, Observable, Datawrapper, and Open Journal Systems communities.
Conflicts of Interest
Declare conflicts of interest or state “The authors declare no conflicts of interest.” Authors must identify and declare any personal circumstances or interests that may be perceived as inappropriately influencing the representation or interpretation of reported research results. Any role of the funders in the design of the study; in the collection, analyses or interpretation of data; in the writing of the manuscript; or in the decision to publish the results must be declared in this section. If there is no role, please state “The funders had no role in the design of the study; in the collection, analyses, or interpretation of data; in the writing of the manuscript; or in the decision to publish the results”.
Abbreviations
The following abbreviations are used in this manuscript:
| OJS | Open Journal Systems |
| LIS | Library and Information Science |
| SDG/SDGs | Sustainable Development Goals |
| FIFO | First In, First Out |
| CMS | Content Management System |
| COUNTER | Counting Online Usage of Networked Electronic Resources |
| OA | Open Access |
| REDC | Revista Española de Documentación Científica |
References
- Public Knowledge Project. Open Journal Systems (OJS); PKP: Vancouver, BC, 2026; Available online: https://pkp.sfu.ca/software/ojs/.
- Willinsky, J. Open Journal Systems: An example of open source software for journal management and publishing. Libr. Hi Tech 2005, 23(4), 504–519. [Google Scholar] [CrossRef]
- COUNTER. Introduction to COUNTER Reports: Release 5.1. 2024. Available online: https://www.countermetrics.org/wp-content/uploads/2024/04/SPANISH-Reports-guide.pdf.
- Macêdo, D.J.; Schiessl, I.T.; Shintaku, M. El uso de OpenAlex en los estudios de métricas bibliométricas. Biblios J. Librariansh. Inf. Sci. 2025, (esp), e015. [Google Scholar] [CrossRef]
- van Eck, N.J.; Waltman, L. Software survey: VOSviewer, a computer program for bibliometric mapping. Scientometrics 2010, 84(2), 523–538. [Google Scholar] [CrossRef]
- Aria, M.; Cuccurullo, C. bibliometrix: An R-tool for comprehensive science mapping analysis. J. Inf. 2017, 11(4), 959–975. [Google Scholar] [CrossRef]
- Aria, M.; Cuccurullo, C.; D’Aniello, L.; Spano, M. Biblioshiny and the SAAS Workflow: An integrated framework for transparent and reproducible science mapping. J. Inf. 2026. [Google Scholar] [CrossRef]
- Harzing, A.W. Publish or Perish. 2007. Available online: https://harzing.com/resources/publish-or-perish.
- Repiso Caballero, R.; Cabezas Clavijo, Á. Contra la bibliometría ‘rápida y sucia’: aspectos para valorar la complejidad en los análisis bibliométricos. Rev. Panam. De Comun. 2025, 7(1). [Google Scholar] [CrossRef]
- Priem, J.; Piwowar, H.; Orr, R. OpenAlex: A fully-open index of scholarly works, authors, venues, institutions, and concepts. arXiv 2022, arXiv:2205.01833. [Google Scholar] [CrossRef]
- OpenAlex. API reference. 2026. Available online: https://help.openalex.org/api/.
- Knuth, D.E. Literate programming. Comput. J. 1984, 27(2), 97–111. [Google Scholar] [CrossRef]
- Observable, Inc., “Observable Framework,” Observable documentation, 2026. Available online: https://observablehq.github.io/framework/.
- Datawrapper GmbH. Datawrapper. 2024. Available online: https://www.datawrapper.de.
- OpenAlex. Get groups of entities. 2026. Available online: https://docs.openalex.org/how-to-use-the-api/get-groups-of-entities.
- Lotka, A.J. The frequency distribution of scientific productivity. J. Wash. Acad. Sci. 1926, 16(12), 317–323. [Google Scholar]
- Consejo Superior de Investigaciones Científicas. Revista Española de Documentación Científica; CSIC: Madrid, 1977; Available online: https://redc.revistas.csic.es/.
- Hernández Gutiérrez, K.A. Notebook Coding. figshare 2026. [Google Scholar] [CrossRef]
- Hernández Gutiérrez, K.A. Notebook Coding [GitHub repository]. 2026. Available online: https://github.com/Kahernandezg/Notebook-coding-bibliometric.
- Schubotz, S.; Schubotz, M.; Auernhammer, G.K. Electronic Laboratory Notebook: An Adaptable Solution. J. Open Res. Softw. 2025, 13(1), 11. [Google Scholar] [CrossRef]
- Troupin, G.; et al. DIVAnd training: producing ocean climatologies with Jupyter notebooks. J. Open Source Educ. 2026, 9(99), 278. [Google Scholar] [CrossRef]
- DOI Foundation. DOI Handbook. Available from.
- ORCID. ORCID e identificadores persistentes. Available online: https://info.orcid.org/es/documentation/integration-guide/orcid-and-persistent-identifiers/.
- Hernández Gutiérrez, K.A. Notebook Coding: cuadernos de indicadores biblométricos para revistas en OJS-OpenAlex. 2026. Available online: https://old.observablehq.com/@kahernandezg/notebook-coding-cuadernos-de-indicadores-biblometr.
- OurResearch. Turn the page [Internet]. OpenAlex. 2026. Available online: https://help.openalex.org/api/paging/#jupyter-notebook.
- OurResearch. Paging: OpenAlex API tutorials [Internet]. GitHub. 2026. Available online: https://github.com/ourresearch/openalex-api-tutorials/blob/main/notebooks/getting-started/paging.ipynb.
Disclaimer/Publisher’s Note: The statements, opinions and data contained in all publications are solely those of the individual author(s) and contributor(s) and not of MDPI and/or the editor(s). MDPI and/or the editor(s) disclaim responsibility for any injury to people or property resulting from any ideas, methods, instructions or products referred to in the content. |
© 2026 by the authors. Licensee MDPI, Basel, Switzerland. This article is an open access article distributed under the terms and conditions of the Creative Commons Attribution (CC BY) license (http://creativecommons.org/licenses/by/4.0/).
Copyright: This open access article is published under a Creative Commons CC BY 4.0 license, which permit the free download, distribution, and reuse, provided that the author and preprint are cited in any reuse.